This week’s market report provides information on:

LOCALLY
The price of wheat in the CPT Constanța parity continues to fluctuate. 330 EUR/MT is the purchase indication expressed by the buyers. Furthermore, the price difference which marks the two qualities, milling and feed, is 20 EUR/MT, i.e., a level of 310 EUR/MT for feed wheat.
Romanian wheat is undervalued these days and the reasons for this are as follows:
- The port of Constanța is very crowded and the primary motivation of exporters is to deliver their goods, in this case to honor their contracts.
- The destinations have certainties regarding the coverage in the next period and do not offer large volumes in Constanța.
- The indications expressed on the basis of intentions are set at the indicative level of 418 USD/MT in FOB Constanța, but even so, converting 330 EUR into USD, we reach a level of 380 EUR/MT in FOB. If we extract the costs with the fobbing and the exporter’s margin, we find a level of 365 EUR/MT in the CPT parity.
- Taking into account the price indications for the second half of April, which are set at a level of 400-405 USD/MT, we have an indication of 363 EUR/MT. From this, we decrease the costs as above and find a level of 350 EUR/MT CPT Constanța.
- As we can see, the differences are big, maybe even too big, compared to the current purchase offers, of 330 EUR/MT (between 20-35 EUR/MT).
Apparently, however, farmers do not want to sell at these levels. They know that the price of setting up a hectare of wheat is 1,200 EUR, and the 2022 crop is not very promising at the moment.
The price of the new crop is 300 EUR/MT under the CPT Constanta parity, with a negative difference of 10 EUR (in some cases 5 EUR) for feed wheat.
The Romanian wheat crop has received precipitation these days. These are beneficial and will prove their effect in the days to come. We dare to estimate these days that, due to rainfall, we will be able to reach 9 million tons nationwide, which is not far from the multiannual average of 9.6 million tons. However, we have areas where pedological drought is installed and we mention here the counties of Vrancea, Vaslui, as well as areas of Bacău and Galați. In fact, passing through these areas, you can clearly see the effects of the drought on the winter wheat crop.
REGIONALLY
In the Black Sea basin, things are a little different. First of all, in Ukraine, we notice the declining potential, referring to the wheat crop, due to the delays in autumn. Then the sowing plan was not fully realized. And now, in the spring, the maintenance of the winter crops will be greatly influenced by the lack of materials, as well as by the Russian invasion which shows no signs of slowing down. The war has turned into one of attrition, and this leads to the consumption of resources and the full involvement of the inhabitants of the exposed areas. Moreover, reports indicate that Russian soldiers are systematically destroying, with a hard-to-understand savagery, agricultural machinery, and whole herds of cows are actually being killed with weapons of mass destruction. The intention to starve Ukraine is clear, I would say.
Most Ukrainian farmers try to sell their production in Romania, through intermediaries or directly, by posting ads on specialized Romanian sites. The queues of trucks from the Sculeni and Leușeni customs are the testimony of these moments. And this is just one of the hotspots these days.
And we have, in the light of the above, a new answer regarding the motivation of the low prices offered in the Port of Constanța. In addition to the above, the flow of goods from Ukraine also contributes to lower wheat prices. It is true that this pipeline for draining Ukrainian wheat in Romania is not very large in terms of volumes, but it has a share in the self-sufficiency of buyers of 2021 wheat crop.
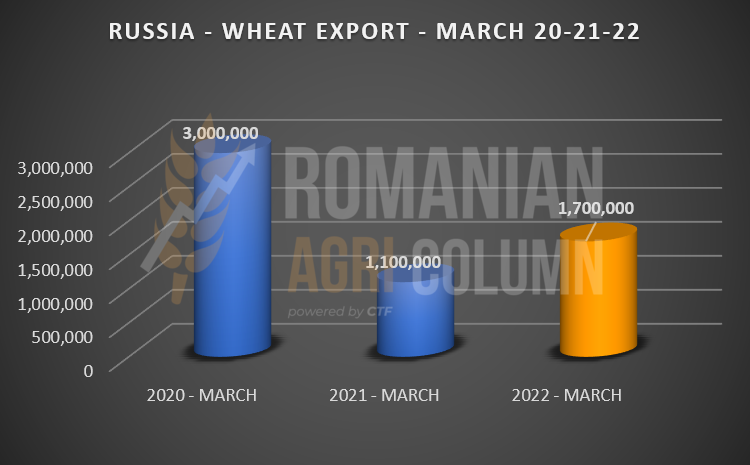
Russia, on the other hand, is thriving in terms of wheat sales. The month just ended enshrines higher sales (exports-deliveries) than in March 2021.
The main beneficiaries of this accelerated export rate are Turkey, Egypt, Iran, Libya. These are exactly the destinations with which Russia agreed to forms of cooperation long before the outbreak of war. If we all remember, in December 2021, Russia announced the creation of a Join-Venture company to supply wheat through private imports into Egypt (not through GASC).
Now we have the guarantee of the scenario that we evoked at the beginning of the war, namely:
- Russia will generate exports to the Middle East, Egypt, Iran (via the Caspian Sea), Libya, Syria.
- Russia will also penetrate the North African market – Algeria, Morocco and Tunisia.
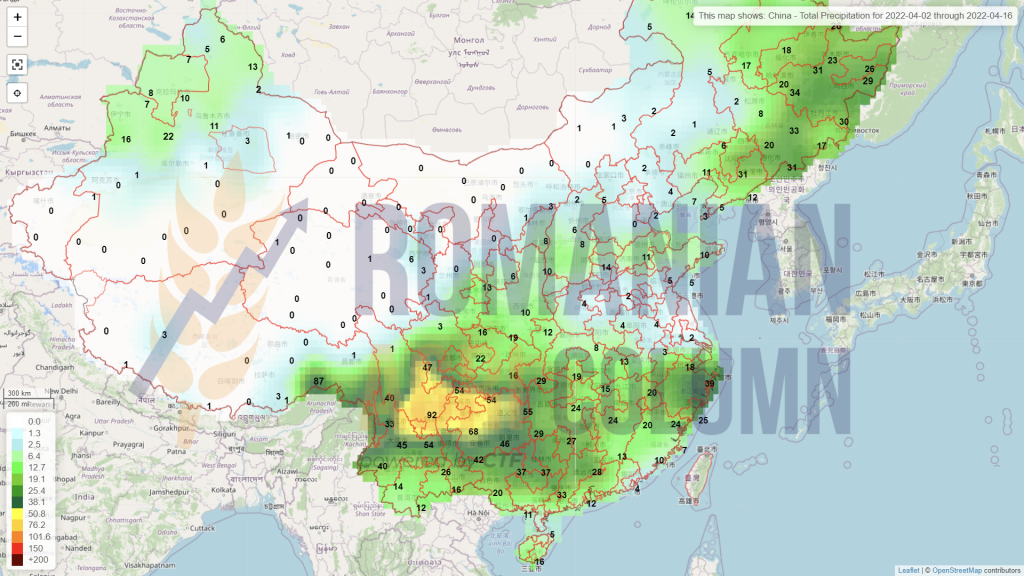
- Russia will export to China, its partner with whom it signed a pre-war co-operation agreement. We remind you that China will have the most disastrous wheat production in the last 20 years. Out of 137 million tons, the forecast will generate only 110 million tons of production. We are talking about a minus of 27 million tons, to which we add the 10-12 million tons of annual import. We are approaching 40 million tons. In this context, we must not forget that 50% of the global wheat reserve is owned by China. According to the latest WASDE report, this 50% means 140.75 million tons of wheat.
- Russia also has a cooperation and trade agreement with India, it will also export to the poor countries of Southeast Asia, Bangladesh and Pakistan, and we are inclined to believe that it will also supply Afghanistan with wheat.
Of course, Russia will not cope with all these volumes. Annually, Russia, in the conditions of a crop of 82 million tons, has the capacity to export 37-38 million tons. And the demand from these destinations cannot be met, but they will be guaranteed a volume of goods.
To understand the context, the Middle East, North Africa and sub-Saharan Africa are going through the effects of a severe drought and will generate 38% more demand. Turning this demand into figures results in an additional minimum of 18 million tons. And only if we add up China’s surplus with the additional demand from the three regions mentioned, we reach a level of 45 million tons, a figure that exceeds the Russian export power. And again we have the confirmation of the scenario. Russia controls Kazakhstan, Belarus, and if it controls Ukraine, it will decide who eats and who does not. According to the latest statements from Russia, they made it clear that only “friendly” countries will receive wheat.
In order to get the numbers right, Kazakhstan produces over 14 million tons of wheat in a normal climate year, Belarus does not matter much, as their production is only 2.8 million tons in a good year. However, if we add Ukraine to the list of 30-32 million tons, we come to understand the magnitude of Russian power, which will be strengthened. Russia will control exports of about 70 million tons, bringing together Ukraine and Kazakhstan. The global trade report indicates about 200-205 million tons and Russia’s share here will be about 30%. This is at the moment, because there will be productivity increases in Russia and Kazakhstan, which will generate more ratio in the global trade complex, with a Russian market share of 40%.
It is very large and, in addition to being able to unbalance world trade, it will decide and engage in a system of alliances the countries that will receive wheat from it (trade and military alliances, alike). We must not ignore this spectrum, because it becomes real overnight.
This scenario is a real one, with Russia controlling the global wheat trade. The power poles are actually changing. Russia will decide who eats and who does not. Let’s not forget the possible movements of migration to Europe from countries where bread is subsidized. There are countries in the Middle East and Africa. We will see widespread movements of mass migration, social unrest due to the famine that will engulf these areas, as well as large areas of Southeast Asia.
Why do we describe all these things? In order to deliver a coherent and correct analysis of what will follow in the season that we will start soon, namely, a very close harvest volume of wheat. Here we have an equation with many unknowns and the first unknown is Ukraine.
How much wheat will it produce? How much will it be able to export and where? In any case, we must accept that Ukraine goes out of the predictable circuit in any scenario, for several reasons:
- The export potential from the remaining 2021-2022 season is still captive in the country, without too many chances to sell. Let’s not forget that the presence of farmers in the fields is terribly hampered by the war effort, the actions of the Russian army, as well as the need for a national food safety.
- In the event of success and the expulsion of Russian troops, Ukraine must rebuild its transport and export infrastructure, and this will take at least 3-5 years. Even so, foreign capital will no longer be easily invested in an uncertain and unpredictable place.
- In the scenario in which Russia takes over Ukraine, the latter disappears completely from the commercial radar. Everything will be done through the Russian account, to whom the Russians will want.
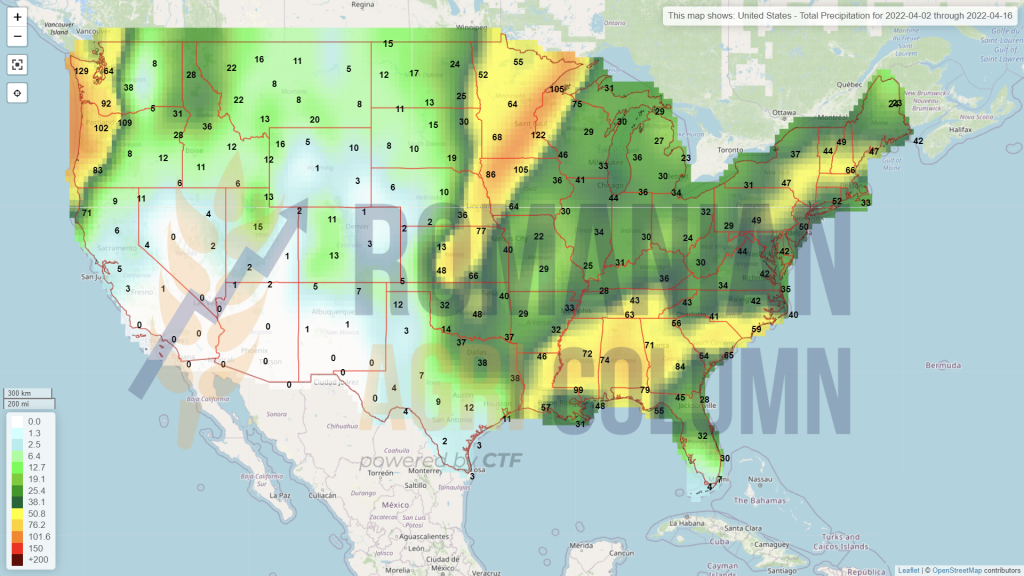
The next unknown is American wheat production, which appears to be severely affected in the South-Central Plains due to persistent drought and the dust storms of December 2021. It rained well recently, it is true, but we all know that a rain of a few days cannot cover underdevelopment and problems caused by weather over a period of 5 months.
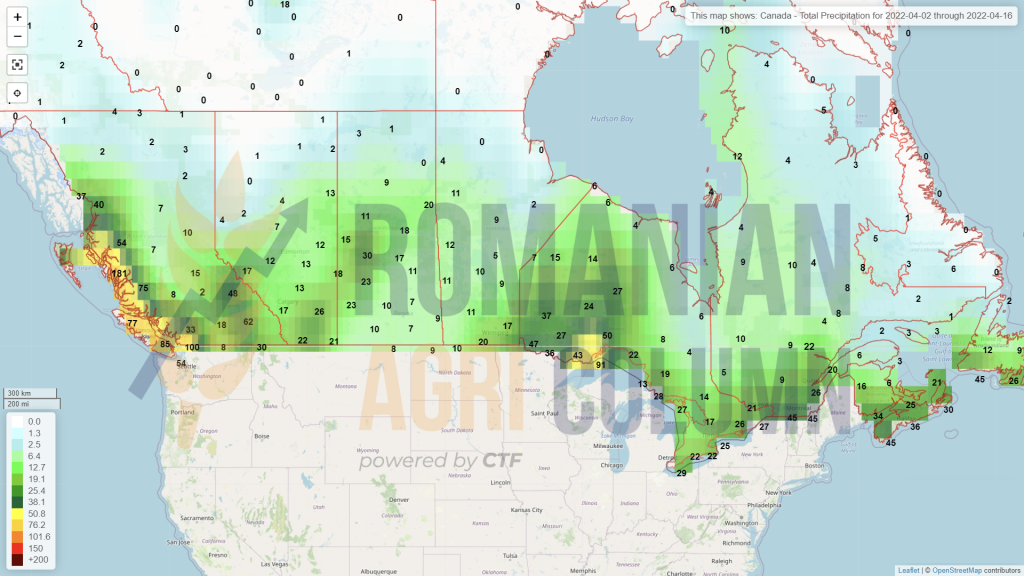
Three other unknowns are Canada, Argentina and Australia. However, indications about them will come later in the case of Argentina and Australia. Canada will reveal much earlier, but forecasts indicate excessive heat between June and August 2022, as in the United States.
In other words, taking into account the cost of setting up a hectare of wheat in Romania, which reached 1,200 EUR, we appreciate a sustained price level that will begin to increase after August 2022. Today, the crop inverse is quite high, but the price of the new crop will be maintained and even increased.
EURONEXT plays by the political factor. Earlier last week, when news broke that Ukraine and Russia could generate an agreement, stock markets, through trading algorithms, dropped wheat prices sharply. The funds captured the margin and then naturally re-entered to regain their positions.
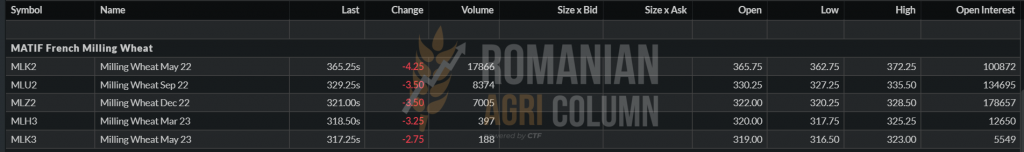
EURONEXT MLK22 MAY22 – 365.25 EUR (-4.25 EUR) at the close of April 1, 2022
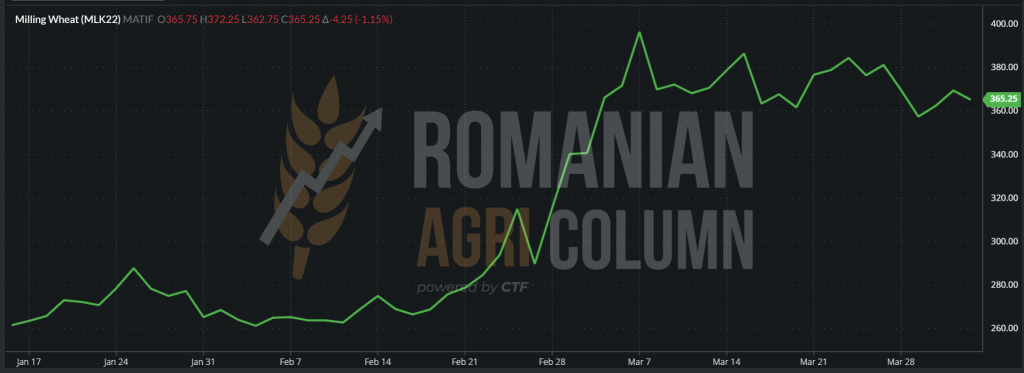
EURONEXT WHEAT TREND GRAPHIC – MLK22 MAY22
TENDERS
Pending official confirmation, OAIC Algeria has purchased 600,000 tons of wheat with two delivery periods, 1-15 June/16-30 June 2022. The price is 448 USD/MT CIF. Optional origins: Argentina, Australia, France and Romania.
GLOBALLY
The instructions we receive from the USA generate mixed feelings. In the south of the Central Plains, wheat has a 75% yield and poor overall condition in Texas. Going up north, the condition improves and we see an improvement in vegetative quality at this time. The rains watered the Central Plains, representing a real benefit for the central and northern area. But we all know that those crucial summer months for American wheat crop are waiting for us. Canada will follow the same scenario. The continuous observation of the weather factor and the impact assessment will determine the route of the volume and, implicitly, of the wheat crop prices.
NASS – NATIONAL AGRICULTURAL STATISTICS SERVICE
March 31, 2022 (WHEAT)
NASS issued the report of areas and stocks on 31 March 2022, corresponding to the date of March 1, 2022.
March 1, 2022: 2022-2023 SEASON, WINTER + SPRING = 47,351,000 ACRES = 19,170,525 HECTARES
March 1, 2021: 2021-2022 SEASON, WINTER + SPRING = 46,703,000 ACRES = 18,908,176 HECTARES
POSITIVE DIFFERENCE = 262,349 HECTARES
CONCLUSION: The area of American wheat increases by 262,349 hectares, calculating a provisional yield of 3.35 tons/ha. US wheat production will increase by 868,869 tons.
AGGREGATED STOCKS according to the calculation formula: on-farm stocks, off-farm stocks, extinction rate (human, feed or industrial consumption, including exports): March 1, 2022 VERSUS March 1, 2021 = MINUS 7,786,671 TONS
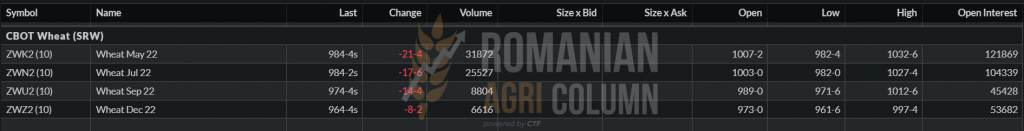
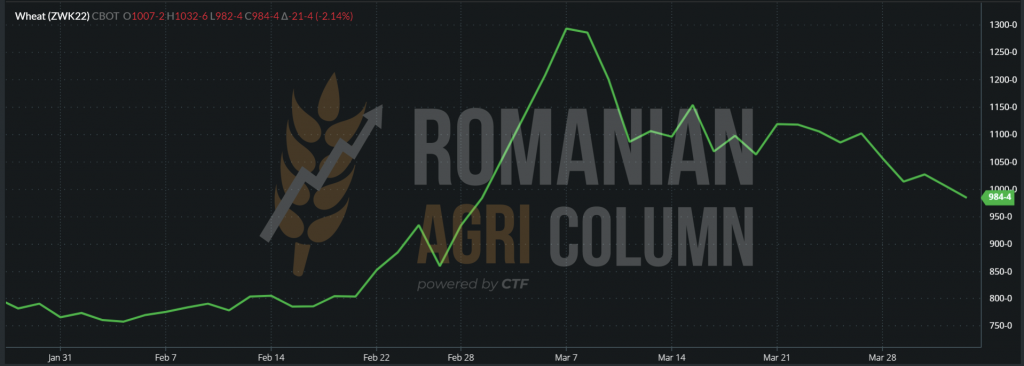
WHEAT – CBOT ZWK22 MAY22 984 c/bu (-21 c/bu)
CBOT WHEAT TREND GRAPHIC – ZWK22 MAY22
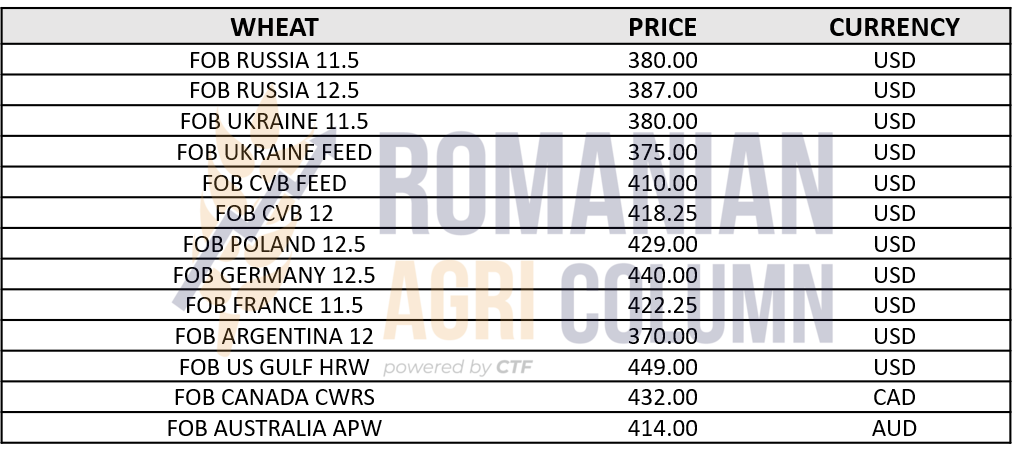
WHEAT PRICE INDICATIONS IN VARIOUS ORIGINS
ANALYSIS
- Wheat prices are falling as time goes on, despite the ongoing war.
- Russia has prepared its pre-conflict steps very well and thus has generated a much higher level of exports to carefully chosen and friendly destinations.
- We enter April, when we have religious holidays. It will be practically a month of contract execution, and May will be the month before harvest. Thus, with April 1, 2022 and until May 1, 2022, we enter Ramadan, and Christians will celebrate the Catholic and Orthodox Easter.
- We have no illusions. Wheat will be very tight, the price will fluctuate and what is seen today at the level of the new crop will go up because of the volumes, the demand, the weather and the political factor.
- In a few days, we have the WASDE report, a marker from which we do not expect very big changes. The life cycle of the 2021 wheat crop price is fast approaching its end.

The indications of the new barley crop are between 280-285 EUR/MT in the CPT Constanța parity. Notable things did not happen, except that Jordan bought 60,000 tons of new crop barley CFR Aqaba with delivery July 15-30, 2022, at a price of 395 USD/MT. Seller: Viterra.

LOCALLY
Corn has quotations of 315 EUR/MT in the CPT Constanța parity. The price level has been steadily declining, thanks to the political factor that generated the ebb and flow of the stock markets.
In the same sense, the congestion in the port of Constanța meant that the goods already purchased were the primary because of the need to execute already signed contracts. Much less attention has been paid to the purchase of new volumes for the simple reason that stocks exist in the country, and buyers are relaxed about the volumes available.
REGIONALLY
Farmers and companies in Ukraine are trying to pass through the Romanian space to the port of Constanța with goods. This is very difficult, despite the efforts of the authorities of the two countries, who want to ease the flow coming from Ukraine.
The fact that a volume wants to transit or be sold in Romania does not have a beneficial effect on the price. It effectively fuels self-sufficiency and thus the price is blocked, although the demand exists. High volume = lower price. It is logical, in fact, that the life cycle of the price of maize is still in demand.
The European stock market is posting a loss in the price of corn and is in line with the facts. The volume in Ukraine can no longer be extracted and thus the transactions are much smaller in volume.
The European Union has imports from overseas and transactions are coordinated with CBOT. The prices in the physical market generated for Constanța are thus granted with Euronext, where the buyers hedge the goods.
On the other hand, the new crop indication, XBX22 NOV22, did not lose much. It is natural, it is still quite far away and the waiting horizon is governed by clear data: no Ukrainian volumes, the weather in the European Union and the sowing process in full swing these days.
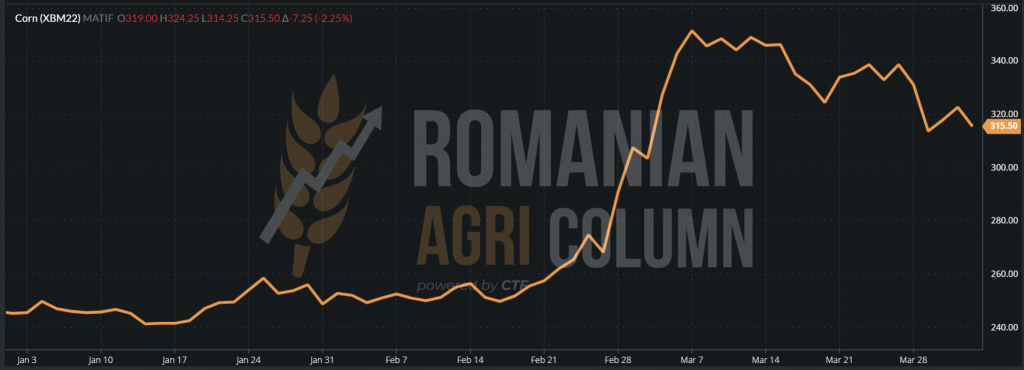
EURONEXT XBM22 JUN22 – 315.5 EUR (-7.25 EUR)
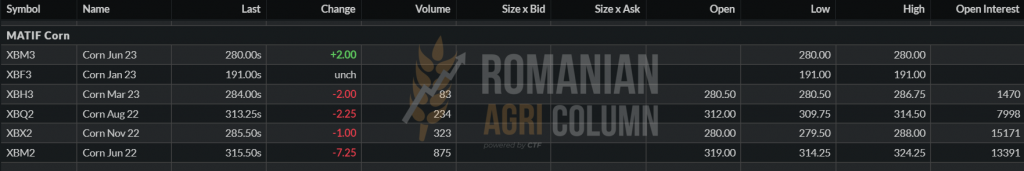
EURONEXT CORN TREND GRAPHIC – XBM22 JUN22
GLOBALLY
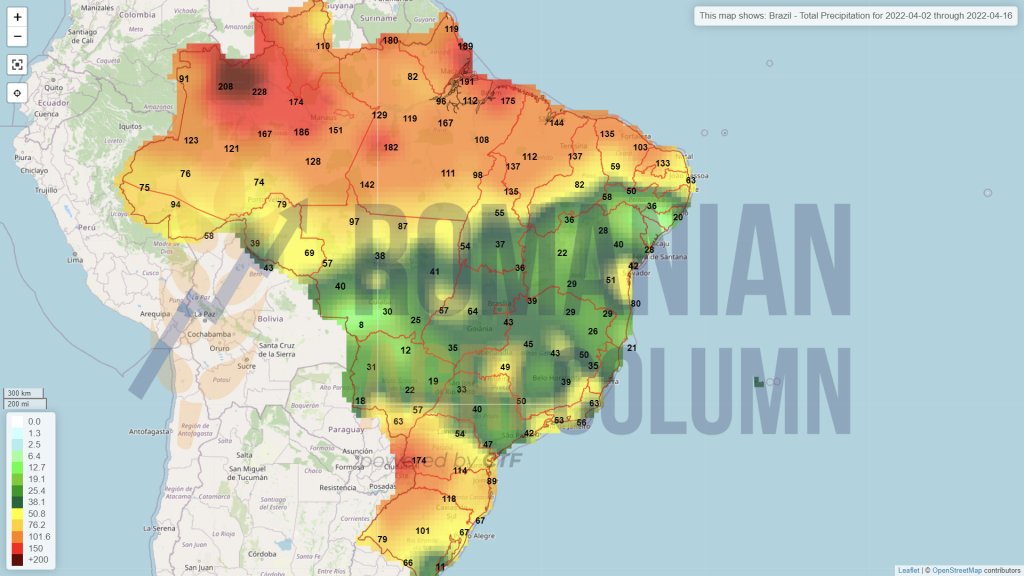
South America shows support in the price of corn. The Safrinha harvest in Brazil, although forecasting a vigorous volume, is delayed due to rainfall and vegetation. Only in mid-June 2022 will we be able to count on it physically.
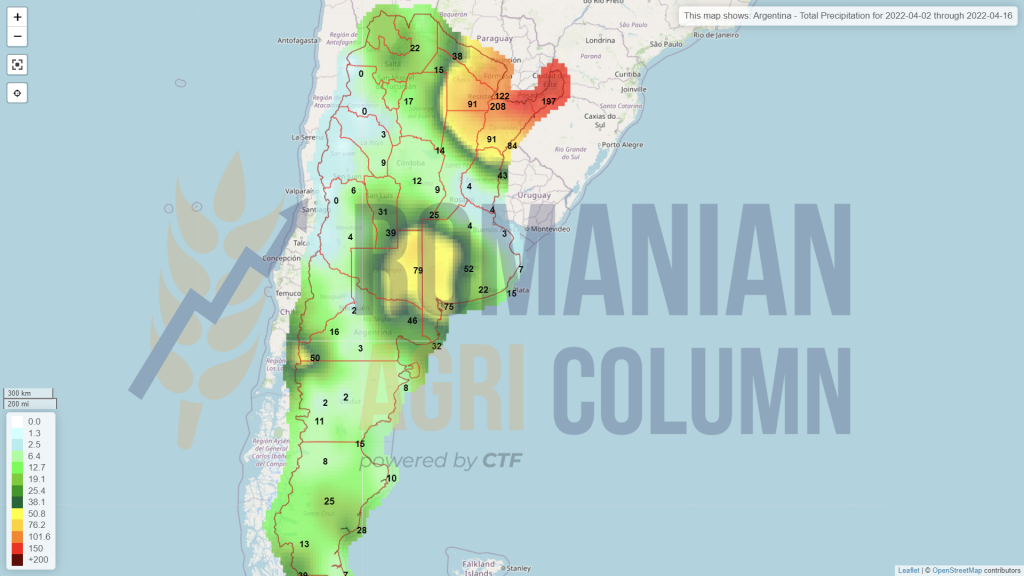
Moreover, Argentina is going through a period with very low night temperatures and this phenomenon called “early frost” will reduce the volume of maize production. Argentina is in the process of harvesting maize and is at a level of 15% harvested, with an internal indication of 49 million tons versus 53 million tons, according to the latest WASDE report. There is a big difference between the estimates, but the WASDE report is a few days away and we will have a much clearer picture soon.
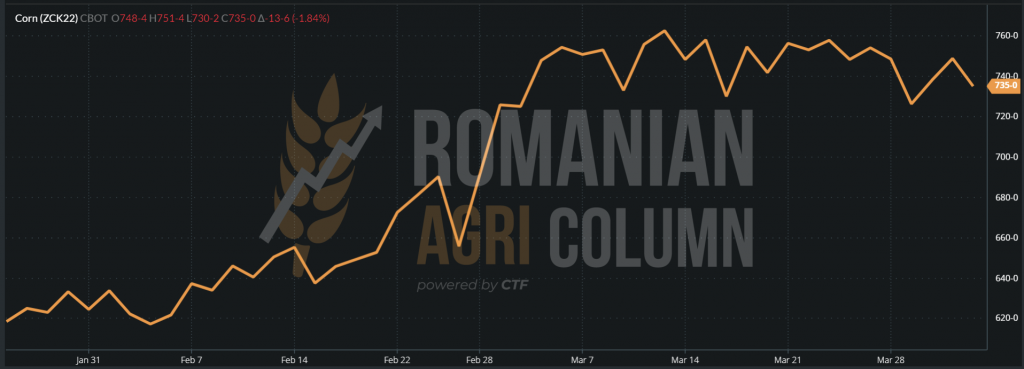
CBOT ZCK22 MAY22 – 735 c/bu (-13 c/bu)
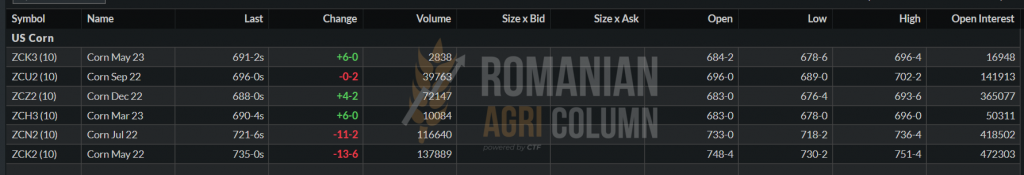
CBOT CORN TREND GRAPHIC – ZCK22 MAY22
NASS – NATIONAL AGRICULTURAL STATISTICS SERVICE
March 31, 2022 (CORN)
NASS issued the report of areas and stocks on March 31, 2022, corresponding to March 1, 2022.
March 1, 2022: SEASON 2022-2023 = 89,490,000 ACRES = 36,230,921 HECTARES
March 1, 2021: SEASON 2021-2022 = 93,357,000 ACRES = 37,796,515 HECTARES
NEGATIVE DIFFERENCE = 1,565,594 HECTARES
CONCLUSION: The area of American corn decreases by 1,565,594 hectares. Referring to an average level of 11 tons/ha, we estimate a decrease in American corn production in the next season of 17,221,534 tons.
This decline in the area of corn is dictated by the price of fertilizer, which has risen to alarming levels, and so American farmers have turned to soybeans in particular and in part to wheat.
AGGREGATED STOCKS according to the calculation formula: on-farm stocks, off-farm stocks, extinction rate (human, feed or industrial consumption, including exports). March 1, 2022 VERSUS March 1, 2021 = PLUS 3,911,000 TONS
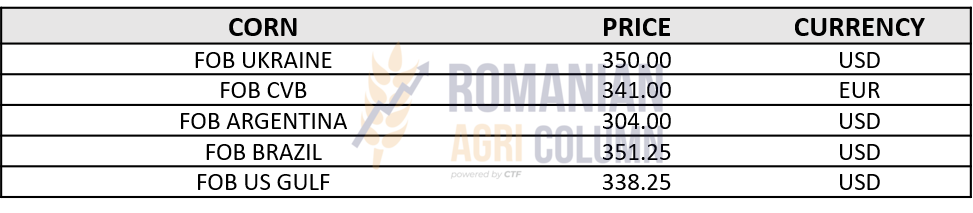
CORN INDICATIONS IN MAIN ORIGINS
ANALYSIS
- Corn will remain stable for some time due to the weather factor in South America. Early frost in Argentina and the delay in the Brazilian Safrinha create the conditions for support.
- However, the NASS report of areas and stocks changes the paradigm of the game for 2022-2023. Decreased areas in the United States due to the price of fertilizers and the decline in soybeans are already generating a decrease of over 17 million tons in future American production.
- The short-term reaction will not be seen, as the differences in stocks between last year and this year are positive by almost 4 million tons.
- In the light of the above information and in the absence of Ukraine on the ground, the corn will return to the star it was in the past years.

LOCALLY
Buyers’ indications are set at AUG22 minus 10-15 EUR/MT for exporters and AUG22 minus 5-10 EUR/MT in DAP Processors parity, a sign that the latter are trying to cover the volume for the first crush session which will start with rapeseed harvesting.
REGIONALLY
In the European Union, the status is the same. Rapeseed enters vegetation and expectations are met. A level of 18-19 million tons is forecast on the territory of the European Union.
However, the stock market barometer is leaning towards the new rapeseed crop. And we’re talking about its price. Time is running out and the war in Ukraine is not over. The volume of 3 million tons will not be available or will be to a small extent. The Russian one will certainly be directed to the “friendly” countries, so it disappears from the processing radars.
In conclusion, the new crop increases in indications, although crude oil decreases in quotations. Rapeseed correlates with fossil energy, as we well know, but the Cavallino Rampante effect is undoubtedly visible in the trend chart.
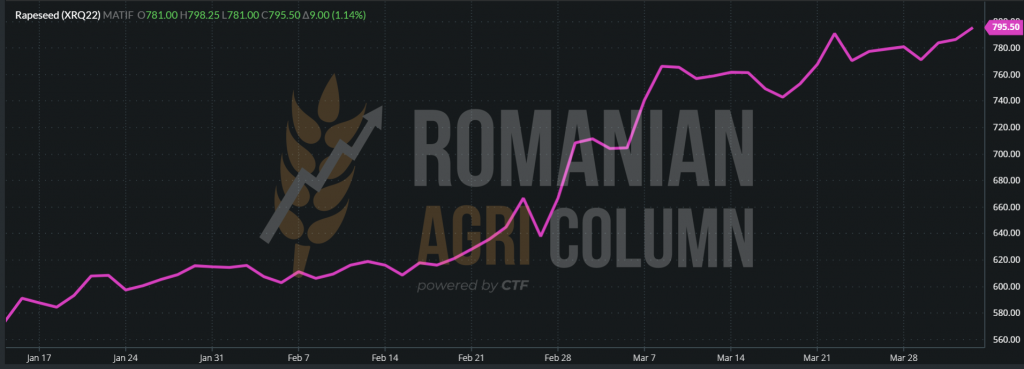
RAPESEED – EURONEXT XRQ22 AUG22 – 795.5 EUR (+9 EUR)
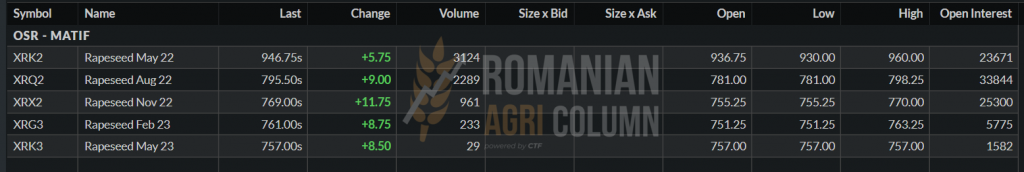
RAPESEED TREND GRAPHIC – XRQ22 AUG22
GLOBALLY
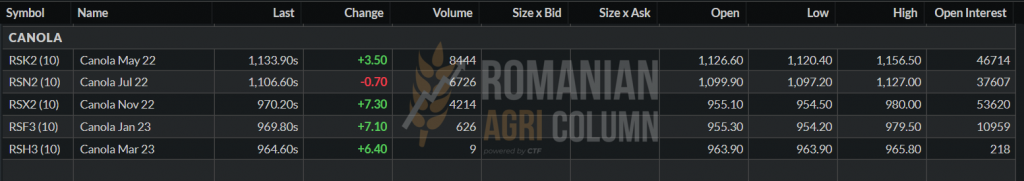
Across the ocean, canola reacts the same way, perhaps with less momentum, but the increase for the new crop is obvious. Canadian farmers are starting to sow, and we will be closely monitoring developments to generate price information and analysis.
RSX22 NOV22: +7.3 CAD
ANALYSIS
- Ukraine disappears from the radar in the 2022-2023 season.
- Russia is disappearing from the radar as well.
- Euronext is visible, despite declining fossil energy prices.
- We also have Canada, Australia and tangentially India usually averages a volume of 8.85 million tons per year. If this is not achieved, the price of rapeseed at Euronext level will be pushed upwards.
- 19 million tons EU | 6 million tons Ukraine + Russia | 22 million tons Canada | 4.85 million tons Australia | 8.85 million tons India.

LOCALLY
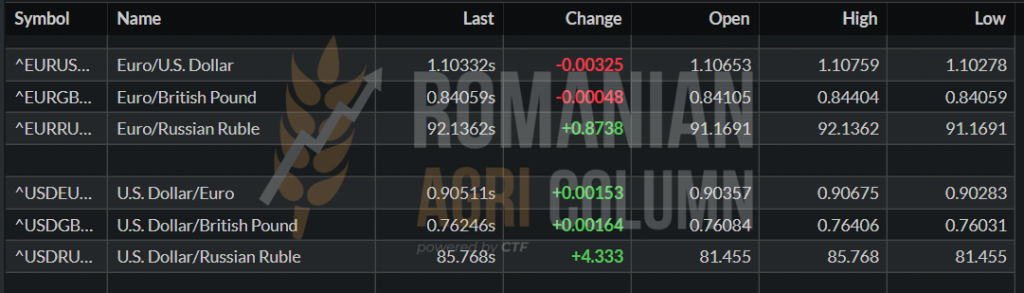
The indications remain at the level of 840-850 USD/MT for sunflower seeds at the level of CPT Constanța and DAP Processor. Stocks still exist, as we said in previous issues, but farmers have other expectations. We regret to mention that there were days with a price of 1,120-1,140 USD/MT and these days have passed. A beautiful proverb says “after greed there is nothing”. All in the context in which the emotion provoked by the war had also raised the American dollar in quotations. Today, the EUR:USD parity is 1.10 and the USD: RON parity is 1: 4.4763.
The price of the new sunflower crop started at a level of 720 USD/MT. Decreasing Ukraine’s share of the supply system or its disappearance altogether generates high levels from the very beginning. It is Romania’s chance that he must play with a lot of wisdom and temperance. It is a turning point in Romanian agriculture, which must be exploited for a perfect positioning in the context of the European Union’s need for crude oil.
REGIONALLY
Ukraine is trying to effectively deploy its entire logistics arsenal to meet EU demand for crude oil. And we see how tankers, barges offered CIF Danube, as well as refined oil is offered for sale. This will calm the market further over time.
Russia it tries to manipulate the market again, only we study the game every day and we are able to issue a correct and relevant analysis. It primarily restricts the sale of raw materials and establishes an export quota for crude oil. At first glance, this is alarming and bullish news, but the data suggests otherwise. Let’s take them one at a time:
RAW MATERIAL. Russia already had an export duty on commodity ½ from the price of goods. Normally, very small volumes of cargo came out of Russia, with a maximum of 200,000-300,000 tons per year. So this restriction equals ZERO. It only has an impact in the eyes of the uninformed.
CRUDE OIL. Russia has produced 15.5 million tons of sunflower seeds, which clearly leads to a volume of CSFO (crude sunflower oil) of a maximum of 6 million tons. Russia’s port infrastructure, leaving Novorossysk aside, is not performing well at a fast logistical pace in terms of CSFO exports. Russia had an export program of 4.08 million tons, of which at the end of 2021 it had achieved about 1.2 million tons. They were clearly lagging behind in exports and had no chance of recovery. While the war was and is being delayed, in a completely discretionary way, through negotiations with the state of India, they took the place of Ukraine (flow of 2 million tons). We recall that India had last ordered 510,000 tons, of which 360,000 tons are still blocked in Chronomorsk, Ukraine. If we calculate the level of exports from Russia at the end of the year, of 1.2 million tons, to which we add the need for India (which, by the way, woke up late, after seeing soybeans decrease in volumes and implicitly in soybean oil) of 1.4 million tons (initially 2 million tons, of which we estimate that they received about 600,000 tons), we reach a level of Russian exports of about 2.6 million tons. The total Russian program is 4.08 million tons. The remaining difference is a fixed 1.5 million tons, i.e., the quota set by Russia.
In other words, a fumigant just to artificially increase the price of oil. We’ve seen a lot of it over time from Russia, so Russia doesn’t cause us any emotion. Dozvidania and Good Luck in your attempt!
As for the sunflower seeds sowing intentions, things are reserved in Ukraine. Of the potential of 7 million hectares, the forecast is a minimum of 4 million and a maximum of 4.8 million hectares. So a season full of volatility is already on the horizon.
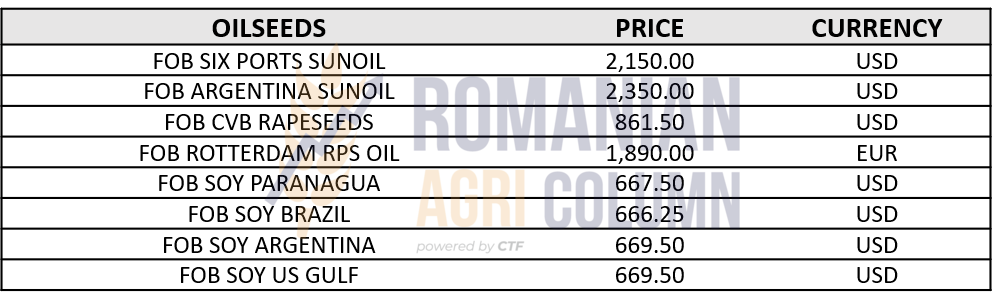
CSFO AND OILSEEDS PRICES IN VARIOUS ORIGINS
ANALYSIS
- Russia is bluffing again, in the hope of a price increase, to make much better use of its crude oil export program.
- Ukraine will generate a minimum of 56% of sunflower seed production.
- Romania has an extremely favorable corridor in the European Union’s supply of crude oil, a corridor that can consolidate it as a predictable and sustainable source of supply.
- TMO TURKEY purchased 18,000 tons of crude oil, CIF Marmara, average price 1,900 USD/MT. Origin: Russia, of course.

LOCALLY + REGIONALLY + GLOBALLY
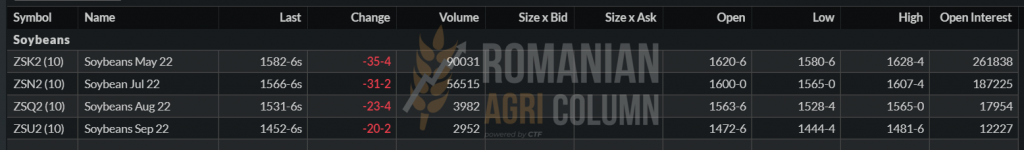
Soybeans, in turn, are experiencing sharp declines in CBOT. The reasons are obvious: the NASS report, which we will deal with a little later. For now, we need to consider a potential threat to the Argentine soybean crop, namely “early frost”, which, as in the case of corn, raises concerns. The phenomenon involves freezing at night in the South American region.
CBOT, as we said, is falling sharply and we see quotations falling by 35 c/bu, in view of the South American crop in Argentina and the NASS report. CBOT ZSK22 MAY22 – 1,582 c/bu (-35 c/bu)
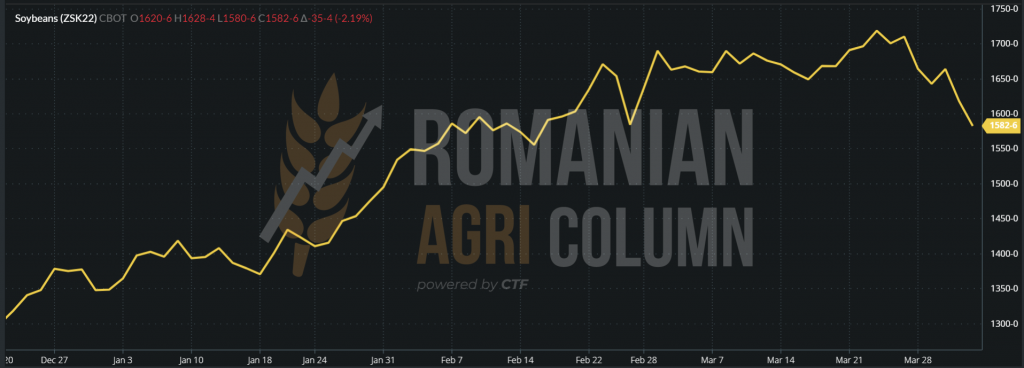
SOYBEANS – CBOT TREND GRAPHIC – ZSK22 MAY22
NASS – NATIONAL AGRICULTURAL STATISTICS SERVICE
March 31, 2022 (SOYBEANS)
NASS issued the report of areas and stocks on March 31, 2022, corresponding to March 1, 2022.
March 1, 2022: SEASON 2022-2023 = 90,955,000 ACRES = 36,824,041 HECTARES
March 1, 2021: SEASON 2021-2022 = 87,195,000 ACRES = 35,301,768 HECTARES
POSITIVE DIFFERENCE = 1,522,273 HECTARES
CONCLUSION: The area of American soybeans increases by 1.52 million hectares, due to the decrease in the area of corn. Soy is preferred due to its lower use of fertilizers than maize.
AGGREGATED STOCKS according to the calculation formula: on-farm stocks, off-farm stocks, extinction rate (human, feed or industrial consumption, including exports): 1 March 2022 VERSUS 1 March 2021 = PLUS 10,042,000 TONS
ANALYSIS
- Soybeans are declining due to year-on-year comparative stocks of more than 10 million tons.
- Soybeans are declining in indications due to the increase in the forecast of sowing by 1.52 million hectares.


EURO/USD 1:1.10 | USD/RUB 1:86

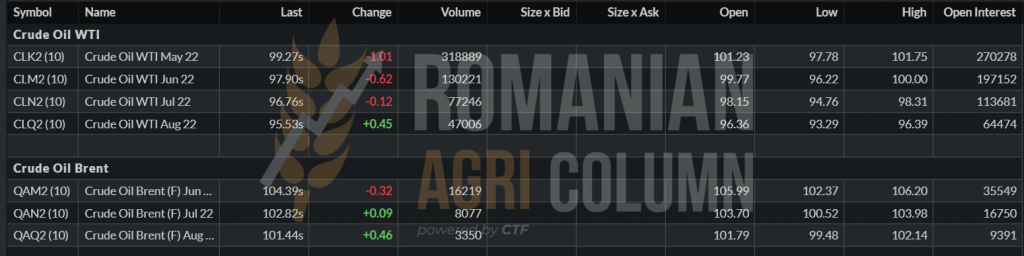
WTI 99.27 USD | BRENT 104.39 USD. It’s the effect of the Chinese lockdown.

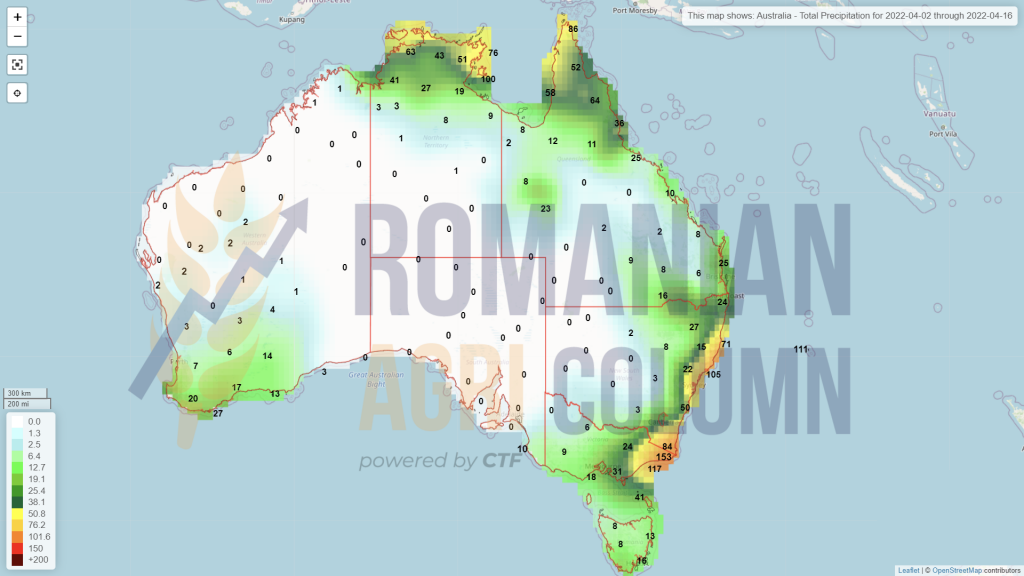
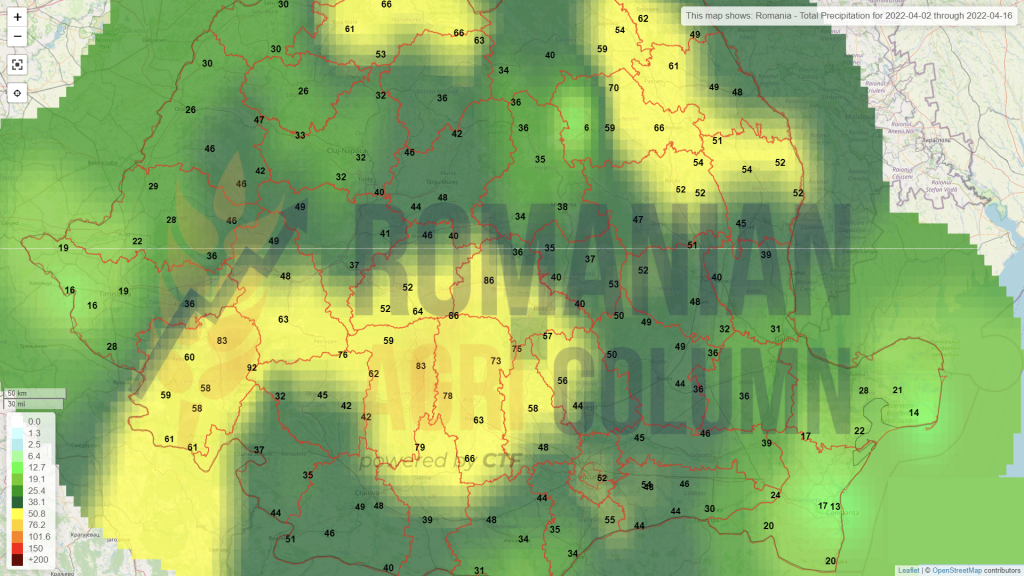
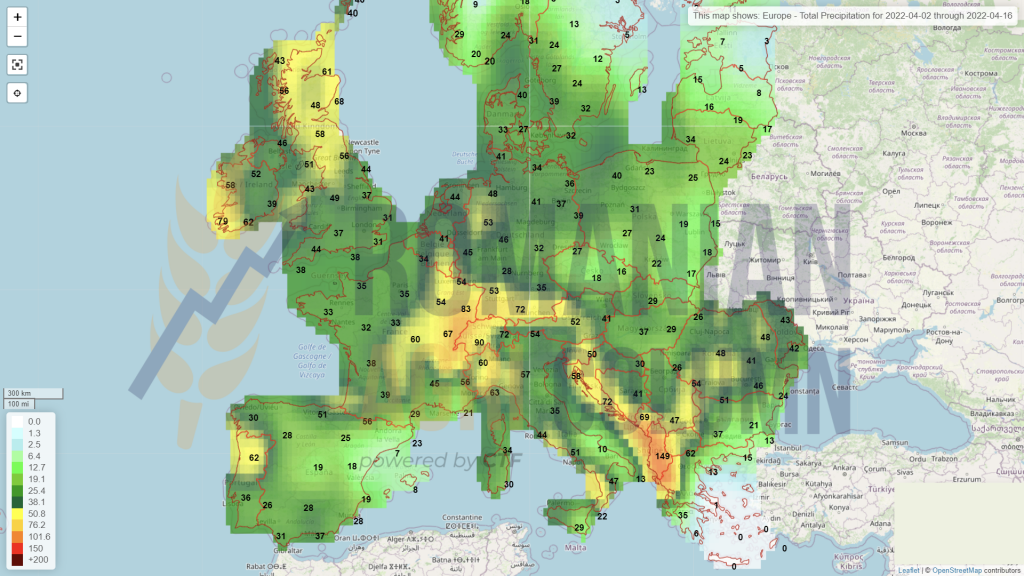
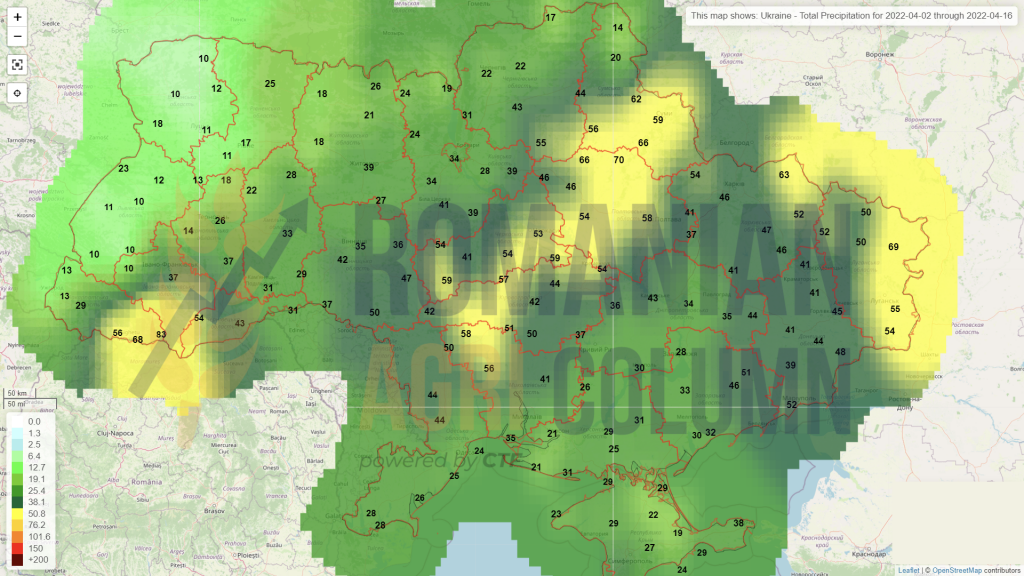
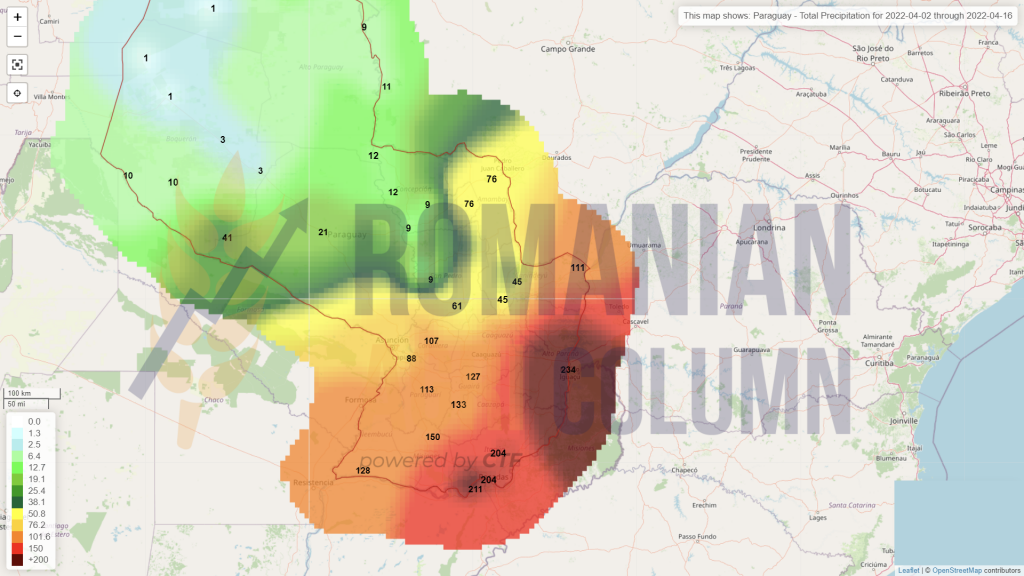
2-16 April 2022
Romania
Europe
Ukraine
Canada
USA
Brazil
Argentina
Paraguay – will receive 400% in the south of the country
China
Australia