
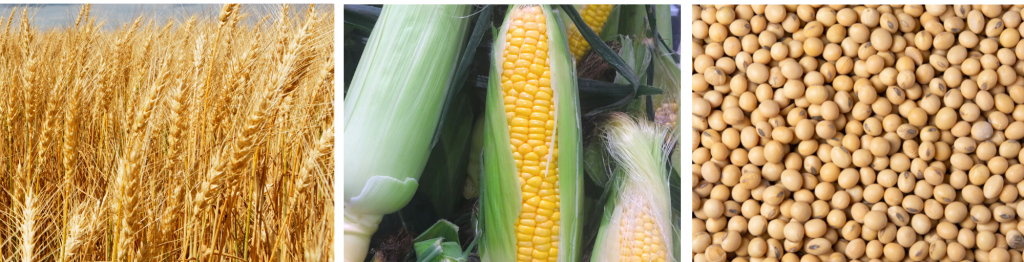
Today’s special market report is dedicated to WASDE (World Agricultural Supply and Demand Estimates), a market report of the United States Department of Agriculture. Below you can find information on global production, consumption and stocks for the following crops:
- Wheat;
- Corn;
- Soybeans.
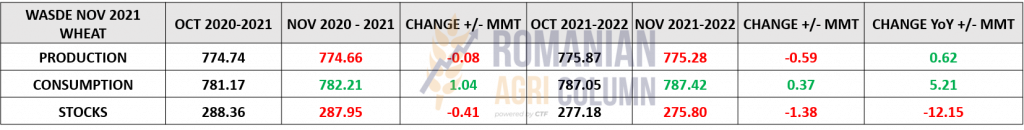
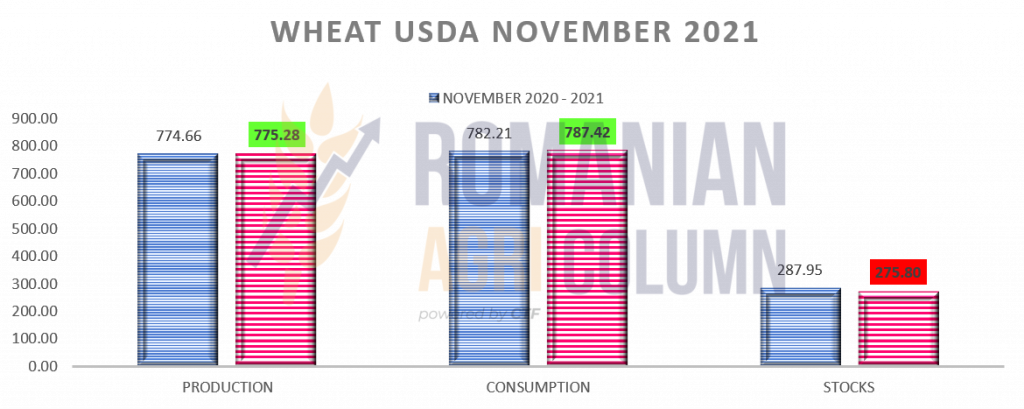
WHEAT
PRODUCTION
WASDE decreases global wheat production by 0.59 million tons. This reduction is due to a negative revision of the European Union by about 1 million tons in France and Germany, partially offset by an increase in production in Romania. The United Kingdom is also down 0.7 million tons, while Uzbekistan is also downgraded. However, the increase of 2 million tons in Russia to the level of 74.5 million tons does not cover the decreases generated above and thus we have a lower level of global production up to the level of 775.28 million tons.
CONSUMPTION
WASDE generates 0.37 million tons higher global consumption amid higher residual consumption in Russia, Iran and Turkey, but offset by reductions in consumption in the EU, Ukraine and Uzbekistan. Thus, global consumption amounts to 787.42 million tons.
STOCKS
WASDE indicates a decrease in global stocks by 1.38 million tons, generated by Australia, India and the EU. The United States also generated a perpetuated lower level of wheat stocks from last month, the lowest level since the 2007-2008 season to date. The only offset that can be seen is also in Australia, where we have a bumper crop of 0.5 million tons, i.e., re-evaluated stocks from old production. It is also worth mentioning the decrease in Russia’s export level to 34 million tons, according to SovEcon, in contrast to the USDA image of 36 million tons.
CONCLUSIONS
We have a report that generates an image that is perpetuated from one month to the next. The bullish factor is present and strengthens the overall picture, with higher demand than global supply. Trade estimates are already over 204 million tons, up 10 million tons from the last estimate. So we are left with a positive route of wheat prices, with a healthy trend, which has support at least until January 2022.
PRODUCTION – CONSUMPTION = BULLISH
775.28 – 787.42 = -2.14 (million tons)

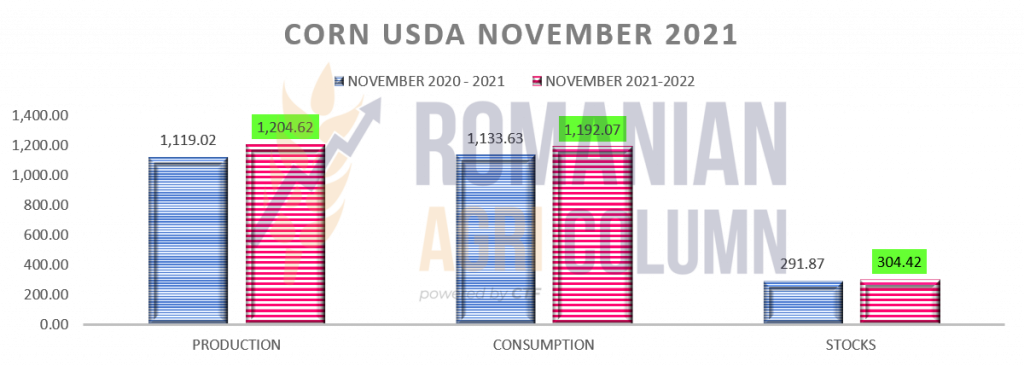
CORN
PRODUCTION
WASDE indicates an increase in global production of 6.4 million tons to 1,204.62 million tons. This increase comes from the re-evaluation of American corn production. Production per hectare was positively revised from 176.5 bu/acre to 177 bu/acre, which means an increase in production per hectare from 11.073 tons to 11.105 tons. This leads the American corn crop to the level of 382.6 million tons. Increases of 1.5 million tons are also found in the Argentine crop, as well as in the evaluation of the EU crop, increasing by 1.5 million tons, up to the level of 67.85 million tons, an increase generated by Romania, France and Poland.
CONSUMPTION
WASDE generates a growing global consumption, with a positive correction of 5.61 million tons, generated by industrial demand for ethanol. Growing consumption is generated by the growing imports from Iran and Thailand, as well as by the re-assessment of China’s imports, which have risen to 29.5 million tons, starting from the initial estimate of 26 million tons. The persistent question is when will this happen, that is, when will China start importing en masse.
STOCKS
WASDE increases global stocks by 2.68 million tons to 304.42 million tons. The increase in stocks is subsequently generated by the estimated value of US production. However, we notice positive CBOT instead of negative, a clear sign that wheat and soy support corn.
CONCLUSIONS
The report generates increased production globally, but at the same time an increase in consumption. Larger stocks are pushing corn into the bearish zone, which is lowering the price. This is also logical, given the harvest pressure in the EU and the Black Sea basin, aggregated with weak US exports. Wheat and soybeans support corn, but the deterioration will be obvious in the days following the report, if US exports do not return in force.
PRODUCTION – CONSUMPTION = LIGHT BEARISH
1204.62 – 1192.07 = +12.55 (million tons)


SOYBEANS
PRODUCTION
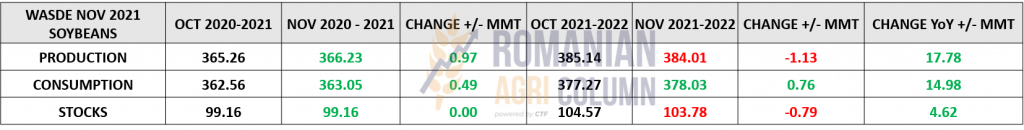
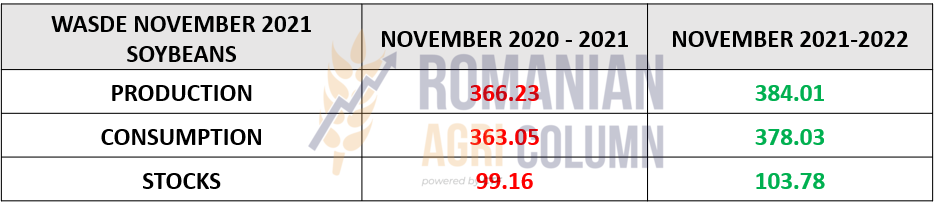
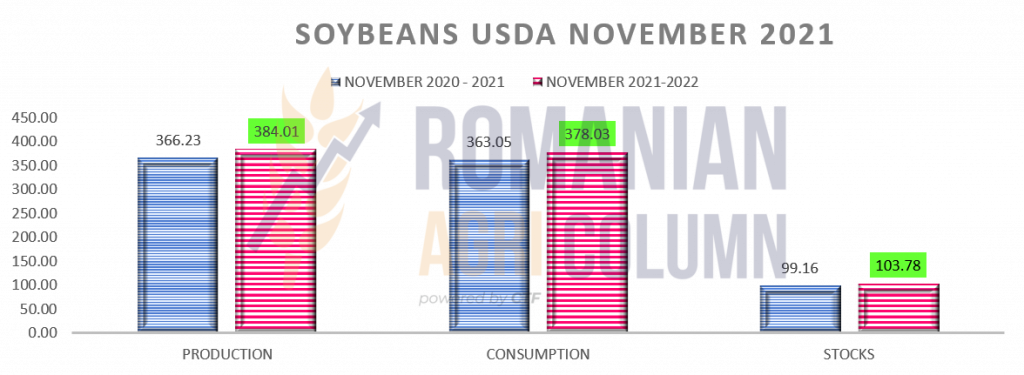
WASDE, surprisingly, generated a decrease in soybean production by 1.13 million tons, amid declining productivity in the US. Thus, the USA is low in from 51.5 bu/acre to 51.2 bu/acre, i.e., a low yield from 3.46 tons/ha to 3.44 tons/ha. US production is set at 120.45 million tons, down 0.63 million tons. Argentina is also down 1.5 million tons to 49.5 million tons. However, production in India increased by 0.9 million tons and thus offset the degradation in the USA and Argentina.
CONSUMPTION
WASDE indicates a global consumption increase of 0.76 million tons, up to the level of 378 million tons. This is due to further processing in Asia, in this case in India. Exports to Argentina decrease as a result due to the 1-million-ton degradation in production, but Brazil generates a higher export level of soybeans by 1 million tons, to the level of 94 million tons.
STOCKS
WASDE generates a decrease in global soybean stocks by 0.79 million tons to 103.78 million tons. This decrease is generated by low stocks in Argentina and China, but is partially offset by higher stocks in the US.
CONCLUSIONS
Soy receives unexpected help. The reduction in production in the US and Argentina creates a an opportunity for soybeans. Even if China has a reduced import forecast of 1 million tons, demand will make soybeans support the price next month. So a bullish ratio for soybeans.
PRODUCTION – CONSUMPTION = BULISH (from decreasing US + ARG production)
384.01 – 378.03 = +5.98 (million tons)
© Romanian AGRI Column, 2021, all rights reserved