This week’s market report provides information on:

LOCALLY
The local indications for wheat reached the level of 367-370 EUR/MT in the CPT Constanța parity. The lack of goods in the Black Sea basin, combined with the export restriction imposed by Bulgaria, Hungary, Serbia and the Republic of Moldova, makes volatility extreme these days. Romanian processors pay levels close to those of the port of Constanța in order to have availability on the goods. A discount of 5-7 EUR/MT makes the difference between the port of Constanța and the processing units, at this moment.
No farmer wants to hear about the new crop. The volatility is extreme, the confusion caused by the possibility that Ukraine and Russia will not generate volumes in this new agricultural year cycle, together with the problems encountered by Romania due to lack of rainfall make the risk not to be assumed by farmers through forward sales.
REGIONALLY
We note certain volumes that pass through the Kerch Strait, so they come out of the Sea of Azov. There are Russian cargoes of 15,000-25,000 tons that are delivered to Turkey. But that’s about it. Ukraine does not export anything; Russia has export channels on the Caspian Sea and railways to the Middle and the Far East.
WASDE has generated a decrease in Ukraine’s export volume of only 4 million tons, provided that it still has an export program of about 7-7.5 million tons. We understand the motivation in the report, but we do not understand why the report does not take into account what we all see, namely the Russian aggression on Ukraine, which has blocked regional potential.
The two global actors brutally leave the scene, in a life-and-death battle, in a scenario where the rest of the world sits, watches and begins to suffer from a lack of supply. Russia, in turn, has an unfulfilled export level of at least 8 million tons, and this is destabilizing. The disappearance of 16 million tons of global trade has a profound impact.
France, on the other hand, seem to have won the lottery. Its exports are estimated to increase from 8.8 million tons to 9.7 million tons. And in this context, we note the sale by tender to Tunisia of 125,000 tons of wheat at consistent prices, in a range of 497-509 USD/MT. We also note the acquisition of OAIC Algeria of 600,000 tons of wheat at an average price of 485 USD/MT, CIF parity.
EURONEXT rallied at first to the outcome of the report. But for clarification, we have to say that the bearish sensation was only artificial, created by the funds and the sell-off movement. Real life or the physical market, as we call it, did not take into account the outcome of the report.
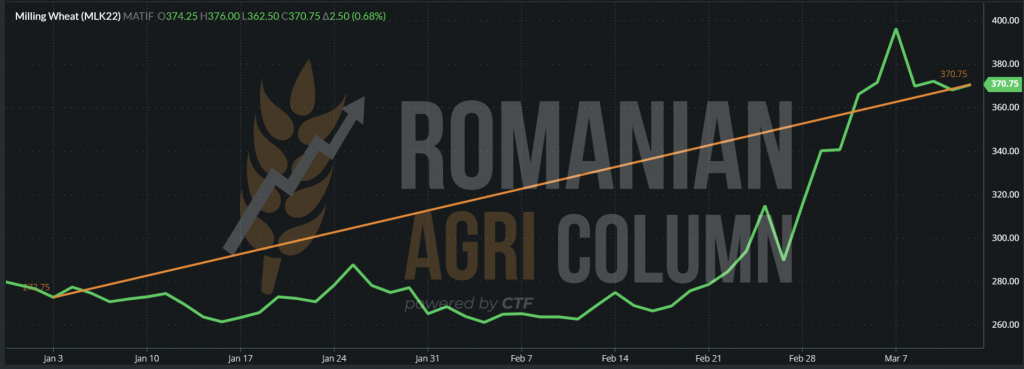
EURONEXT MLK22 MAY22 – 370.75 EUR (+2.75 EUR)
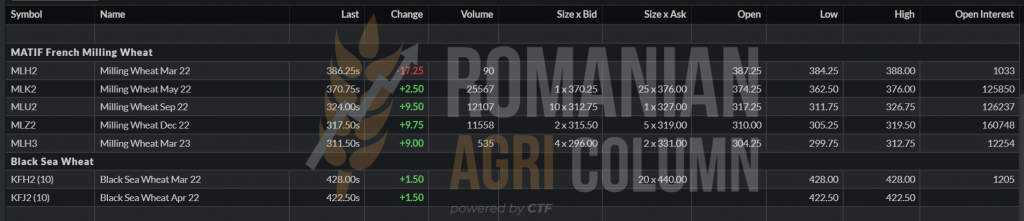
BSW still lists, but it has little to do with reality. Brokers indicated a 440 USD level for wheat with 12.5% protein for the goods in the Black Sea basin.
MLK22 MAY22 EURONEXT WHEAT GRAPHIC | January 3, 2022 – March 11, 2022 (+100 EUR)
GLOBALLY
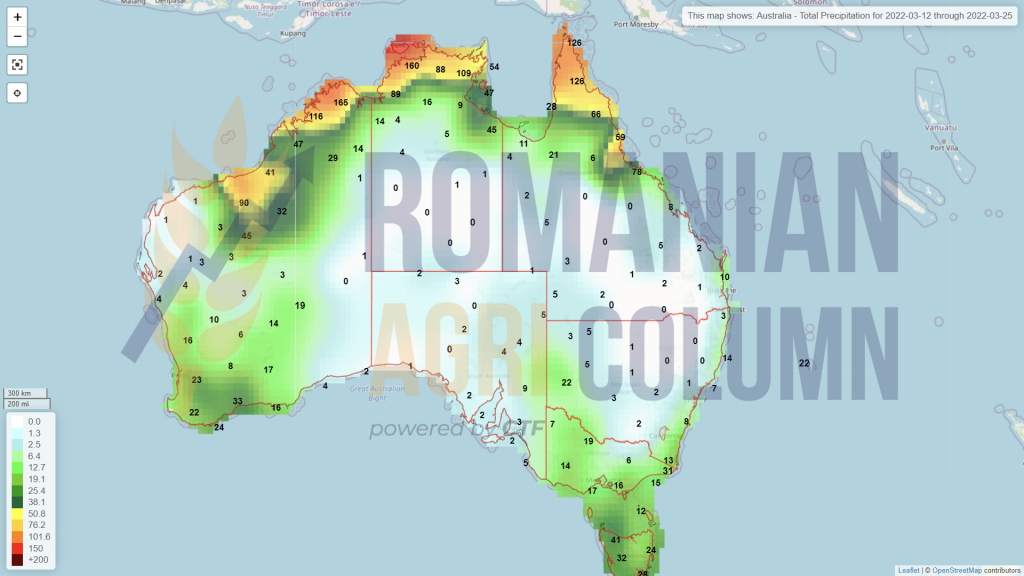
The USDA report offsets 2 million tons of Australia’s surplus exports from an increase in production from 34 million to 36.3 million tons. The ratio also increases India’s export potential from 7 million to 8.5 million tons. This surplus is intended mainly for the Asian market. Australia cannot access the Middle East or North Africa for logistical reasons. Not even using Supramax can generate a lower cost, given today’s oil indications.
We are actually adrift. Volatility is extreme, and what we see in Iraq, those false flags expressed in protest, are nothing more than attempts to ignite the global conflict.
With regard to the new wheat crop, there are signs of a weak global supply, as follows:
- The United States has problems in the Central Plains, and we do not yet know how much their wheat crop will deteriorate.
- There are potential problems in Canada as well.
- North Africa is facing severe drought, while in the Middle East the drought is extreme. Sub-Saharan Africa will increase demand in the area by 35-38%.
- Spain and southern France are also facing a severe drought and will be degraded in terms of volumes.
- Ukraine and Russia disappear from the radars with about 63 million tons. Compared to global trade of 205 million tons, this means 30%
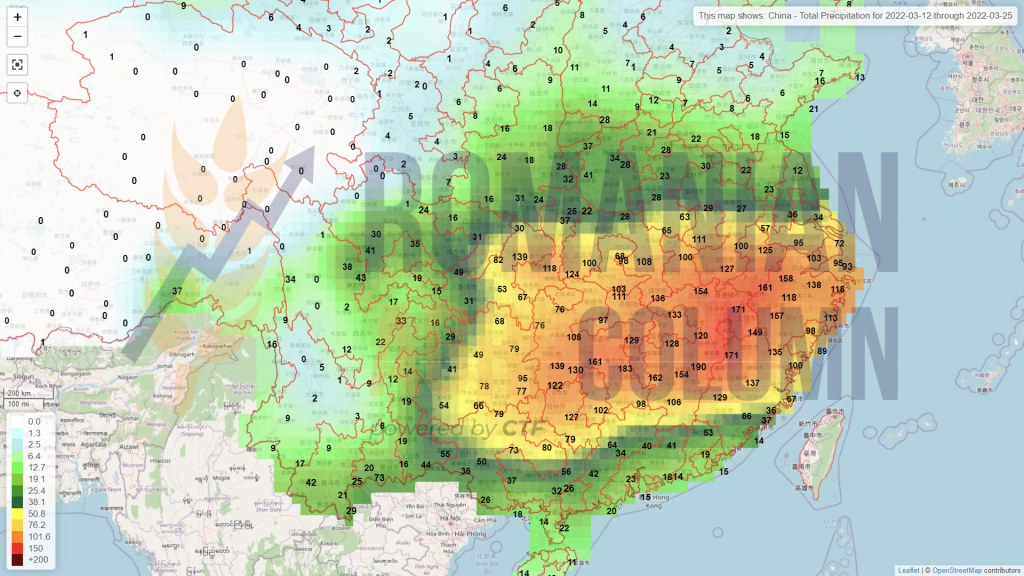
- China is losing 20% of its harvest volume potential, from 137 million tons forecast to 110 million tons.
- But China can be supplied by Russia, which, although subject to sanctions by many countries, has signed a trade agreement with China.
- Out of a global production potential of 780 million tons globally, the goods in the Black Sea basin (Ukraine and Russia), the degradation in China, and a minimum of 8-10% of the American crop are already being questioned. We are approaching the figure of 100 million tons, or 13%.
- To these we add an indicative increase in demand for the areas with severe drought mentioned above, of about 25-28 million tons and we have a worrying puzzle globally.
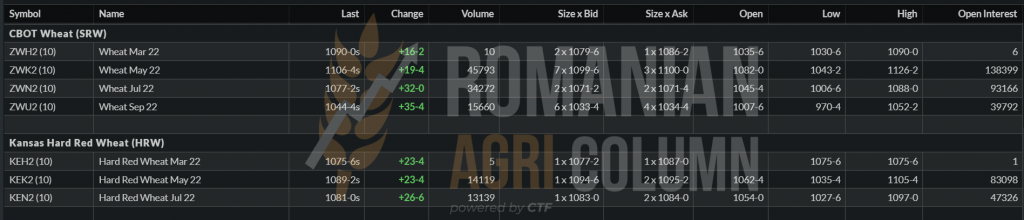
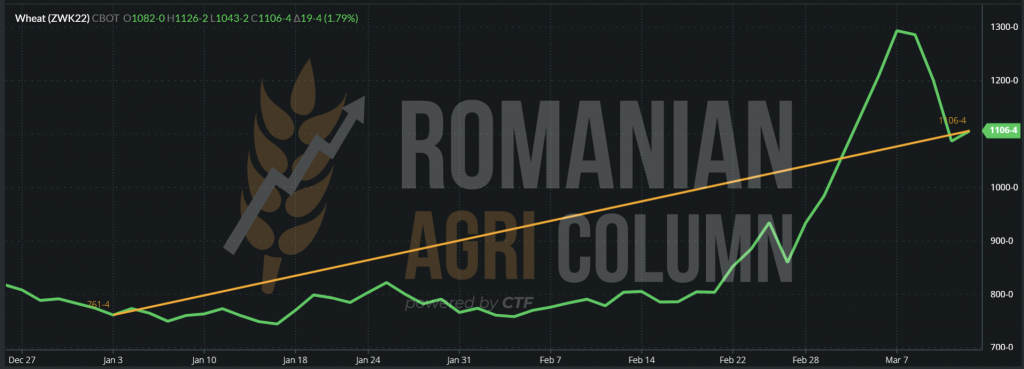
CBOT resumes interrupted by sell-off march | ZWK22 MAY 22 – 1,106 c/bu = 406.38 USD/MT (+19 c/bu = +6.98 USD)
ZWK22 MAY22 CBOT GRAPHIC – January 3 – March 11, 2022 (+126.76 USD)
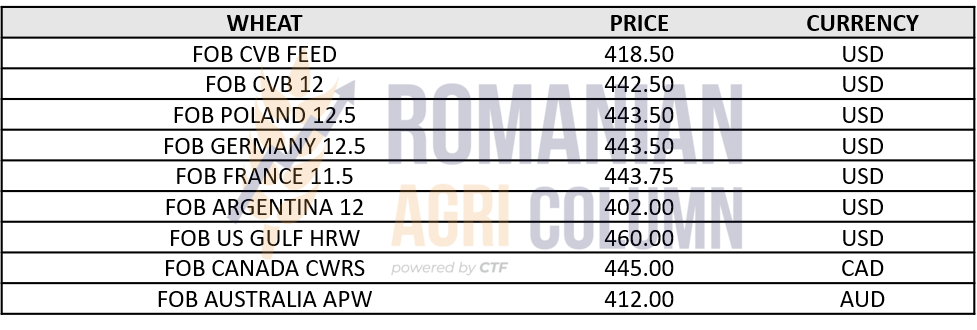
WHEAT PRICE INDICATIONS IN VARIOUS ORIGINS
ANALYSIS
- In the short run, price volatility leads.
- The request will be more restrained, but it will exist. It will become pregnant by the end of March.
- The new crop is already causing great concern, we have deficit conditions globally.

In terms of barley, we note a tender concluded on Friday, March 11, 2022, in which Tunisia purchased a quantity of 100,000 tons in CIF parity, from 2 suppliers, as follows:
- Casillo 25,000 tons (484.68 USD/MT)
- Viterra 25,000 tons (489.98 USD/MT), 25,000 tons (492.49 USD/MT), 25,000 tons (494.97 USD/MT)

LOCALLY
The indications of local corn are spread over several levels. It’s all about the level of information and the logistical power of the farmers in relation to the buyers. The disruption caused by the conflict that is taking place in our neighborhood makes the oscillation so wide that there are simply hours when it is difficult to correctly predict or indicate the price.
The most correct and coherent indication is the basis, which today is at the level of 350 EUR/MT in the CPT Constanța parity. This is indicated by the EURONEXT correlation.
The indications of the brokers in the pool show between 360-376 EUR/MT FOB, depending on the capacity of the ships and the destination. From now on, everyone can negotiate their level. And we believe that every day that passes indicates only one thing – “the only way is up”. The disruption of the largest maize producer and the lack of its goods in the Black Sea basin is the strongest indicator, even with the indication of neutrality generated by the WASDE report.
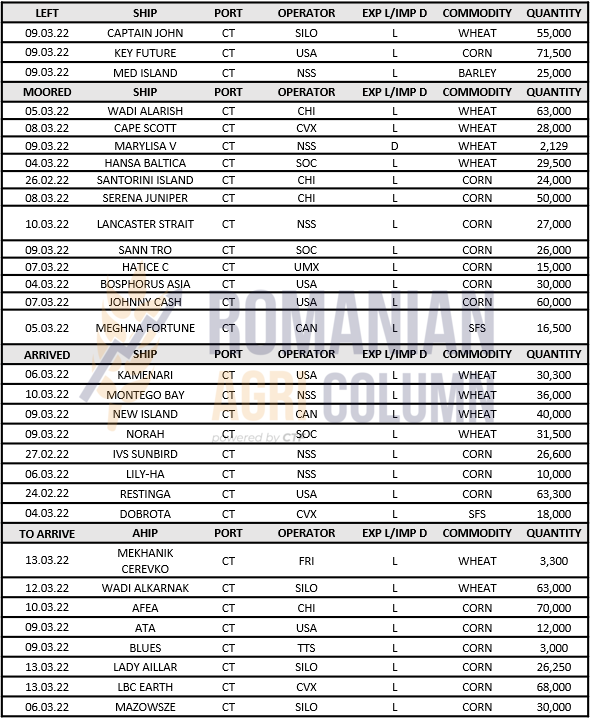
The port of Constanța is normal these days. We note the haste of the exporters in the shipment of goods. The ships line up one after the other, in an attempt to send the Romanian goods as fast as possible. This haste is given by the potential to restrict exports following the model of the countries bordering the Danube, Bulgaria, Hungary and Serbia.
We do not see any danger at this time in terms of the volume of harvest exported by Romania (corn) as an argument for food security in the country. But we want this to be monitored. Stocks already purchased by exporters can affect the balance of production-consumption-stocks at local level.
On the other hand, we see how exporters are polarized in extracting their goods bought in Ukraine. Logically, they bought those goods at pre-conflict prices. We have two distinct things here:
- The contracts signed by them are in force majeure, because ships cannot be sent for loading, not to mention those stuck there, the exporters being also, therefore, contractually exposed on the chain.
- Long positions they hold and which are priced pre-conflict. This creates the premise of a much higher profit than normal. However, this is due to local issues and the need to sell expressed by Ukrainian farmers.
REGIONALLY
The existing blockade in Ukraine generated by the conflict leaves out of the trade flow a quantity of about 9 million tons. Ukrainian farmers are actually dismayed at the moment. The clear question is: What will happen to their crop? Will they be able to get it out? Or will it fall into the hands of the Russians in the event of a Russian victory in Ukraine?
Thus, we note this week attempts to leave Ukraine to Romania and Poland by rail and car. This is exactly what we estimated at the beginning of the conflict. The port of Constanța is the only one that can supply from the Black Sea basin.
The logistical problem is certainly a special one. The width between rail lines is different in Ukraine from Europe, a feature of the Iron Curtain when the USSR was constantly afraid that it would be invaded and so they modified all the railway infrastructure so that it could not be used by the possible invasion.
Transboard points for goods from Ukrainian wagons to wagons with European specifications can be arranged, but this makes the logistics extraordinarily difficult. In addition, the transboard will cause handling losses and, of course, broken kernels in the product mass.
There are several options via car, including Sculeni and Leuseni from the Republic of Moldova, but they are expensive. In both cases, the logistics costs are very high.
The border crossing points to Romania by train are also very limited – Dornești in northern Romania and possibly Galați, but the flow is very low. The presence of Russian forces in the neighborhood increases the degree of unrest. The battle for Odessa, if Russia wins, will make the latter reach the mouth of the Danube or take over the Republic of Moldova. Talking to a few Ukrainian farmers, we realized once again the seriousness of the situation. They claim that they are selling corn to help the country buy arms, because if they do not sell and do not help the country, they will have nothing, no land and no harvest, in case of a Russian victory. It’s shocking, but true.
The development of the situations set out above will be seen much more clearly in the coming days. We were also asked for logistical and commercial help by Ukrainian farmers and we will generate a special focus on this chapter next week. It is essential that these people save their crops so that they can finance the country’s defenses and generate income on their farms, which is so necessary for spring sowing.
We can say that we will see a degradation of the areas sown with corn and, subsequently, with sunflower. Ukrainian farmers have stocks of seeds and crop protection products, but there is a lack of fuel that is directed to the front, as well as protection. Most will not be able to go out because of the conflict. Some of them enlisted in the defense of the country, so that the spring crops will be degraded in volume.
In Russia, the situation is somewhat reversed. Farmers have time and peace, but no technology. Large companies that impose sanctions on Russia are no longer supplying and have withdrawn from the market, leaving Russian farmers without stockpiles of seeds and crop protection products.
As a regional conclusion regarding the Black Sea basin, we will record much lower maize production in 2022, due to the reasons briefly stated above.
EURONEXT has not been disturbed since the last WASDE report. The USDA’s desire for neutrality led to a slight decline and then a return.
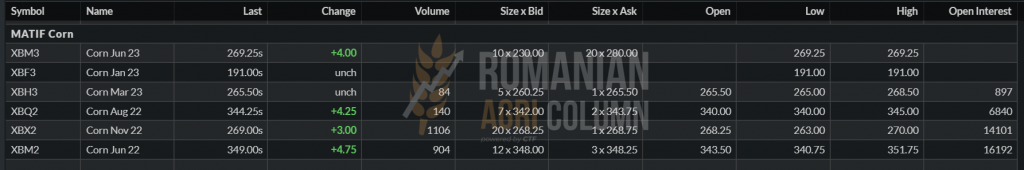
EURONEXT – XBM22 JUNE22 CORN – 349 EUR (+4.75 EUR) at the close of March 11, 2022
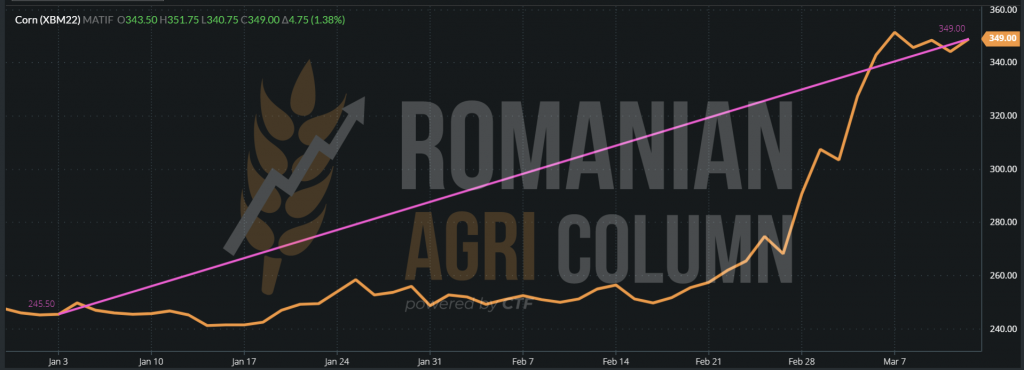
XBM22 JUN22 CORN EURONEXT GRAPH between January 3 and March 11, 2022 (+104 EUR)
GLOBALLY
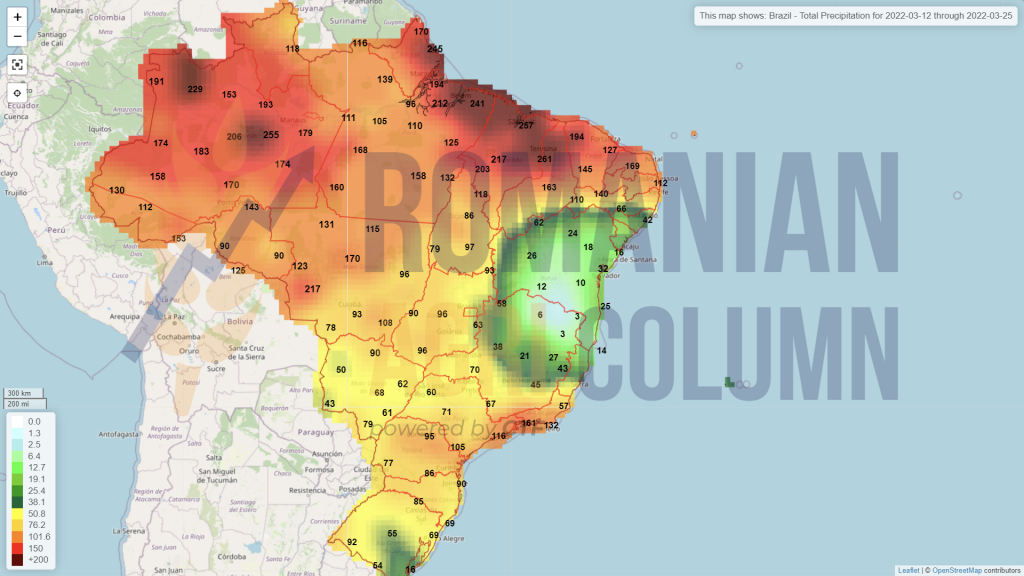
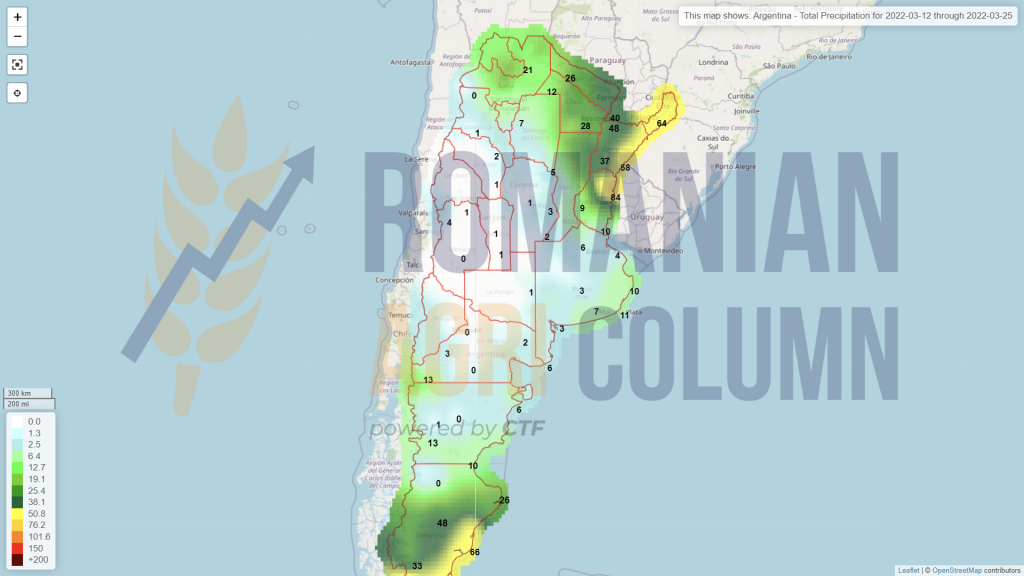
WASDE did not operate much on the South American crop, speaking in terms of volumes. It kept the Brazilian crop at the same level of 114 million tons and decreased the crop in Argentina by only 1 million tons, from 54 million to 53 million tons. However, our estimates are for a much greater degradation in the Argentine crop and a recovery of the Brazilian Safrina.
Global neutrality is also due to the fact that Ukraine is not mentioned as an exporter, even with the goods blocked. Instead, there is compensation from India, which is up 2.5 million tons. South Africa, on the other hand, is down 0.7 million tons due to persistent drought.
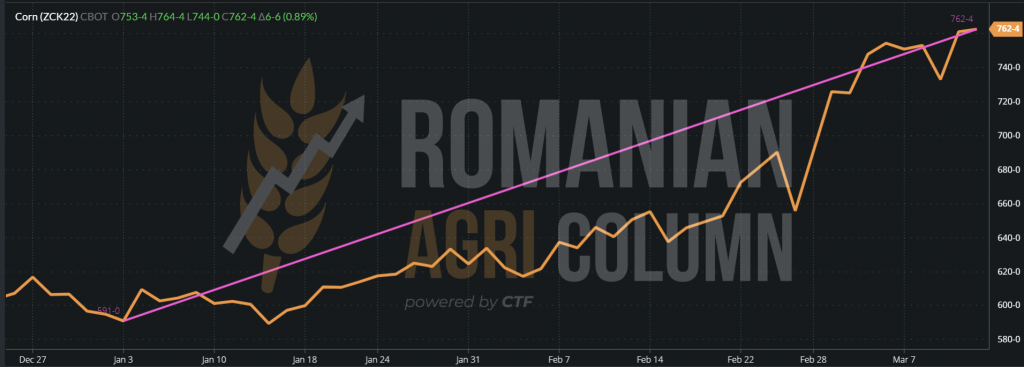
CBOT indicates the same stability generated by the WASDE report.
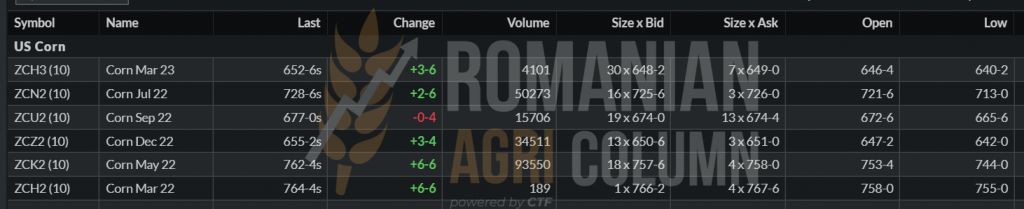
ZCK22 MAY22 CBOT CORN – 762 c/bu = 300 USD/MT (+6 c/bu = +2.36 USD)
CBOT ZCK22 MAY22 CORN GRAPHIC between January 3 – March 11, 2022 (+67.32 USD)
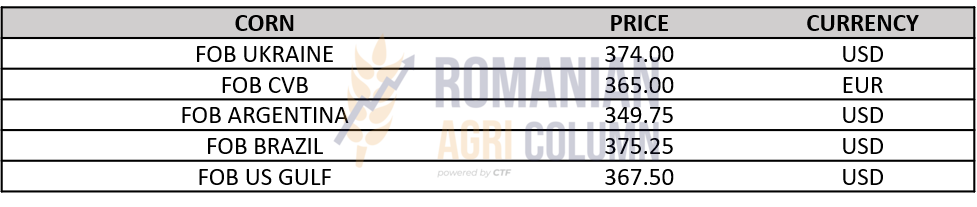
CORN INDICATIONS IN MAIN ORIGINS
ANALYSIS
- The conflict in Ukraine raises the price of corn in the northern hemisphere.
- The Ukrainian tank is blocked and demand is high in this context.
- Ukrainian farmers are trying to find a way out of their goods, by train or car, only to escape the existing deadlock.
- The future does not sound good at all. The blockade in Ukraine, combined with USDA neutrality, is a cocktail of future growth, depending on how much fuel the conflict between Russia and Ukraine will burn.

LOCALLY
The local market is effectively under the influence of the growth generated by the conflict in Ukraine, fueled by the price of oil. The correlation is made in 1-2 hours on the Euronext exchange. 760 EUR as a marker in any transactions generated by the sales motivation is a permanent benchmark. A stabilization cannot be taken into account, as the volatility generated by the price of oil remains the first sign of distrust.
Quotations under the AUG22 market mechanism minus 5-10 EUR remain, however, a national contract benchmark. But we have a lot of uncertainty ahead. There are a few good months until harvest and quite a few reactive factors in this regard.
Very rarely, but you can still see lots of rapeseed from the old crop. There are batches of 500-1,000 tons, which will certainly be sold in the next period. They can be easily quoted at the level of 900 EUR/MT, in the CPT/DAP Constanța or Processors parity.
REGIONALLY
EURONEXT oscillates with an amplitude of 7-9 EUR/MT, back and forth, tuned after oil quotations. Fossil energy is also on the rise, generated by the sanctions imposed on Russia and, implicitly, by the reduction of the volume of oil coming from this country. OPEC has finally allowed an increase in the pace of extraction to generate much more liquidity in the market and to temper WTI and BRENT quotations.
But we have a big sign of uncertainty that is divided into distinct branches, namely:
- What will happen to the Ukrainian and Russian rapeseed crop? We have 3 million tons in the account of each of them.
- How much of the Ukrainian crop will be able to find its way out of the country? Spring works are 2-3 weeks away.
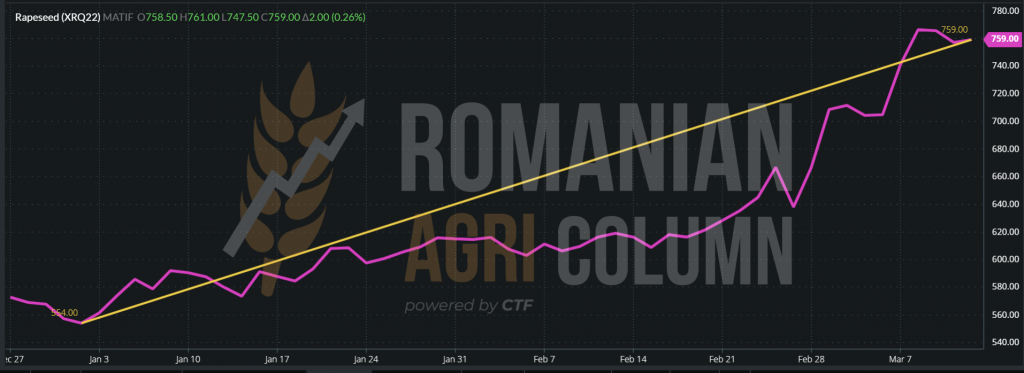
XRQ22 AUG22 EURONEXT – 759 EUR at the close of March 11, 2022
XRQ22 AUG22 RAPESEED GRAPHIC between January 3 – March 11, 2022 (+204 EUR)
GLOBALLY
The road to the new rapeseed crop does not stop here. Rapeseed is coordinated, as written above, by oil prices and availability. However, globally, there are two other very important factors that will influence the prices of rapeseed:
- The Canadian crop. The weather in Canada will be an extremely important element in the price of rapeseed. If the disturbances will generate negative oscillations in terms of volumes, then we will certainly find this in the form of a price increase.
- Chinese rapeseed crop, in the form of a reverberation from the state of Chinese wheat. If Chinese wheat is already at an estimated 20% loss, why would rapeseed be otherwise? It is a natural conclusion. Rapeseed is sown in China near wheat growing areas. More specifically, in the Hubei, Hunan and Sichuan regions. Last year, China made 14 million tons of 6.8 million ha. Harvesting is scheduled to begin on April 4-5 and last until the end of May.
ANALYSIS
- The road to the new rapeseed crop is one that goes up in directions.
- The weather factor is one that can act in concert in Canada and China.
- The political factor is one that is concerted in Ukraine + Russia.
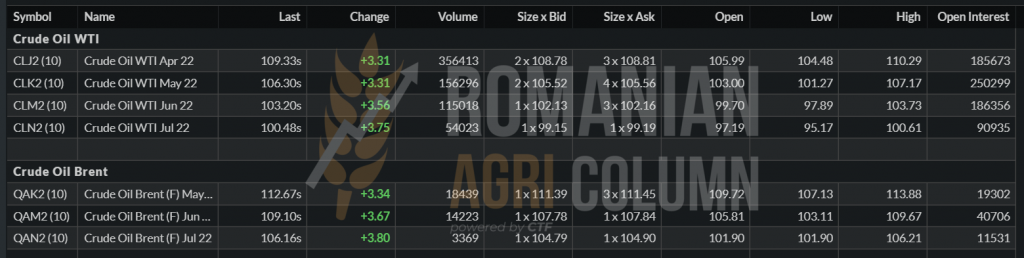
- The correlation with oil is the third influencing factor and at the time of writing this report, the Brent indication is at the level of 112.67 USD/barrel.

LOCALLY
The lack of raw materials is already causing major problems in the internal market. Due to the conflict taking place in Ukraine and implicitly the lack of crude sunflower oil, we see how seed prices rise hallucinately from one day to the next. The indications reached the level of 1,120-1,130 USD/MT for the goods delivered to the processing units in Romania.
We also follow the way in which the sunflower seeds leave Romania and we notice the speed of their shipment. Last week, 90,000 tons left Romania and this week we see another 35,000 tons coming out. Of course, it is legal to trade, but Romania remains uncovered. In a very short time, we will see oil rationalization, maybe a monthly oil quota until the new crop.
A simple calculation tells us that if we processed 85-90% of the sunflower seeds here, we could generate an added value of about $ 1,000,000,000. Yes, you read that right, $ 1 billion, plus jobs and related industry. $ 1 billion, which is a tax base for the Romanian state. These would be extremely simple measures, which do not run counter to European trade rules, but only hold back on raw materials.
- The first measure should be a storage subsidy for farmers who have the possibility of storage, but also for those who do not. Thus, they will no longer have to sell under harvest pressure, but will be able to quietly accommodate the goods and choose the time of sale themselves.
- The second measure would be to encourage sales in the local market through coupled support as in the case of soybeans. The farmer will naturally choose local processing, to the detriment of export or intra-Community trade. Of course, the processor must also be tuned and competitive, but this will add value. Romania will sell crude sunflower oil, not a raw material, and will create a solid food safety base.
REGIONALLY
No change of form or substance. Everything is in the same status. Ukraine and Russia are blocked. Oil is stuck in Ukrainian ports and processing plants are shut down. The multinationals have withdrawn their employees from the processing units and nothing is moving.
The quotations from 6 PORTS are extremely high and some rumors give contracts at the level of 3,000 USD/MT. It is a huge price due to insufficient supply. The European Union only has oil for 4-6 months. The 200,000 tons of crude oil imported monthly from Ukraine has been cut off and 35-40% of the Union’s demand will no longer be available.
We are on the verge of a crisis, and it could certainly worsen. Future crops are in jeopardy in Ukraine, farmers are no longer interested in going out for spring work, and despite President Zelensky ‘s urging, they have not yet formed a clear opinion. What if the Russians come out and confiscate their crops as winners? We don’t know yet. But there is a potential 17.5 million tons of sunflower seeds that is in question, especially on the background that the fuel is redirected to the war machine, instead of generating energy to feed the local population and, implicitly, for the European one.
GLOBALLY
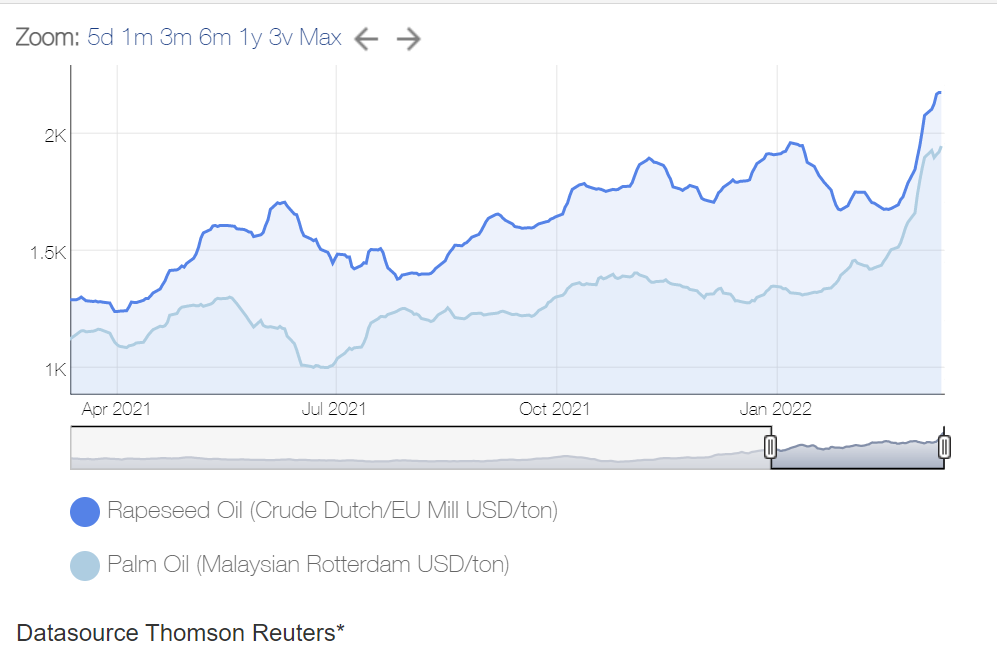
Even the brothers of the complex, soybean and palm oil, show no signs of obvious health, metaphorically speaking. Palm oil is in the same inflationary spiral due to the lower volume input generated by the two state entities, Malaysia and Indonesia, which are reducing the market supply. Soybean oil, a by-product of soybeans, also generates higher prices, a direct consequence of poor crops in South America. But we’ll talk about soy in its dedicated section.
Below, the palm oil quotations, according to the legend: 1,950 USD/MT Rotterdam (source: Thomson Reuters)
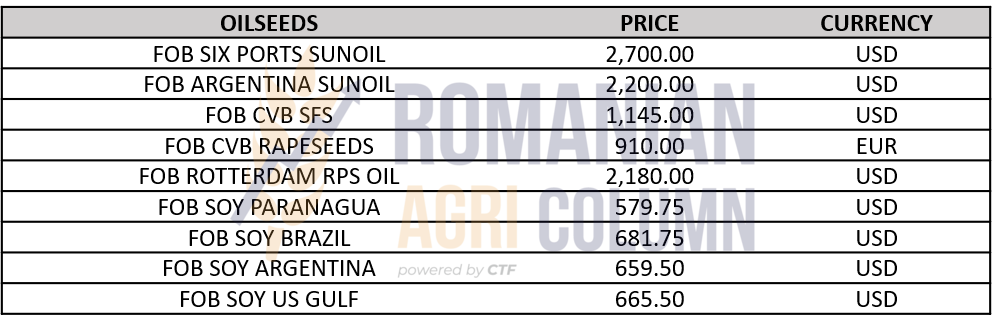
INDICATIONS OF CSFO, RPS OIL AND OIL IN VARIOUS ORIGINS
ANALYSIS
- The rising trend in the price of sunflower seeds does not stop.
- Limiting replacement volumes for soybean and palm oil creates pivotal growth.
- The blockade of the Ukrainian market is driving demand. The European Union and India are most affected in this context.

LOCALLY
The indications of soybeans are summarized at a level of 650-660 USD/MT DAP Processor. Of course, the coupled support comes from the support of farmers, who still have soybean stocks.
In the case of intra-Community trade, we still note destinations in Hungary that quote the same level in figures, but expressed in EUR in the DAP Processor parity.
REGIONALLY + GLOBALLY
The WASDE report generates more than 10 million tons of soybean production, from 363.86 last month to 353.8 million tons. The declines are as we all expect in South America, which has actually been devastated in terms of soybean production.
Thus, we note Brazil degraded by 7 million tons, from a level of 134 million to 127 million tons. Argentina follows with a decrease in production potential to the level of 43.5 million tons. Starting from the forecast of 45 million tons, it decreases by 1.5 million tons. Paraguay is down 1 million tons from production to 5.3 million tons. So we have a very significant decrease in production globally, which leads to movements in the oilseeds market and, implicitly, of meals and vegetable oils.
The impact is half-amortized, so to speak. Consumption decreases by about 5.5 million tons, the natural motivation being the exit from the commercial circuit of the 10 million tons mentioned above in the production chapter.
On the other hand, the US is taking control of soybean exports and is effectively coordinating the North American and South American sales process. China, in turn, is reducing its engines and generating a much lower import forecast of about 30 million tons due to the high price of raw materials and the reduction in processing margins (crush margin).
CBOT oscillates between cause and effect. The funds do their job smoothly, but we notice the faster cadence between input and output. Profit- taking operations follow one another more quickly.
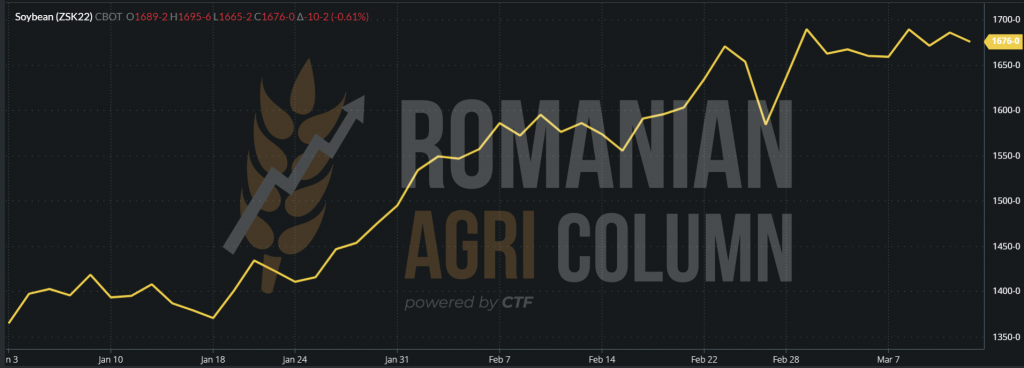
ZSK22 MAY22 CBOT – 1,676 c/bu = 616.83 USD/MT (-10 c/bu = -3,675 USD/MT)
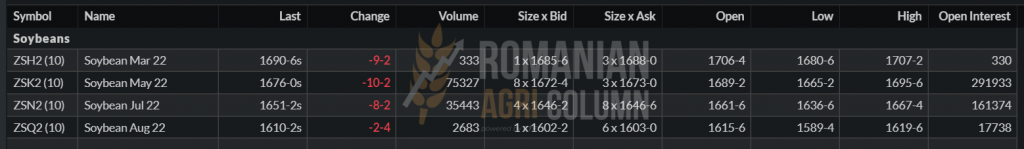
ZSK22 MAY22 CBOT – 1,676 c/bu (-10 c/bu ) at the closing date of March 11-12, 2022
ANALYSIS
- The shock received by the WASDE report in terms of degraded production in South America is offset by the reduction in global consumption.
- However, soybeans remain at very high levels, only if we compare a level of 1,200 c/bu with today’s level of 1,676 c/bu. The difference of 476 c/bu means, in fact, 175 USD/MT.
- Soybean oil, in turn, generates generous support in the VEGOIL complex due to its reduced volume. Replacing sunflower oil with palm or soybean oil is no longer easy. The lower price and supply make soybean oil a pivot of price growth. And keep in mind that soybean oil is actually a by-product of soybeans (18% oil content in soybeans).


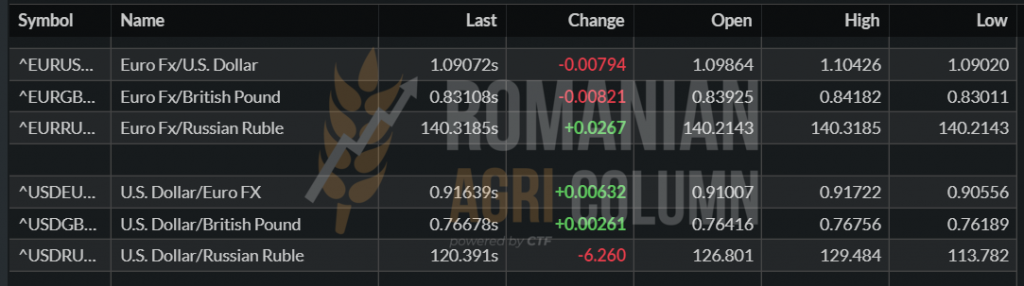
EUR:USD – 1:1.09 | USD:RUB – 1:120
Moscow Stock Exchange remains closed and Russia’s economy will soon be degraded to the junk stage.

WTI 109.33 USD/barrel | BRENT 112.67 USD/barrel
Just a pause in what’s to come. We will certainly see the price of fuel at much higher levels.

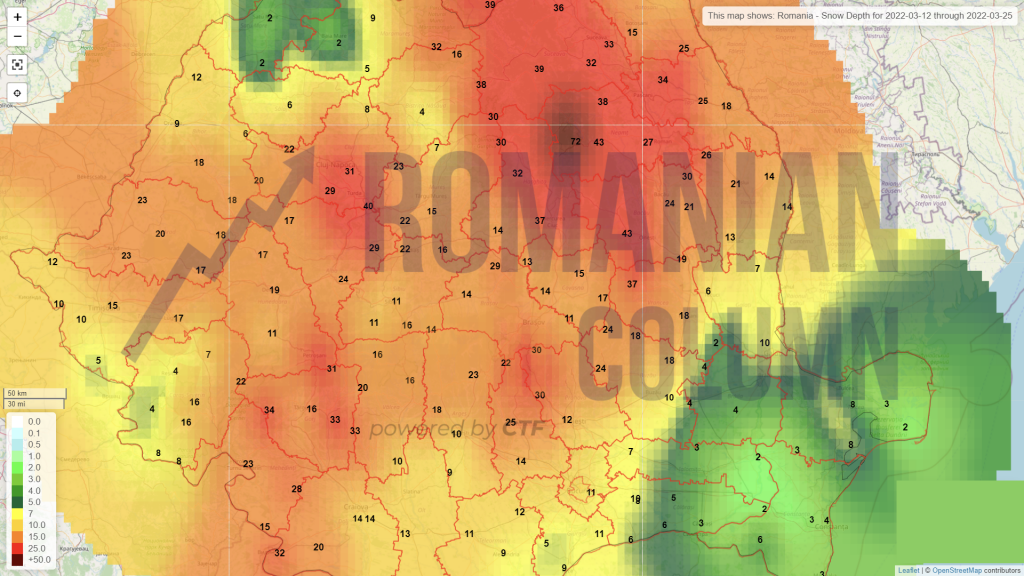
March 12-25, 2022
Romania (snow)
Romania (rain)

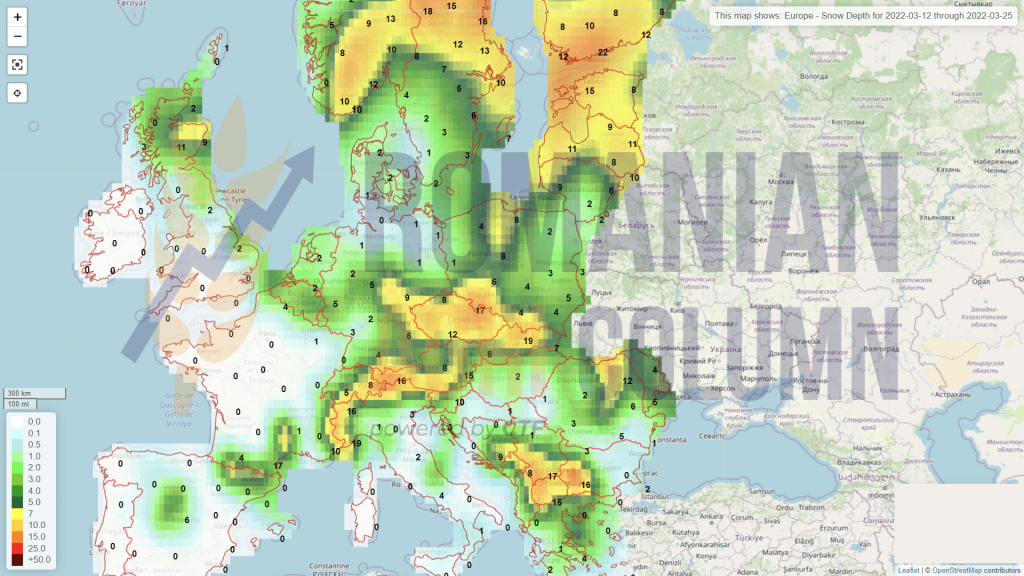
Europe (snow)
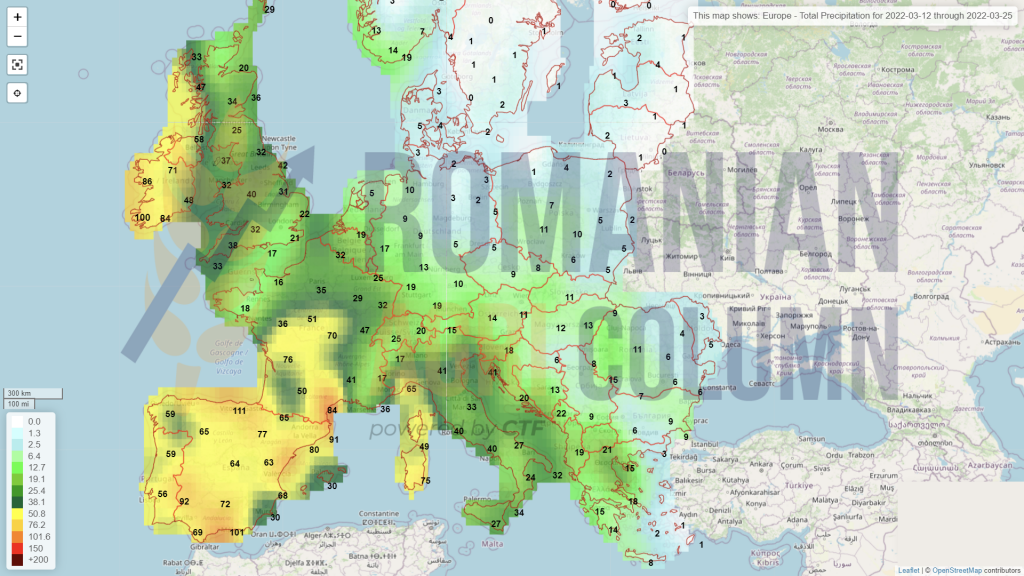
Europe (rain)
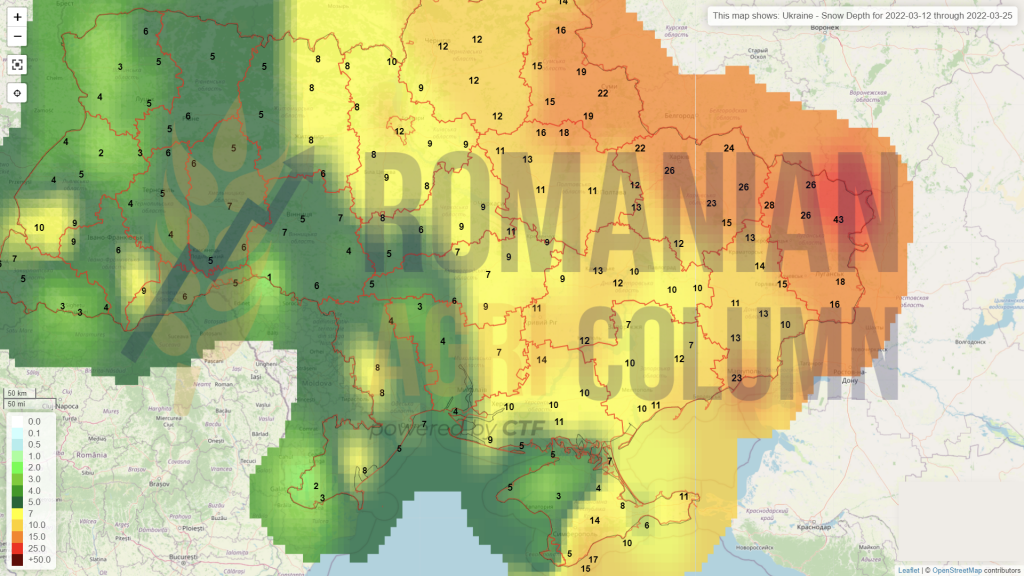
Ukraine (snow)
Russia

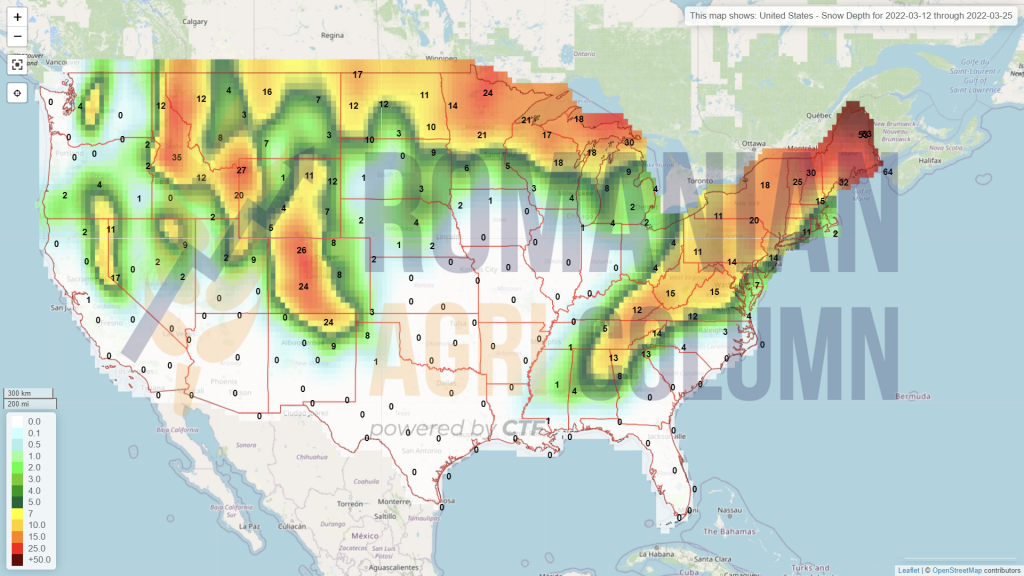
USA (snow)
USA (rain)

Brazil (rains)
Argentina (rains)
China (rains)
Australia (rains)