")
This week’s market report provides information on:
|

Wheat market
The price of wheat in the CPT Constanța parity registered a decline of about 5 EUR/MT after the two days that followed the WASDE report generated by USDA. Thus, we recorded quotations of 260 EUR/MT and a negative difference of 11 EUR/MT for the lower quality of feed.
The decrease was misperceived by the Egyptian state, through the GASC wheat purchasing authority, which canceled the tender. It was an episode of one-axis negotiation, with an unhappy ending, so to speak. The first bidder was asked to lower the purchase price of the last auction, which was not accepted and the Egyptian authorities canceled the auction.
From our point of view, as analysts, we can say that it was a negotiation error. Wheat has the same potential status and it made no sense to use such leverage in negotiations when the USDA generated a report of global production declines and a decrease in stocks compared to September 2021.
As expected, the market revived on October 14 and 15, respectively, and at the end of the day, the indications of CPT Constanța amounted to 266-267 EUR/MT for wheat with 12% PRO quality.
The effect was therefore reverberated in the context of the Black Sea basin and was added to a simultaneous “sell off or profit taking” action generated by investment funds. As you can see in the inserted chart, we have a pronounced V, which started after the release of the report, but it returned from October 14, so the end of the trading session on October 15 generated a much higher indication than before the report.
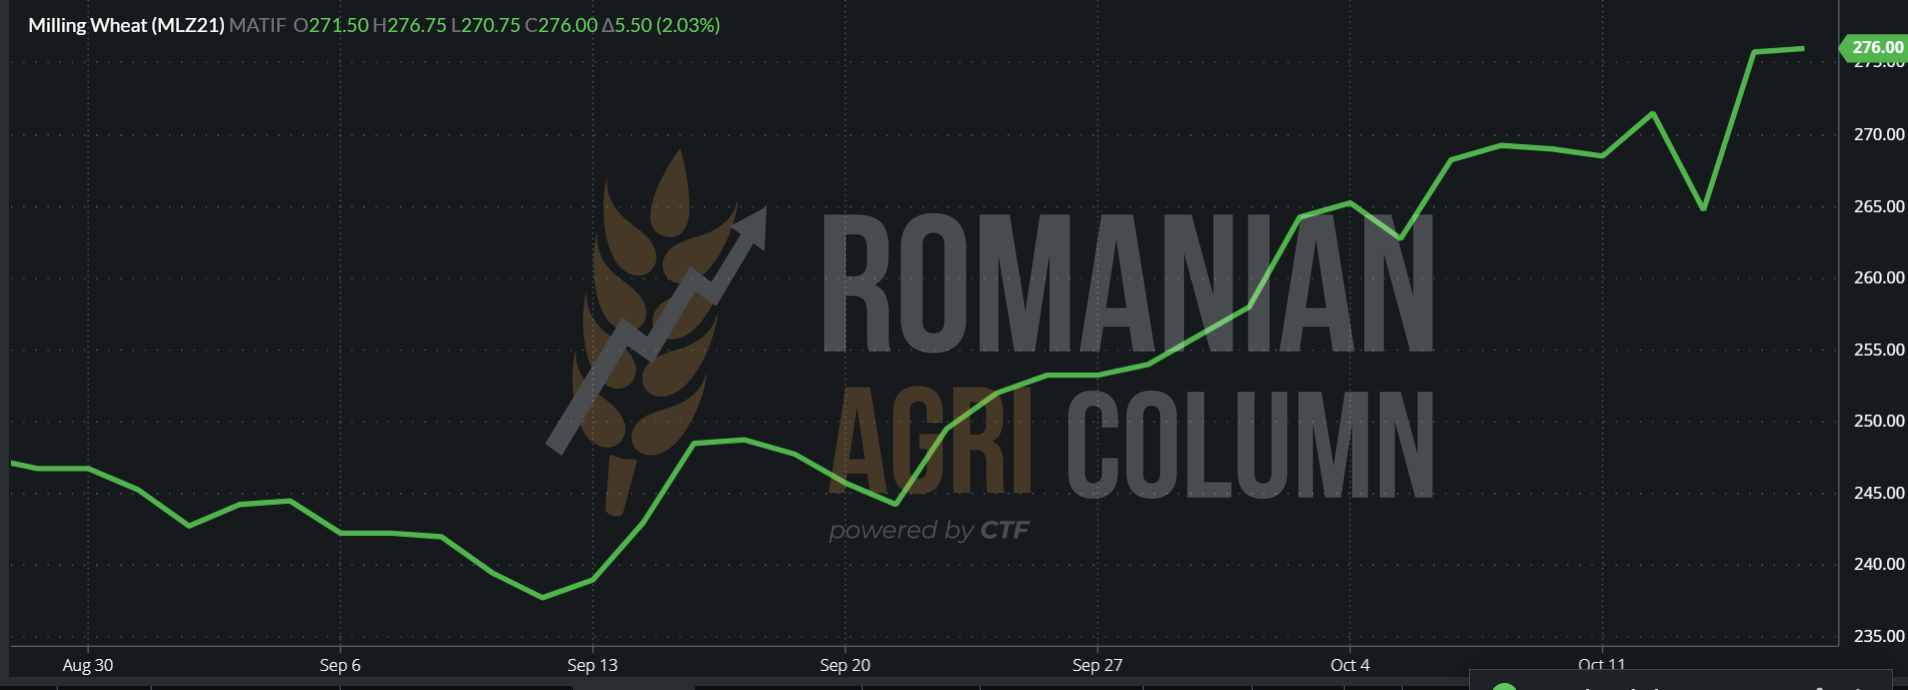
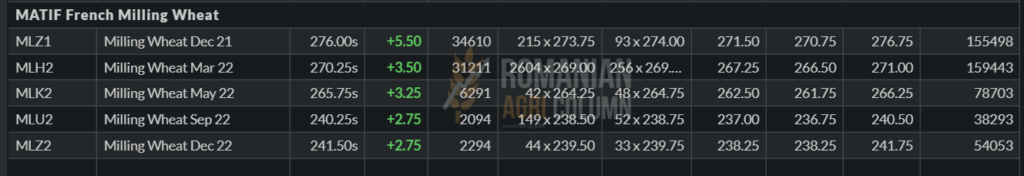
The close of EURONEXT on 15 October 2021 led to quotations at 276 EUR MLZ21:
To draw a primary conclusion, the decline in EURONEXT was generated by investment funds, followed by Egypt’s refusal to buy in the last GASC auction.
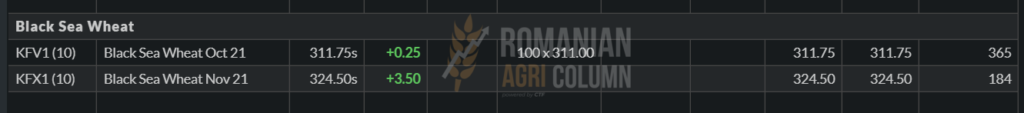
BSW (Black Sea Wheat) returned and exceeded the values before the release of the report, namely 321 USD/MT for November 2021, now having the value of 324.5 USD at the close of the trading session on 15 October 2021.
We note the start of wheat harvesting in the Rio Grande del Sul region – Brazil, an area with a potential of 3.5 million tons. In the North American region, the rains alternate with the areas with water deficit in the soil, and the days with temperatures close to the negative ones start to repeat with a higher cadence. We are talking here about American winter wheat, although it is too early to pronounce a verdict. Wheat has a very high recovery capacity and are varieties adapted to the conditions in North America.
However, on 14 October 2021, Turkey opened a tender for the purchase of 300,000 tons of wheat, the deadline for which was 21 October 2021. On the same day, however, Jordan canceled the tender for wheat for which it had received 5 offers, 4 from Romania and one from Ukraine. A second mistake after that of Egypt, managed by the new CEO of MIT, the man who was said to be a skilled negotiator. Unfortunately, both destinations were misled by the “profit taking” carried out by the funds, leaving out the information from the physical market of the EU and the Black Sea basin. American and Australian wheat do not have a capacity to penetrate the Middle East. The American one has a high logistic cost and a weakened crop, and the Australian one has the non-performing logistics in terms of costs.
Thus, we have an extremely strong new signal about the demand for wheat at the level of the Black Sea origin.
In a very concise summary, the wheat figures after the report show a decrease of 4.4 million tons in world production, a decrease of 6 million tons in global stocks and a decrease in residual consumption of 2.58 million tons also globally.
However, at a glance compared to 2020, we see a deterioration in the level of stocks of 11.18 million tons, as well as an increase in consumption by 5.88 million tons. If we look at production, compared to last year, it is only 1 million tons higher. The conclusions are extremely simple to state: lower stocks, higher consumption, the same production.
At the same time, we note a discrepancy between the WASDE report and the statements of Iranian officials regarding the import demand from that country between March 1, 2021 and March 1, 2022. The USDA estimates the level of Iranian imports at 4.5 million tons, but Kakeh Zargaran, CEO of the Grain Supplying Association of Iran, told Reuters that Iran will import more than 8 million tons of wheat between March 2021 and March 2022, due to the worst drought that has affected Iran in the last 50 years.
We add with the fact that France Agrimer announced the decrease of production by 0.5 million tons, the USA by 1.4 million tons and Canada by 2 million tons and we see with different eyes the wheat route in 2021-2022. A possible compensation could come from Russia, but, despite the declarations of the Russian officials reaching a crop level of 74-75 million tons, USDA keeps them at the level of 72.5 million this month too. Australia is far from our area. It plays in Asia and, despite a rich harvest volume perspective, logistics drastically penalize any attempt to penetrate the Middle East and North Africa.
CBOT followed exactly the same trajectory as in the case of EURONEXT, the funds coming out through “profit taking” in the days before the WASDE report. We follow the same chart, ZWZ21 CBOT SRW, and compare the day of the report release and the two consecutive days after the report, as well as the closing of October 15, 2021.
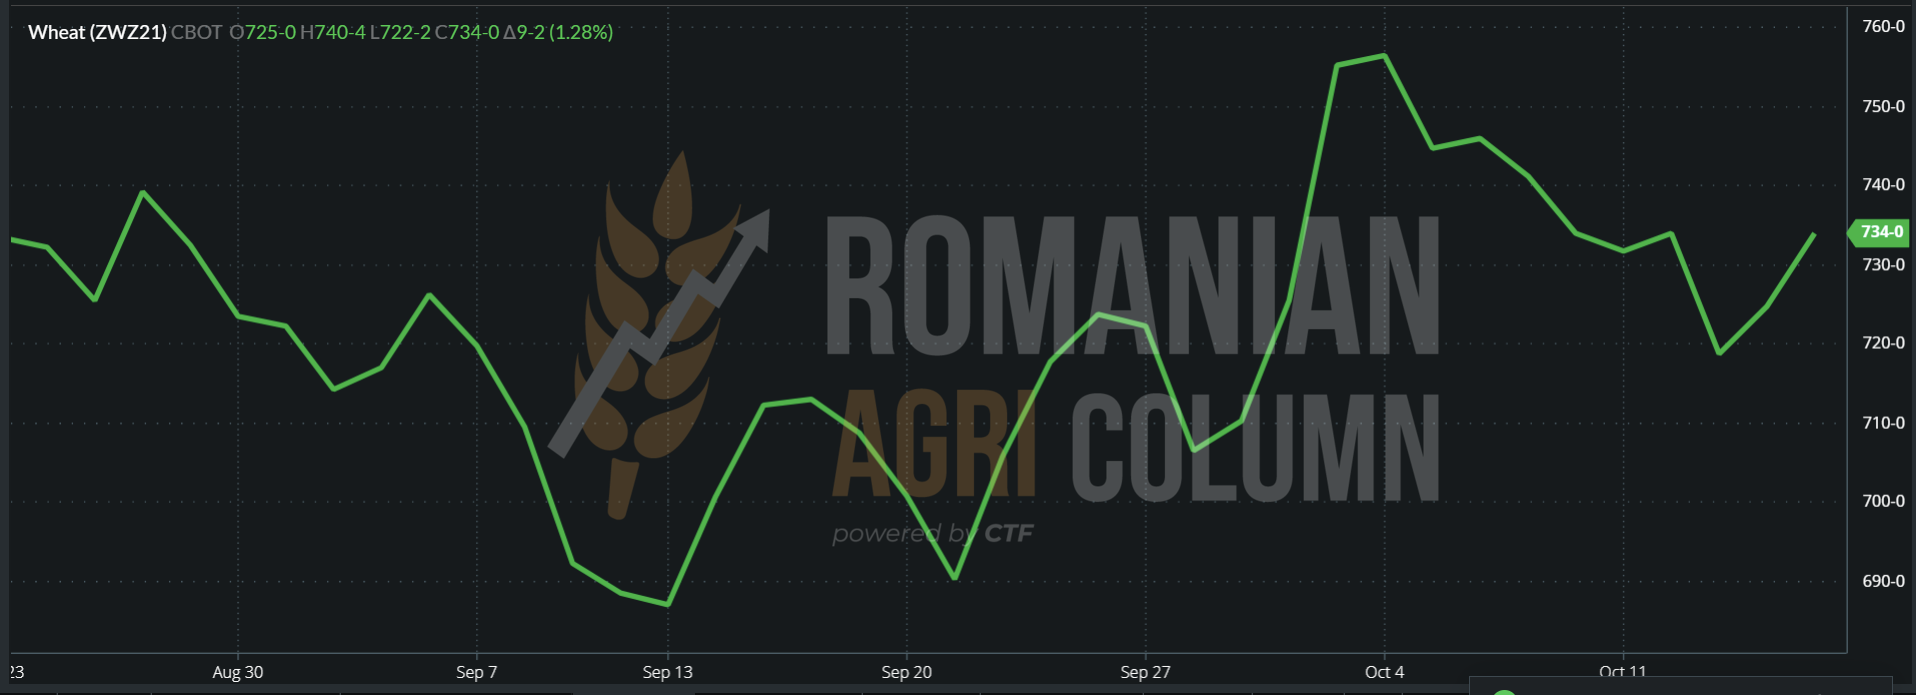
Closing of 15 October 2021 ZWZ21 CBOT SRW and KEZ21 KANSAS HRW

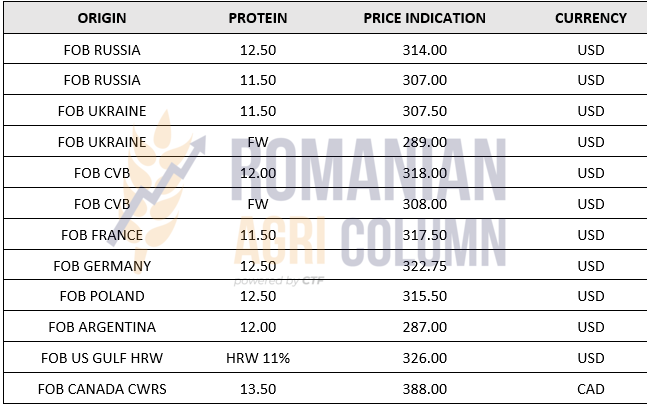
GLOBAL ORIGIN PRICE INDICATIONS IN FOB PARITY
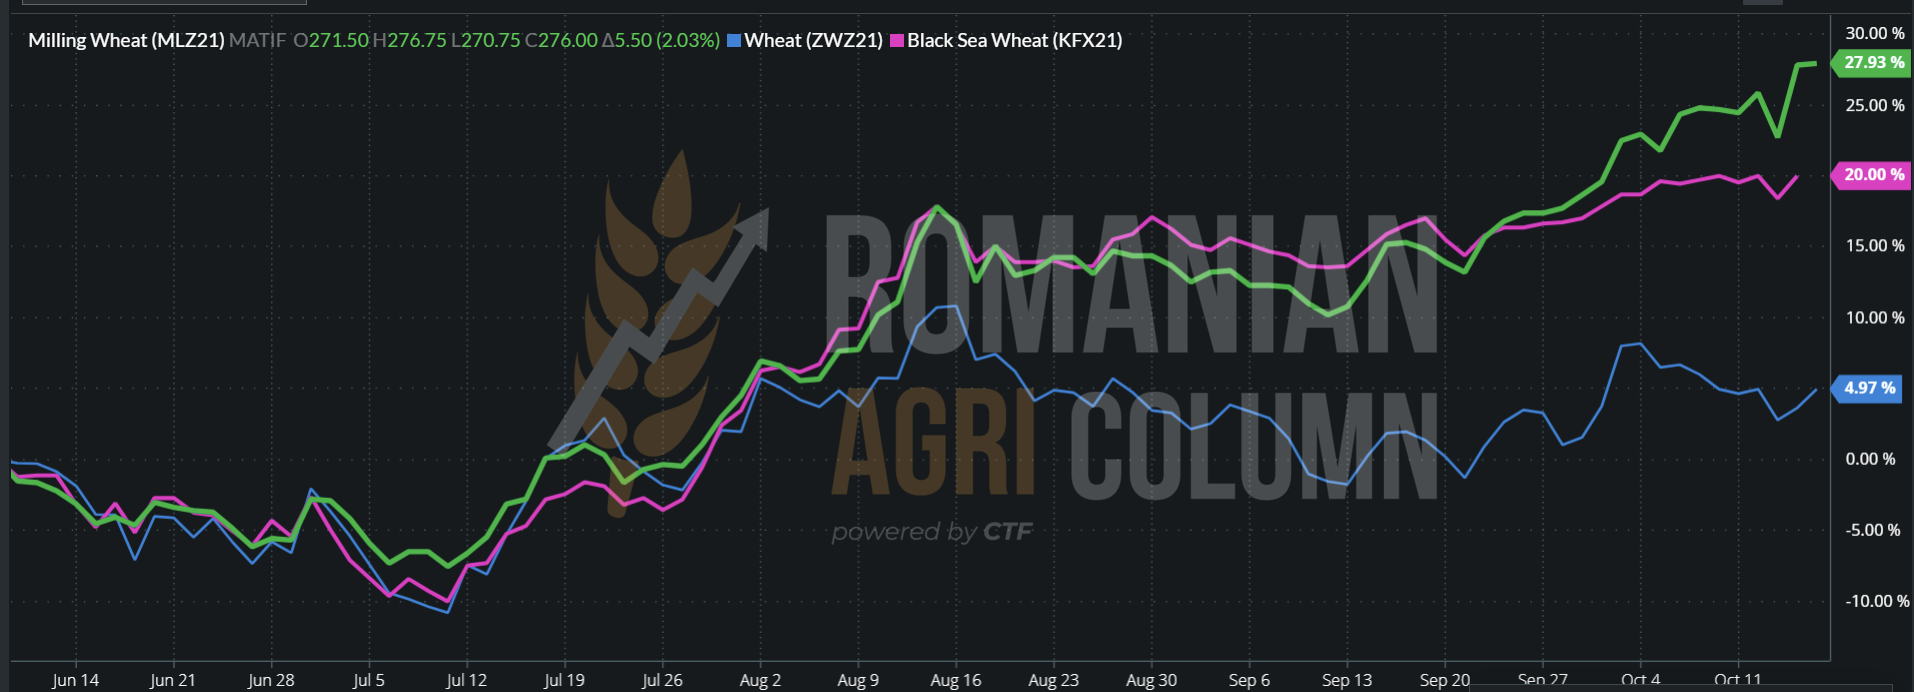
THE COMPARISON BETWEEN THE THREE ACTORS:
- EURONEXT MLZ21 (green line)
- BSW KFX21 (pink line)
- CBOT ZWZ21 (blue line)
The poles of interest of the origin of the wheat are clearly visible – Europe and the Black Sea.
ANALYSIS
- The two-day slump in the price of wheat was generated by the shares of investment funds, which liquidated their positions and extracted their profit.
- The return was normal. Demand and supply are intertwined, as they were until October 12, augmented even by additional cuts and higher import figures from Iran.
- Shares in the tenders also provided support – Jordan and Turkey versus Egypt, which canceled a tender with the feeling that prices will moderate.
- Egypt generally buys about 4 million tons by January 15, and at this time, in the Black Sea basin, they bought 2.35 million tons, so the potential is in place in the region. The US will not be able to compete too much for two reasons: LOGISTICS penalizes and wheat CROP is weak.
- THE RHYTHM OF PLANTING is very difficult in Russia. They already have a delay of 1.5 million hectares, and in some regions, the planting window has closed. It is something that must be kept under close observation in the future.
Barley market
The same status of barley in terms of its price in Romanian origin. The CPT Constanța indication remains at the level of 225-227 EUR/MT. However, there is a liquidity of goods, which begin to move between sellers and buyers.
The physical market returned through Jordan, which secured a batch of 60,000 tons of barley with delivery January 15-30 CFR Aqaba, at a price of 329.75 USD/MT.
This month, we saw new barley production cuts globally. Thus, Canada reduced by 0.7 million tons to barley production by 7 million tons. The European Union also reduced 0.3 million tons of barley to 54.3 million tons, and Russia was reduced by 0.7 million tons to 17.3 million tons.
In terms of barley exports, the following countries were again reduced in terms of potential:
- Russia by 0.5 million tons, up to 4.5 million tons and
- Canada by 0.4 million tons, to the level of 1.6 million tons.
Australia, on the other hand, increased its export potential by 1 million tons to a total of 8 million tons.
Destinations have also been revised. Thus, Turkey increases the level of imports by another 0.6 million tons, up to 1.8 million tons, Iran by 0.2 million tons, up to 2.2 million tons, while Saudi Arabia reduced imports too by 0.5 million tons, to the level of 7 million tons of barley.
ANALYSIS
- Barley remains attractive. The world balance indicates a deficit.
- However, barley does not rise to feed wheat. It still has to recover on the way.
- The winter months can level the gap between the two feed materials.
Corn market
The indications of maize decreased by 10 EUR/MT, in the CPT Constanța parity, to the level of 232 EUR/MT in the days following the WASDE report. The main motivation was, of course, a positive American ratio in terms of harvest volume level, which was slightly higher, mainly due to better production per hectare.
In Romania, harvesting is quite difficult. The only areas harvesting at the moment are those in the northern half of the country, but they will also stop soon. Romania is abundantly watered throughout the southern half and in the regions inside the Carpathian circle, i.e., the Transylvanian plateau.
Farmers in the Timiș area have reached a level of 20% harvest and their testimonies indicate a lower level of production than the initial estimates. The same happens in the extreme southern part of Romania, which experienced production reductions. But the middle and northern areas of the country, together with the Transylvanian plateau, restore the initial balance through higher productivity and thus, Romania is once again in terms of growth in the maize production area, at the level of 15 million tons.
Returning to the price area, after the decrease generated by the WASDE report, we noted buyers who had dramatically lowered the level, by about 17 EUR/MT in CPT Constanța, to the level of 223 EUR/MT. Others had dropped to around 226 EUR/MT. It was a false working premise, generated by uncertainty, fueled by the stock market area. But, as we said, the corn price route has a different rhythm and this timing is an integral part of it.
An impetus was needed and it came primarily from EURONEXT, where the funds re-entered, being granted and so the traction was brought back in the price of corn, shy, it is true, but violence in the spike will not be the engine of corn in this year.
EURONEXT initially decreased 9 EUR/MT and the primary price condition in the Constanța region had to be set according to the simple calculation formula: Basis – 10 euros in CPT parity. But the buyers, as we saw above, did not agree and were reluctant, going down even by 5 to 7 EUR.
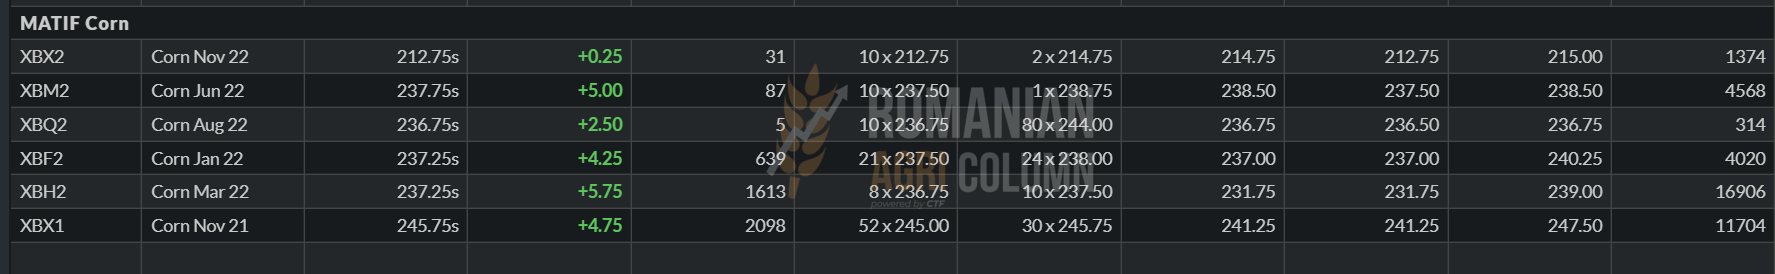
XBX21 EURONEXT October 15, 2021. The same V of decrease and increase as in the case of wheat.
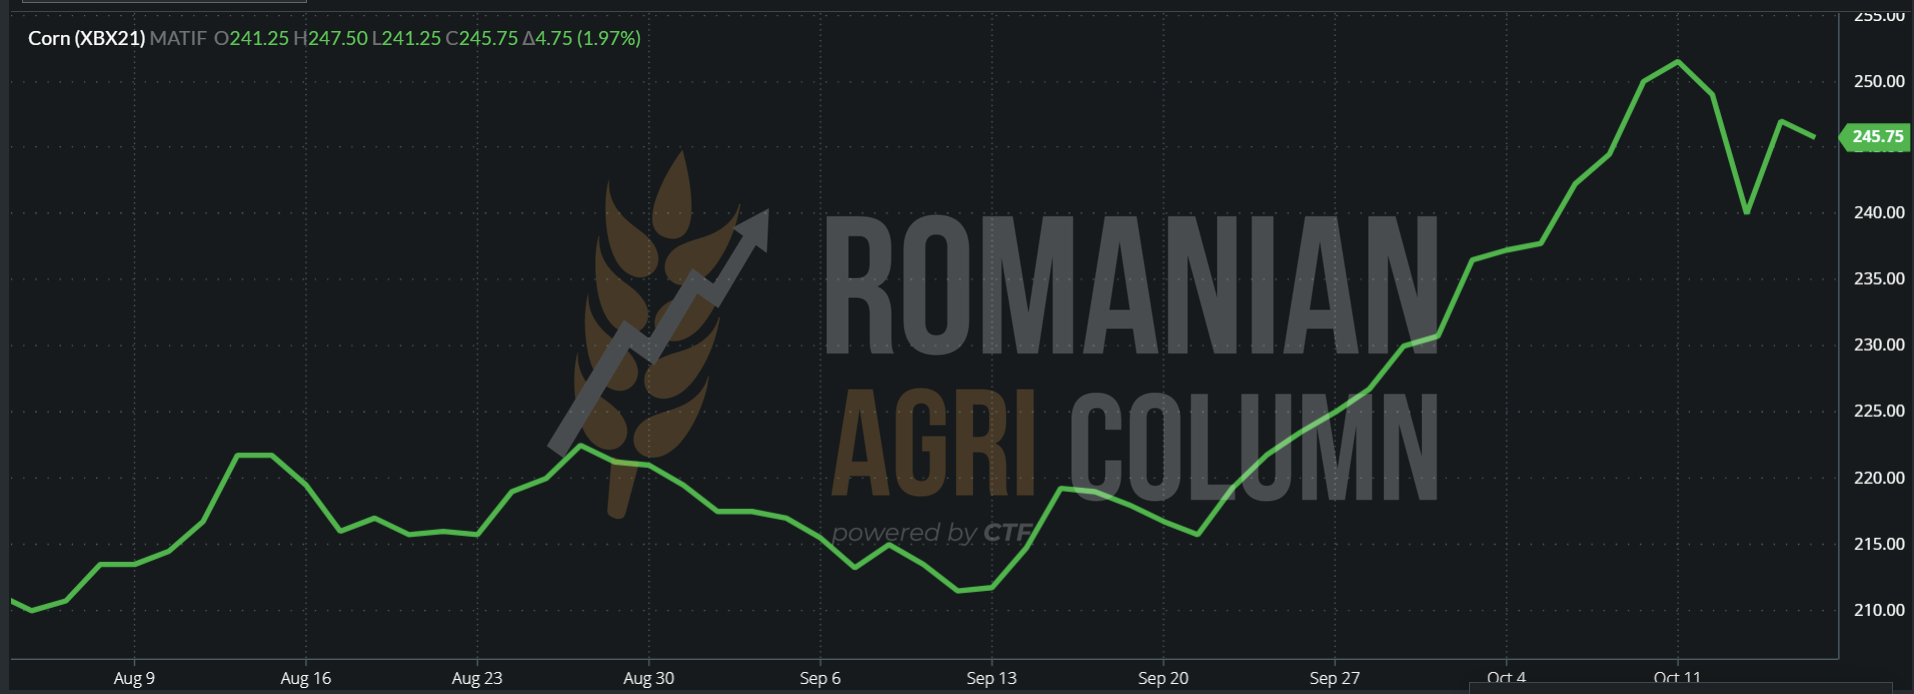
XBX21 15 October 2021 – 245.75 EUR
The corrections generated by “profit taking” were also fueled by the effects of the WASDE report, which indicated a stability between production and consumption. The report was somewhat identical to that of September. We have an increase in global production of 0.45 million tons, up to the level of 1,198,000 tons, a consumption with a very small decrease of only 0.16 million tons and a higher level of stocks by 4 million tons.
This last element, the larger stocks, stopped for the moment the route of the corn price. The balance between Production and Consumption has increased from 10 to 12 million tons.
But we note in the Black Sea basin decreases in production forecasts. Ukraine is reduced by 1 million tons to 38 million, which affects its export capacity. Russia is also down 0.5 million tons to 15 million tons. These two decreases make us look closely at the state and production of Ukraine. If 1 million tons were cut so easily, the deficit could certainly deepen.
However, the TMO tender from Turkey for 325,000 tons arrived in support of corn, which generated a price level between 306.9 USD/MT C&F Mersin and 317 USD/MT for C&F Karasu delivery. EX-ANTREPO prices ranged from 312.75 USD/MT Izmir to 319.25 USD/MT Bandirma. Turkish ports are extremely numerous and the price difference between them is made only by logistics. At the same time, their large number makes them very small, so that the congestion and unloading and operating times are very long compared to large ports, such as Constanța.
FOB MAIZE PRICES IN VARIOUS ORIGINS:
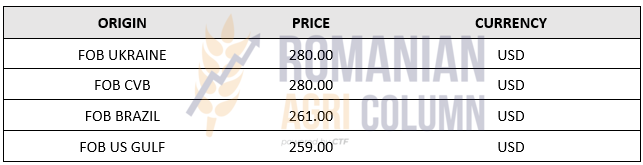
AN ESPECIALLY IMPORTANT DETAIL: Corn in the Black Sea basin remains much more expensive than American corn. Therefore, there is pressure in the pelvis as originating at this time. Logistics indicates an extremely large difference between the two origins, taking China as destination:
- USA – NE ASIA -> 83 USD/MT
- Black Sea -NE ASIA -> 65 USD/MT
- DIFFERENCE = 18 USD/MT
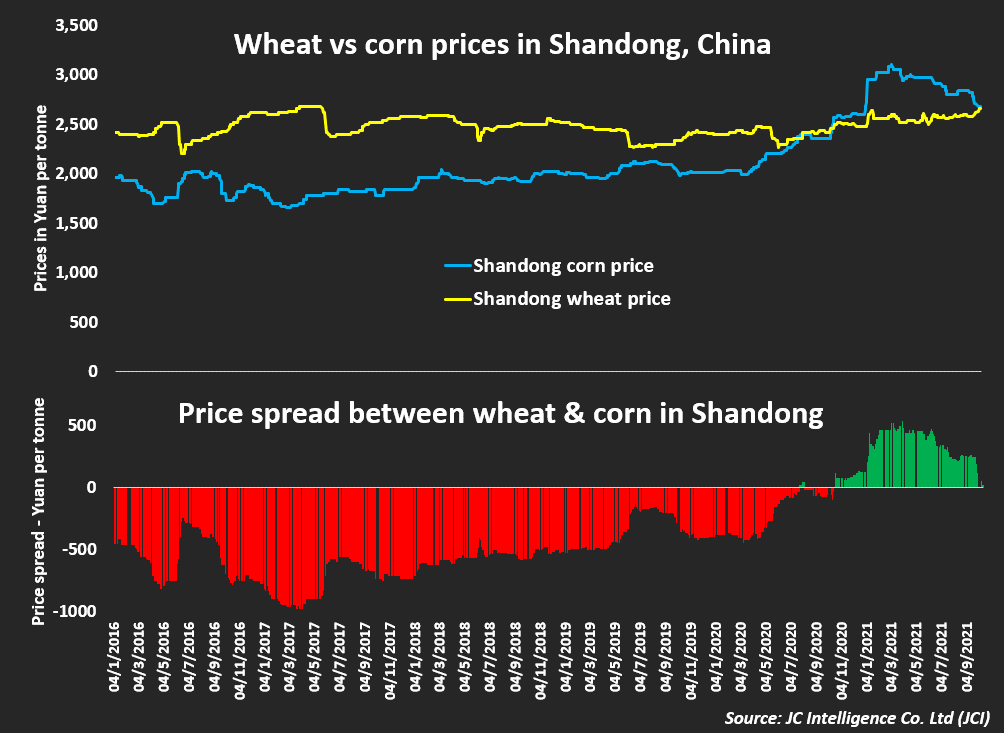
We also anticipate in past issues the time when China will return to corn in feed. The price of pork has started to rise on the Dalian stock exchange and thus becomes a traction for corn and soybeans. Corn is already facing rising wheat prices, so our forecast of a change in China’s corn feed again is gaining some certainty.
CORN PRICE vs. WHEAT PRICE in Shandong. Source: JC Intellgence
CBOT CORN ZCZ21- the same V model, lowering and return as in the case of wheat.
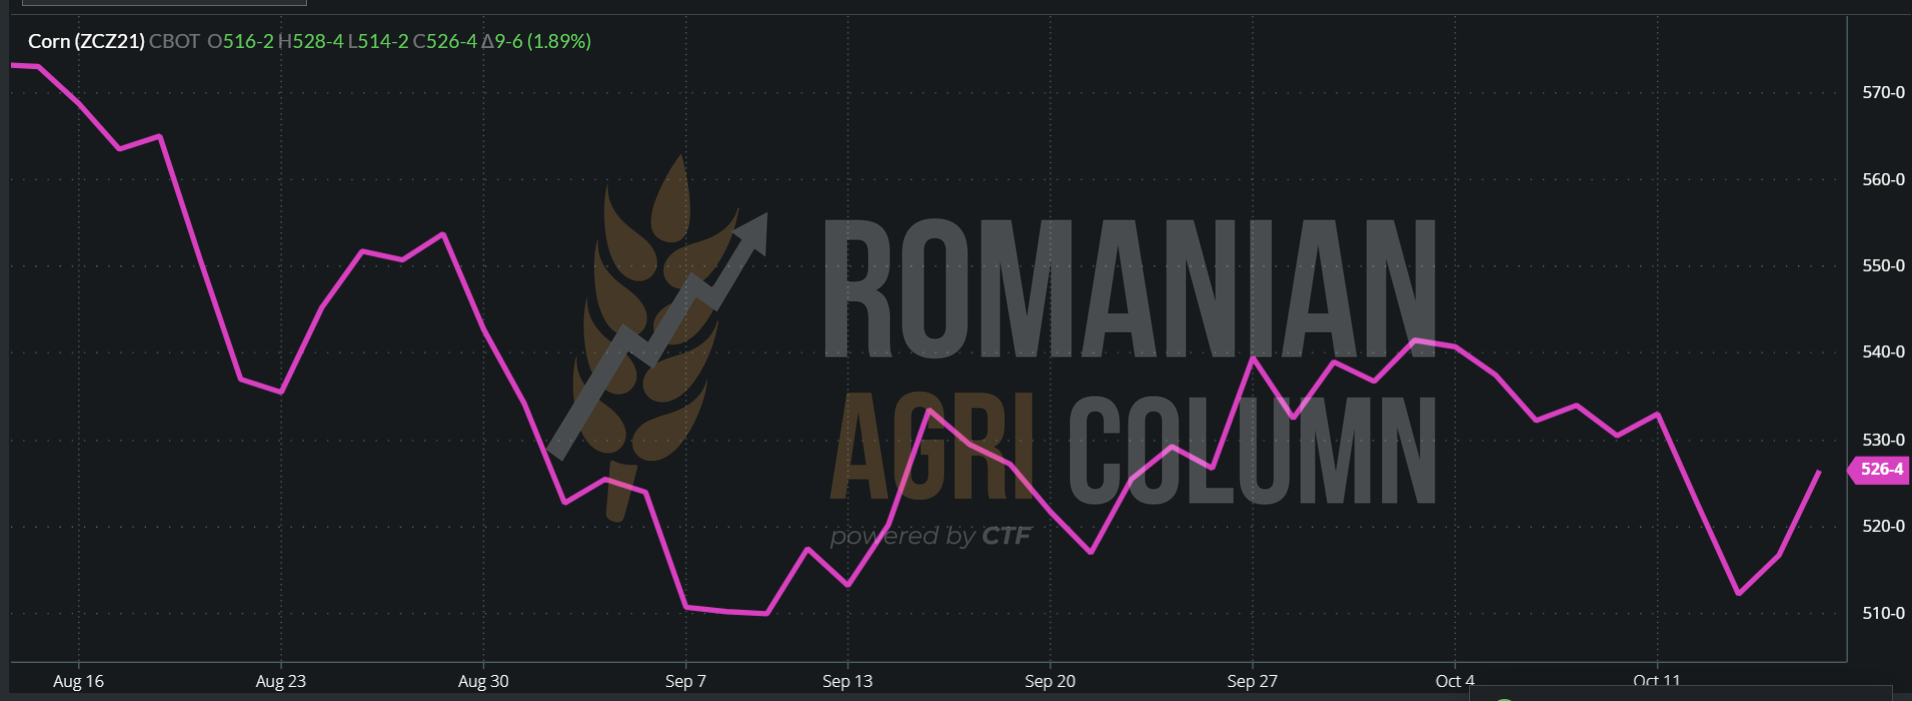
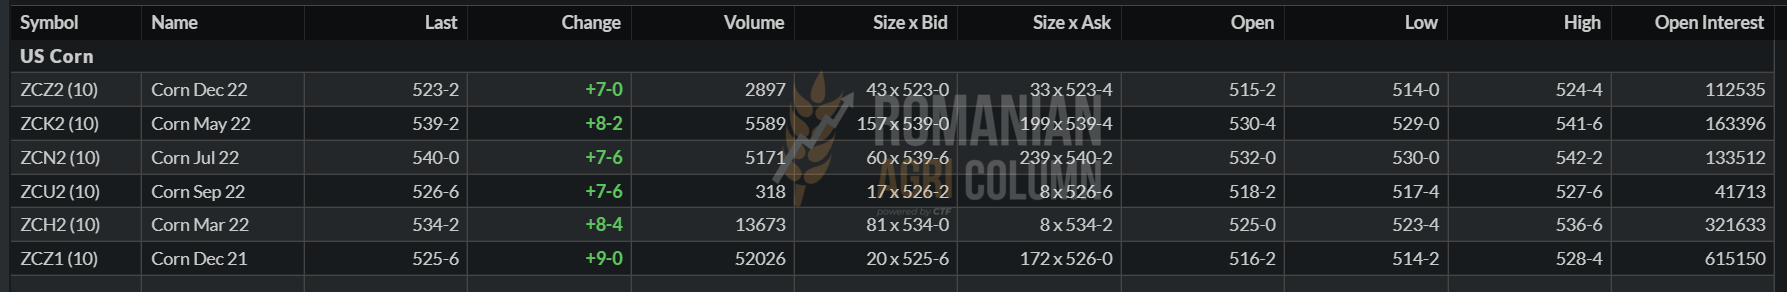
CORN ZCZ21: + 9 c/bu (+3.54 USD) in the session of October 15, 2021
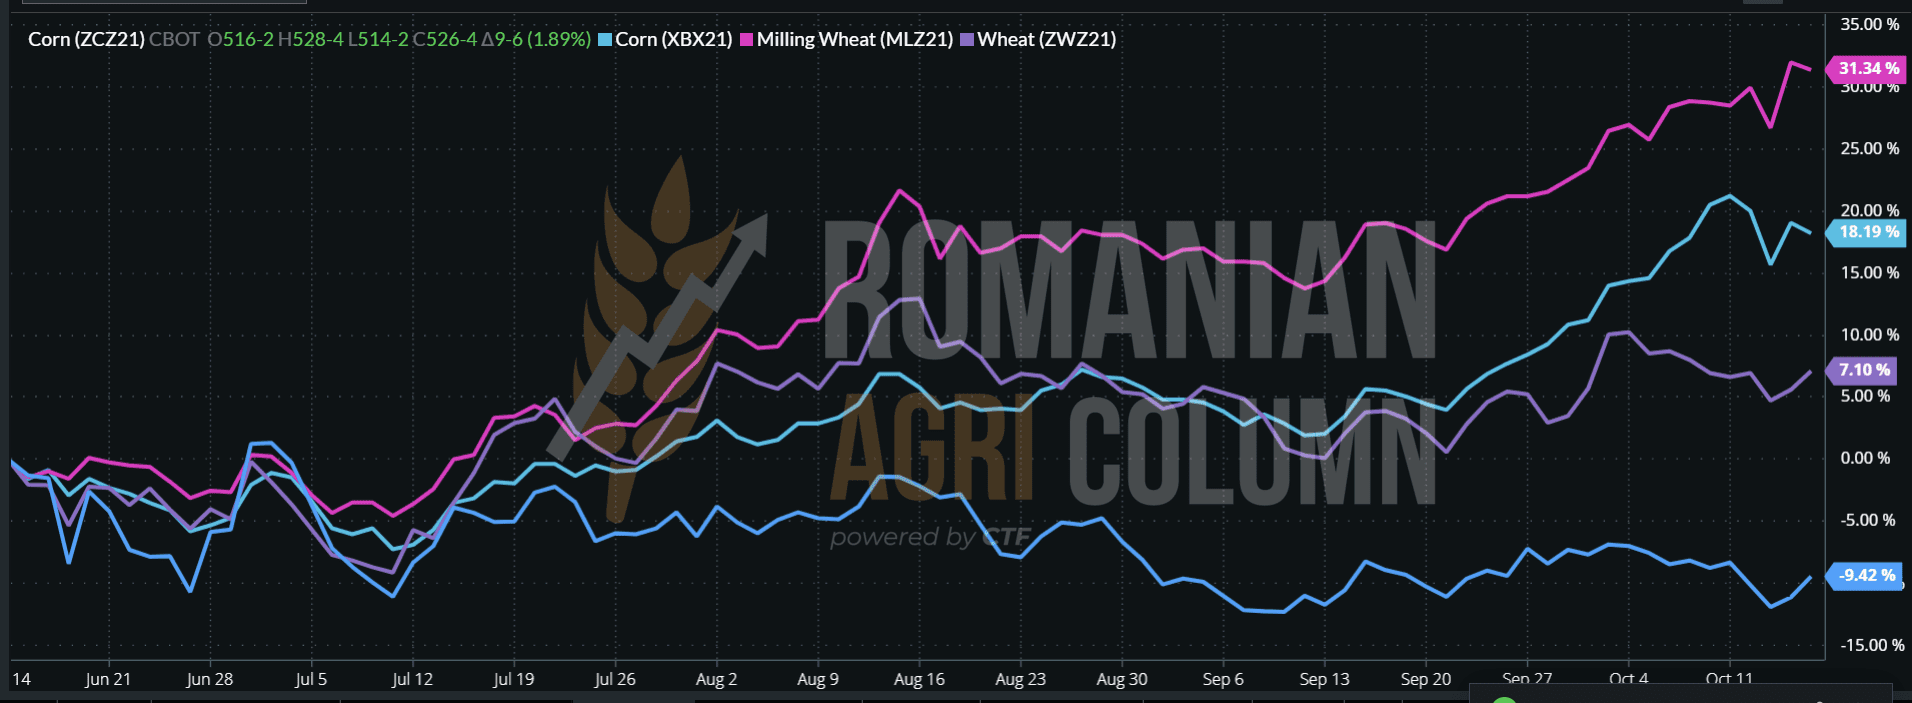
INDICATIVE COMPARISON: WHEAT CBOT + EURONEXT VS. CORN CBOT + EURONEXT
LEGEND:
- Light Blue – EURONEXT CORN
- Dark Blue – CBOT CORN
- Magenta – EURONEXT WHEAT
- Purple – CBOT WHEAT
ANALYSIS
- Maize was penalized in price by the positive ratio of stocks globally.
- Corn was also penalized by the “profit taking” action of the funds.
- The support of maize in the Black Sea basin comes from the Turkish tenders and from the production declines in Ukraine and Russia.
- Romania receives a crop upgrade up to the level of 15 million tons.
- In China, the price of pork is rising, and the price of wheat is meeting the price of corn, followed by the change in feed from wheat to corn.
- The route of the life cycle of maize is at the beginning and develops at a slower pace than that of wheat, but it is a positive and enduring one.
- Corn remains a positive bet. However, development remains at a slower pace, but in the long run, it remains a very good option.
Rapeseed market
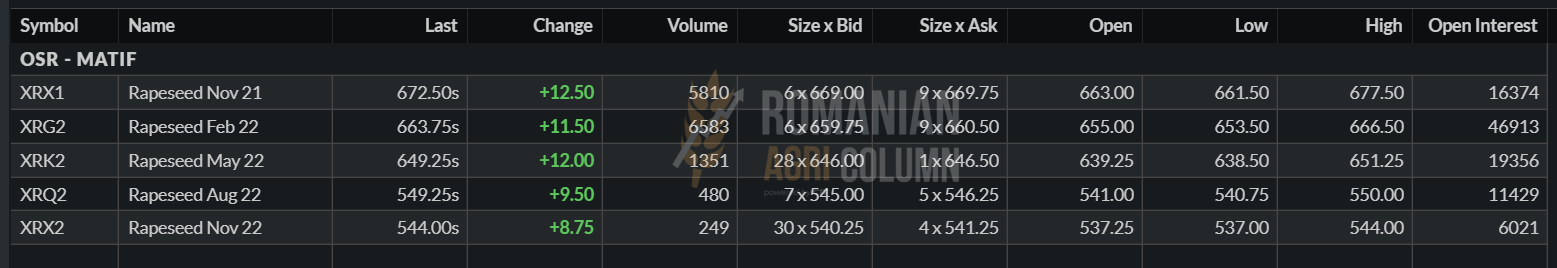
The indications of rapeseed are in the same sinusoidal trajectory, exactly like a wave with large amplitudes – large decreases and ascents. Everything is dictated by the fact that the demand exists, but it is correlated with the fossil energy and thus we have the extreme oscillations of the order of 2 digits in the EURONEXT indications.
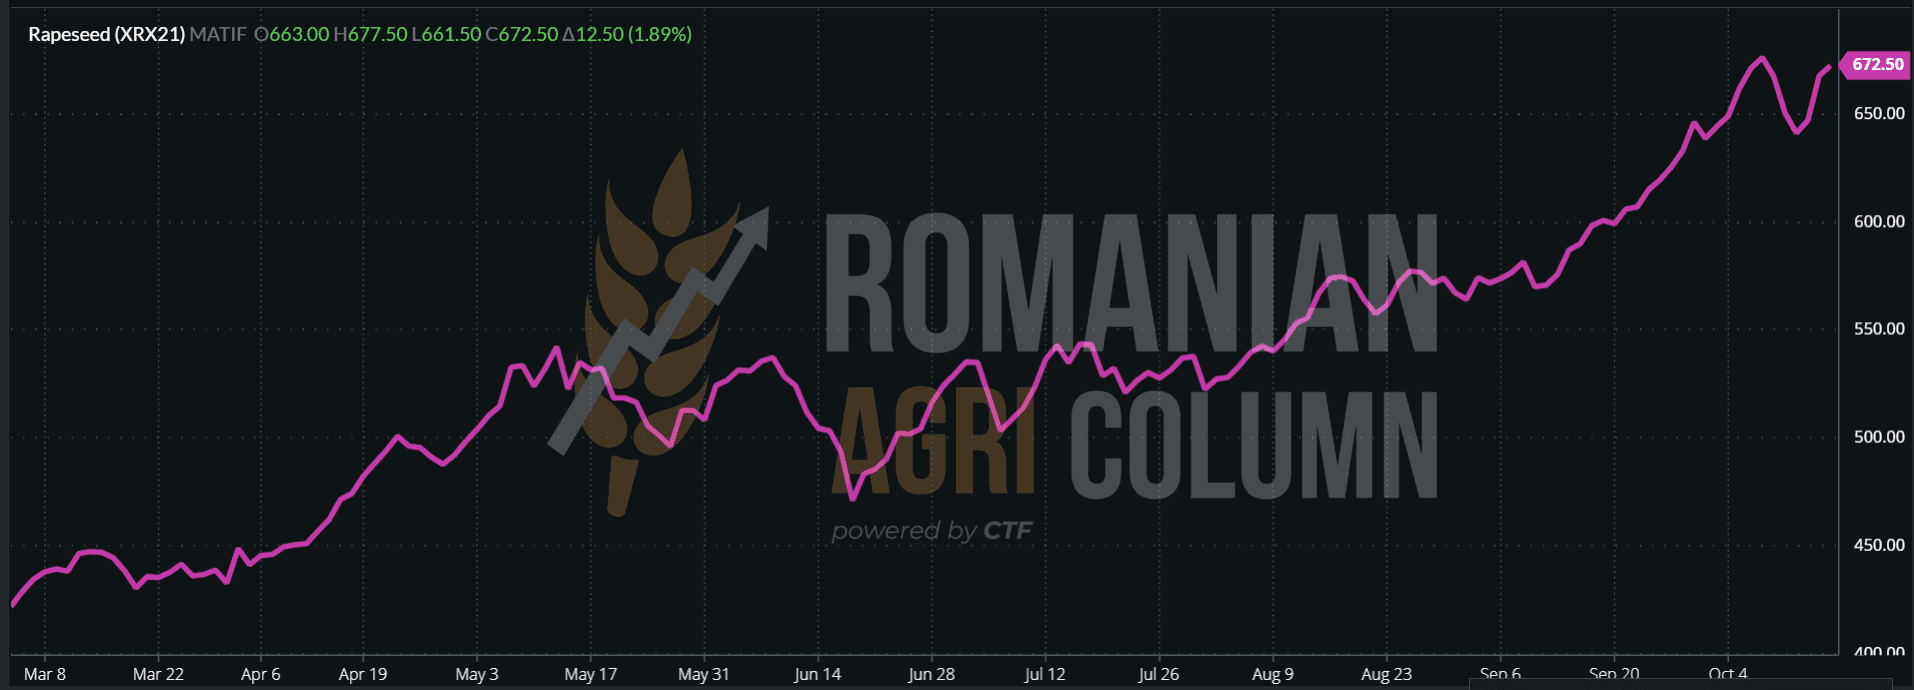
The closure of 15 October 2021 repositioned rapeseed at 672.5 EUR.
As we mentioned in the last issue, the shortage of rapeseed continues, fed by Canada, which is again low to the level of 12 million tons of production. Australia, which is a compensator in this regard, is failing to cope with the deficit.
The European Union is Australia’s largest export market. The decline in Canadian supply has led to high EU canola prices (Canada accounted for 38% of EU canola imports in 2020-2021). Estimates show that the price of rapeseed in the EU will remain high between 2021 and 2022. Although the price of rapeseed in the EU has averaged 78 USD/MT above the Australian export price since March 2021, this price difference is not expected to persist. This is due to the fact that the price difference was caused by the sharp decline in Canadian supply, following the evolution of the EU canola price into the Canadian canola price. Record exports of Australian canola are expected to ease the tightness of the EU supply, supporting a convergence of Australian and European canola prices in 2021–2022.
Canada dominates world canola exports. As a result, low Canadian production has tightened world supply. The price of Canadian canola is expected to average 701 USD/MT in 2021–2022, 63% above the 5-year average by 2020–2021. The decline in Canadian supply has increased demand for Australian canola, supporting higher prices.
The export price of canola to Australia is estimated to increase to an average of 812 AUD/MT (617 USD/MT). This is driven by declining Canadian production, leading to a tighter global supply. World stocks are expected to fall to their lowest level in ten years.
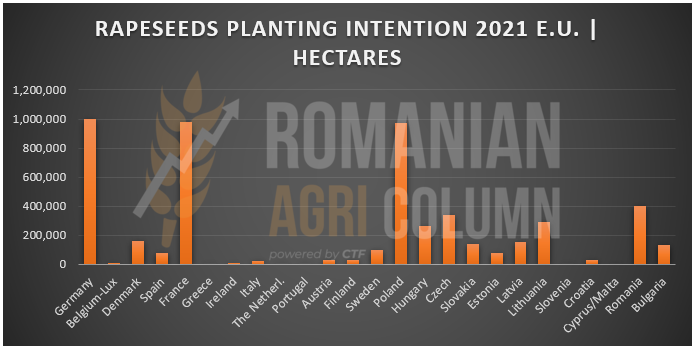
World rapeseed production is projected to be 3% lower in 2021–2022 due to reduced Canadian production. In other major growing regions, high production is supported by favorable seasonal conditions. For the European Union, production is expected to increase by 5% to 17 million tons in 2021–2022. For Ukraine, favorable yields are expected to increase production by 11% to 3 million tons in 2021–2022.
Chart on the intention to plant rapeseed in the EU in 2021
ANALYSIS
- Rapeseed continues to be strong due to constant demand and the depreciation in Canada.
- Price convergence for antipodes rapeseed, which is demanded in the European Union, will not take place soon, so the high-level projection is assured for a few more months.
- Rapeseed will continue to play an important role in the structure of cultures in the EU and important regions of origin. Its support comes from other uses that are in development at the moment, but will become very important in the years to come.
Sunflower seed market
After several days of stagnation in price indications, due to uncertainty over the VEGOIL complex, especially soybeans, which was quoted at low levels following the WASDE report, price indications returned, especially from very powerful internal processors.
Awareness that the goods are stored and no longer comes out so easily that during the harvest made the indications of Important factories to rise to the level of 660-670 USD/MT DAP. The port of Constanța generates the same competition, at the level of 660 USD/MT.
The price of crude oil varies almost daily. It has increases of 20-25 USD/MT and decreases of 10-15 USD/MT. Everything is governed by supply and demand in areas of interest as destinations.
Our forecast of reaching the level of 700 USD/MT for sunflower seeds does not change. This is perfectly possible in the context that we evoke in each report, namely that Romania is the only origin for the raw material. A new leap will occur when Turkey, which has experienced a severe drought, will generate demand from Romania. However, this could happen earlier than our estimates, namely near the beginning of December 2021.
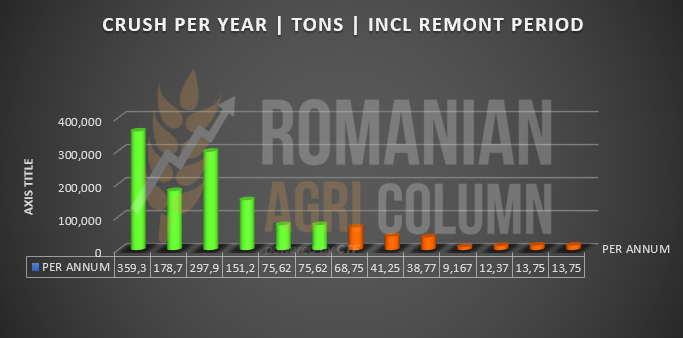
We insert in our report a graph of the processors in Romania, but respecting the confidentiality of their names. We will see the peaks, i.e., the most efficient and representative and we will see the group of those who have limited processing capacity, but are present and influence the market due to the demand they make and thus become local competitors in certain areas of origin of large processors.
We therefore have a segmentation into two categories, TIER 1 and TIER 2. The differences between the two groups are, first of all, related to how much they manage to process per year and to the manufacturing standards of sunflower oil. We increase the expression “how much they manage to process” because it is not the same as their processing capacity.
However, if there were measures to compensate for the exodus of raw materials and to create a framework harmonized with European legislation, they could process much more, could have access to a competitive raw material market throughout the year.
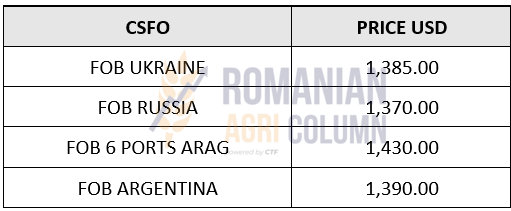
FOB ORIGIN INDICATIONS FOR CSFO
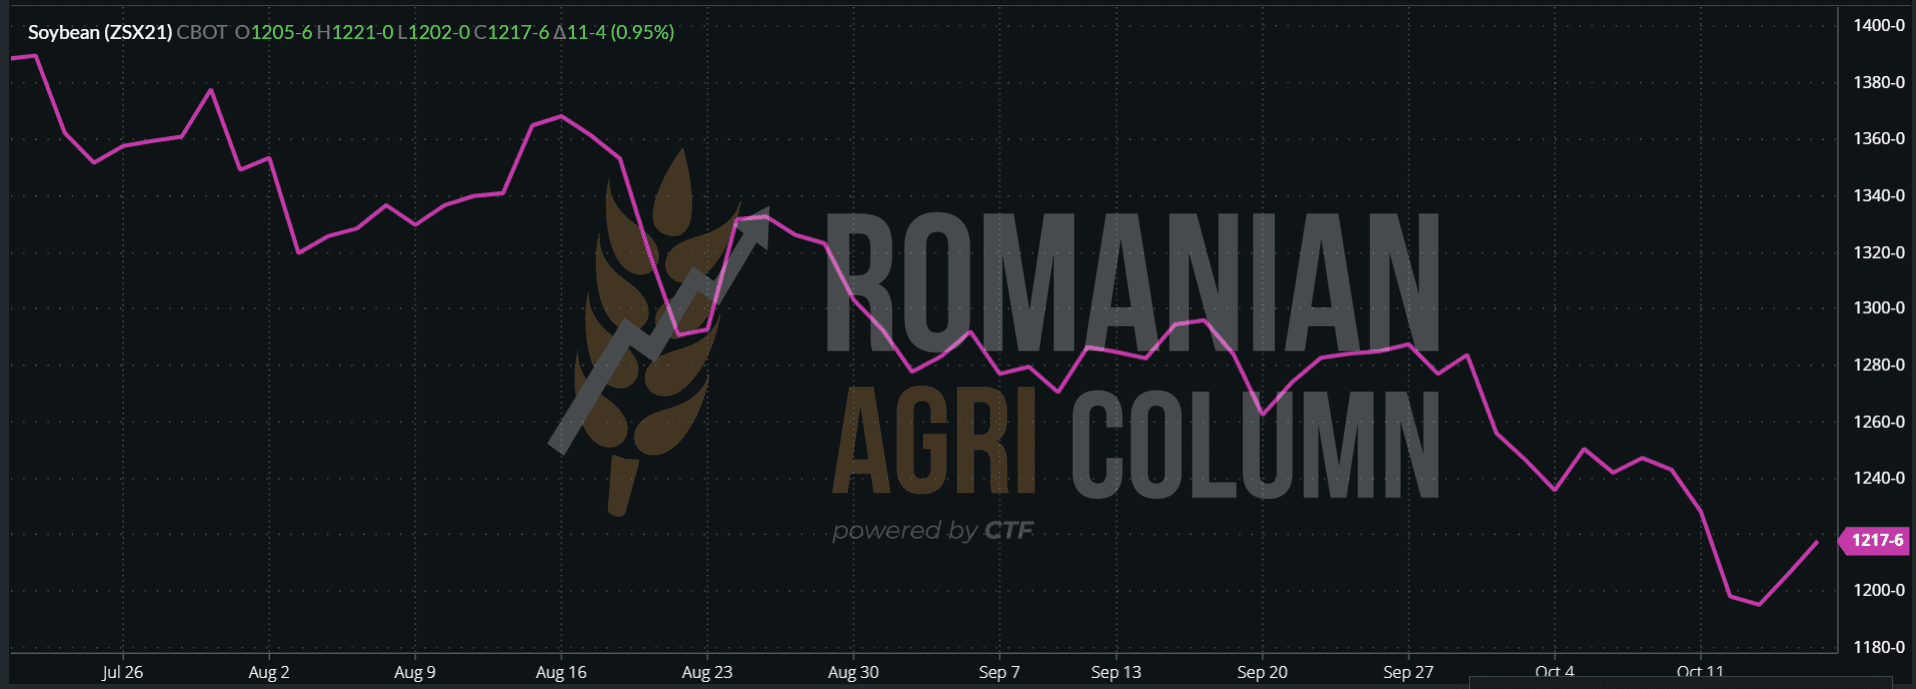
The soybean market
The WASDE report generated an excessive decrease in the price of soybeans in CBOT quotations. A very good AmericanCROP, boosted by the spectrum of poor sales to China, caused the indications to fall sharply by about 30 c/bu (11 USD/MT) when the report was released.
An additional 2 million tons of soybeans in the US production forecast weighed extremely heavily, and the announcement made by CONAB that Brazil will harvest 140 million tons of soybeans next season compared to 136 million in the previous one accentuated the descending slope.
But at the end of October 15, 2021, we found ourselves in a completely different landscape. Stimulated by the low price, the destinations began to buy from the US and we see in the reports of traders to the USDA the following volumes:
- 396,000 tons reported for export, without a known destination;
- 326,750 tons reported for late delivery but no known destination;
- 132,000 tons reported for delivery to China.
CBOT did not take long to react and thus, at the end of the trading session on October 15, 2021, the soybeans began to recover from the loss displayed after the WASDE report. We have a level of 1,217 c/bu, equivalent to 447 USD.

ZSX21 CBOT chart from October 15, 2021
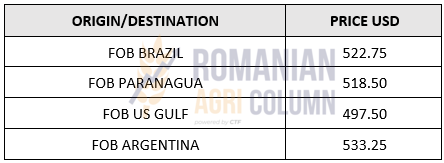
ORIGINS FOB PRICES INDICATIONS FOR SOYBEANS
In Romania, the interest in soybeans remains as wide. Differences between buyers are generated only by the quality levels expressed in the contracts.
We are talking about the minimum and maximum level of humidity, the minimum and maximum level of protein, the level of minimum and maximum broken grain content and actually about the related penalties that can get very large.
Transactions in recent days have revealed levels of 650-660 USD/MT EX Farms, destined for external processing units, a sign that the soybean export market is developing. But, as we know, Romania is a net importer in this regard.
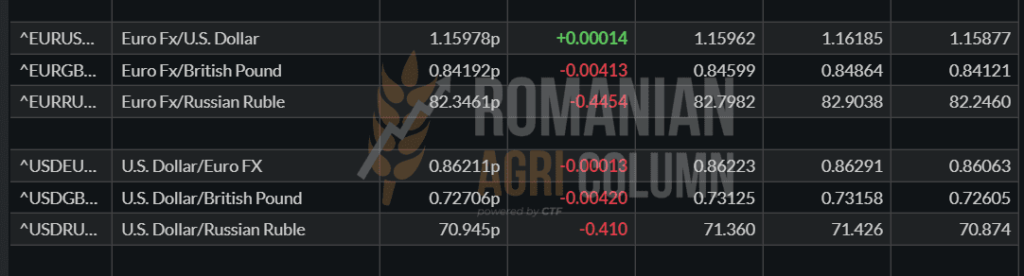
CURRENCY – AFTER A DECREASE AGAINST THE EURO, THE USD RETURNS TO 1.16 VS. EUR
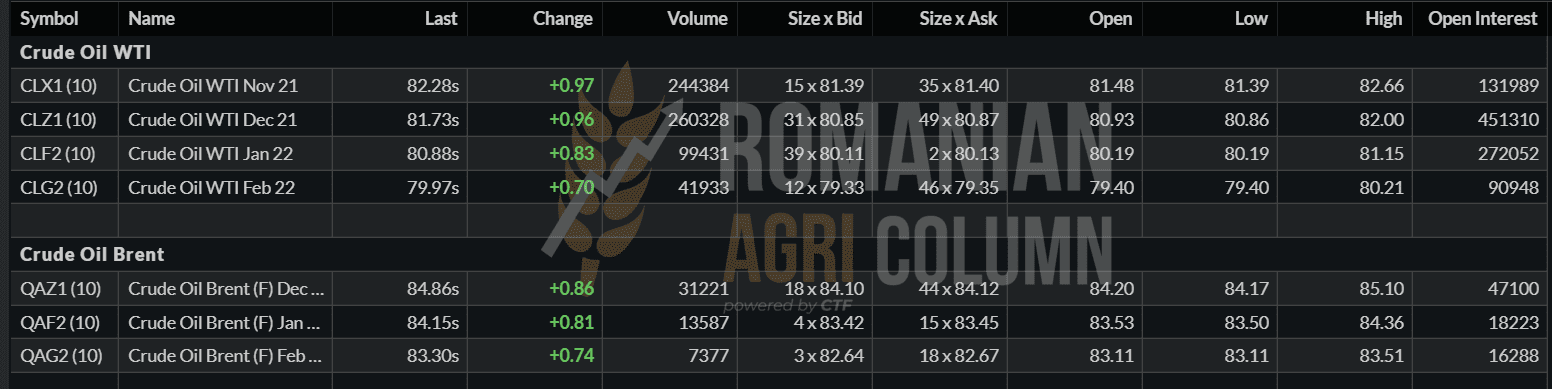
ENERGY – APPARENT STABILIZATION AROUND 85 USD/BARREL BRENT, BUT INCREASES APPROACH TO WTI
Weather forecast
16-25 October 2021
Romania
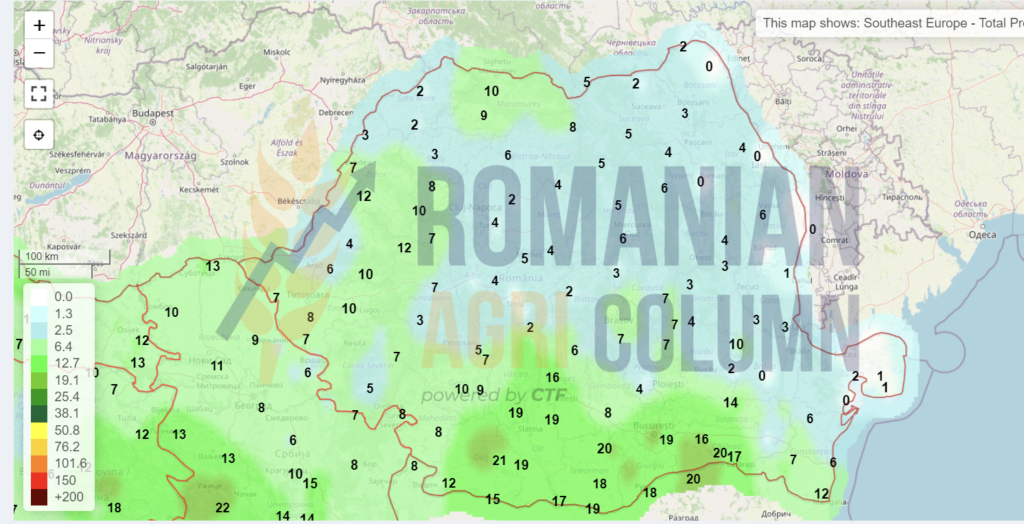
Europe

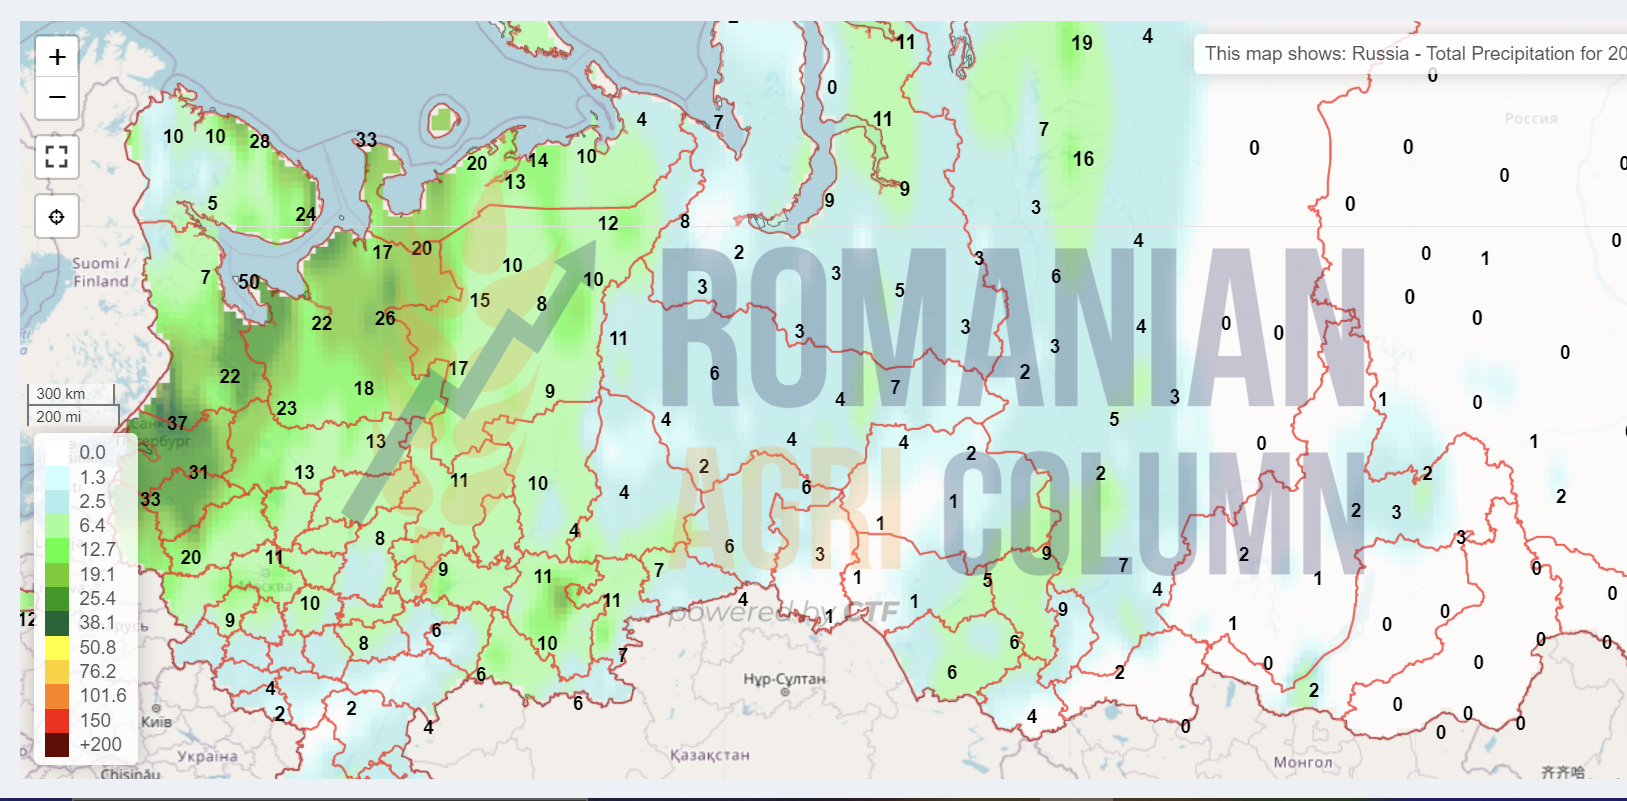
Russia
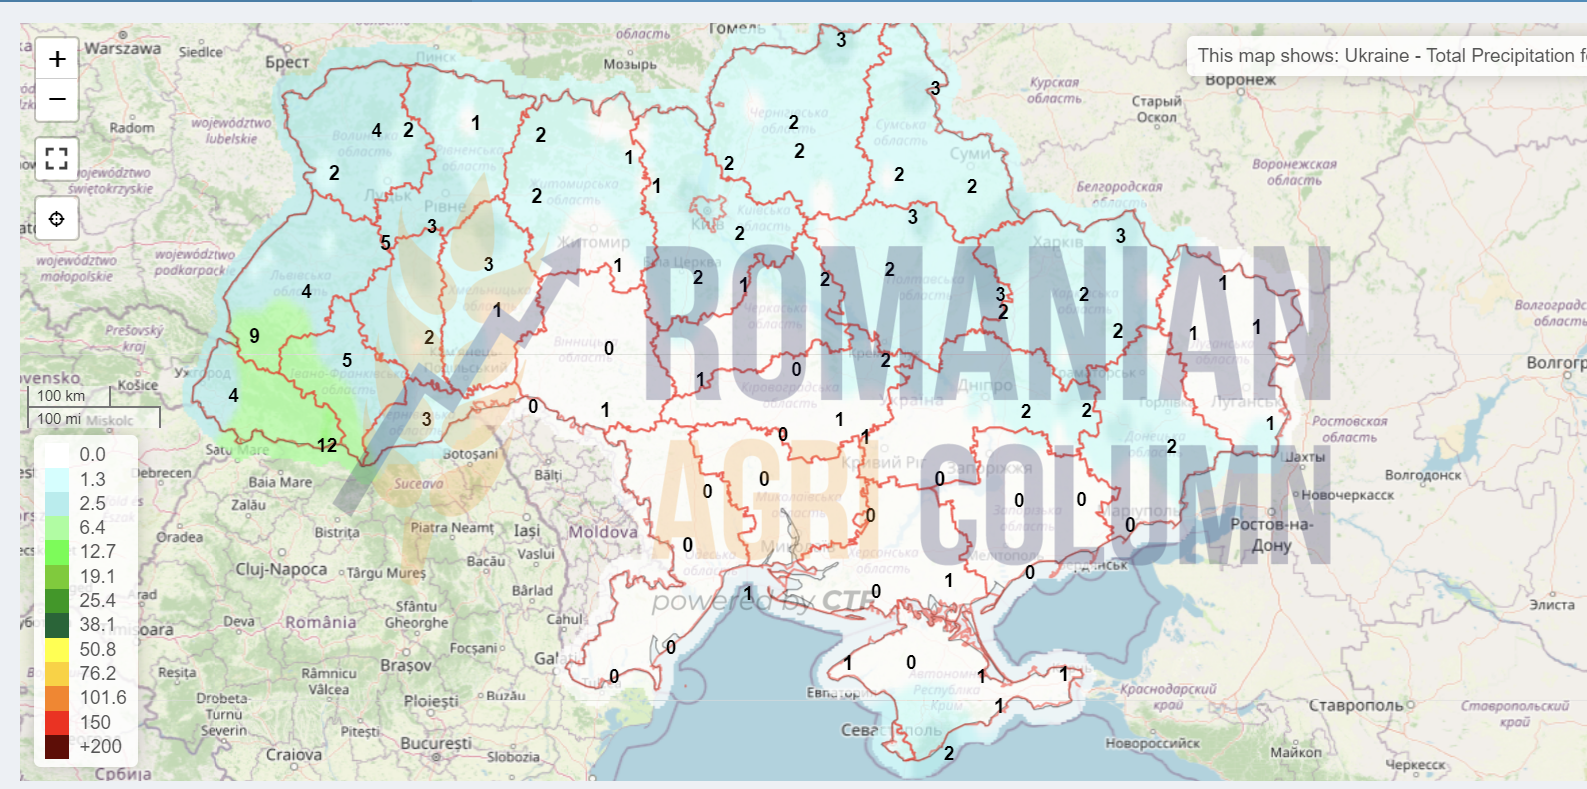
Ukraine
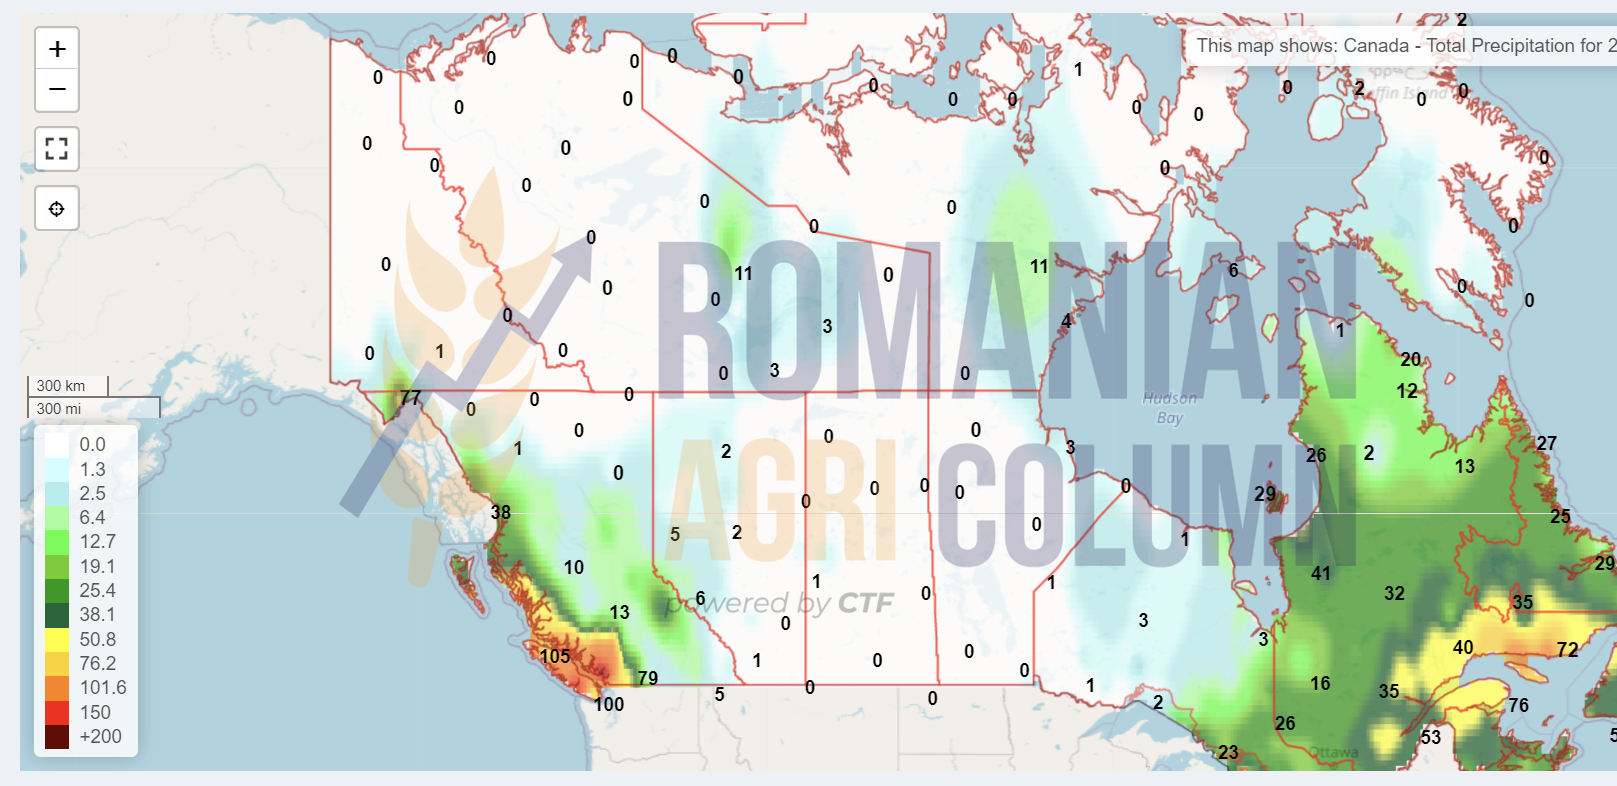
Canada
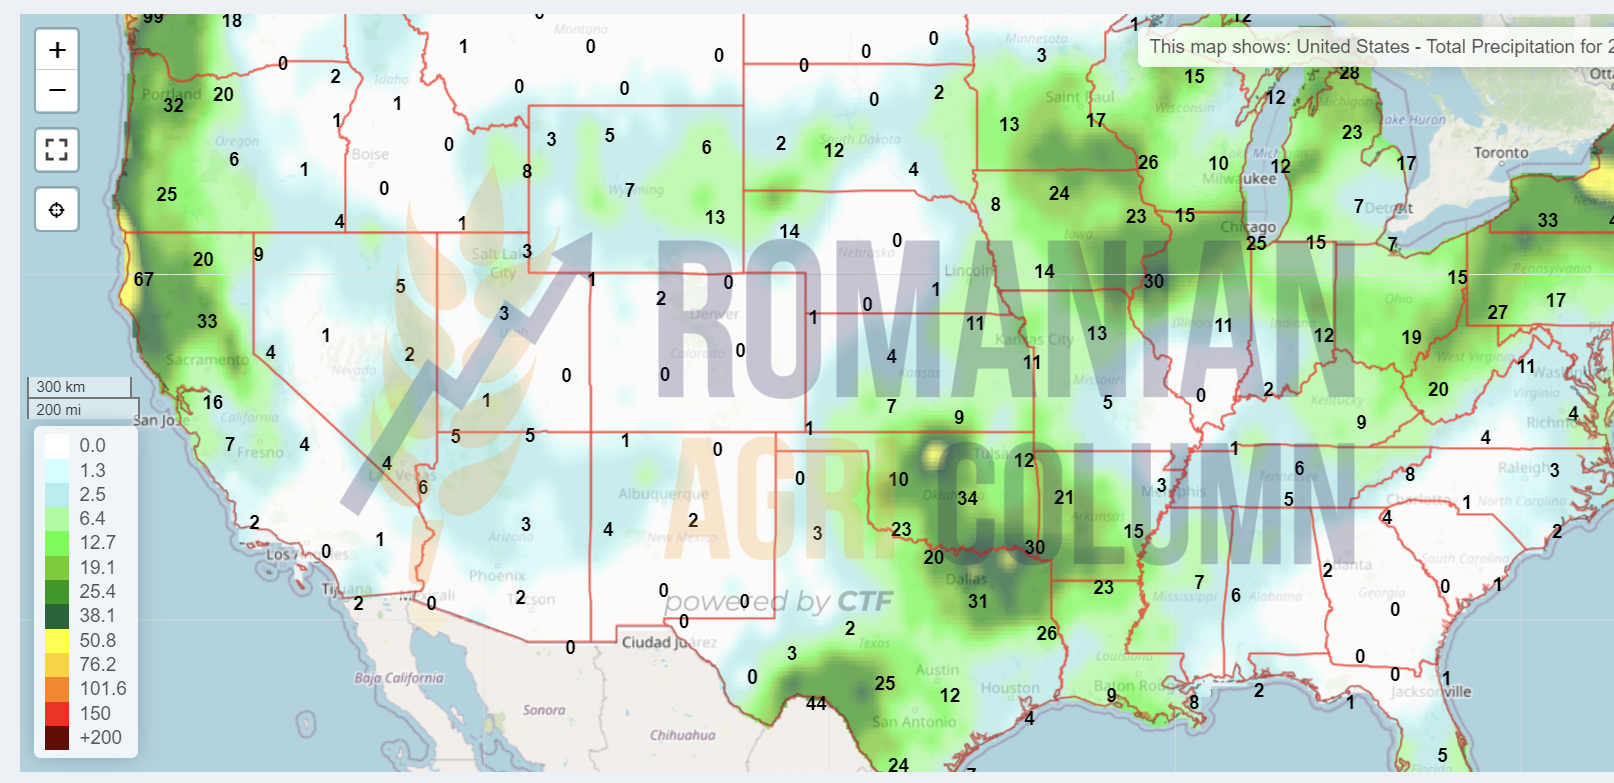
USA
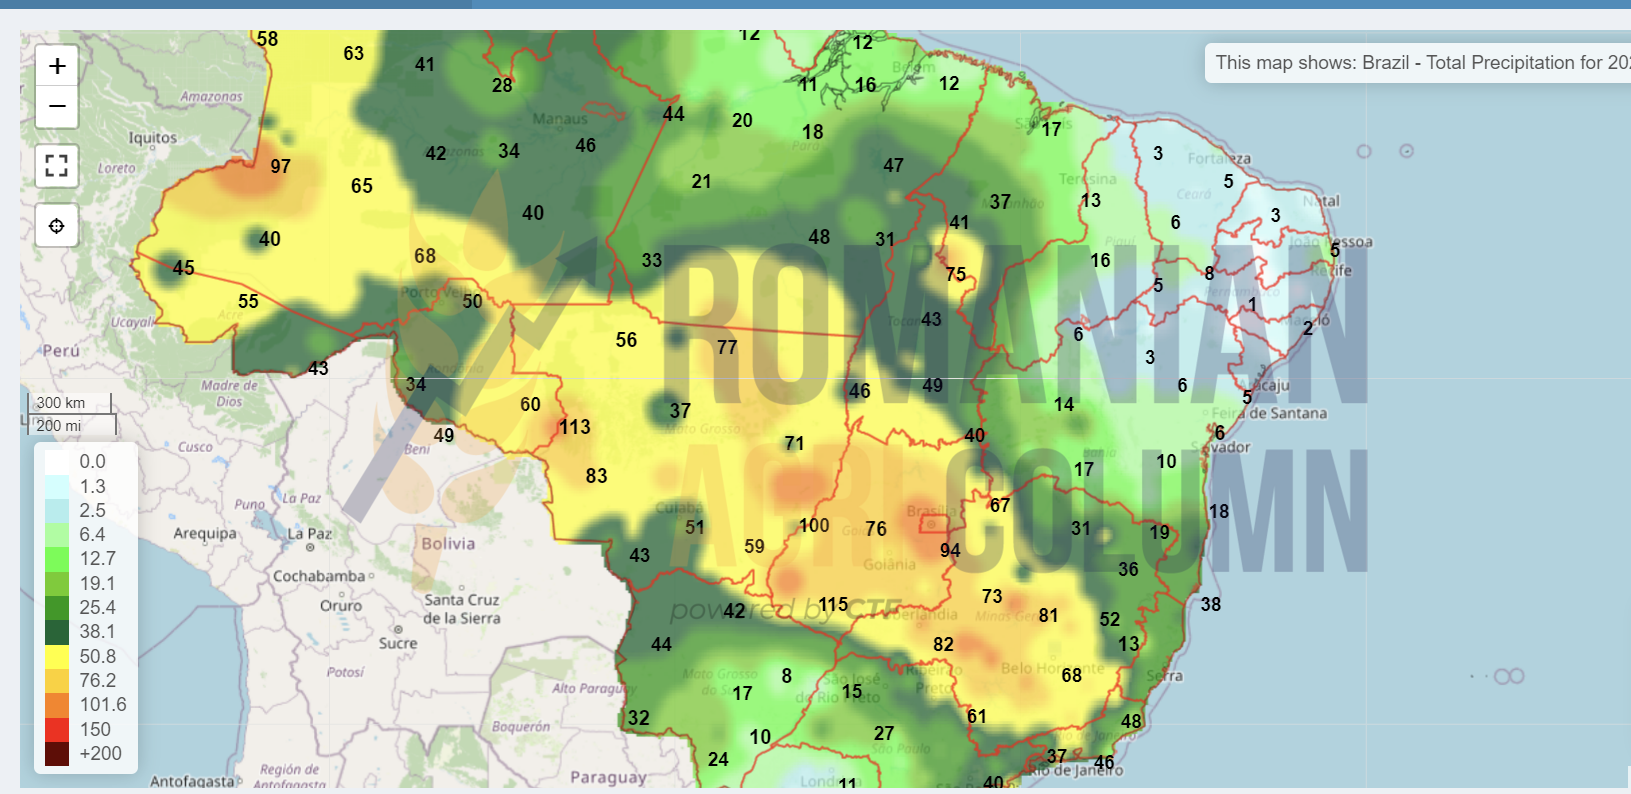
Brazil
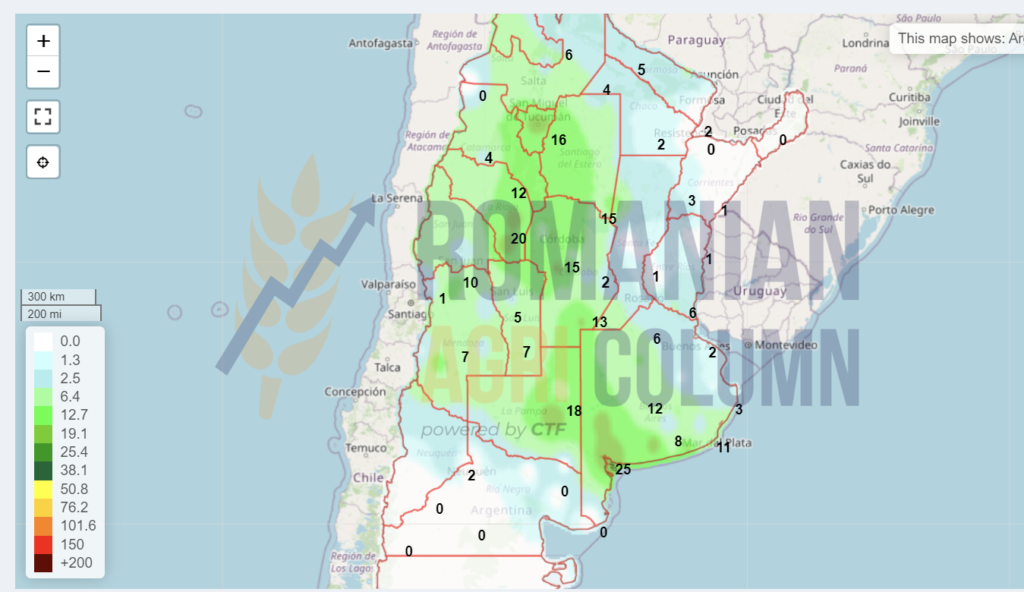
Argentina
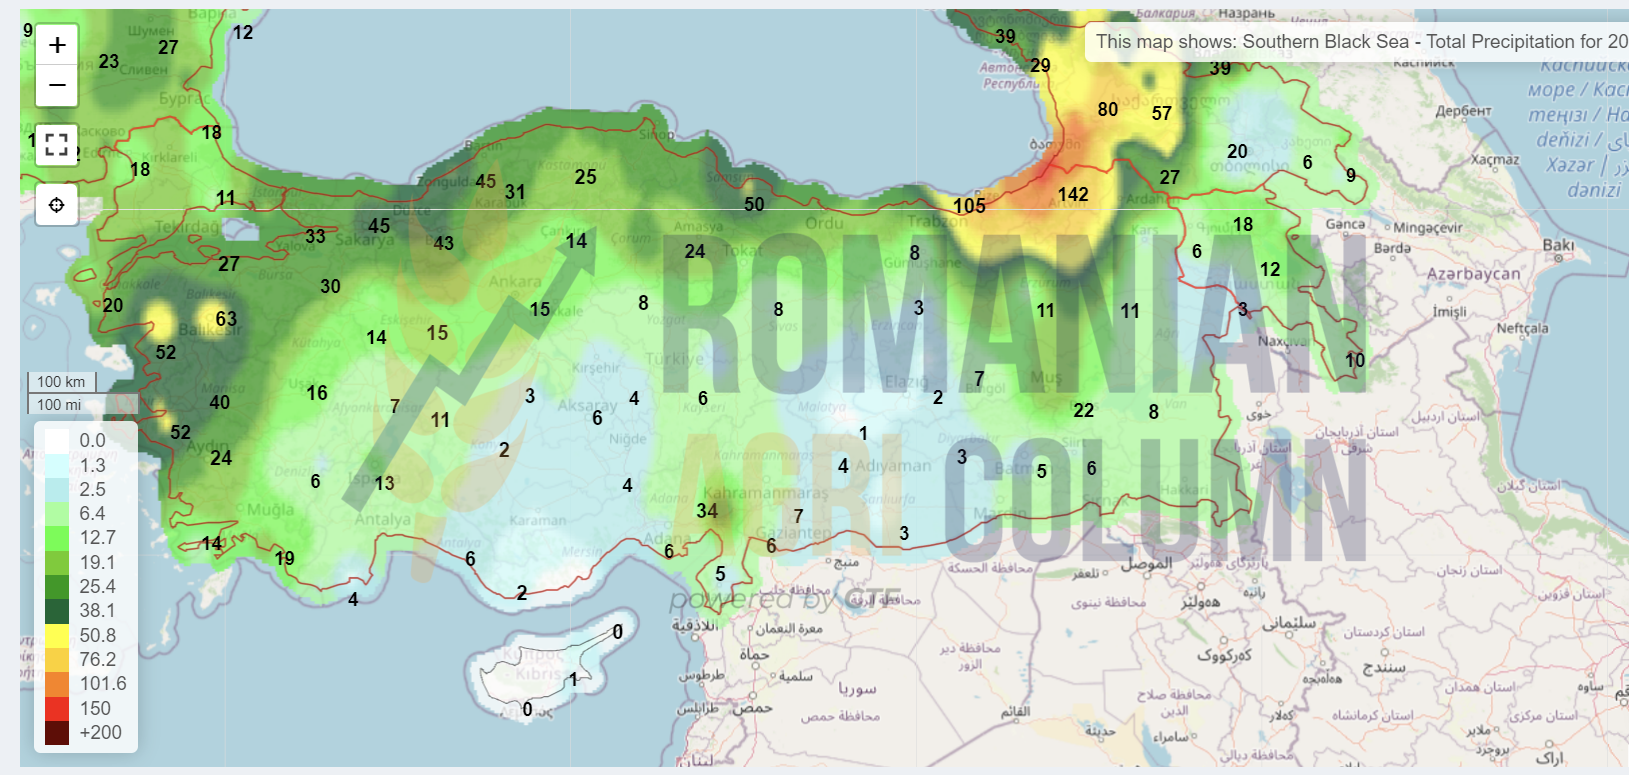
Southern Black Sea
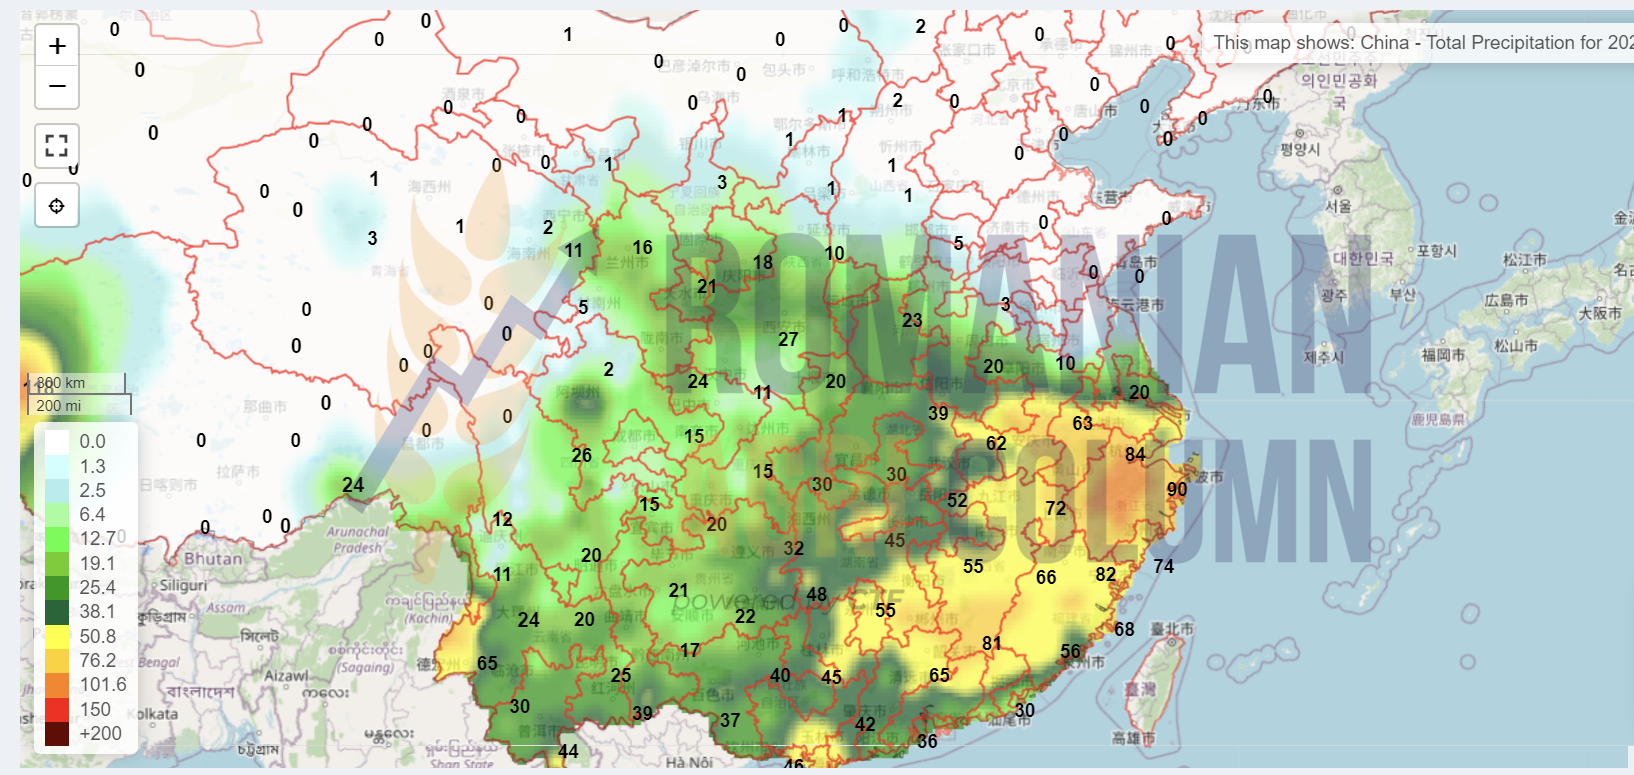
China
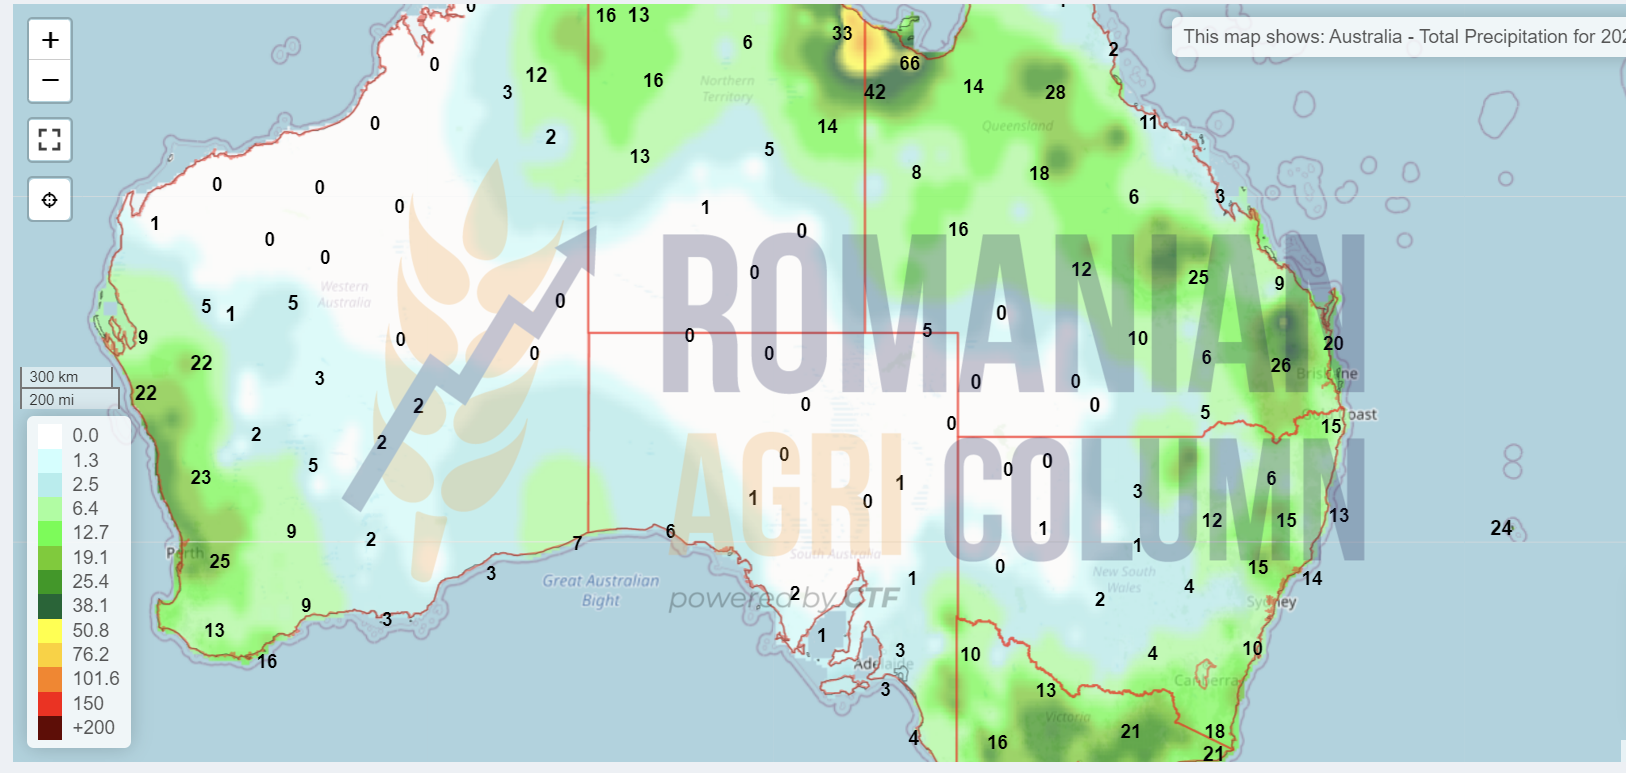
Australia
© Romanian AGRI Column, 2021, all rights reserved