This week’s market report provides information on:
|

Wheat market
The indications of wheat in the Port of Constanța reached the level of 278 EUR/MT in the CPT parity. It is, in fact, a natural continuation of the life cycle of the price generated by supply and demand. Inland, wheat is already traded at the level of 275-277 EUR/MT CPT processing units, a sign of the desire to supply from the latter.
Farmers already feel the level as a profit generator and goods are starting to move between sellers and buyers. We are therefore seeing transactions on the local market, a sign that the corn harvest has ended in the southern areas of Romania and the need for financial liquidity is being felt in the farmers’ yards.
WASDE has once again strengthened its global status. Wheat is the most important social element, and there is not enough of it at the moment in the world. With a slower production again, with higher consumption than production, with a lower level of stocks than the October estimate, wheat became the most coveted commodity. Its equivalence is with that of precious metals, to use a metaphor. We therefore have as a benchmark a production of 775 million tons, a consumption of 787.5 million tons and degraded stocks by 1.4 million tons, up to the level of 275.8 million tons globally.
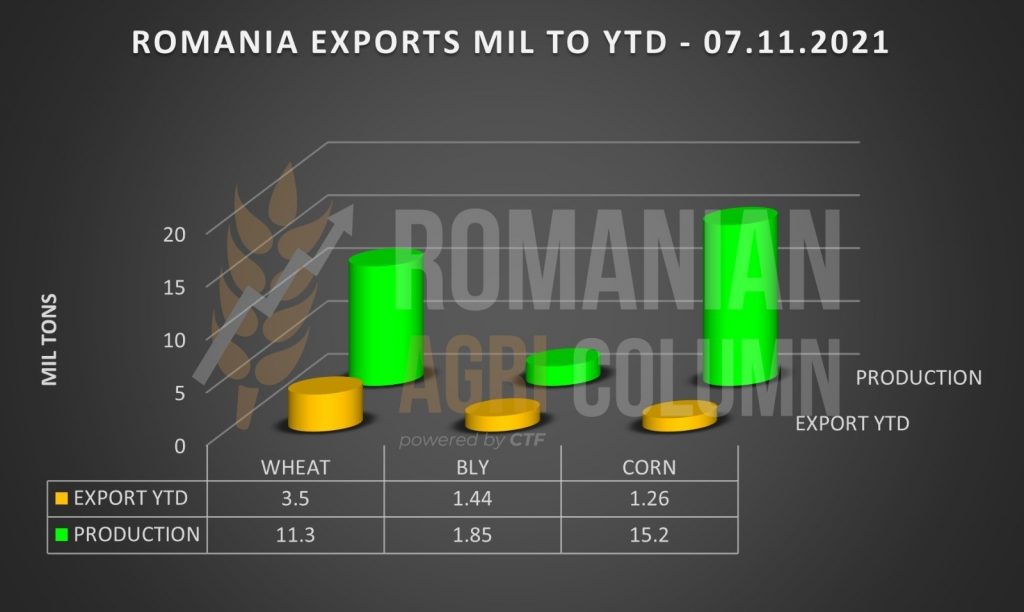
Romania generated a crop level of over 11 million tons, a level that received an upgrade in the latest WASDE report, up to 11.3 million tons. But until November 7, 2021, Romania exported 3.5 million tons of wheat from the potential of over 7.5 million that we were monitoring.
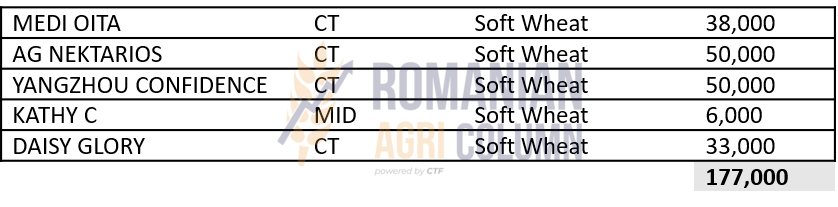
But if we take another look at the alignment of ships in Constanța, it indicates a volume of 177,000 tons under load and, if we add what has already left in recent days, we are rapidly approaching the level of 4 million tons exported.
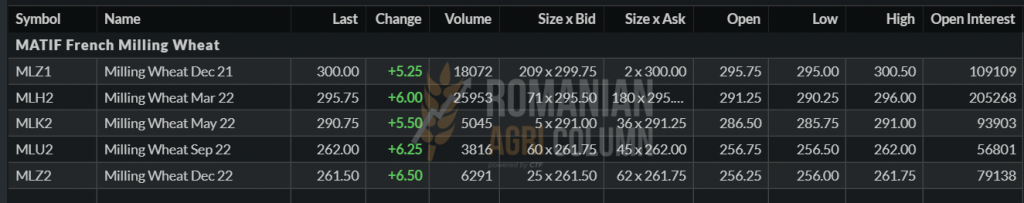
The reflection in the global reality was expressed on November 11, 2021, when EURONEXT traded at the historical level of the last 14 years, of 300 EUR.
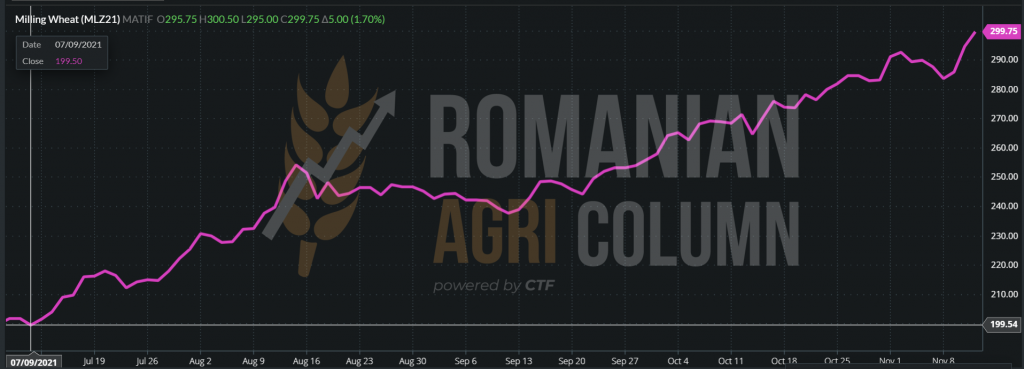
It is a good time for reflection and pragmatism. That is why we insert a route of the wheat price between two fixed landmarks, July 9, 2021 – November 11, 2021. There are 5 months and 100 EUR price difference.
EURONEXT WHEAT GRAPH July 9 (EUR 199.5) – November 11, 2021 (EUR 299.75). A difference of +100.25 EUR
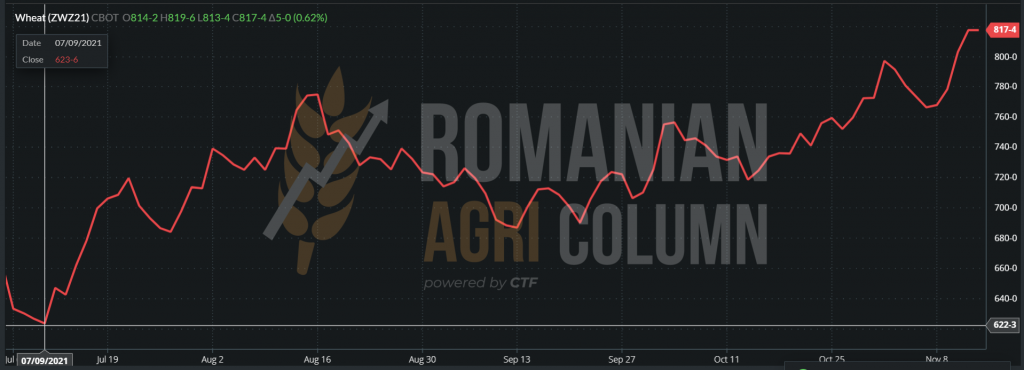
On the other side of the ocean, CBOT maintains the same rate of wheat price in its stock market indications, as follows: ZWZ21 818 c/bu (+6 c/bu). And here we have a premiere in absolute numbers. 818 c/bu is equal to 300 USD.
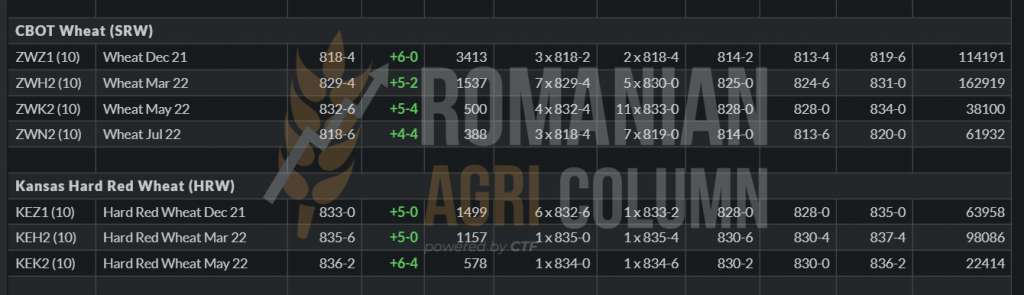
July 9, 2021: 623 c/bu (228 USD) – 11 November 2021 817 c/bu (300 USD) | + 72 USD
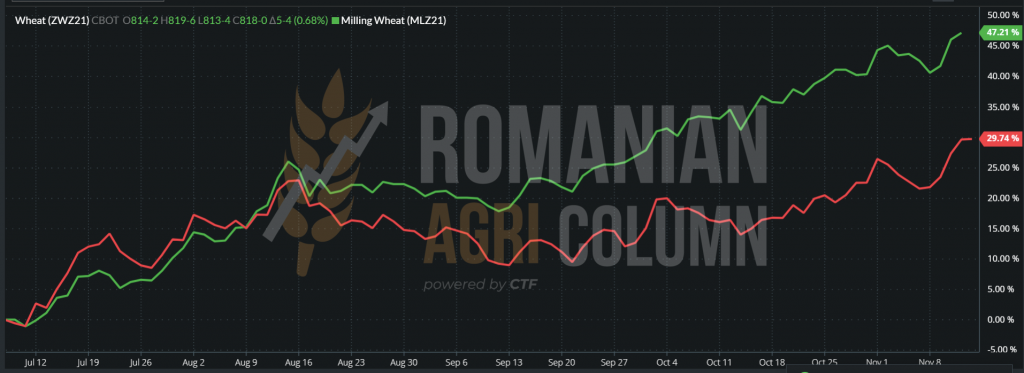
COMPARATIVE GRAPH CBOT ZWZ21 (red line) – MLZ21 (green line)
After the USDA report, the spark to generate a new market rally was not long in coming. Things were seemingly quiet; EURONEXT indications had recovered 2-2.5 EUR after falling to 288 EUR due to the WASDE report.
But the Russian Ministry of Agriculture announced through Dmitry Patrushev that if the price of wheat rises too much, Russia will change the way the tax is calculated, as well as the introduction of an export quota. Recall that today the USDA quotes Russia at 36 million export levels, while SovEcon degraded the level to 34 million tons.
Aggregated with the degradation of European production of 1 million tons, of UK production by 0.7 million tons, although Romania was upgraded, the rally on Euronext began to take proportions. The indications actually rushed to the level of 300 EUR. BSW already indicates 354 USD for DEC21. Converting to EUR at 1.144 parity (USD strengthened against EURO) transfers us to a level of 310 EUR FOB.
In all this context of demand that is not covered by production, smaller stocks, the general perception that we are approaching an imminent food crisis, which will originate in Asia, and then expand, we have some amendments and two scenarios:
- The primary scenario is one that follows today’s trend generated by insufficiently covered demand. We have at the level of the 7 big wheat exporters the lowest level of export stocks in the last 6 years. We have a potential of 204 million tons as a globally tradable figure, increasing by 7 million tons compared to the last 10 days. The trend will continue until the end of January, the calendar of the second winter month. Then we will see the effects of winter on the potential for future crop. And things will enter a plateau generated by waiting.
- The second scenario would be one in which the sale of Russian wheat from local farmers to buyers-exporters is forced. The pressure exerted by Patrushev’s announcement, given that the Russian ruble is much stronger against the US dollar than last year, will cause farmers to sell massively for fear that a higher tax and a quota will restrict access to a much higher price. And the group of buyers-exporters from Russia, naturally affiliated, will buy en masse, and in December and January they will export en masse at high prices. This will be followed by a dry announcement giving up changing the tax or adding the export quota. The result will certainly be the flooding of the market with Russian wheat (let’s not forget that Russia announced a level of 76-77 million tons of bunker weight, and their production received an upgrade of 2 million tons to 74.5 million tons from the USDA) and, implicitly, a massive drop in price.
ANALYSIS
- The trend for the next 60-70 days will remain in positive traction.
- Corrections will come, if they come, depending on the two scenarios above, but not earlier than January 20-25, 2022.
ROMANIA – export level on November 7, 2021 (wheat – barley – corn)
Barley market
The indications of feed barley are starting to gain more consistency in the CPT Constanța parity, the indicative level is already at 240 EUR/MT, a sign that the wheat support as well as the demand are pushing the price up.
Through a tender organized by ODC, Tunisia has contracted 75,000 tons of feed barley, with delivery between December 15, 2021 – January 20, 2022. Lots of 25,000 tons were divided between Casillo (356.48 USD/t) and Viterra (USD 359.48/MT, respectively USD 359.88/MT), in the C&F parity.
Globally, we see a degradation of production by 1.75 million tons, to the level of 146.24 million tons. Global consumption also decreases by 1.46 million tons, to the level of 150.32 million tons. But even in these circumstances, the balance remains negative, with a minus of 4 million tons. Global stocks remain anchored at 16.9 million tons.
The highest demand comes from China (with 0.5 million tons more, up to the level of 10.2 million tons) and Turkey (with an increase of 0.9 million tons to the level of 2.7 million. tons). In contrast, demand in Saudi Arabia fell by 0.5 million tons to 6.5 million tons.
Corn market
Corn has variable indications in the port of Constanța. Everything is combined with the delivery period and we see quotes ranging between 230 and 240 EUR/MT in CPT parity. Things are starting to speed up and the pace of exports is gaining momentum, so November 20 is a final milestone for the departure of the sold lots. After that, the price will depreciate according to the global status of production versus consumption.
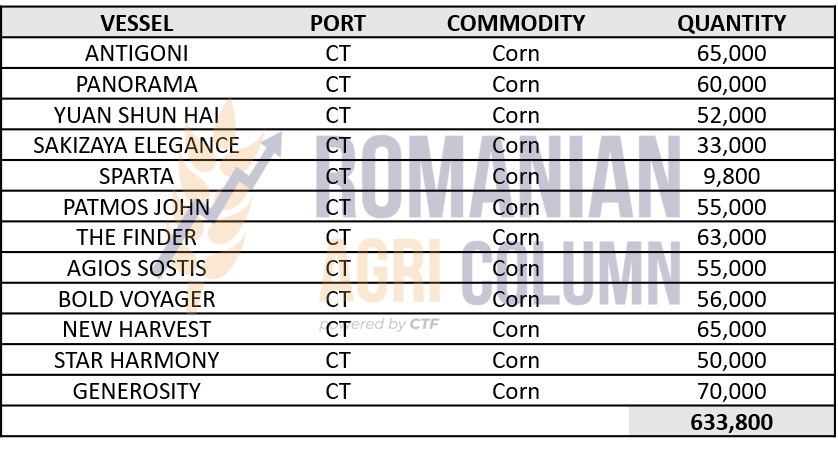
We insert from the beginning a status of the ships loading in the port of Constanța to exemplify the cadence these days, mentioning at the same time that Romania exported until November 3, 2021 about 1.3 million tons of corn. But at this rate, the figures are exceeded and we exceed 2 million tons.
Because the WASDE report generated a growing production in the areas of origin. In the US, we have an estimated level of 382.6 million tons, increasing productivity per hectare. In the European Union, we also have high yields in France, Poland and Romania, reaching a total crop level of 67.85 million tons.
The natural consequence of a ratio that increased global production in the main origins, at the same time as a slow export of the USA to the main origin (China) will be to raise the price, by formulating basis minus premium, i.e., around 230 EUR/MT.
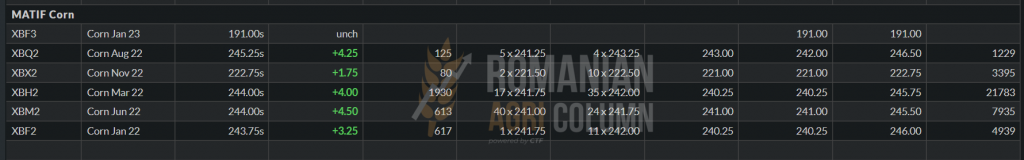
EURONEXT does not fluctuate in the price of corn. It is granted daily with CBOT and indicates values close to the previous days.
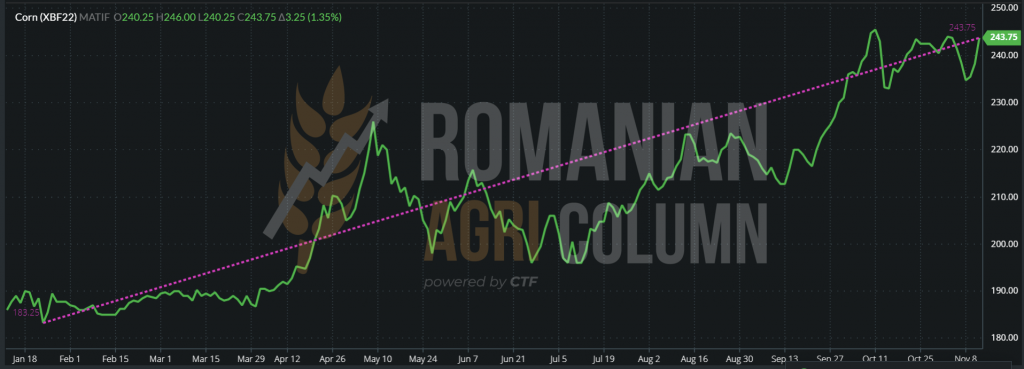
EURONEXT XBF22 – EUR 243.75, with support from wheat (November 12, 2021)
GRAPH EURONEXT XBF22 – 22 January 2021 (EUR 183.25 ) – 12 November 2021 (EUR 243.75) | +60.5 EUR
Under the conditions of the report, namely production increased globally by 6.4 million tons, to the level of 1,204.62 million tons, an increased consumption, but which does not compensate for production, to which we add an increased level of stocks, we have a relaxed market image and no purchasing pressure generated by destinations.
However, maize has characteristics that differentiate it from the rest of the raw materials, namely its use, which can be human, industrial and fodder, each of the listed segments having its own group of uses. In this context, we note the following:
- China traded 10 corn vessels of Ukrainian origin, with delivery November-January, a sign that the price level generates confidence that it has reached an acceptable level of supply.
- China purchased 4 US GULF corn cargoes as well. The indication that the price is standardized on their expectations is confirmed.
- The intense activity of trading, of liquidation of some positions on the stock exchange indicated a decrease of the price level.
- Furthermore, the Ukrainian origin is much more logistically competitive than the American one of the US GULF and the exporting countries from South America (Brazil being competitive but after this year’s disaster), it does not generate a very large volume.
As a last note, DALIAN, the Chinese corn exchange, indicates a rise in price. This is due to excess moisture in the crop, which generates drying costs that are embedded in the final price of the goods.
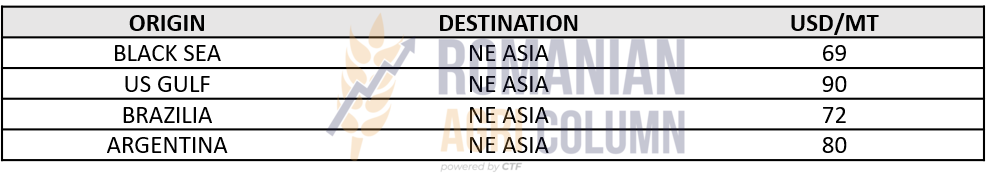
The prices of the goods are influenced by the logistics in the origins and we insert primary indications for a good understanding of them:

Despite the slow progress of US corn exports, we note the increase in Chinese import forecasts to the level of 29.5 million tons, compared to the 26 million initially forecast. It is in the logic of things, taking into account the unofficial estimates of Goldman & Sachs of 35 million tons in the 2021-2022 season. And the actions of the night of 11 to 12 November expressed above, strengthen our assumptions. Moreover, with a big difference between feed wheat and corn, taking as a benchmark EURONEXT, we believe that the transition to corn in feed from feed wheat in China has begun. We have a difference of 50 euros, enough to make a decision.
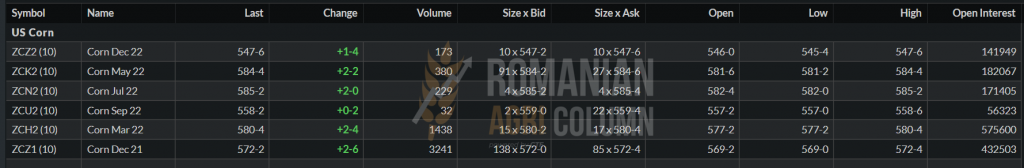
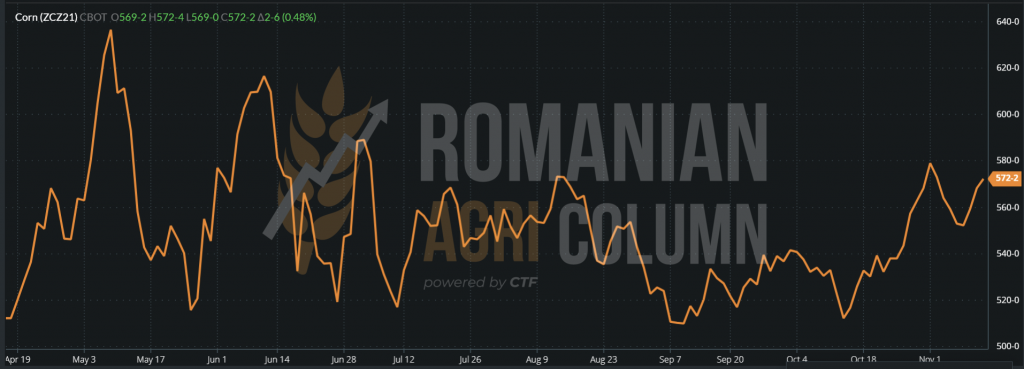
CBOT indicates slow growth. This is generated by the wheat support as a whole. ZCZ21 +2 c/bu (0.79 USD), up to the level of 572 c/bu (225.18 USD)
The chart of the ZCZ21 CBOT trend shows a very slow recovery after the decrease generated by the imminence of the USDA report and, implicitly, of the stable and increasing American crop forecasts.
ANALYSIS
- Our estimates of the corn price life cycle path can be found in the global activity of the last week.
- The development will be lasting. The traction of corn will be generated by the change in feed recipes in China, the lack of crops in Central America, Asian demand and, last but not least, the support given by wheat in the complex.
Rapeseed market
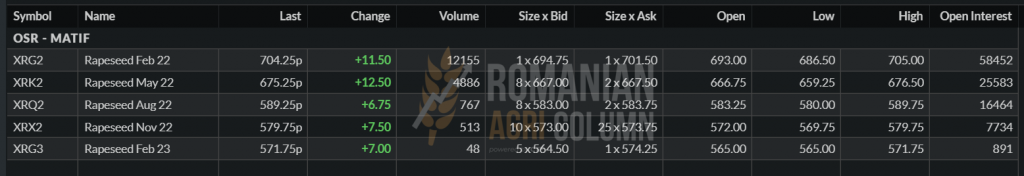
Our predictions regarding the price of rapeseed are confirmed. We are in the middle of November and the processors are extremely interested in the unsold rapeseed stocks. Positioning FEB22 at the level of over 700 EUR/MT means that the price that sellers could obtain from inward processing is at break-even, i.e., FEB22, without any premium discount compared to the basis.
In the same context, the port of Rotterdam indicates a level of 1,580-1,600 EUR/MT of crude oil, and the FOB CVB indications for rapeseed 2021 are set at 810 USD/MT. With a parity of 1.1475, we have a fixed indication FEB22, i.e., 705 EURO/MT.
The first forward sales options have already appeared in the local market, at a base level of AUG22 with a Premium discount of 25 EURO/MT, plus the related transport costs from FCA Farm to the port of Constanța or to the Processor.
However, the reverse is very high today, judging by its expression in absolute figures, namely 115 EUR. However, the mechanism is greatly influenced by what will happen over the winter, and certainly the inverse crop will change at both ends of the range. In two scenarios that we have not yet exposed, we will have the shortening of the inverse from the old crop to the new crop, simultaneously with an increase in the indication of the new crop. The second scenario, which involves several factors, could increase the basis of the new crop to the detriment of the old one. What governs the basic equation AUG22 for 4-5 months from now? WEATHER, DEMAND, INFLATION AND POLITICS. But surely a lot will happen in the period Q1-Q3, 2022.
We therefore insert the EURONEXT indications to observe the bases FEB22 and AUG22, as well as the differences between them.
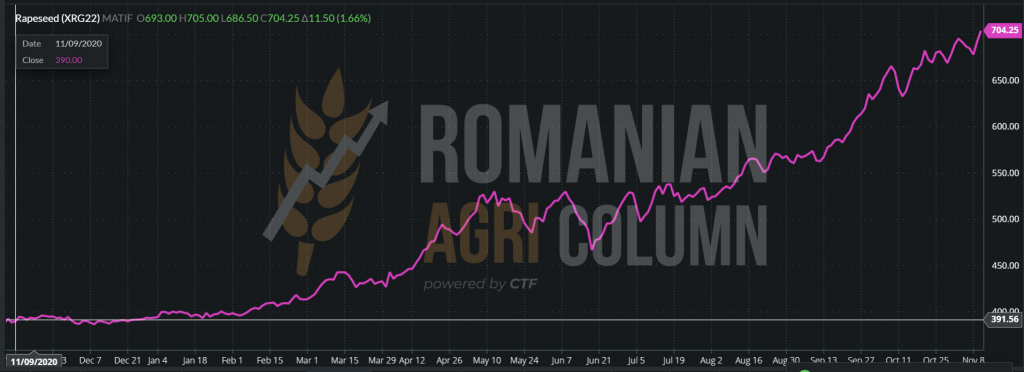
Also, following the route of the price of rapeseed in the last time interval that we set at 12 months, we will notice a few things, namely:
- Demand marked by low supply, which led the rapeseed on an upward and steep route at the same time.
- Support from fossil fuels as well as the VEGOILS sector.
- We also see a complex of factors that will provide support in the future and we name them as the demand in the complex of vegetable oils for reducing the carbon footprint globally, as well as the much more defined inclusion of rapeseed oil as a destination in human consumption, from the cause of a food crisis that is increasingly looming large in the near future.
November 9, 2020 – November 11, 2021 | 390 – 704 = +314 EUR
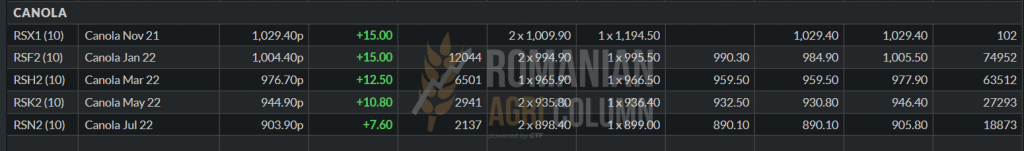
On the other side of the Atlantic Ocean, we note the canola reaching the level of over 1,000 CAD/MT. Our level estimates have been met at this time. In the trading session of November 10, 2021, canola won in the indication RSF22 JAN22 + 15 CAD.
Sunflower seed market
The price indication for sunflower seeds in the port of Constanța starts from a level of 630 USD/MT and rises in some cases to the level of 660 USD/MT. Not having a default stock exchange, sunflower is based only on the price ratio of crude oil (CSFO), which alternates between different origins, based on supply and proximity.
Thus, the level of 660 USD/MT is offered by exporters who want to replace the destinations with which they have long contractual relations and who want the raw material to supplement the processing. It must be said, moreover, that these destinations are exclusively intra-Community, mentioning here France, Spain and Northern Europe.
But at the moment, farmers do not want to sell sunflower seeds. The price degradation that acted on the proximity of the Black Sea basin, respectively of Ukraine (where there are extremely many processing units generally belonging to multinational companies), also affected the price of raw materials in Romania. Farmers have other price expectations for seeds, so we note the lack of important transactions during this time.
CSFO INDICATIONS MAIN ORIGINS
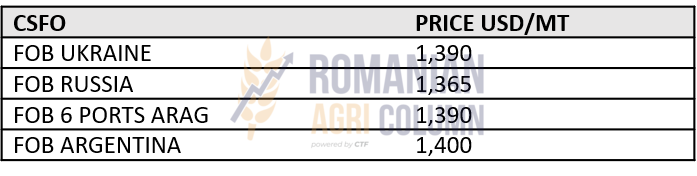
But we note the statement of Russia on the evening of November 10, 2021, which sets a new index of the price of crude oil FOB Russian ports, which by its increase implicitly sets a new level of export tax. Therefore, the price index of crude sunflower oil for December was set at 1,395.4 USD/MT, from 1,277.9 USD/MT in November. The export tax for sunflower oil in December will be 276.7 USD/MT, increasing by 82.2 USD or 42.26%, from 194.5 USD/MT in November.
This move by Russia, which we anticipate, is effectively paving the way for the revival of the price of sunflower seeds, on the same principle of proximity. Ukraine, in turn, will increase the price of crude oil, as a natural consequence, and thus the raw material will become more expensive. Russia, in the desire to protect its domestic market, supports the price of raw materials. And we admit that it is in the logic of things that the raw material receives a new impetus.
ANALYSIS
- The revised EU forecast for increased production, especially in Romania and France from 9.94 million tons to 10.3 million tons, has put pressure on commodity prices.
- Ukraine is a few percent away from the end of the harvest and the results are just over 15 million tons of sunflower seeds.
- Russia, identically, is at a few percent of the end and estimates indicate a figure of about 15.4 million tons.
- Both countries were penalized with 0.5 million tons each during the summer, in full vegetation.
- Argentina currently indicates a level of 3.4 million tons of raw material, when they have finished planting about 80% of the area.
- Turkey indicates a harvest volume of 1.75 million tons, 0.2 million tons more than last year.
- An offset between the Black Sea basin and the European Union is necessary and we realize that we are reaching the same point from which we started – EU growth is penalized by the declines in Russia and Ukraine. We already see the consequence. Russia raises the level of the calculation index and, implicitly, the price level of the export tax, up to 276.7 USD/MT. However, the USDA does not certify the level of crop in Ukraine, as we see them today, they remain at 17 million tons, which is an extremely large difference in percentage from reality.
The soybean market
The WASDE report came as a surprise to everyone when it came to soybeans. It degraded the productivity of American production from 51.5 BPA (bushel per acre) to 51.2 BPA, i.e., from 3.46 tons/ha to 3.44 tons/ha. In this way, soybeans received an unexpected boost on CBOT on the evening of the report, November 9, 2021. The indications increased by 28 c/bu, i.e., by 10.29 USD/MT.
1,180 c/bu on November 8 and 1,213 c/bu on November 11, 2021
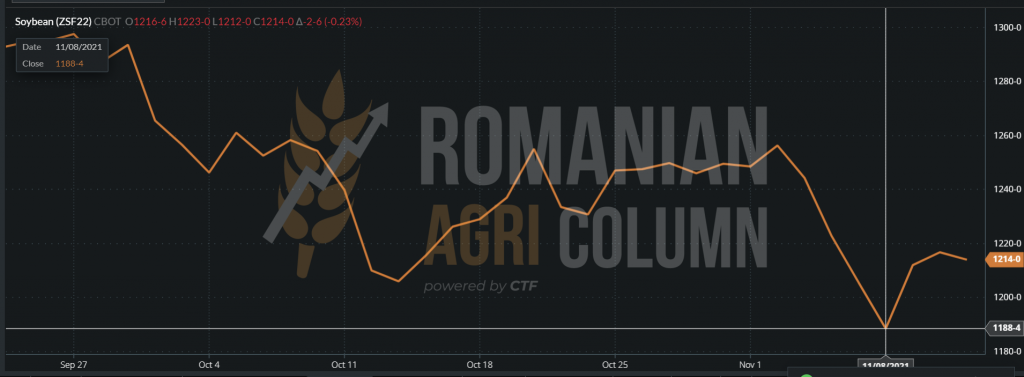
But soybeans still have no sales support. US exports do not excel, China drags on sales and degrades the initial potential of 101 million tons by 1 million, up to 100 million tons.
On the horizon is already seen the massive Brazilian crop estimated by the most famous scout, Michel Cordonnier, at the level of 142 million tons, increasing by 6 million compared to last year, Brazil being at a level of 99% in soybean planting.
The degradation also caught up with the local market in Romania, the soybean processors stopping the purchases for the moment. Supplementation with processing requirements was an expected effect. We have repeatedly urged farmers to sell soybeans, but apparently there are enough of them left with stocks. The degradation we were talking about generated in Romania prices that revolve around the level of 600-620 USD/MT inland, an appreciable difference compared to the levels of 650-660 USD/MT that were offered some time ago.
However, non-GMO soy will certainly find its way and be sought after, especially in Western Europe, where its value is valued in the industry that generates products for human consumption.
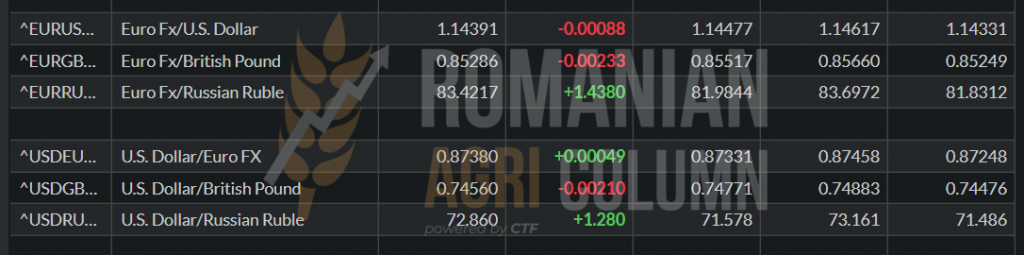
EUR-USD parity
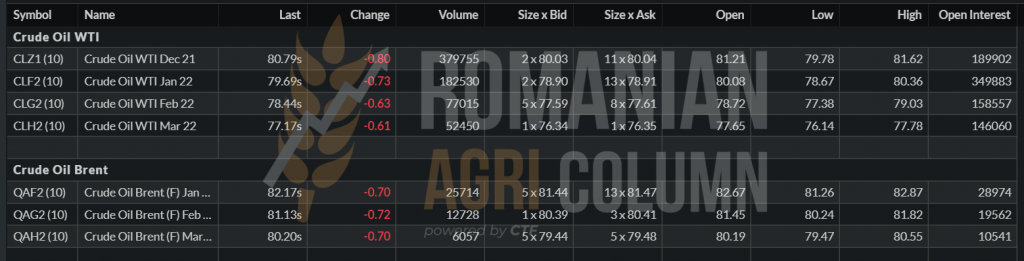
Fossil energy
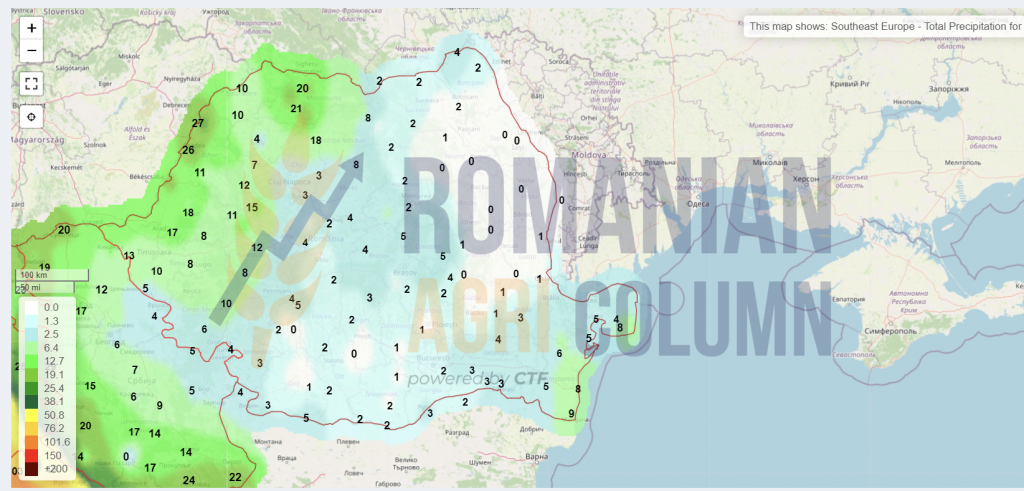
Weather forecast
12-26 November 2021
Romania
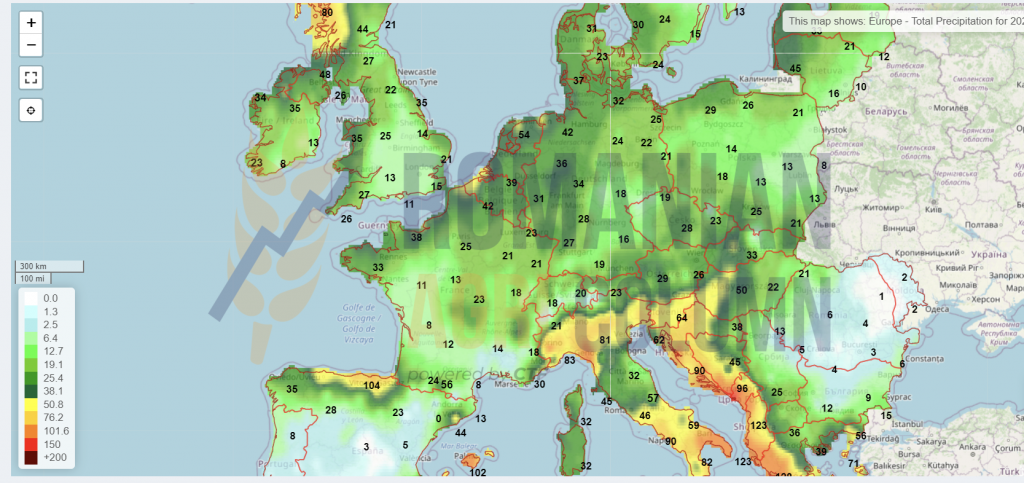
Europe
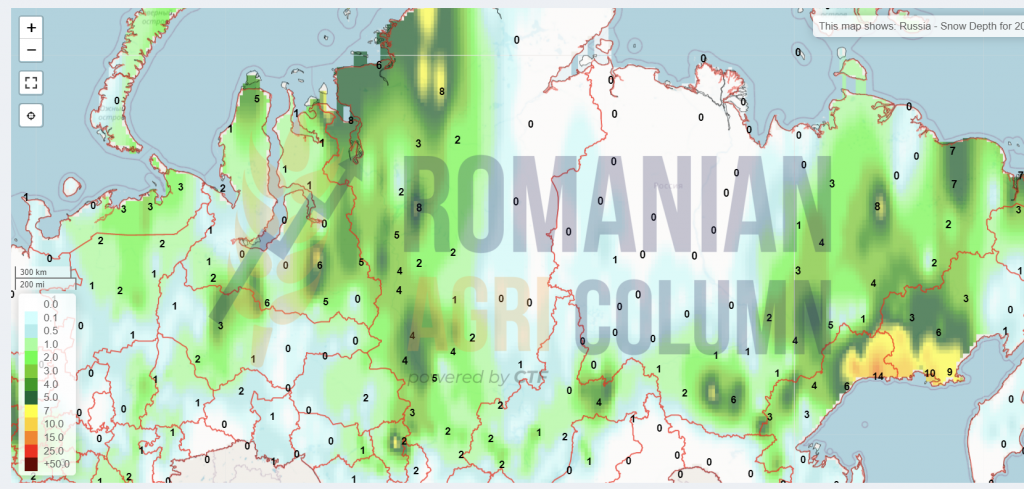
Russia (snow)
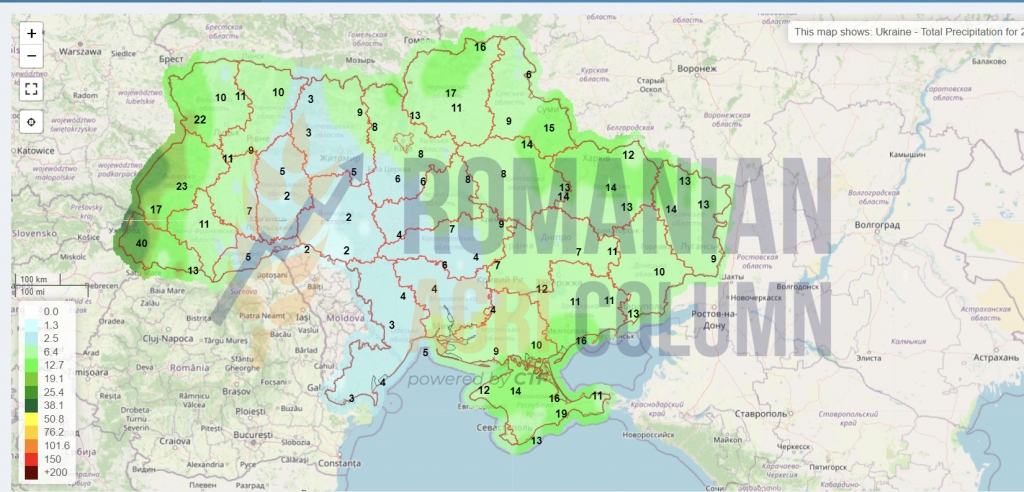
Ukraine
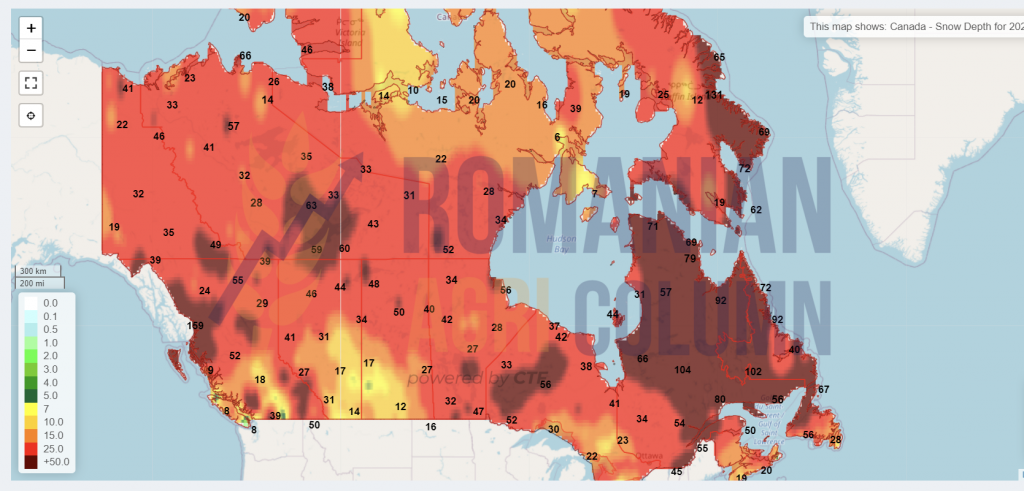
Canada (snow)
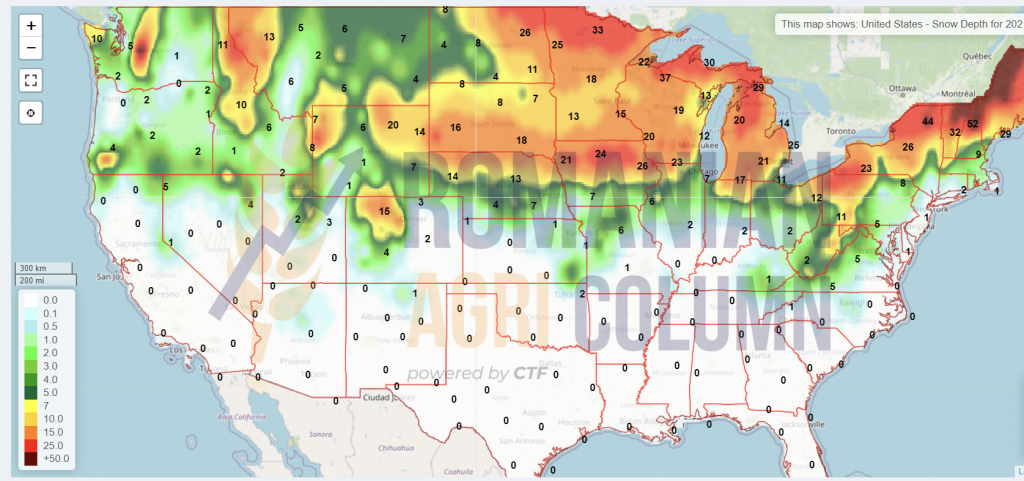
USA (snow)
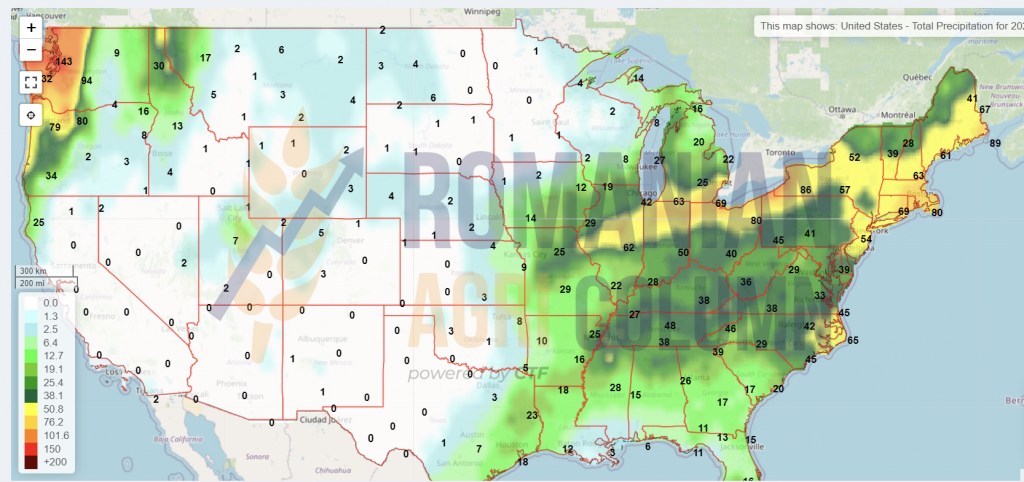
USA (rain)
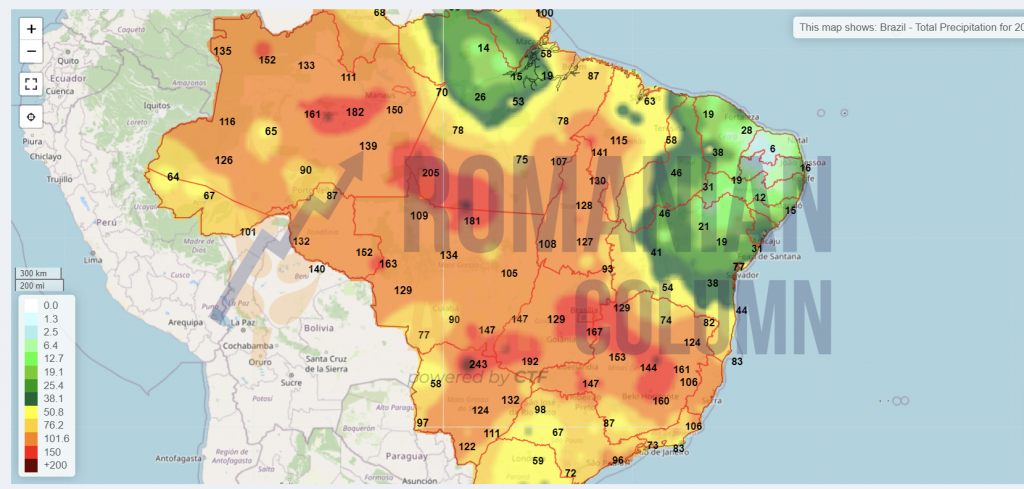
Brazil
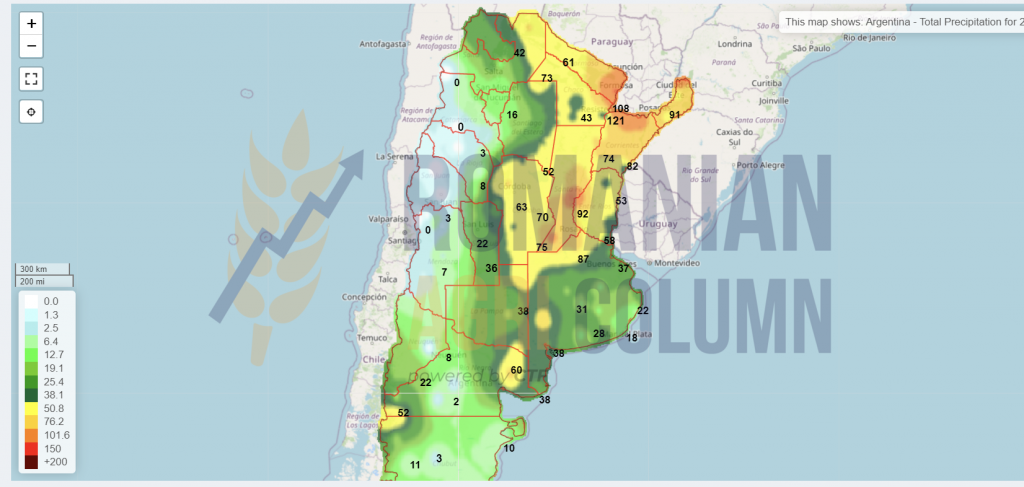
Argentina
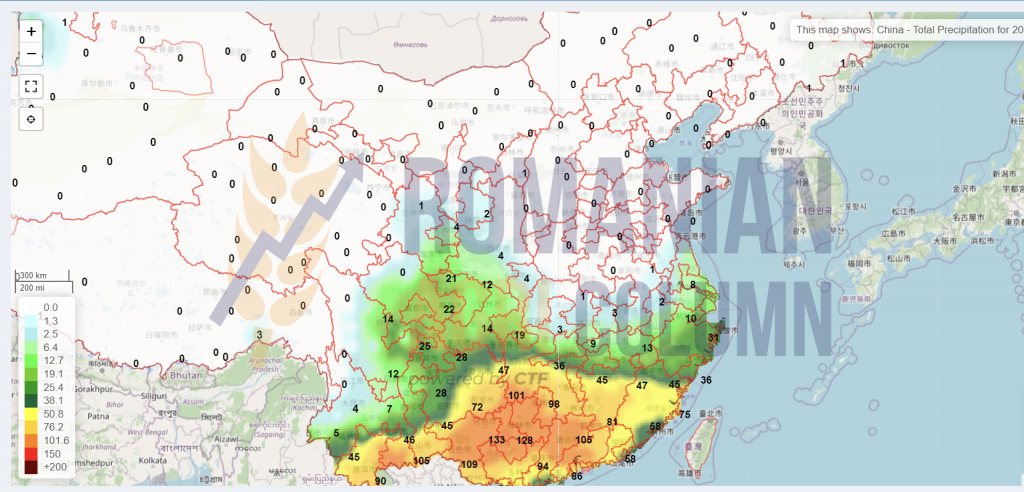
China
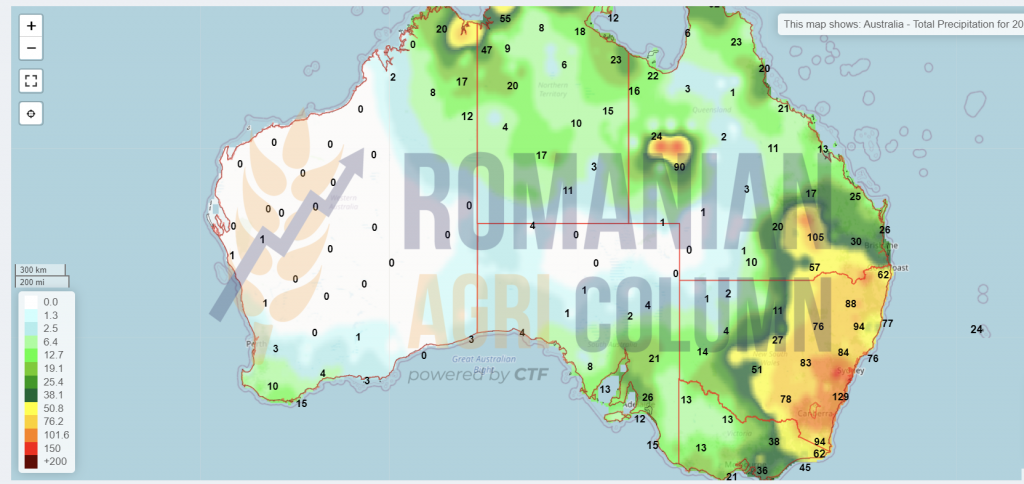
Australia
© Romanian AGRI Column, 2021, all rights reserved