This week’s market report provides information on:
|

Wheat market
Wheat indications in the port of Constanța remain firm at the level of 267 EUR/MT. No price imbalance indicates firm demand in the Black Sea basin and the EU. At local level, however, we record the first purchase offers at the level of 262.5 EUR/MT of goods delivered to the location of the processors. But here is an amendment to the delivery period.
The goods have a delivery period of January-February, which adds an embedded storage cost of at least 1.5 EUR/MT for a period of 4 months, which leads to a real level of 256.5 EUR/MT. The seller is responsible for the quality and quantity of the goods throughout this period, provided that a service contract is not concluded. In 4 months, the costs of aeration, fumigation and, of course, calculation of handling losses and perishability, legally statutory, are added, according to GH 169/2015. We convert, as usual, everything into money and we have a level of at least 4.5 EUR/MT which must be lowered from the level of 256.5 EUR/MT, towards a good appreciation of the economic and financial calculation. The result is 252 EUR/MT, a final price of the goods only.
We can compare this level with what is paid today in the port of Constanța and we see that, if we bring an extra harvest campaign transportation cost, the result is similar. It’s just that there are risks and benefits to this whole calculation. On one hand, the farmer secures a price of 262.5 EUR/MT, but incurs costs of 10 EUR/MT. And, in addition, he/she is no longer a participant in the developing market, in the possible price increases of wheat, because the volatility of wheat is manifested only in the upward direction due to the balance of supply and demand, which is negative in terms of supply.
In this regard, we note the last GASC tender of Egypt, which led to the purchase of 360,000 tons of wheat with the following component:
- 3 lots x 60,000 tons of Russian origin;
- 2 lots x 60,000 tons of Ukrainian origin;
- 1 lot x 60,000 tons of Romanian origin.
Based on this information, we review the price of the goods sold by Romania in C&F parity and we break down the costs up to the origin in order to understand the cost mechanisms applied:
- GOODS IN C&F PARITY = 359.86 USD/MT
- TRANSPORT VALUE = 31.5 USD/MT
- FOB CONSTANȚA COST = 328.36 USD/MT.
From the level of 328.36 USD/MT we extract a fobbing cost, i.e., the passage of the goods through the port terminal of the operator that has a contract with the seller and we find ourselves at the level of 321.36 USD/MT. From this figure, we have to extract the costs of participation in the tender, the costs of financing and storage for the period until the delivery of the goods, namely December 1-10, 2021 and we get 315 USD/MT.
The final operation is the conversion into EUR and at a parity of USD 1,156 for EUR 1, which results in 272.5 EUR/MT, in line with the price offered today in the Port of Constanța in the CPT parity, with the exporter’s margin included.
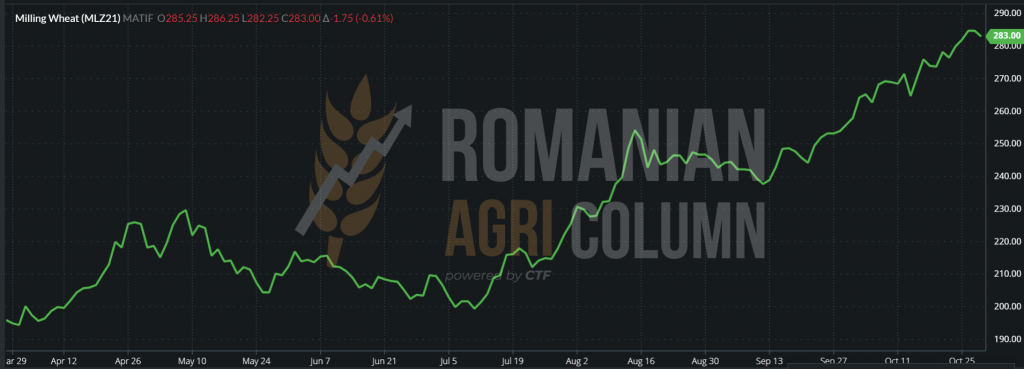
On the European stock exchange, we see a stabilization of the indication MLZ21 at around 284 EUR, with variability of 0.5% in a positive or negative sense. It all depends, of course, on the interest of investment funds and the information about the physical market.
EURONEXT MLZ 21 – 283.25 EUR at the close of 29 October 2021
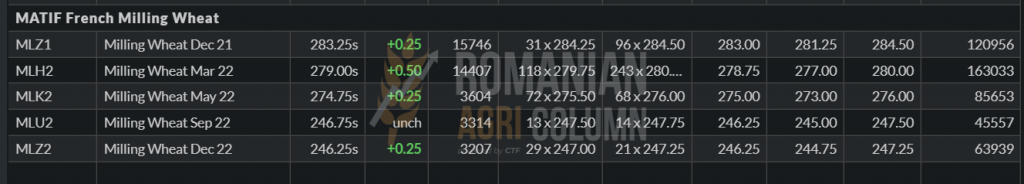
EURONEXT MLZ21 December chart
In terms of European trade in wheat, we note an increase in the share of exports for the period in which we are and we see a figure that exceeded the level of 9 million tons, Romania having so far an export level of wheat of 3.2 million tons, and Bulgaria of 1.5 million tons. These figures show the consistency of EU demand for wheat due to the proximity of traditional destinations: the countries of the Middle East, North Africa and Sub-Saharan Africa. European logistics is clearly superior to other origins.
On the same background of supply and demand, we note certain discrepancies in Russia, namely the differences between the quantity harvested called “bunker weight” and the goods in the quality standard. If at the bunker weight level we note an accumulation of 76.5 million tons, at the standard level we have a significant decrease close to the USDA estimated level of 72.5 million tons. Russian analysts saw a decrease in the total crop level (all component goods) from 127 million tons to a corrected level of 119.5-121.7 million tons. We are talking about a significant difference of a minimum of 5.3 million tons and a maximum of 7.5 million tons. Extracting from here the reduction suffered by Russia in corn and sunflower, we find a remainder of about 4 million tons next to wheat, which makes the export offer begin to thin. The strengthening of the ruble against the US dollar also contributes to this complex, which makes the formula for calculating the export price unfavorable to exports to the detriment of the internal market. In other words, Russian farmers receive less money for their goods.
In the Black Sea basin, the price of wheat is listed on the BSW stock exchange at the level of 326.25 USD NOV21.

However, the transactions for the following months indicate increasing values of the physical market, at the level of 334-338 USD for DEC21-JAN22, which reflects 288-292 EUR/MT according to today’s parity.
In terms of tenders in the area, we note Saudi Arabia, which has launched a tender for the purchase of 655,000 tons of wheat, that concluded on October 29, 2021, for delivery between January 2022-April 2022. But we do not have the results yet made public.
In the same context, GASC Egypt is launching a new tender for the purchase of wheat. It will take place on Monday, November 1, 2021, with delivery December 11-20, 2021, payment on delivery, LC. Time is speeding up and stocks are shrinking, so 2 consecutive tenders are an important indicator.
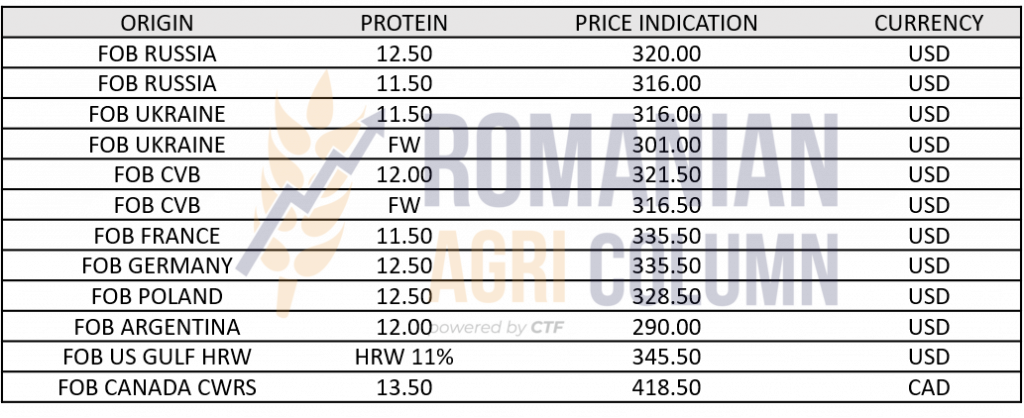
Price indications for the main origins:
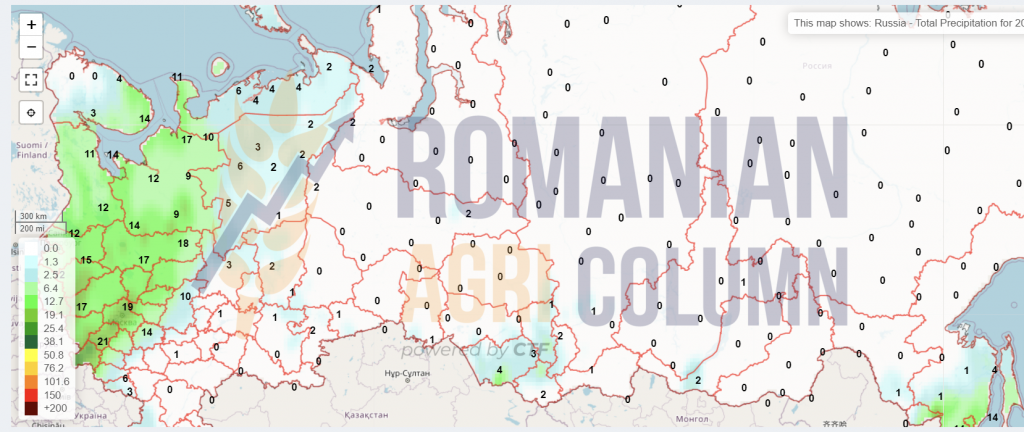
Regarding the status of sown wheat, we note Russia which has notable delays. The planting forecast also has problems. The dry weather bites from the Russian hectares. During a period of beginning from 10 days ago and lasting 10 more days, no precipitation is seen in Russia. La Nina returns.
The plan was 19.2 million ha. So far, there are only 17.6 million ha, compared to last year, when they were at the level of 18.3 million ha. The window closes and germination has problems. The agriculture ministry refuses to comment or provide additional data.
The USDA has not had employees in Russia since July 2021. Sentinel 1 and Landmark are the American eyes in Russia.
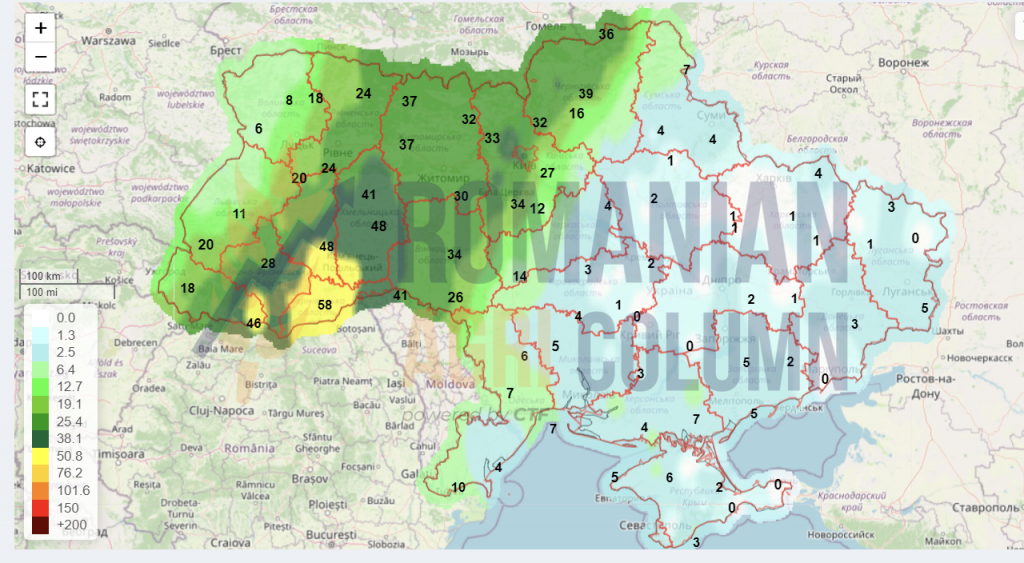
In Ukraine, identically, the fields are devoid of rainfall and a question mark is raised about the future potential. But in both cases, we believe that, although the warnings are correct, it is not yet necessary to question the future wheat crops of the two countries.
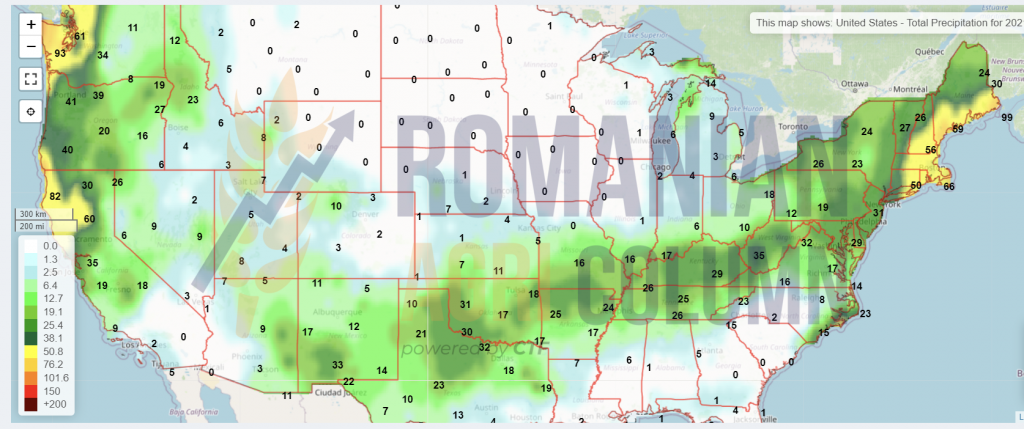
Overseas, the future American winter wheat crop is under very good auspices, with a good to very good degree of health at 49%. The level of planting American winter wheat is 80%. The rains had a beneficial effect, even though the west coast is still deficient in soil water levels. Still, North and South Dakota are below a spectrum similar to last year, but things are far from over. The situation is the same in the case of the Black Sea basin, speaking here of Russia and Ukraine.
In Argentina, wheat harvesting begins. Volumes estimates are reduced from an optimistic figure of 20.7 million tons to 19.7 million tons. The drought of the planting season shows its first effects. At this time, the harvest has reached 6.9% of the 6.6 million hectares planted with wheat. The weather is good for the harvest and we will follow together the progress of the Argentine wheat harvest. Remember last year with only 17 million tons due to the effects of La Nina and the fact that 47% of the crop is in a good to very good vegetation state this season.
In terms of rising fertilizer prices and potential problems with the American winter wheat crop, CBOT reacted, rising and falling accordingly, although US export sales in the last week were not higher than in the previous week, the gap being negative by 30%. We noted increases of 17 c/bu and decreases of 10 c/bu, but the firmness remained in context.
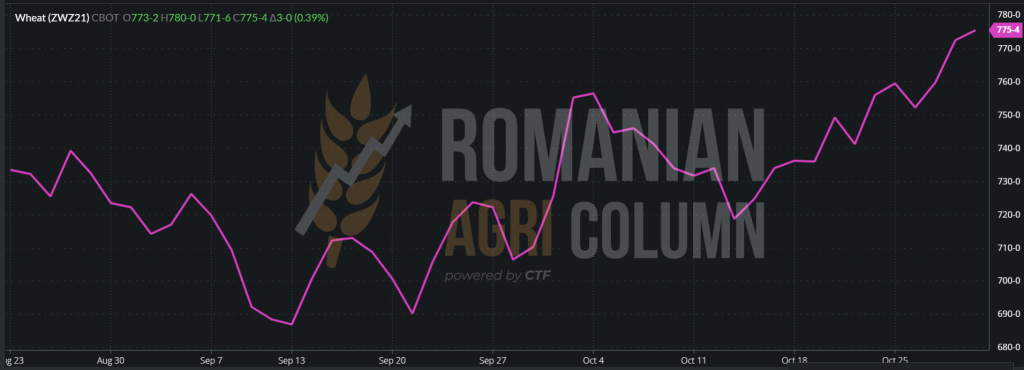
CBOT ZWZ21 at the closing of October 29, 2021:
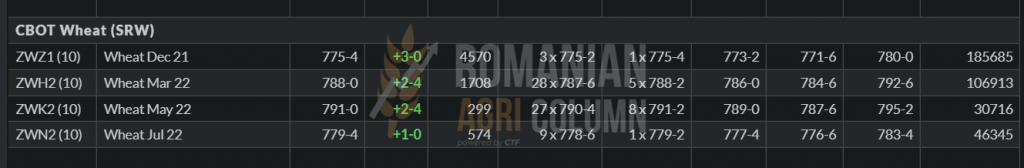
GRAPHIC CBOT ZWZ21 – watch the volatility of the last days
ANALYSIS
- Wheat is in the same trend of continuous demand and its yield in the profit and loss balances of farmers has a positive trend, which increases their income level.
- The European region and the Black Sea keep open cargo flows at maximum levels.
- The prediction of problems in the Russian plains amplifies the attention of observers and indicates tensions that will remain high. The effects of La Nina can be seen quite clearly.
- Will we reach 300 EUR/MT FOB CVB? Time will tell, because logistics costs and the significant differences between European and Eastern European origins at one end, versus American and Australian logistics at the other, are very serious. For now, we are at the level of 283 EUR according to BSW, indication at NOV21.
- The Russian tax is at 69.9 USD/MT for next week.
Barley market
The barley market is aligning and developing in the wheat field, so the feed barley is quoted at the level of 235 EUR/MT CPT Constanța these days. Romania’s domestic market, and we are referring to the entities that own pig breeding complexes, have special problems due to swine fever, many of them being empty, without herds. However, the resumption of activity generates time and the barley stocks are kept on hold, most of the thoughts of the pig farmers being in these moments towards the liquidation of the feed barley stocks. Selling them to buyers in the export market is an option they are considering.
TMO Turkey purchased the quantity of 235,000 tons of feed barley. The origin is mostly Ukrainian and the prices differ depending on the port of unloading. They range from 330 USD/MT C&F Tekirdag to 335 USD/MT C&F Derince. The delivery period is December 1-20, 2021. As the price difference between the last tender and the newly concluded one, we note an increase of 20 USD in the price of the delivered goods.
A batch of Australian barley is making its way to the Middle East, more precisely to Jordan, 60,000 tons being purchased by MIT at the level of 333 USD/MT C&F Aqaba, delivery February 2022. The seller is Australian Grain Export.
ANALYSIS
- Wheat traction is noticeable in the development of barley prices.
As we said in the previous issue, the reduced supply of barley globally fuels demand and its cadence is reflected in the frequent number of transactions (tenders).
Corn market
The price of corn in the delivery condition of CPT Constanța is still 236-237 EUR/MT. We are still saying that a delivery window will close on November 15, 2021, with the departure of some ships to destinations in Northeast Asia. Once the date of November 15, 2021 is exceeded, we will witness a price degradation up to around the level of 230-232 EUR/MT.
We anticipated the phenomenon starting with a few issues ago, the reasons being the classic ones: the rich crop from Ukraine, the rainless harvest window, the need to push for export the first batches of the total quantity of about 32.5 million tons for the year 2021-2022.
Support in the physical market for a lower price is also increased by the embedded drying costs. Maize is harvested with moisture and the high cost of gas used for drying leads to an increase in the final price of the goods. It is a reality that we quantify in numbers.
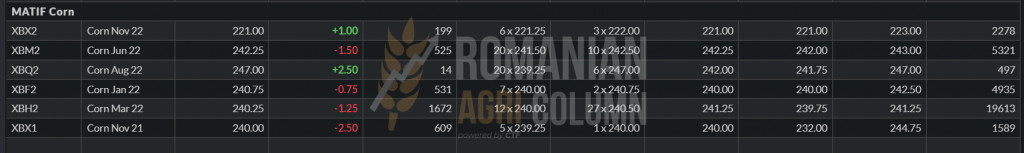
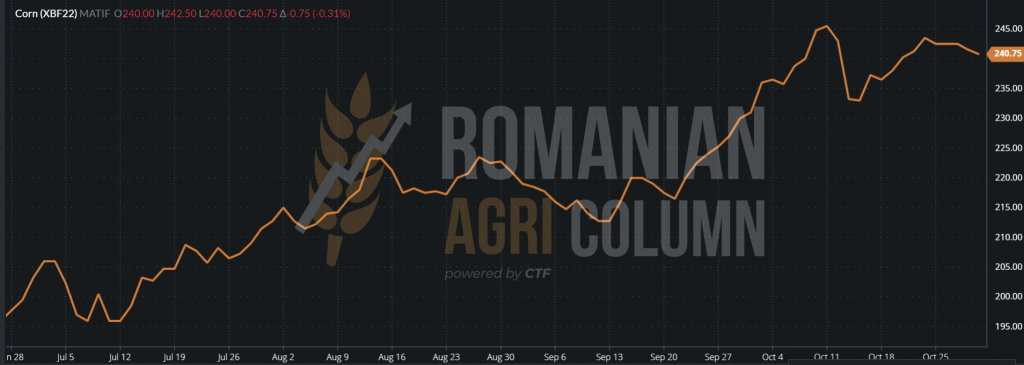
On the European stock exchange Euronext, we see the anticipated degradation at the level of January 2022. As we wrote, NOV21 is no longer a correct landmark since October 20, but JAN22 must be followed.
EURONEXT XBF22 – 240.75 EUR at the close of 29 October 2021
As a price indication in the Black Sea basin, we see Ukraine with a tendency to stagnation and slight degradation. This comes from the demand and supply indicated for December and January. The range of 270-272 USD is present in both months as trading indications. This shows us that due to the volume, no adjacent storage and financing costs are paid for the goods. In the CVB, this indication translates to the level of 235 EUR/MT FOB, which we will certainly see from the second half of November 2021. In Ukraine, the harvest is 35%, with an average yield of 6.35 MT/ha.
In the US, harvesting has stopped in many places due to rain. The impossibility of harvesting generates, as in Europe and the Black Sea, a certain tension in terms of prices. However, the level reached 68% compared to 70% last year, but higher than the average of the last five years, namely 55%.
The phenomenon is also supported by the demand for ethanol, which has low stocks during this period. The cost of energy is very high and industrial use requires more raw materials. The demand curve has grown and generates significant sales for this sector
In this context, we note sales of American corn to Mexico of 280,000 tons. This strengthens our assumptions about US supplementation to the detriment of the Brazilian origin.
US corn exports are, as a direct comparison with last year, at a level 3% lower. All this time, fund managers are positioning themselves long for corn, with 245,000 lots of futures + options. This is an indicator of future increases in the price of American corn.
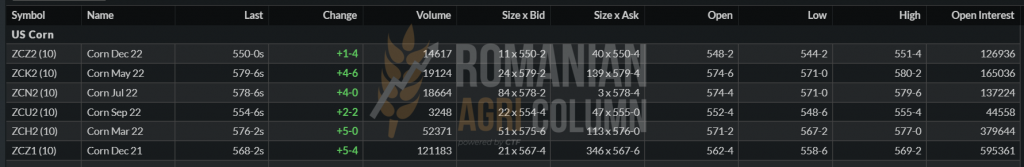
CBOT ZCZ21: +5 c/bu (+ 1.97 USD) – 568 c/bu (223.6 USD)
CBOT chart ZCZ21 October 29, 2021: we note the recovery after the report of October 12, 2021
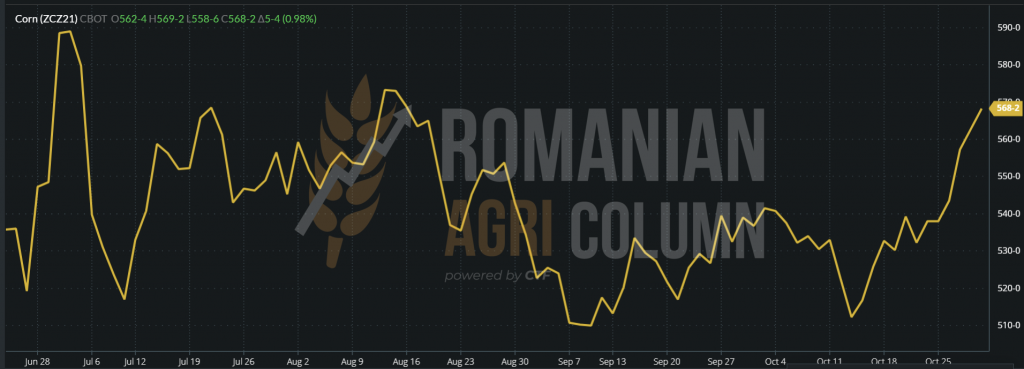
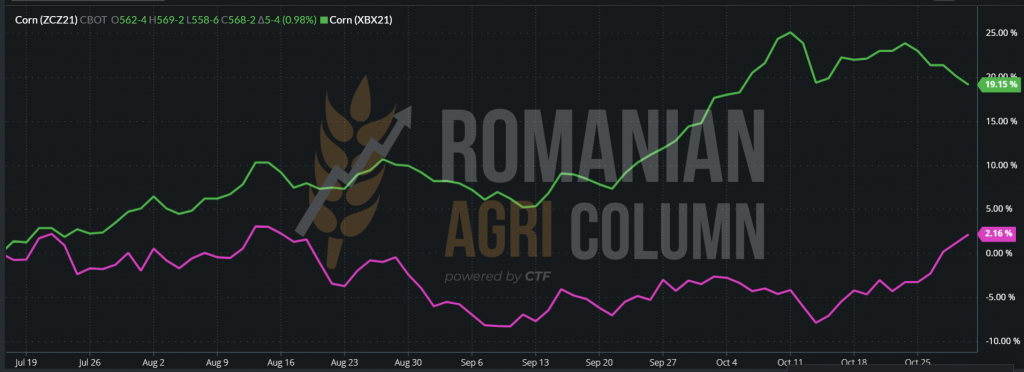
COMPARISON between EURONEXT (green line) and CBOT (pink line): we note the European downward curve vs. the return of American corn.
ANALYSIS
- The Black Sea basin is shrinking in terms of prices. The pressure of the volumes coming out of the Ukrainian plains causes the price to degrade.
- In Romania, we note the same phenomenon. A lot of goods were sold at harvest time, proving that the lesson of last year’s drought was learned. Overestimating crops and pushing them into forward contracts was not a profit-making thing.
- American corn is on the rise after the October 12 report. Ethanol demand is also on the rise in aggregate with demand in Central America (Mexico). Fund managers are net long on corn.
- The volume of corn comes as a global pressure factor and creates pressure on sales and implicitly on price.
- As energy costs are high (gas used for drying), they are increased in the price of the goods and thus the transfer of this additional cost to the buyer is made. Although we would be tempted to argue that the price is firm at certain levels, it is composite and represents a sum of goods plus conditioning costs.
- In France, farmers are advised to leave the corn crop in the field for a later harvest to avoid the costs of drying. But this process of natural drying can be made even more difficult by the weather and the humidity of the loan every morning.
- Maize goes on the road (price life cycle) supported by demand and wheat, which acts as a traction factor. We see a positive route in February-March, even if November-January promises to be slightly degraded.
Rapeseed market
We moved with the indications to the level of FEB22 and we still notice the demand supported by the lack of raw material. This appears to be a stabilization, but it is not at all so. The positions are somewhat covered at this time and the moment of pause we see in terms of quotes shows support, a sign that rapeseed is selling its lack of volume generated by Canadian problems.
Generally, processor sales are covered until January 2022 and tempering is the most obvious signal. It can also be seen from the low activity at the level of lots traded on EURONEXT.
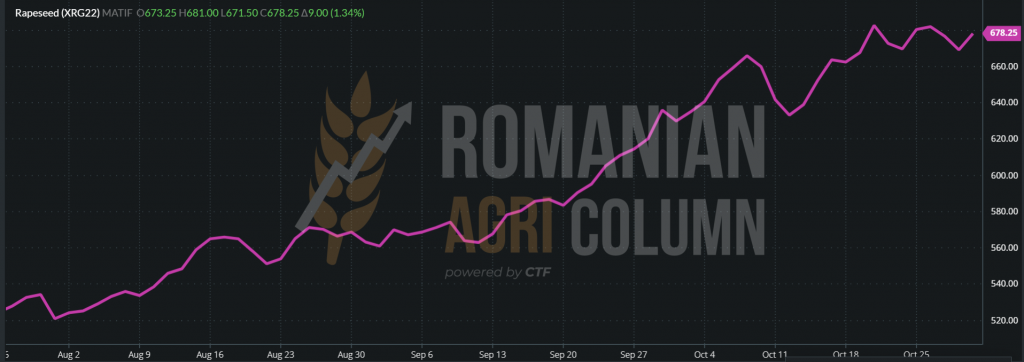
XRG22 – 678 EUR at the close of 29 October 2021

EURONEXT XRG22 – we note the plateau of the interval 18-29 October 2021
Let’s go for a little next year forecast and try to visualize the share of rapeseed in a global picture.
- In the European Union, rapeseed will have its place. Industrial use will be doubled by the demand for human consumption. Rapeseed oil will be incorporated into the vegetable oil complex. In future EU policy, palm oil will no longer have import support due to Asian deforestation policies and so rapeseed oil will be a major substitute. Its qualities and the European genetics of rapeseed are factors that ensure its route. By 2030, the share of palm oil will be very low in the European Union. Instead, rapeseed oil will gain in volume. Today, its share is 5.7 million tons, and the forecast is close to 8 million tons.
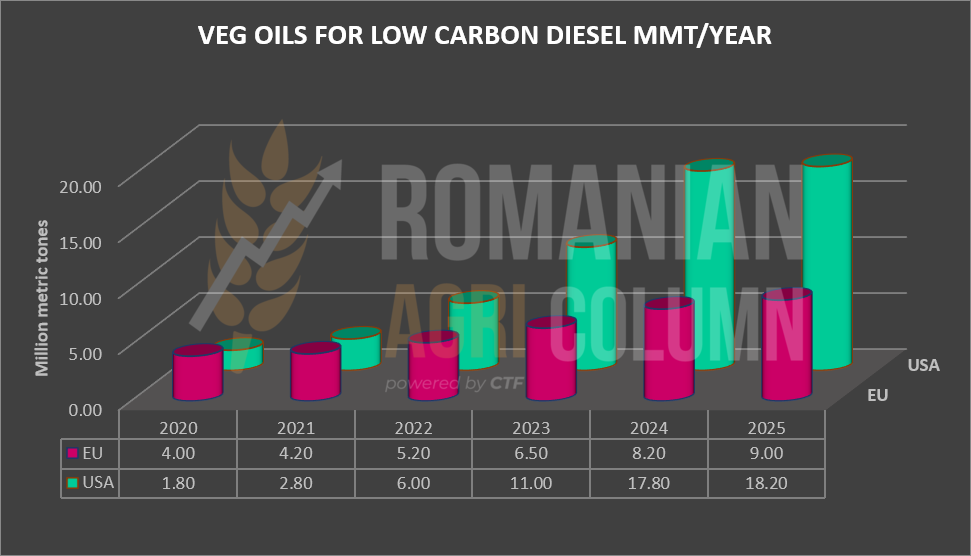
- Overseas, according to studies conducted by Rabobank, the growing industrial demand for rapeseed oil for biodiesel will increase. The US is the main factor that will ensure the demand in the paradigm shift that will follow in the coming years. In the context of reducing the global carbon footprint, the US will gradually increase its demand for biofuels for the composition of diesel, so that if we see a level below 2 million tons per year in terms of demand, in 2023 we will have a ramp increase to the level of 11.3 million tons, and in 2025 the demand will reach a level of over 18 million tons. 9 times more than today.
PROJECTION GRAPH VEGETABLE OIL APPLICATION 2020-2025:
ANALYSIS
- Rapeseed has its well-established route in the 2022 season. The support shown by the plateau in which it manifests itself these days is generated by the beginning of a new road of European rapeseed, namely the replacement of palm oil with it, for ecological reasons.
- Globally, the need to reduce the carbon footprint will generate a steep growing demand for biofuels. In particular, the US will generate an increase of more than 9 times in the next 4-5 years.
- Canada will increase its domestic processing and we will see smaller volumes of canola generated for export.
- The Black Sea Basin and the European Union will be the next pillars of raw material production for industrial use and human consumption.
Sunflower seed market
The price of sunflower seeds in the CPT Constanța parity is at the level of 660-675 USD/MT. Some exporters post prices of 640 USD/MT, but this shows rather the lack of interest or space, due to the volumes of corn.
The price degradation started a few days ago, more precisely from October 27, 2021, amid the decrease in the price of crude oil (CSFO) in the Black Sea basin.
In Romania and Bulgaria, processors are still looking for volumes. The logic of “cheap seeds near the house” prevails and the activity of continuous origin is sustained. But in the face of a decline, farmers have two options: either panic and sell (those with small lots), or wait for the positive corrections that will follow in the volatility and dynamics of the market.
The selling pressure of crude oil from Ukraine is gaining ground these days. Harvesting is coming to an end in Ukraine. About 13 million tons are harvested so far from 5.5 million hectares (about 84-85%). The oil produced must find its destinations, so we see a correction of about 35-40 USD per ton of crude oil at the level of FOB Ukraine (Odessa – Chornomorsk). The indications for November 2021 are at 1,405 USD/MT compared to the 1,440 USD/MT demand from a few days before.
What can be seen ahead? We will summarize in the form of bullet points the factors that make up the market during DEC21-FEB22:
- Turkey maintains its zero-duty tax on sunflower seed imports and will certainly start sustained origination in 30-45 days, a process that will last and will consist of volumes of 400,000-500,000 tons. We refer to the import potential from Romania.
- Romanian and Bulgarian processors are covered in oil sales until the end of January, which means that after entering 2022, the origin will be supported in attempts to cover future sales. Processors are very exposed to volatility and therefore work on a quarterly basis, i.e., they will not sell crude oil more than 3 months in advance.
- The energy and the components of financing one hectare, with direct reference to fertilizers, do not show signs of decrease but only of tempering.Let’s take the example of the Russian blackmail with gas, which reached a boiling point, and the Russian Federation through Mr. Putin himself lowered the pressure of this game, ordering the gas supply of Europe. This is just one step in a force-based negotiation. Russia knew and appreciated the moment when it would release deliveries, but they wanted to maximize two things: capital and image. After all, you have to sell and what is better? Sell volume at a lower price? Or not to sell lower quantities at a high price?
- The dynamics of seed prices follow the inflationary path of other goods in the global market and will not be excepted by factors such as inflation, the VEGOIL complex, supply and demand, political factors. All these will generate a dynamic that we will find in the price of raw materials.
The soybean market
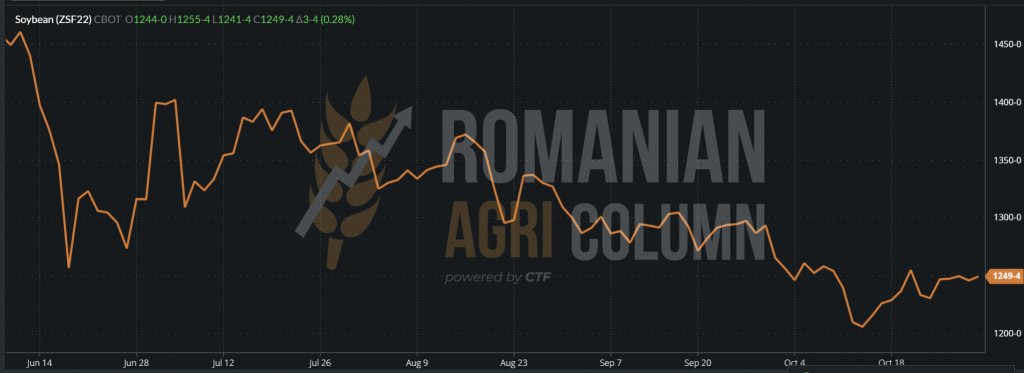
Soy indications are on a plateau. The reference ZSF22 – January CBOT indicates 1,249 c/bu (458.93 USD) at the close of October 29, 2021, with an increase of 3 c/bu. The support came from the sales of the week we just ended, namely 200,000 tons to China and 126,000 tons to Mexico. However, compared to last year, the level of US soybean sales is obviously in a delay which, translated into percentages, indicates a difference of 35%.
American soybeans are 75% secure in terms of harvest, compared to 83% a year ago. The rains did not provide the necessary advance window in this process. In South America, Brazil has reached a 51% soybean planting level and is receiving rains that are extremely favorable these days.
At the same time, Argentine soybeans are under the sign of uncertainty due to the lack of water in the soil at the time of planting. With a lower level of rainfall of about 35% in the most important regions where soybeans are planted, including Santa Fe, the potential for disease is also present, so uncertainty looms over the soybean crop. Harvesting will begin at the end of March 2022, but it is the rainfall that will make the difference. The area planted with soybeans is 16.2 million hectares, about 5% smaller than last year.
ZSF22 CBOT soybean graphic – 1,249 c/bu = 458.93 USD
In Romania, we do not identify notable differences compared to last week in terms of volumes and prices. The benchmark remains 650 USD/MT. Depending on the interest of buyers, it can vary positively or negatively, but our recommendation is to sell the harvested and uncontracted lots.
ANALYSIS
- The American crop is very rich, but with a seriously decreased level of sales compared to last year, a minus of 35%.
- An extremely promising crop in South America. Brazil receives rainfall and the new crop is valued at 140 million tons.
- The indications plateau is determined by the very slow pace of sales and the size of the American crop.
- Romanian soybean batches must be contracted. Time passes and we do not see a positive improvement in the near future due to global volumes and positive forecasts in South America.
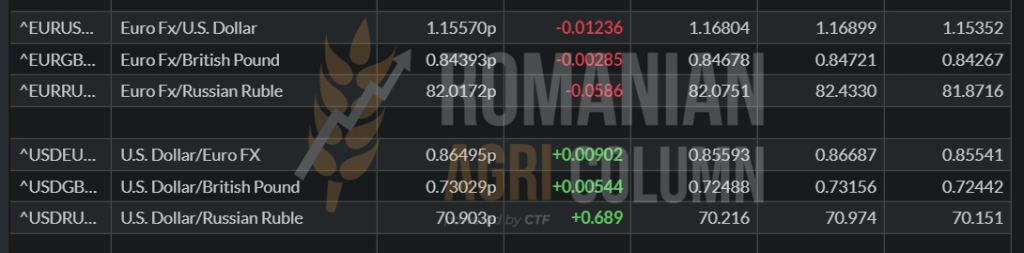
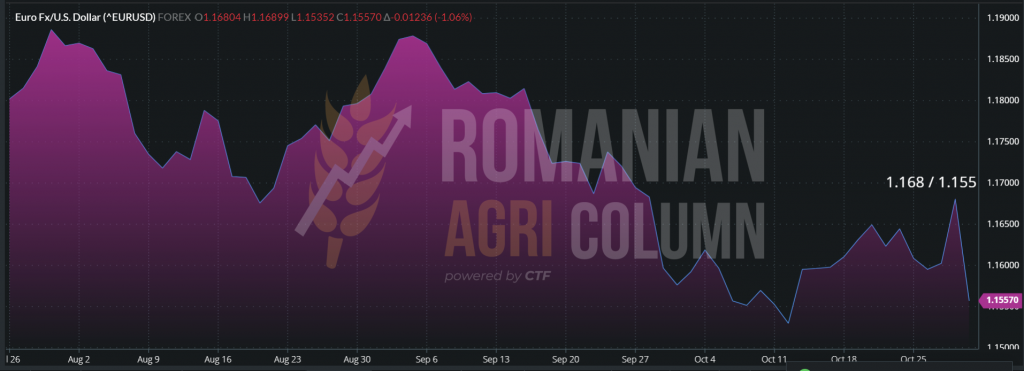
EUR-USD parity
USD from 1,168 : 1 EUR to 1,155 : 1 EUR in a single trading session.
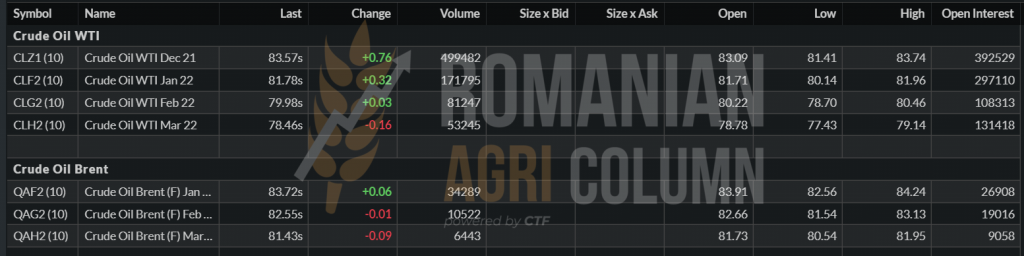
Fossil energy
WTI DEC 83.57 | BRENT JAN 83.72 – a situation that indicates the rise in energy prices on the North American continent.
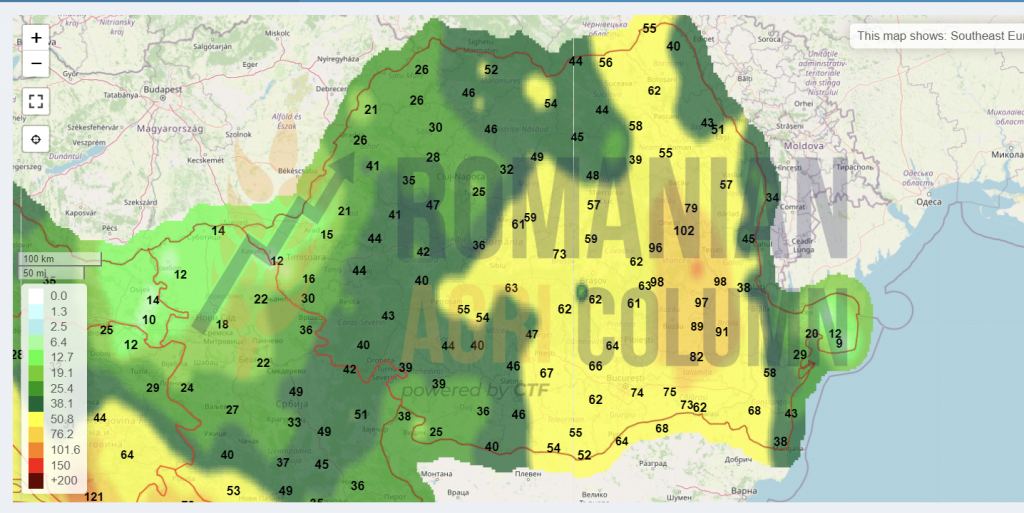
Weather forecast
30 October – 8 November 2021
Romania
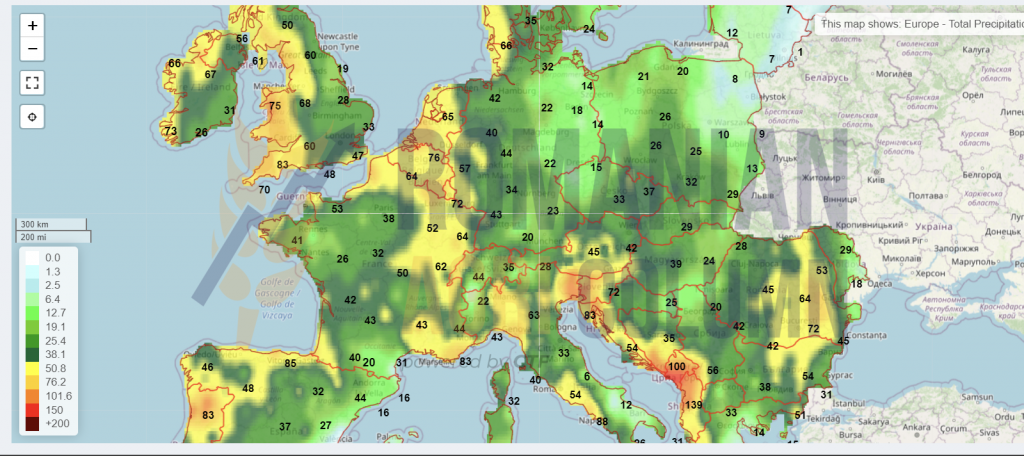
Europe
Russia
Ukraine
USA
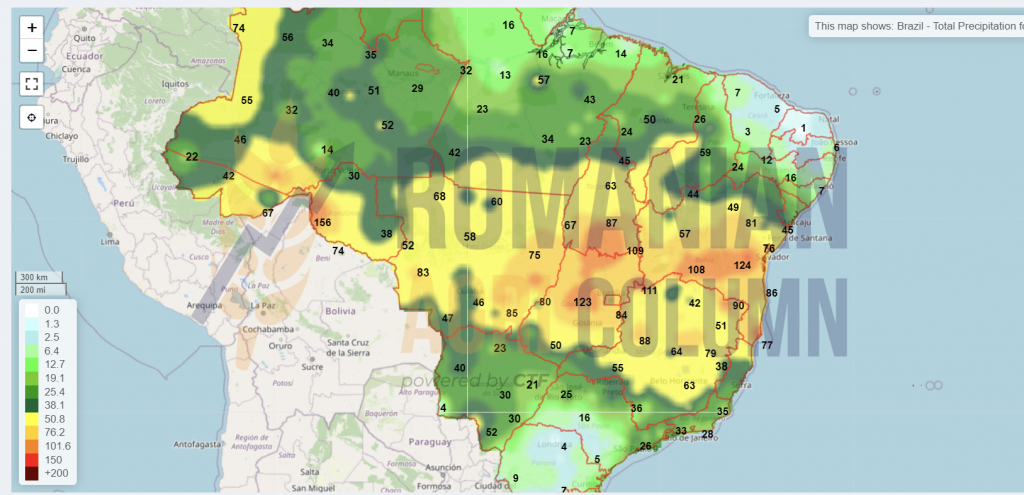
Brazil
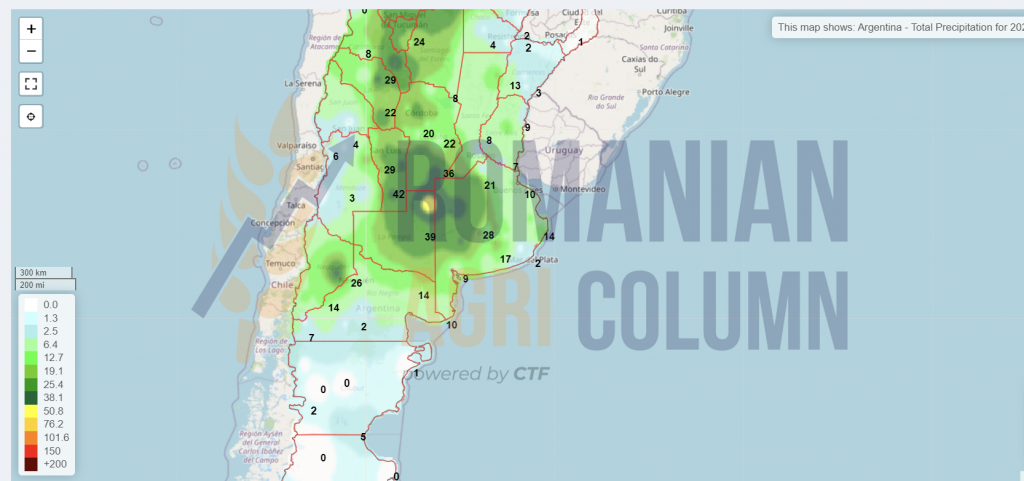
Argentina
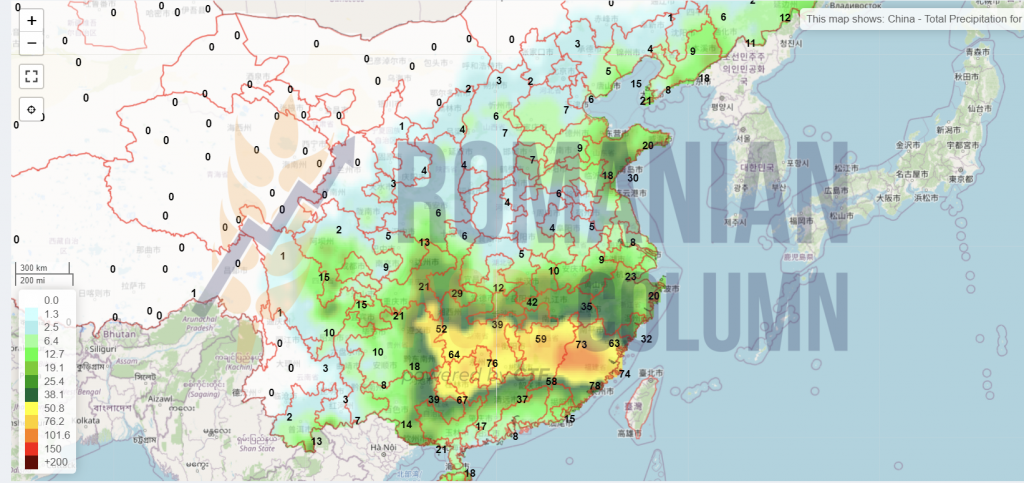
China
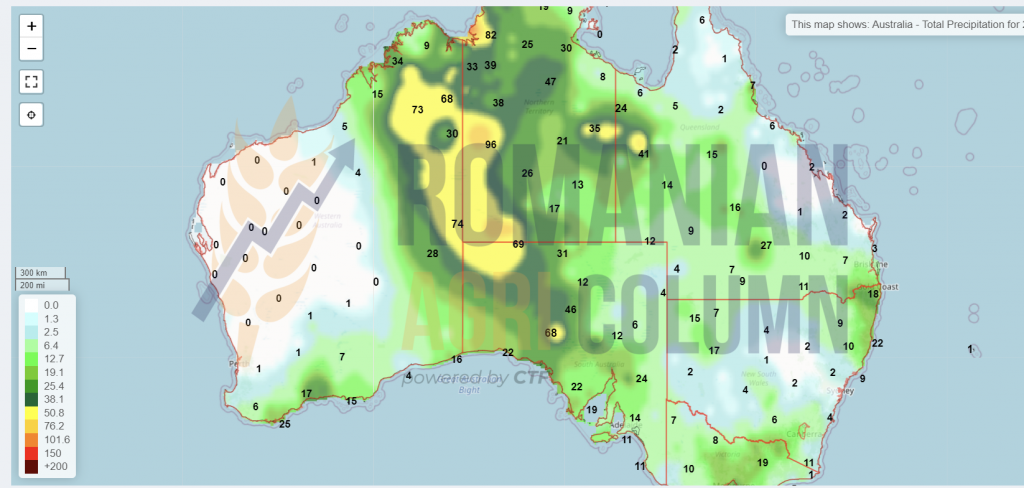
Australia
© Romanian AGRI Column, 2021, all rights reserved