This week’s market report provides information on:
FAO COMMODITIES AND FOOD INDEX
FAO CEREALS
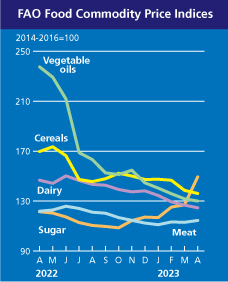
The FAO Cereal Price Index averaged 136.1 points in April, down 2.4 points (1.7%) from March and up 33.5 points (19.8%) below its a year ago. A decline in world prices for all major grains.
International wheat prices fell 2.3% in April to the lowest level since July 2021, mainly due to high export availabilities in the Russian Federation and Australia. Favorable crop conditions in Europe, along with an agreement in late April that allowed Ukrainian grain to transit through European Union countries that imposed restrictions on grain imports from Ukraine earlier in the month, also contributed to an overall softer tone on the markets.
World corn prices also fell 3.2% in April, largely due to higher seasonal supplies in South America, as harvesting continued and a favorable outlook pointed to a record production in Brazil.
FAO VEGETABLE OILS
The FAO vegetable oil price index averaged 130.0 points in April, down 1.8 points (1.3%) from March, marking the fifth consecutive monthly decline. The continued decline in the price index reflected the combined effect of the stable world price of palm oil and lower quotations of soybean, canola and sunflower oil.
After a short-lived rebound in March, international palm oil prices were broadly unchanged in April as downward pressure from weak import demand from key importing countries was offset by support from relatively tight supply from major producers.
In contrast, world soybean prices continued to decline, largely weighed down by seasonal harvest pressure from a potentially record soybean crop in Brazil, despite a significantly lower production outlook in Argentina. Meanwhile, international canola and sunflower oil prices continued to decline, mainly supported by abundant global export supplies.
FAO FOOD
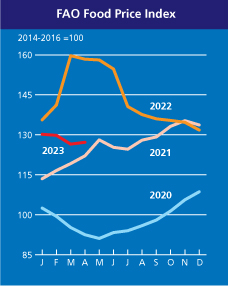
The FAO Food Price Index (FFPI) averaged 127.2 points in April 2023, up 0.8 points (0.6%) from March and standing at 31.2 points (19, 7%) below its value in the corresponding month of last year. The slight rebound in the FFPI in April was led by a sharp increase in the sugar price index, along with a rise in the meat price index, while the grain, dairy and vegetable oil price indices continued to decline.
SOURCE: https://www.fao.org/worldfoodsituation/foodpricesindex/en/

LOCAL STATUS
Wheat quotations in the Constanța CPT parity reached a level of 220 EUR/MT, in the CPT parity. Feed wheat has a difference of minus 7 EUR/MT within the discount period.
The new crop is valued at 207-208 EUR/MT and the feed quality discount is 10 EUR/MT.
CAUSES AND EFFECTS
The pace of Romanian exports is slowing down all this time, the level of 3.5 million tons was reached one way or another. A comparison with the figure of 5.5 million tons, taken as a base average, indicates that in the coming period, with whatever effort, that level cannot be reached. Imports from Ukraine exceeded 900,000 tons and greatly affected the sales balance of farms in Romania.
The Romanian new crop forecast comes with a volume forecast increasing to 10.5 million tons, which will lead to additional harvest pressure. But also in this complex, the level of funding allocated in autumn to the wheat crop is high, caused by the costs of fertilizers and crop protection products.
So a price level, as it is valued today and affected by the high level of logistics, will not generate a sufficient operational margin on the farm. Maybe a high production will mitigate it, but we will definitely be talking about a negative operating margin.
It is simple to perform a calculation. In optimistic terms, with a maximum cost of 1,000 EUR/ha of wheat, a production level of 5 tons/ha valued at today’s FCA parity price of 177 EUR/MT indicates 885 EUR/ha of farm income. The EU grant will only cover the rent, so this is a zero-sum game. To have a positive operating margin, a farm must indicate a yield level of 6-7 tons per hectare, which will lead to a margin level of 12-17% of the investment per hectare.
What needs to be understood is a simple mathematical exercise, namely that what increases, decreases and vice versa. That is, the winter selling times were opportunities that were passed or captured by many farmers, which resulted in operating margin income. And of course, farmers also have at hand the risk tool called Hedging, which generates predictability in this whole complex of futures market and physical market.
In addition to the above, a gap between the Romanian harvest and the time allotted for harvesting must also be taken into account. We will clearly have a delay of 15-18 days caused by the weather that was not permissive in terms of temperatures and of course we have to factor in the rains that delayed the treatments as well as the appearance of diseases and pests.
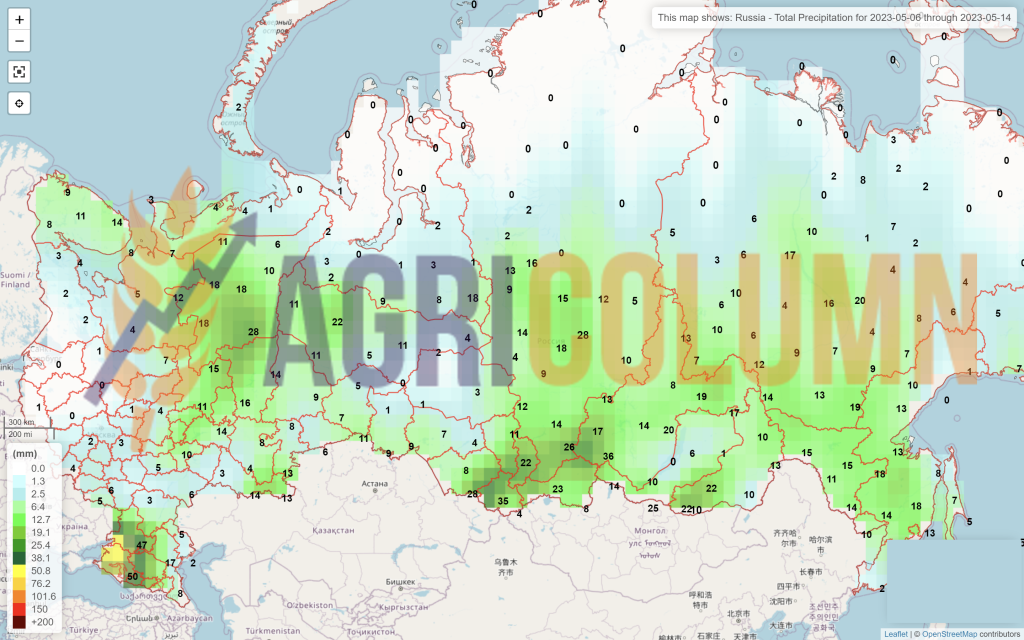
REGIONAL STATUS
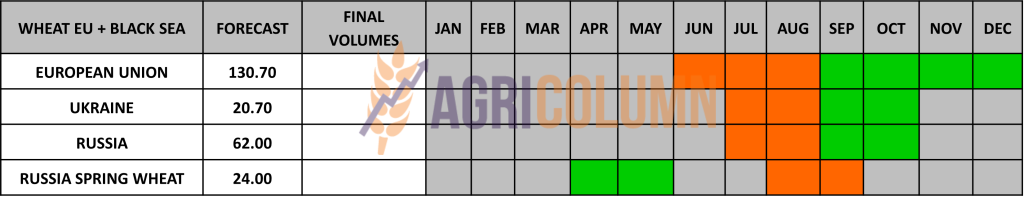
RUSSIA. No major changes in terms of the dynamics of the new crop. Its position at 87.5 million tons remains static and the weather is helping it. However, Russia’s sales reached 33.3 million tons on April 1, 2023, and Trade estimates place it at 44.4 million tons at the end of the season. However, stocks are very high in Russia, about 80% higher than a multi-year average, which in absolute terms exceeds 27.5 million tons. And this is not a factor in the potential for price growth.
UKRAINE is receiving rains and the wheat crop is developing very well, taking into account the fact that spring wheat is also being sown these days. We are not giving up on the level of 20-21 million tons as a crop potential in 2023.
The EUROPEAN UNION remains in the same positive parameters of the vegetation state. Spain remains the only area indicating major problems due to drought, but other EU countries are keeping their crop forecasts. France saw a 1% drop in overall wheat condition, but here it’s down from 94% to 93%, which doesn’t cause major concern.

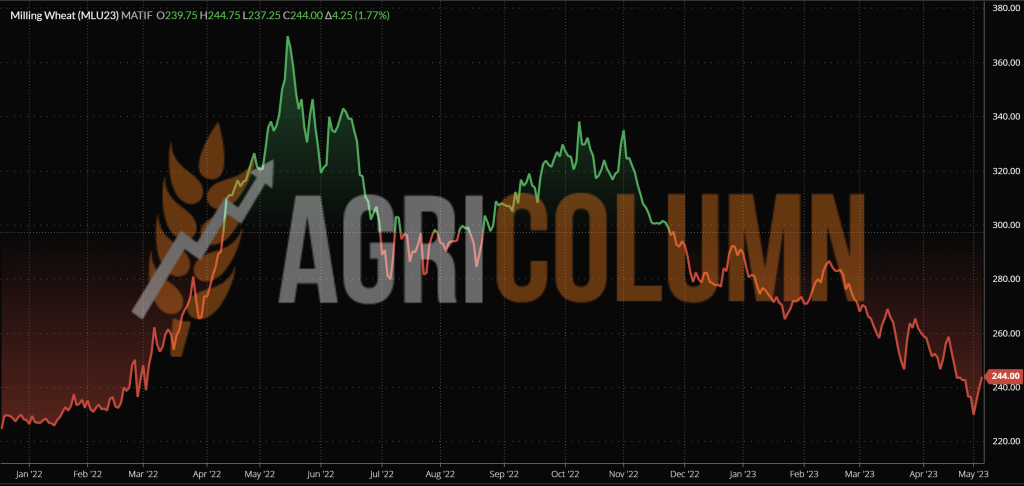
EURONEXT – MLU23 SEP23 –244 EUR (+8 EUR vs. last week)
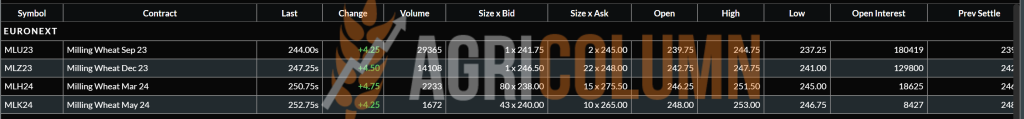
EURONEXT WHEAT TREND CHART – MLU23 SEP23
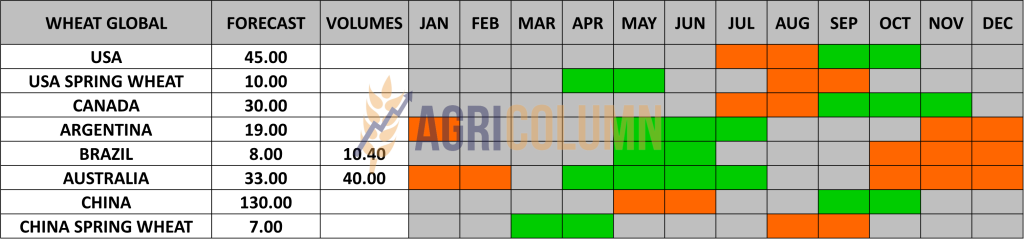
GLOBAL STATUS
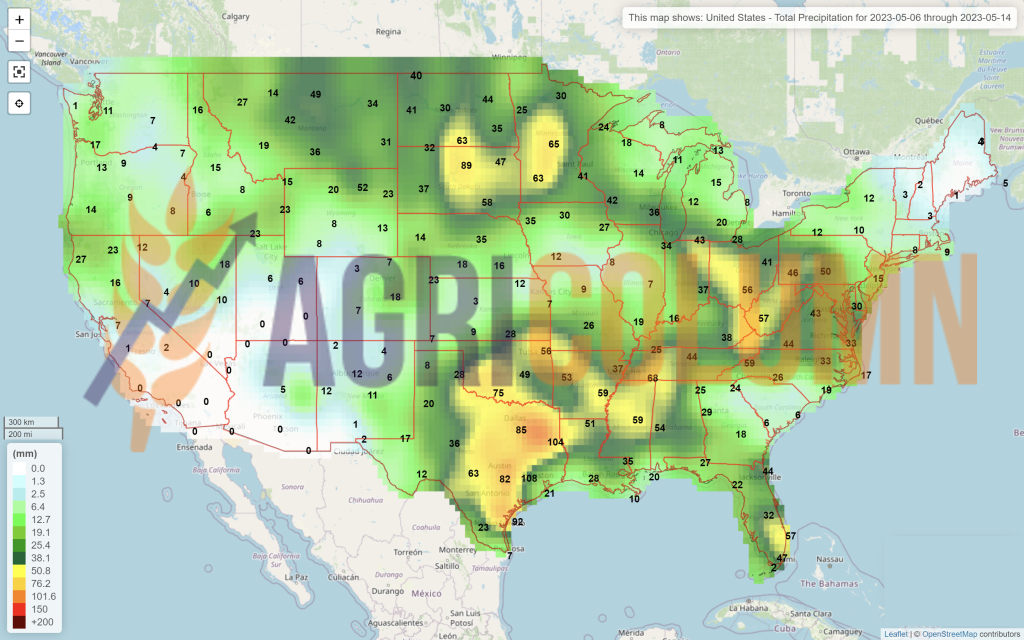
The USA generates somewhat contrary information. On the one hand, there are problems in Texas and the southern Central Plains states, and on the other hand, we have precipitation developing that will cover the other North American wheat allocations. US spring wheat is also in seeding mode and the total forecast is around 51-52 million tons. Compared to the previous season when the total North American production was only 46 million tons, we clearly have different values.
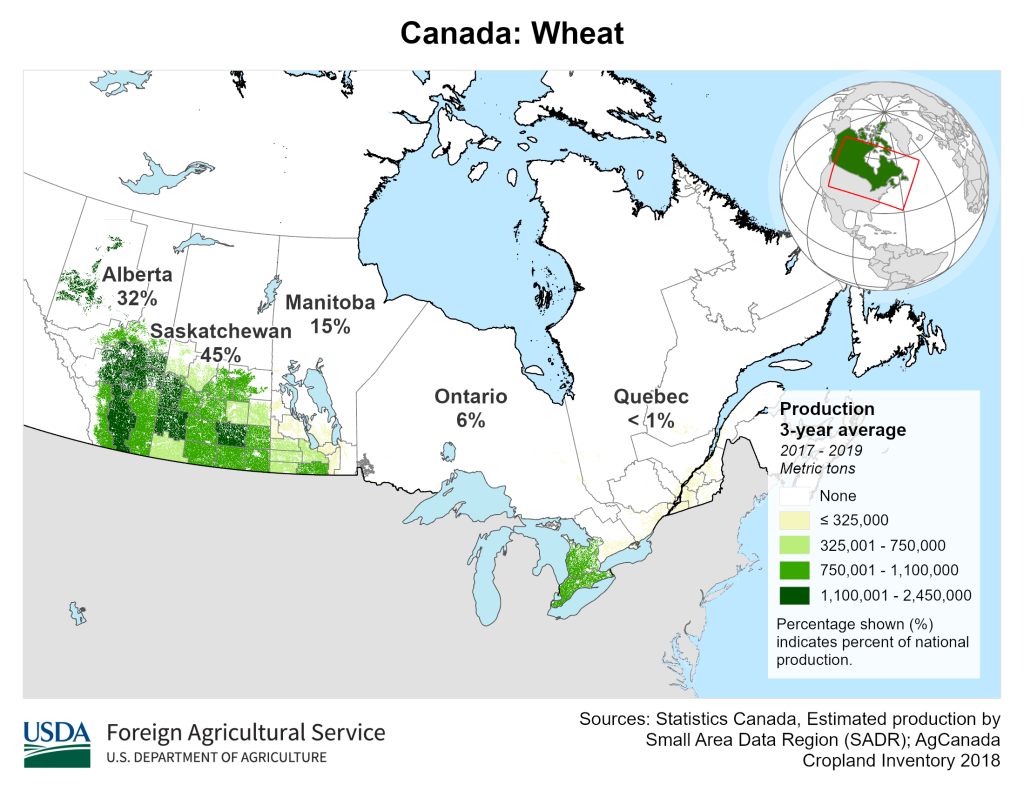
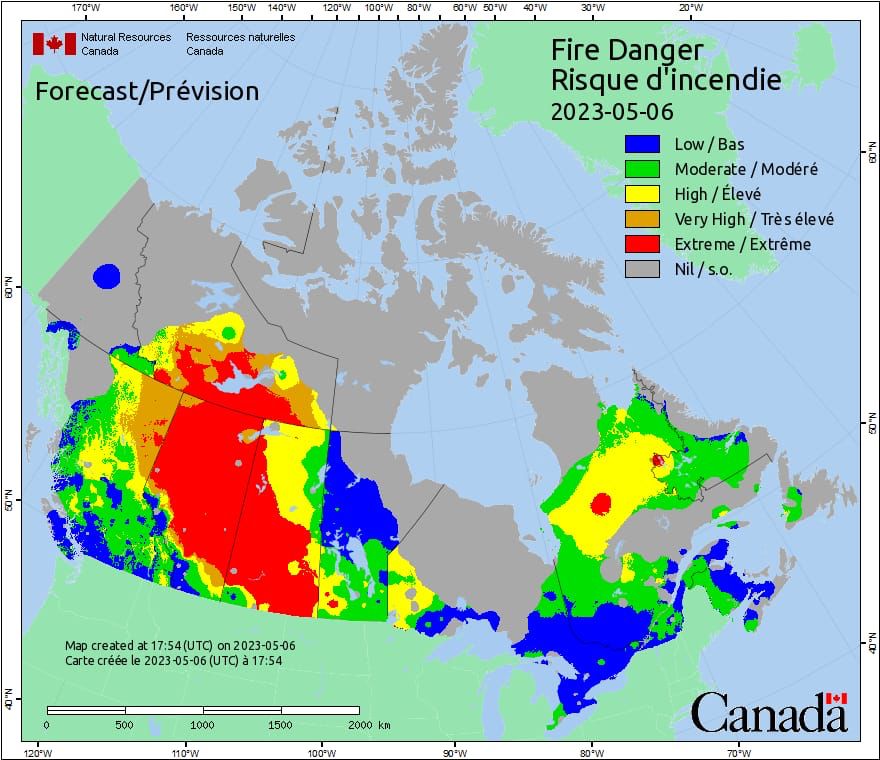
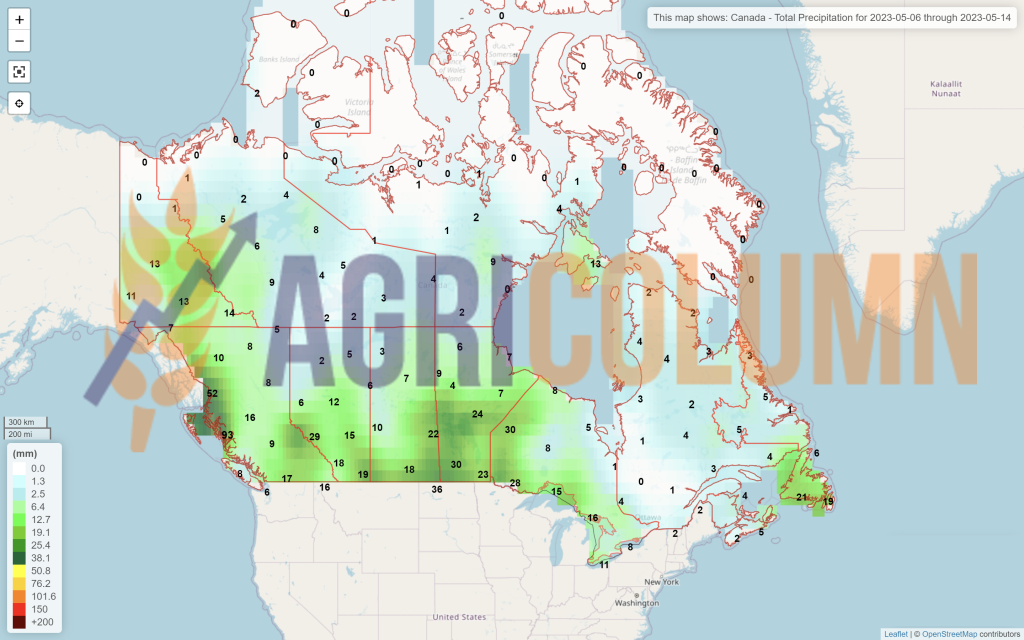
CANADA is forecasting more than 33 million tons, more precisely 33.5 million tons, which puts them in an extremely well-positioned place, entering the good average of recent years. But right now, extremely unpleasant things are happening in Canada. Wildfires starting in Alberta’s prairies are ravaging the plains. About 13,000 people are currently being evacuated and Alberta’s wheat is at risk. Dryness, heat and wind were the main factors that generated these wildfires. We do not yet know the damage estimate to the wheat crop, but Alberta is responsible for 32% of Canadian wheat production. Below you will find the Alberta region and its share of wheat production (source USDA), as well as an assessment of the state of affairs these days (source Natural Resources Canada).
INDIA remains unchanged at 107-108 million tons.
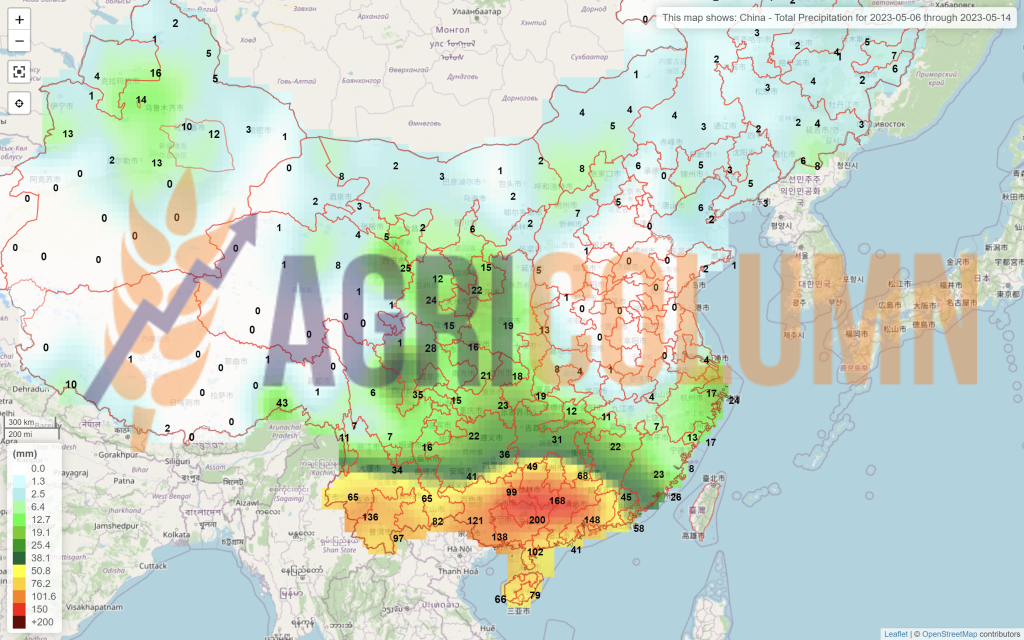
CHINA indicates in the same way, about 140 million tons, 4 million tons more than the previous season, which will reduce the import level with the harvest surplus.
We will modify the global forecast table accordingly when certainty replaces the forecast, towards increased data accuracy.
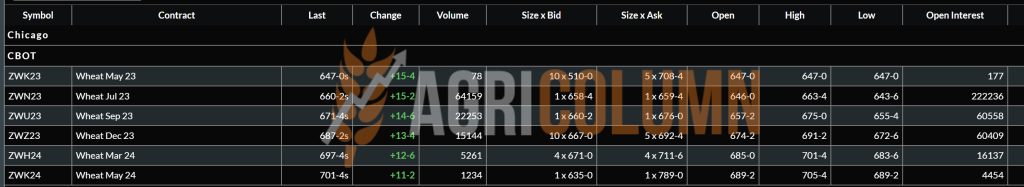
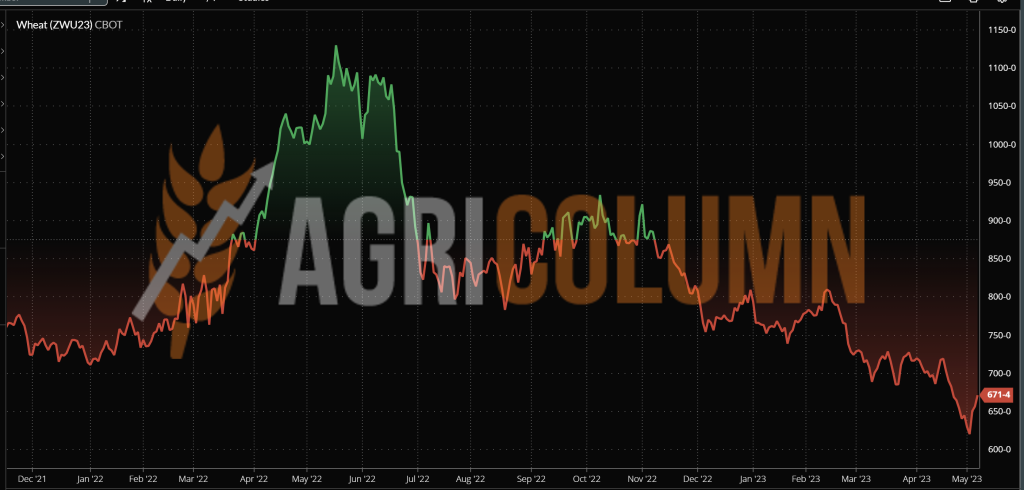
CBOT WHEAT – ZWU23 SEP23 – 671 c/bu (+26 c/bu = +9.5 USD/MT vs last week)
CBOT WHEAT TREND CHART – ZWU23 SEP23
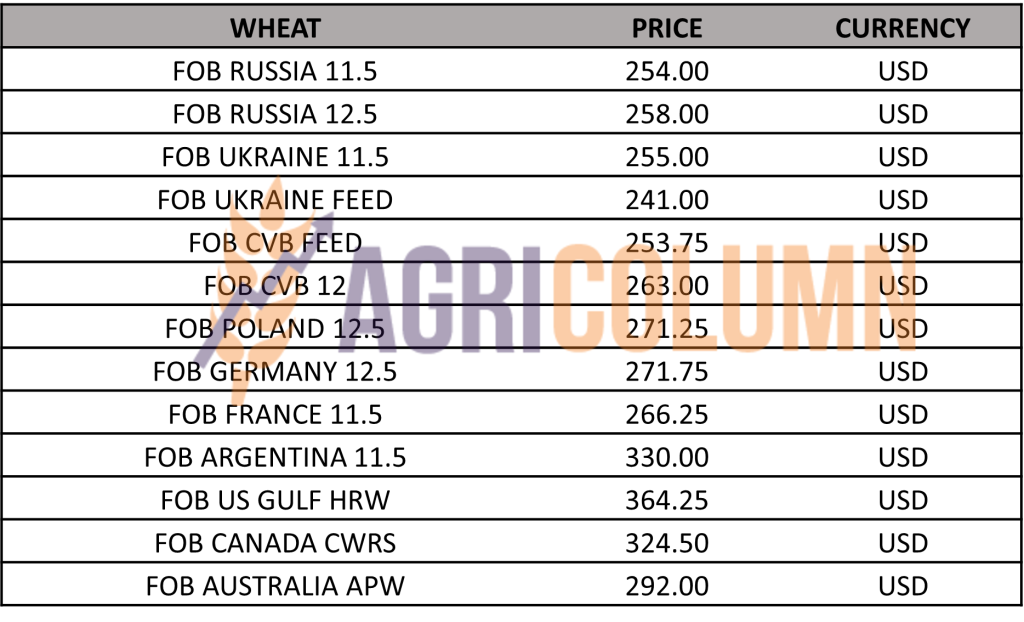
WHEAT PRICE INDICATIONS IN MAIN ORIGINS
TENDERS AND TRANSACTIONS
MIT JORDAN purchased 60,000 tons of wheat of Romanian origin from Ameropa, with delivery between October 1-15, 2023, in the CFR Aqaba parity, at the price of 288.5 USD/MT.
GASC EGYPT organized a tender for the purchase of wheat crop 2022 and crop 2023 with the following results:
Delivery June 10-30, 2023:
- 60,000 tons AgroChirnogi – $260/MT FOB + $15.5/MT freight = $275.5/MT C&F
- 60,000 tons Olam – $260/MT FOB + $15.5/MT freight = $275.5/MT C&F
- 120,000 tons Aston – $260/MT + $16.95/MT freight = $276.95/MT C&F
- 180,000 tons GrainFlower – $260/MT + $16.95/MT freight = $276.95/MT C&F
- Total 420,000 tons: 120,000 of Romanian origin (Olam sells on behalf of CCDolj); 300,000 of Russian origin
Delivery July 1-20, 2023:
- 55,000 tons Solaris – $250/MT Taman + $20/MT freight = $270/MT C&F
- 180,000 tons Solaris – $250/MT + $20/MT freight = $270/MT C&F
235,000 tons Origin Russia
CAUSES AND EFFECTS – THE STORY
Extract from the previous issue:
“What we visualize in the next period:
- A potential spike in prices generated by the actions of Russia, which obviously wants to sell its goods as expensive as possible. This spike will be welcomed by all sellers in Origins, as profit is the goal for each of them.
- A logistical bottleneck in the Black Sea basin generated by the closure of the Corridor and the redistribution of flows through solidarity lines. And Romania will feel the biggest impact. Constanța Port will not be able to generate transit for both Romanian and Ukrainian Origins. Here we will be able to witness major problems, here we already visualize a calm before the storm.”
We started by recalling from the previous issue to indicate the clarity of our vision for what is to come. And these things are happening right as you read this report.
Time is running out relentlessly, and the Corridor doesn’t seem to have a chance of extension. Technical talks between the parties involved, namely Ukraine, the UN, Turkey and Russia did not lead to any results on 5 May 2023. The arguments were not enough and neither were the potential concessions to Russia.
Turkey proposed a formula for transferring payments for Russian fertilizers through its own bank, with currency conversions to be carried out by the nominated bank. But this is not possible for the simple reason that it violates all the sanctions imposed on Russia. Turkey has built itself into a buffer zone, but the logic of the transactions says that there are also obvious benefits. But under the given conditions, there can be no talk of an agreement.
About the Corridor we can say that it is in a dormant state, with extremely few ships leaving Odessa. The line of ships at the Bosphorus is extremely long, and time is extremely short until May 18, 2023.
We therefore have enough reasons to bail on the spike caused on CBOT and implicitly Euronext. But this increase has another coherent motivation, namely the fact that the liquidations of positions in the CBOT literally reddened the indications of wheat.
Because apart from Geopolitics, the Weather also hung more weight on the descent of the wheat slide. Precipitation announced and arriving in the US has generated confidence in the North American crop.
In addition to the above, we still have the uncertainty factor and it acts during the next 10 days through two separate channels, but they have a connection exactly in the Bosphorus. We are talking here about the elections in Turkey, where President Erdogan is running for a new mandate, so a potential factor of regional change (could it be so?!?).
Let’s not forget that Turkey imposed import duties of 130% on wheat, barley and corn in an attempt to protect its local farmers. And in the same register, about Turkey’s position in the Black Sea basin as a whole, where it has the role of arbitrator-mediator that balances common and own interests leading to financial results, let’s call it what it is.
The second factor that also ends in the Bosphorus is the Corridor whose extension is 90% null at the moment. Naturally, Russia did not get what it asked for (nor could it, as we are discussing the lifting of certain sanctions), while the destination of the goods leaving Ukraine was supposed to be poor African countries, a parameter requested by Russia, it was not fulfilled under any circumstances.
The European Union has been a big beneficiary of cheap Ukrainian goods. The European Union boosted the flow of cheap Ukrainian goods for its own interest and profit, and Turkey was on the same level, which, in turn, benefited from cheap goods from Ukraine.
In times of war the biggest profits are made, and this is very visible from any angle you care to look at it. The plight of the Ukrainian people has been commercially monetized.
In addition to the above, we must not forget the fact that the 5 European countries, Romania, Poland, Hungary, Slovakia and Bulgaria, want to extend the restriction on the import of Ukrainian goods (the four on the list, wheat, corn, sunflower seeds and rapeseed, plus others that I want introduced) until December 31, 2023, as the one-month grace period is not of much use in the current context of the 5 countries.
So we have a concerted pressure complex from the Geopolitical and Logistics factors compensated by the Demand and Supply factor. This physical foundation covers the future in terms of potentially high price through the rich Supply from the origins of the Black Sea basin and the setting of a threshold of 250 USD/MT FOB Russia.
This should give us a much more robust view than the purely speculative one as Russia prepares its wheat sales offensive. They have understood that the food blackmail does not last long and are trying to flood the market with the commodity, setting price expectations through the latest GASC Egypt tender.
Summary in a few words:
- Uncertainty creates upside potential through headlines, which fuels the funds’ speculative intentions.
- Supply and Demand from Origins and Destinations will, however, generate other directions after exhausting the reasons for headlines.

LOCAL STATUS
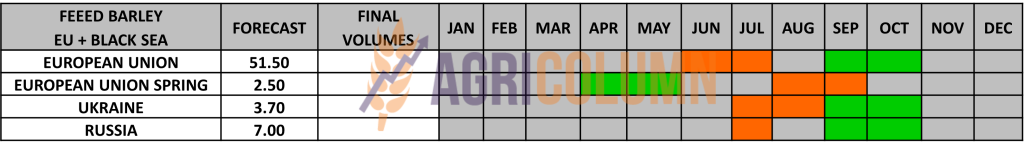
Price indications for feed barley are at the level of 186-188 EUR/MT. There are therefore no major changes and additional pressure factors on the price of new crop barley.
Supply and demand are well anchored in physical fundamentals today.
REGIONAL STATUS
EUROPEAN UNION. We have no change at the vegetative level in the EU barley crop.
UKRAINE, for its part, is sowing the spring barley, among the drops, we might say, because the precipitation remains on the scene for some time to come.
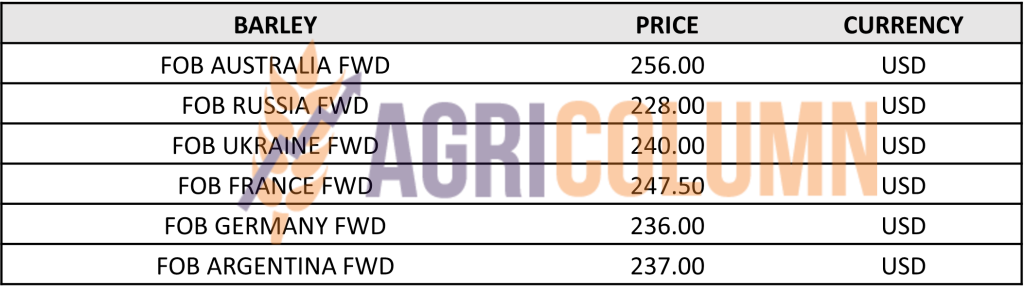
BARLEY PRICE INDICATIONS IN MAIN ORIGINS
TENDERS AND TRANSACTIONS
MIT JORDAN purchased 60,000 tons at 260 USD/MT CFR AQABA, with delivery October 1-15, 2023 from Olam. This transaction could originate in Romania, taking into account that Olam sold Romanian wheat in Egypt, so a transaction fueled by a Romanian trader.
ODC TUNISIA purchased 75,000 tons of barley at 256.3 USD/MT C&F.
GLOBAL STATUS
No essential changes.

LOCAL STATUS
Corn price indications are falling again and are positioned at the level of 203-205 EUR/MT. So, we have a new drop in price compared to the previous week.
The price of the new crop is driven in the same way towards the value of 186-188 EUR/MT.
CAUSES AND EFFECTS
Actions in the market have generated the prediction we have been making for a long time, that the price of corn will go down. It is not a happy thing for farmers and only a very good yield per hectare associated with a maintenance of the import ban on goods of Ukrainian origin could lead to a competitive operating margin. But we have to record an aspect here, namely that the level of financing per hectare was much lower for spring crops compared to autumn crops. The price of gas is down 80% from SEP22, and over the same period fertilizers are also down 50-60%, and the cost of diesel is down 40% from SEP22.
So, the premises of a positive operating margin are in place and for a yield of 8 tons per hectare with an average price of 155-160 EUR/MT FCA, a potential of 20% operating margin results.
Rainfall is encouraging these days, but sowing is proceeding slowly due to operational difficulty in the field. There are entire fields soaked in water, and the machines cannot find their traction and access roads.
REGIONAL STATUS
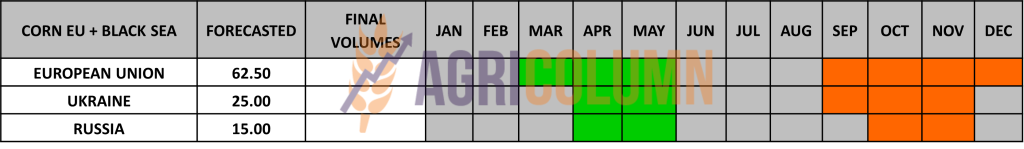
THE EUROPEAN UNION. No change in European Union, the crop forecast is still 65 million tons.
UKRAINE sows and they crossed the threshold of 1 million hectares, reaching the level of 28-30%.
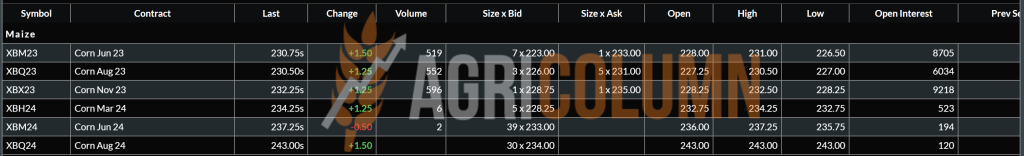
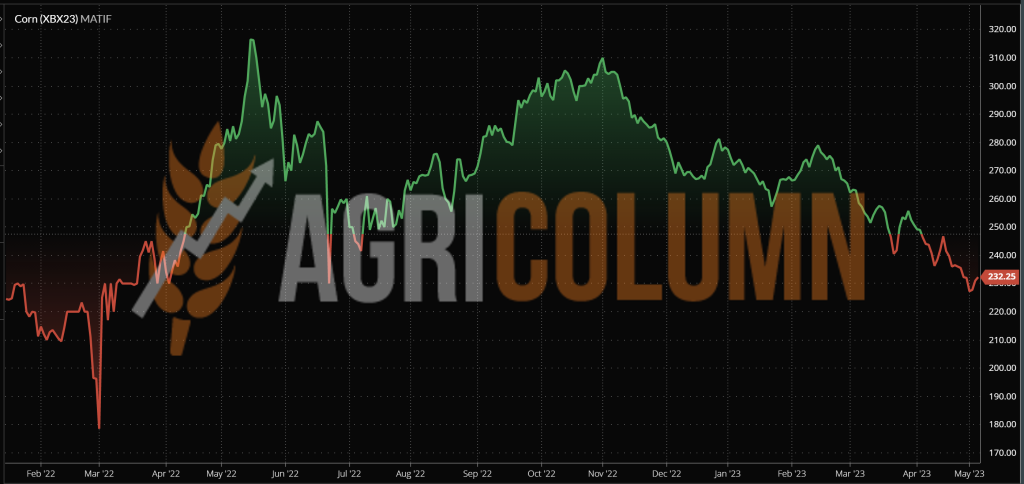
EURONEXT CORN – XBX23 NOV23 – 232.25 EUR
EURONEXT CORN TREND CHART – XBX23 NOV23
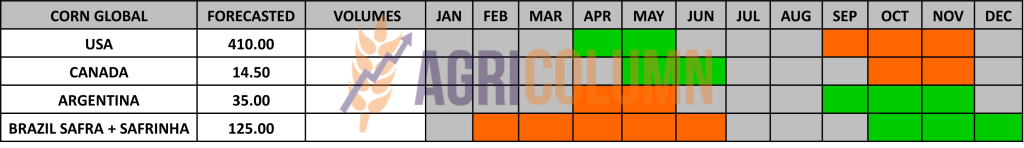
GLOBAL STATUS
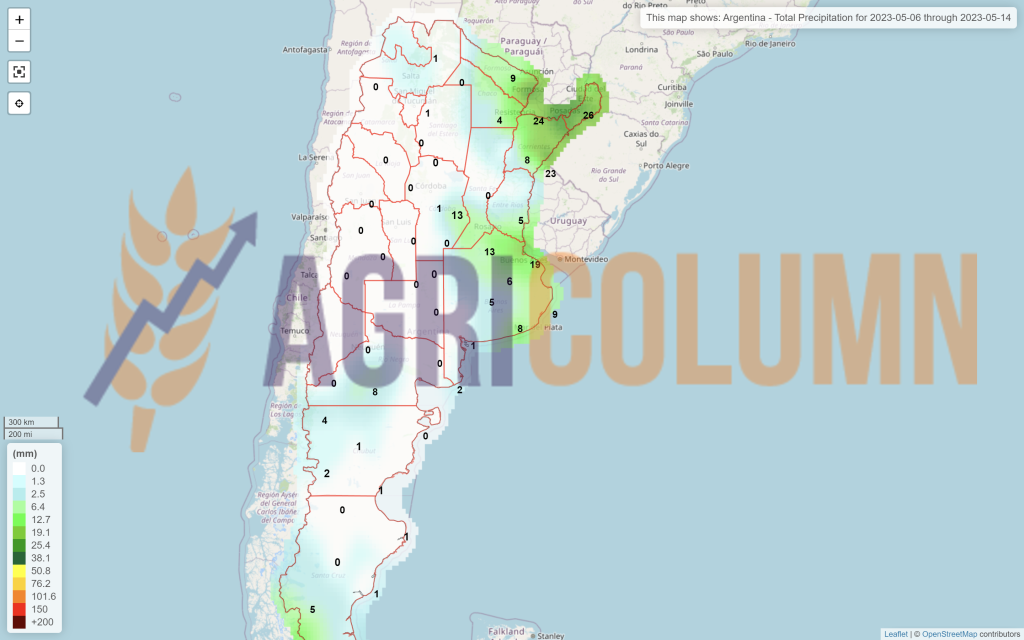
ARGENTINA. No context changes in this country. With such a dry season, things are unchanged and set as in the previous report. Thus, the harvest level reached 20% with a maximum harvest volume of 35 million tons.
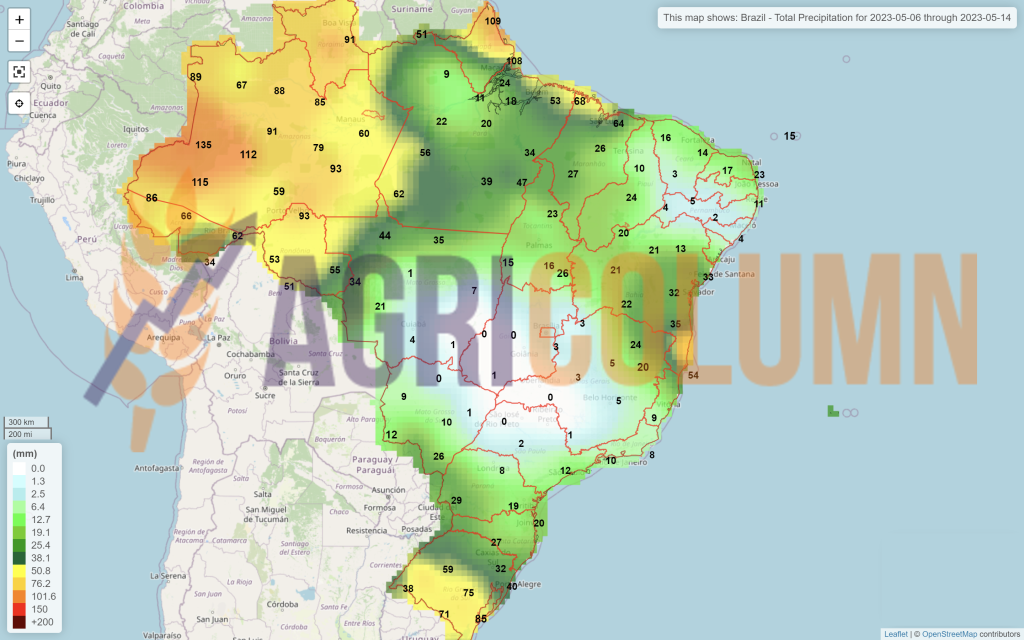
BRAZIL maintains the estimated Safra + Safrinha crop level and we note that harvesting has started in the Mato Grosso region.
USA. The 536,000 tons canceled by China puts the US in an area it has not encountered in the last 20 years. April 2023 was not a happy month for North American corn sales. At the same time, the sowing rate reached the level of 26%, exactly in the average of the last 5 years. So, as we predicted, US farmers are recovering from the slow start brought on by cold temperatures and snowfall.
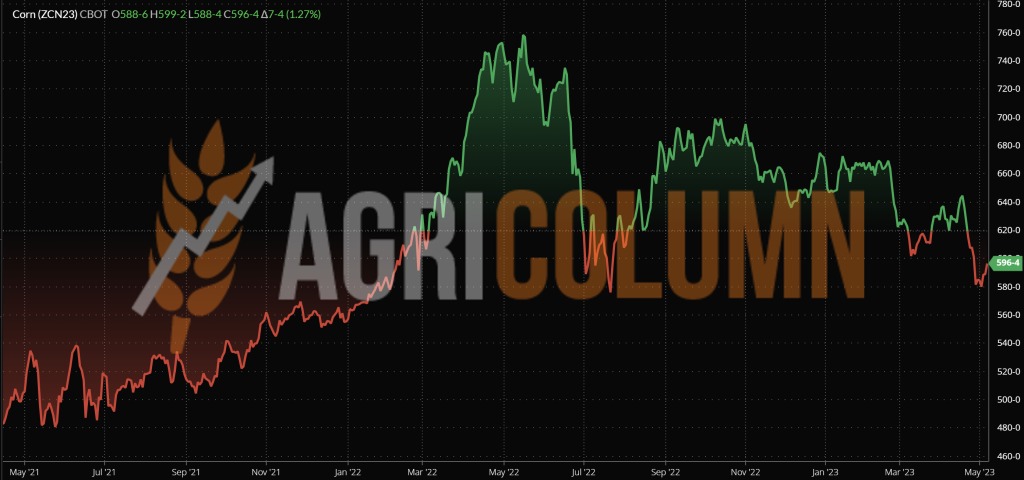
CBOT CORN ZCN23 JUL23 – 596 c/bu
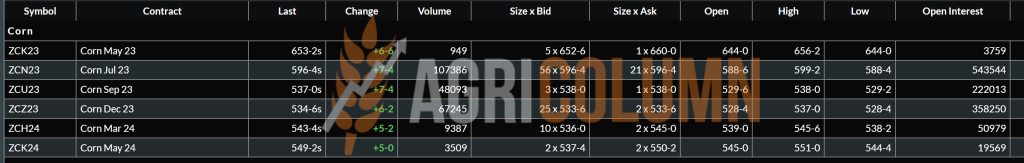
CBOT CORN TREND CHART – ZCN23 JUL23
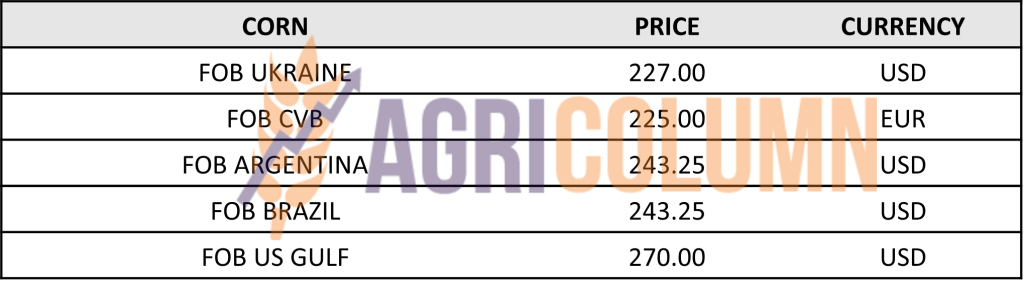
CORN PRICE INDICATIONS IN MAIN ORIGINS
CAUSES AND EFFECTS – THE STORY
MAY23 liquidations reversed hedge fund positions, as we estimated. Now moving to the next month, JUL23 has taken place but it is only ½ of the crop inverse potential applicable to corn on its way to the DEC23 indication.
The MAY23 to DEC23 corn crossover in the CBOT will be corrected many times over. In terms of Weather, as summer will undoubtedly arrive and the months of July and August are crucial for North American corn.
Europe is in the same situation of entering the weather market. The uncertainty caused by the weather will correct the price of corn and predictions point to warm weather in the territory of the European Union which, as we well know, has an import requirement of at least 18 million tons. The Ukraine and South American solution are at hand as in the previous year, but it all depends on how the Ukrainian flow will be directed.
Because with all the extension of Regulation 870/2022 which suspends the quotas applied to corn from Ukraine (we remind them in brackets as follows: Spain 2 million tons, Portugal 0.5 million tons and the rest of the EU 0.65 million tons exempt from taxes import), if the Corridor closes, transit will be extremely difficult. Via Constanța is the most accessible solution, but the private operators of the Romanian port are already focusing on Romanian goods, as Romania will generate a good crop, and exports will want to return to the previous quotas.
Today corn has greatly reduced the price level in anticipation of near-normal crops and with wheat as the market driver. We will cross the 10-day uncertainty zone together and if this zone decides to close the Corridor, we will see a positive correction in the price of corn due to the closure of an exit gate of Ukrainian corn.
In other words, the harvest volume in Ukraine will have to come out and will do so through solidarity lines. In the scenario where the import restriction is maintained in the 5 countries that have proximity to Ukraine, transit will be a very big problem. Romania will want to preserve its Constanța for Romanian goods and here we will see a lobbying front carried out by the commercial companies that will have access to goods, again, cheap from Ukraine Origin versus the state interests of Romania, in the desire to preserve its security domestic by protecting Romanian farmers.
The weather will play a not inconsiderable factor, but not now, but starting from the beginning of July 2023.
In conclusion, we have ahead of us a potential increase in the price guaranteed by the closure of the Corridor, but which could be altered by the overflow through solidarity lines of Ukrainian corn. And if it will be so, it will be the turn of the French farmers to feel these effects, because the main beneficiary Spain will want to buy a lot of goods (this season’s drought) cheap.

LOCAL STATUS
The indications are maintained on the same calculation formula for the goods delivered in CPT Constanța parity, namely AUG23 minus 40-45 EUR/MT. Processors guidance remains at the level of AUG23 minus 50 EUR/MT DAP processing units.
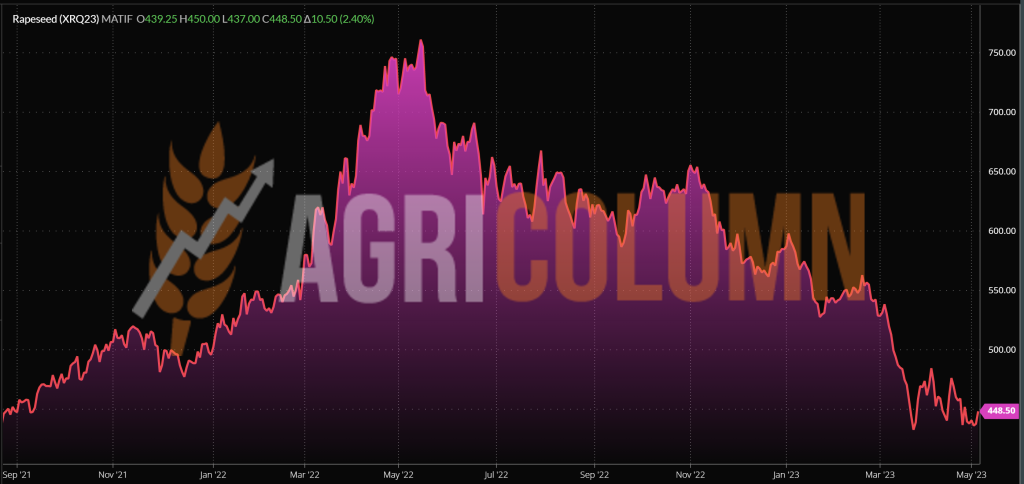
EURONEXT RAPESEED – XRQ23 AUG23 – 448.5 EUR
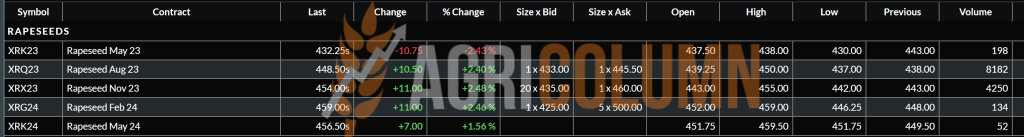
EURONEXT RAPESEED TREND CHART – XRQ23 AUG23
REGIONAL STATUS
NO CHANGE – we keep the data from the previous issue
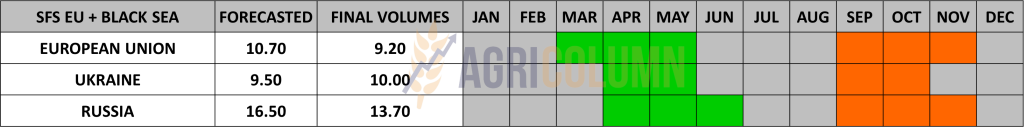
The EUROPEAN UNION remains in the same forecast status between 19.5-20.2 million tons. The Union has an impressive import volume, we could say, of 6.36 million tons mainly coming from 2 actors: Ukraine and Australia. Ukraine introduced a volume of 2.94 million tons into the Union, while Australia is at the level of 2.82 million tons.
RUSSIA forecasts 3.85 million tons as the volume of the next CROP. In line with the previous season, which places it in the Best 5 Years average.
UKRAINE is forecasting 3.45 million tons, similar to the previous season when they harvested 3.5 million tons.
GLOBAL STATUS
NO CHANGE – we keep the data from the previous issue
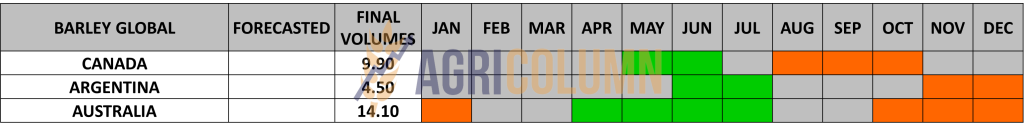
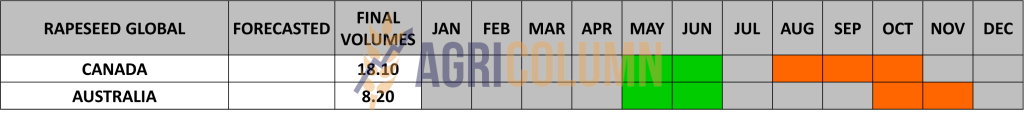
CANADA is forecasting 19.6 million tons of canola next season and rainfall in Alberta and Manitoba is encouraging at the moment.
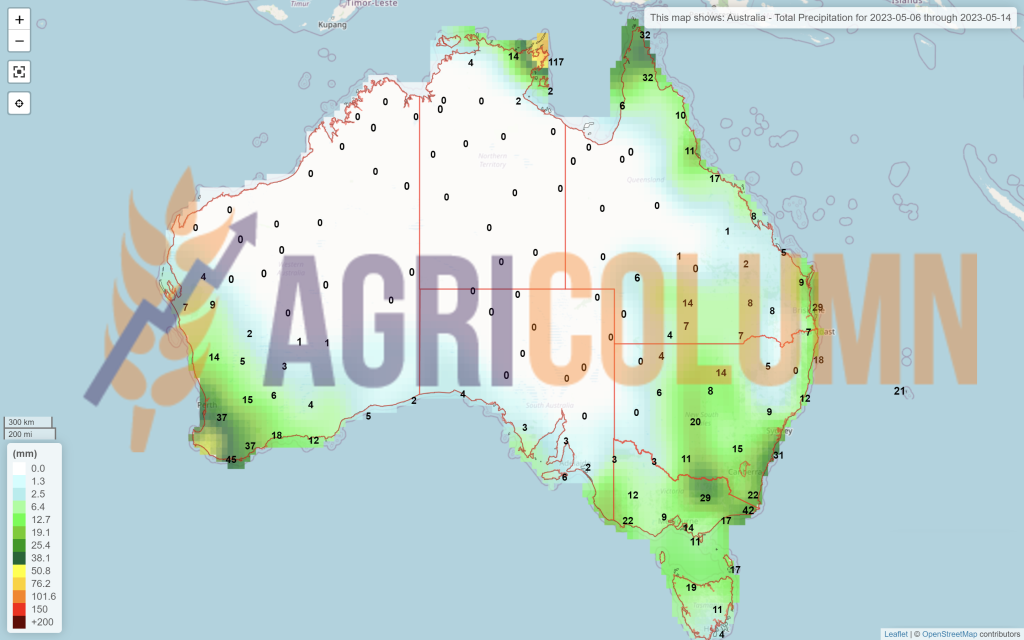
AUSTRALIA generates an average forecast of about 6.9 million tons with the mention that the effects of El Nino could generate adverse conditions, i.e. drought.
INDIA generates a forecast of 11.8 million tons. It is a high forecast compared to the average of the last 5 years, which is 9 million tons, and also above the previous season, when they harvested 11.5 million tons.
CHINA. 15 million tons is their forecast, up 0.3 million tons from the previous season. The average of the last 5 years is 13.8 million tons.
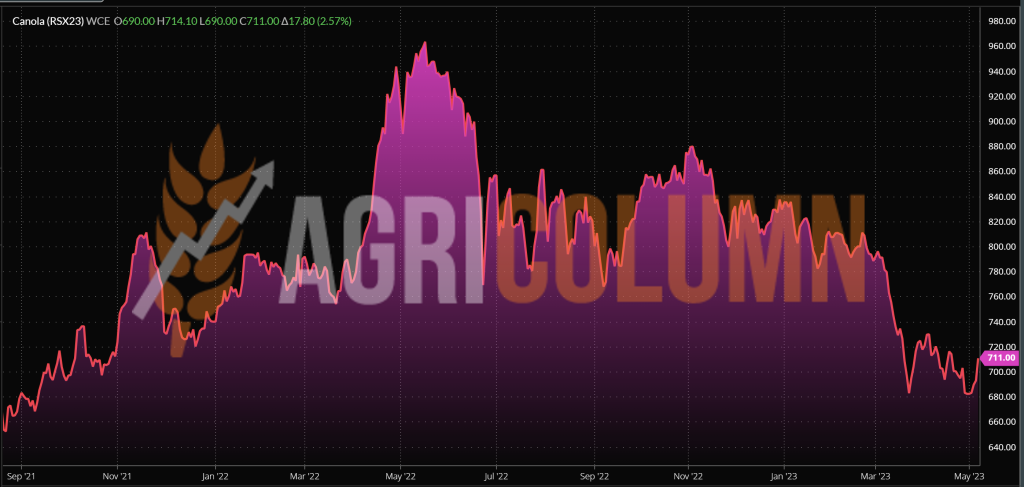
ICE CANOLA RSX23 NOV23 –693.2 CAD

ICE CANOLA TREND CHART – RSX23 NOV23
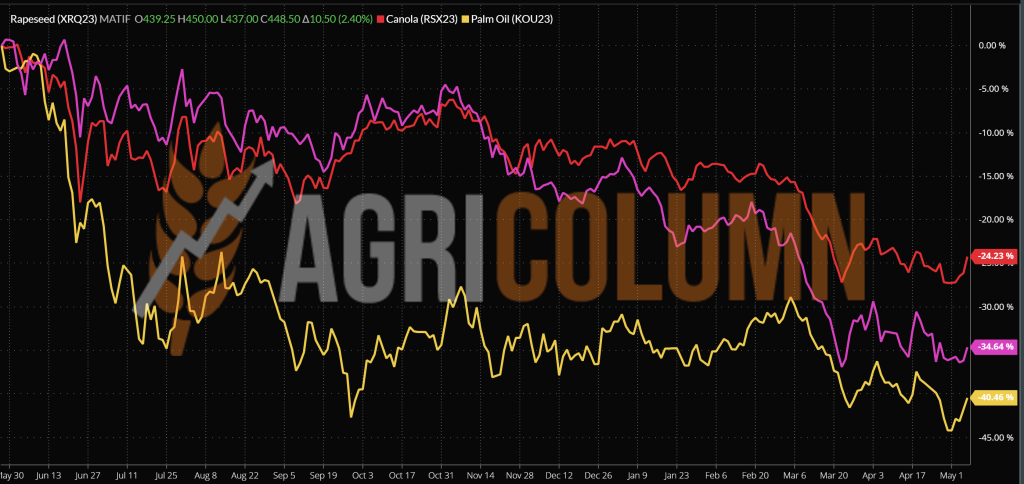
COMPARATIVE GRAPH. CPO PALM OIL EFFECT (YELLOW) TRENDING CANOLA/RAPESEED
CAUSES AND EFFECTS – THE STORY
Oil and Palm Oil supported the 10 EUR gained by European rapeseed last week. The initial consolidation of Oil even with only 2 USD aggregated with the increase in the price of CPO (crude palm oil) generated support for European rapeseed.
Palm oil is likely to be traded locally in Indonesia. In order to thus cover all the potential that this country loses due to the fact that it is one of the two main producers. Thus, it consolidates in trading, even if there are still many elements to modify in the creation of a stock exchange.
But here the uncertainty factor generated by geopolitics also intervened. The closure of the Corridor will cause traffic problems for Ukrainian rapeseed. 1 million tons of Ukrainian rapeseed left through the Corridor destined for the European Union. And now, in case of closing this valve, we will see the redistribution through the lines of solidarity.
But there is a big logistical problem here. And please read carefully, as this is a travesty in commercial interests. The European destinations of these million tons of Ukrainian rapeseed were the countries of Western Europe: Belgium, The Netherlands, Great Britain, France. In other words, these destinations that can only be reached by sea. And which shipping route is optimal and cheap? The one through Constanța of course. Transit, let’s say, if the European Commission decides to extend the import restriction in Romania. Here, things get very complicated. If the corridor is closed, other goods will try to transit through Constanța. Corn, wheat and why not, Ukrainian sunflower oil as well as sunflower seeds.
What will this generate?
First of all, it could lead to an increase in logistics costs, which have increased a lot in the last period anyway. Although the price of fuel has fallen by 40% since September 2022, the fraction allocated to fuel in the cost of transportation may not fall accordingly, which could exacerbate cost pressure.
Second, there is a potential for a reduction in the base level as it is enacted today. The basis is at such a high level because of Romania’s failure to convert emissions from Joules/KG to grams of CO2/KG of dry matter. Thus, 20 EUR of the basis is the effect of this unresolved issue. In other words, this money does not go to the farmers because the processors cannot sell either the rapeseed oil or the rapeseed intra-Community due to the fact that this sustainability parameter is not met.
Rapeseed of Romanian origin will be sought after by local processors, so there will be interest. However, the abundance of the EU crop, aggregated with pressure from the Ukrainian crop will result in a long-term cap of around 430-440 EUR/MT, if not even lower at harvest times.

LOCAL STATUS
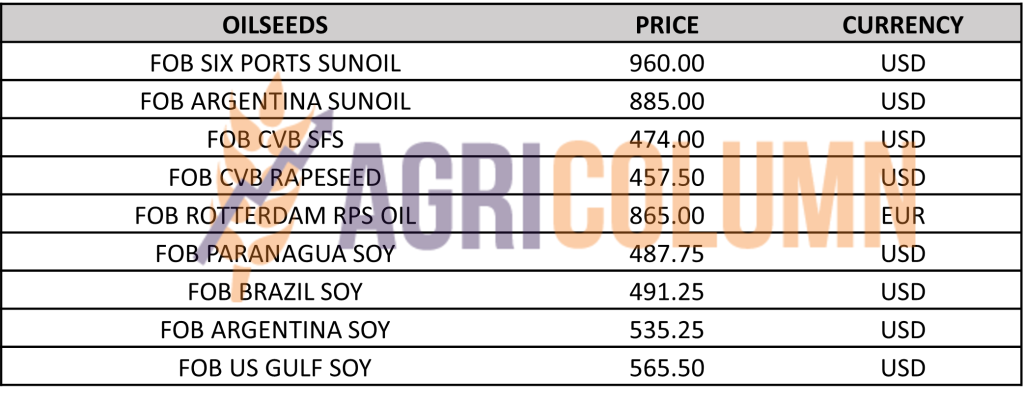
Constanța port quotes sunflower seeds at the level of 420 USD/MT. Local processors are indicating 410-415 USD/MT.
The quotation level of the new crop is set at 400 USD/MT in CPT parity Constant, which leads to a level of 390 USD/MT for the cargo delivered to the processing facilities.
CAUSES AND EFFECTS
The coverage requirement starts to fade visibly. Prices fall and return to previous levels. There is a logic to the cursiveness of time, and sunflower seeds do not discount from this parameter called the life cycle of the price.
Romania will generate a minimum of 3 million tons. The precipitation that covered the territory in the last period entitles us to generate this minimum volume. And here we have the same calculation which indicates a slightly pessimistic shade about the operating margin in the farms. Only a high production of over 3.5-3.8 tons per hectare can generate an operating profit of 10-15% in the case of sunflower seeds.
But at this moment, nothing is defined. Neither the harvest level nor the promised effects of the import ban applied to seeds of Ukrainian origin. Moreover, the Republic of Moldova wants, for its part, to apply restrictions to Ukrainian imports, for two reasons, the first being the over-saturation of the market with cheap goods and, implicitly, the decrease in local prices. And the second one is related to the potential for evasion.
Ukrainian goods could be indigenized locally and resold to Romania as goods of Moldovan origin. And Moldovan goods have no import restrictions in Romania. This would lead to a visible circumvention of the import restriction and implicitly to some tensions in terms of control and verification capacity between the competent authorities.
REGIONAL STATUS
UKRAINE has reached a seeding level of 9%, with more than 500,000 hectares at this time.
RUSSIA has no change; it is also at the time of sowing.
The EUROPEAN UNION, for its part, is sowing the seeds, and the precipitation forecasts at the European level are nothing but beneficial.
GLOBAL STATUS
ARGENTINA closes harvest at 3.7-3.8 million tons and is extremely present and competitive in the export of crude sunflower oil, which does nothing but reduce the price level in 6Ports.

PRICE INDICATIONS FOR OILSEEDS AND CSFO IN MAIN ORIGINS
CAUSES AND EFFECTS – THE STORY
EXTRACT FROM THE PREVIOUS ISSUE
“We’re holding the summary of the last report and viewing a coverage request for the month of MAY, so we’re discussing SPOT. This will naturally close and the 15-20 USD of demand will dissipate.
In conclusion, geopolitics and weather will dictate the next period, with potential growth coming from the closure of the Corridor.”
We are going on the road in our conclusions based on those extracted above from the previous issue and we see two scenarios for the development of the situation in the next period.
First of all, we look at processors who do not want to position themselves in terms of price for the new crop.
- The European Commission will extend the suspension of imports from Ukraine to the 4 categories of products under the pressure of the 5 countries. In this scenario, Romanian processors as well as those in Bulgaria will be obliged to purchase only from Romania and Bulgaria respectively. This will lead to much more aggressive domestic competition in terms of pricing. Because Romania is the reservoir of Origin for the EU and implicitly Bulgaria. In this scenario, we will see increases in the new crop sunflower seed price level with prices starting at a minimum of 430-440 USD/MT cargo delivered to Processors. Competition will come from Bulgaria, which will want to cover the processing capacity of 3 million tons. Bulgaria has a production volume deficit compared to the processing one, so they will cross the Danube in search of volumes.
- The European Commission will not extend the import ban, a situation in which goods of Ukrainian origin will be able to be brought to Romania, thus penalizing the price by volume. Thus, Bulgaria will disappear from the competitive landscape and the Romanian market will regulate the price of the much richer offer. In the previous season, Romania imported 760,000 tons of sunflower seeds from Ukraine. That’s why no price is put, I would say timidly, on SFS goods. Waiting will not create any discomfort at this time. There are still exactly 31 days until the decision of the European Commission, but anyway we will know in advance how the influence will flow from the extremely powerful and influential lobby groups. In other words, if I were a sunflower seed seller today, I would wait and not make any decision to sell even if I have an indication of 400 USD CPT Constanța. Because there is always another factor, namely the Weather, and we must not forget it under any circumstances.

LOCAL STATUS
In Romania, the price indications for soybeans are at the level of 480 USD/MT, DAP processing units for non-GMO soybeans.
REGIONAL STATUS
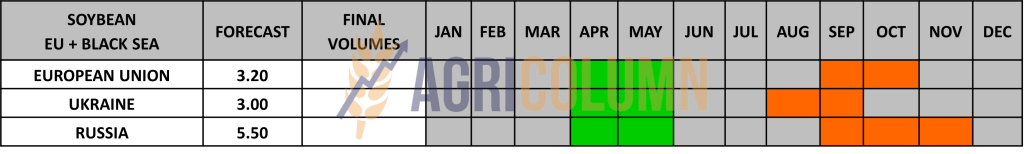
THE EUROPEAN UNION. Total imports of soybeans this trading season reached 10,000,000 tons, and soybean meal reached 12.7 million tons.
GLOBAL STATUS
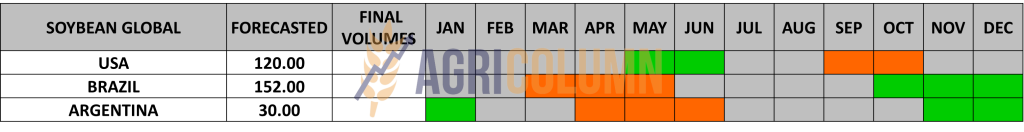
ARGENTINA. Argentina’s soybean harvests advanced 8.2% to 36.4% of the 16.3 million ha area last week. With an average yield of 1.58 tons per hectare Bage kept its soybean production estimate unchanged at 22.5 million tons.
BRAZIL. It has reached 92-93% in the process of harvesting soybeans and everything is going smoothly. The same crop forecast of 155-156 million tons is maintained. Over 19% higher than the previous season.
USA. US 2023 soybeans are 19% planted, a substantial advance from last week. The incoming precipitation is beneficial for the newly established soybean crop.
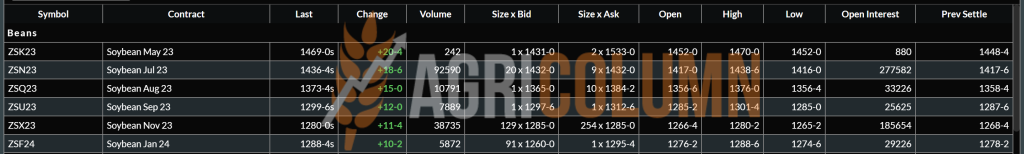
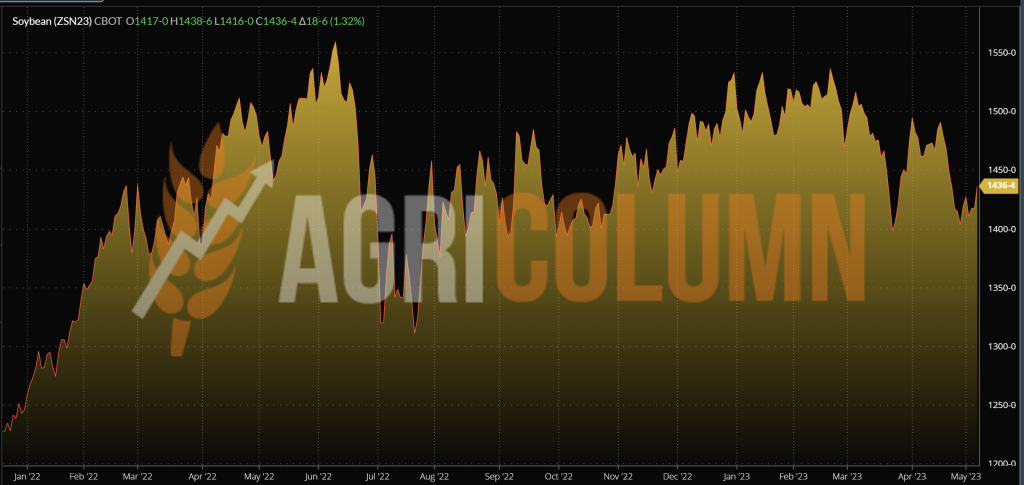
CBOT SOYBEAN ZS N23 JUL23 – 1,436 c/bu
SOYBEAN GRAPHIC TREND – ZSN23 JUL23
CAUSES AND EFFECTS – THE STORY
Soybeans bounce back on the last trading day of the previous week. Soybeans are now a bet, and as we see things now, weather is a parameter worth considering in the near term for the North American soybean crop.
Because Brazil, with the intake of 155 million tons, Argentina, crushed by drought, with 22.5 million tons, totals around 177-178 million tons. The US must bring a minimum of 120 million tons into this equation, and this figure is only weather dependent, as US farmers will plant their allotted acreage. So the world’s 300 million tons of soybeans depend on the US right now. That is why the indications are gaining ground. But let’s remain cautious with that crop inverse that we evoke in each issue and which, in turn, will create effects if the weather behaves normally.


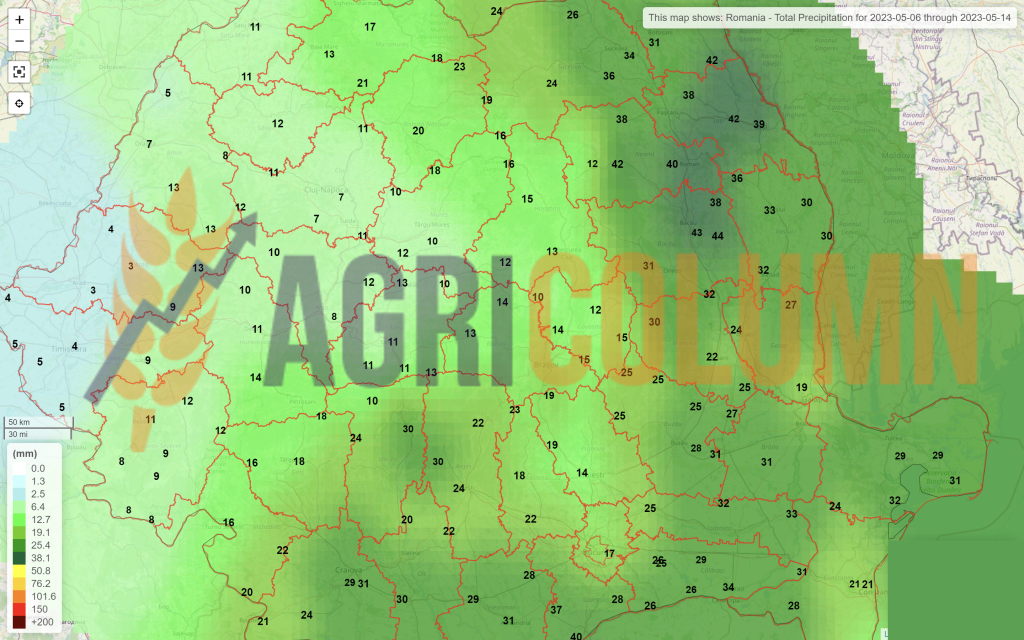
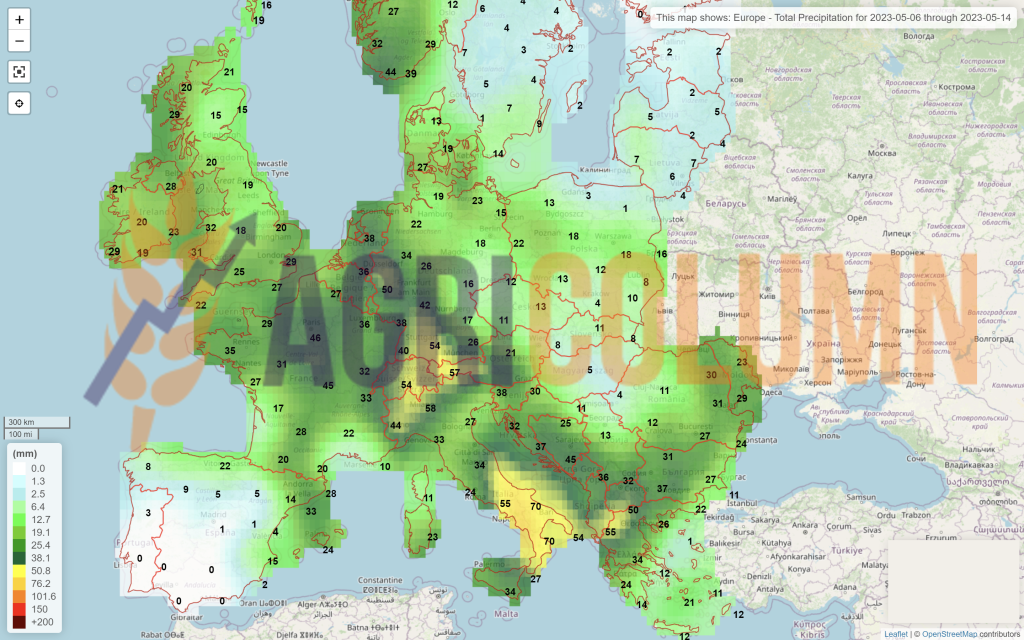
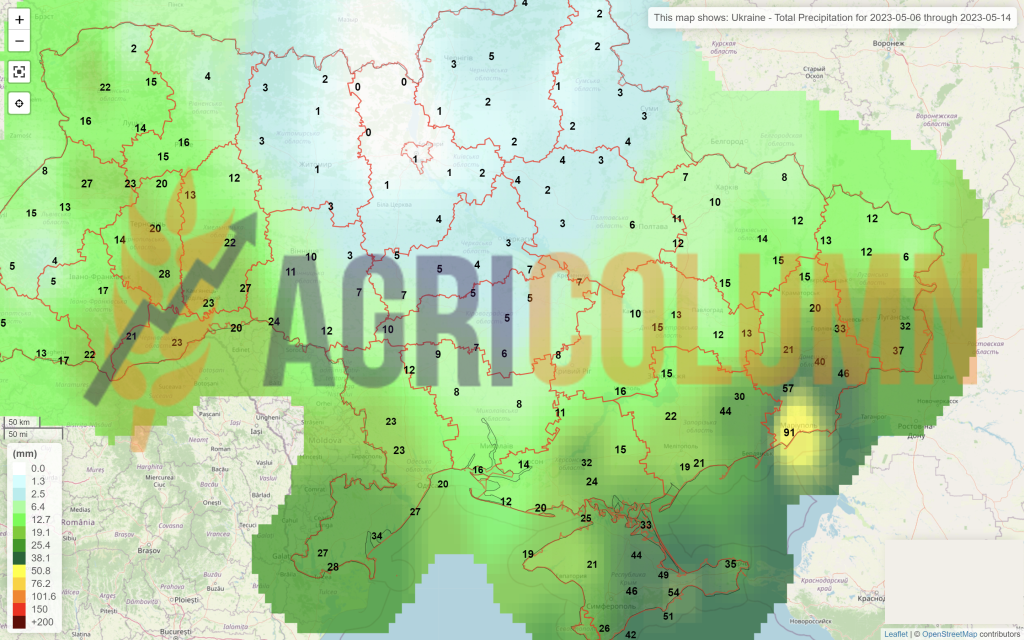
6-14 May 2023
Romania
Europe
Ukraine
Russia
Canada
USA
Brazil
Argentina
China
Australia