This week’s market report provides information on:

LOCAL STATUS
The price indications related to the port of Constanța are summarized at a level of 315-317 EUR/MT. For feed quality, the indication drops by 20-25 EUR/MT.
There is a lot of unsold merchandise in the country. Farmers and traders bet on a post-harvest boost that didn’t come. We’ve been saying this obsessively since May. Anti-inflation measures played a decisive role in the decline in price indications, along with the easing of tensions from the Ukrainian Green Corridor.
More recently, we are seeing very large batches of 50,000 tons offered for sale monthly by large companies. This is a very important signal about how things will go in terms of price action.
CAUSES AND EFFECTS
We agree that Ukrainian flows have created obvious distortions in the Romanian market. We agree that the logistics were messed up and its cost indications doubled, but the decision to sell at a certain point was in everyone’s hands.
Normally, there should have been measures to safeguard the interests of Romanian farmers, measures to mitigate unfair competition between Ukrainian and Romanian goods. Because yes, it is an unfair competition, if we judge only through the prism of the costs of establishing crops and through the freedom of transit and commercialization through Romania. And, unfortunately, apart from the sequencing and segregation of flows, there are no other certain and verifiable means that can mitigate the impact on Romanian farmers.
In addition to this, traceability does not exist. It is an aspect suddenly forgotten by the European Union, in its economic desire to supply the single market with cheap goods.
The problems will soon be seen as a large mass of farmers will fail and will no longer be able to carry out the annual production cycle. A large part of the farmers will be literally decapitalized. And the Romanian agribusiness system will, little by little, become safe prey for the capital that will move from Ukraine to Romania.
The cost of waiting, as we can call the retention of goods, is an extremely harmful one. In addition to the lack of financial liquidity, we also have the financial costs of retention, as many farmers have taken out stock loans with very high interest rates. This aspect only complicates the price of the goods, as it collects a minimum of 3 EUR/MT of stored goods monthly. Apart from that, the storage cost is also in place with its definite value. If we calculate for 4-5 months of storage, the level of financial loss is at least EUR 20/MT, under the condition that market pressure is evident. A Black Sea basin full of wheat is the description of the current landscape.
REGIONAL STATUS
RUSSIA is backed by the latest WASDE report by 3 million more to the level of 91 million tons and an export forecast of 42 million tons. Analysis houses, however, “read” Russia with 95 million tons, and the most optimistic lead the level to 96.4 million tons, from an area of 25.8 million hectares.
UKRAINE is also updated by 1 million tons, from 19.5 million tons to 20.5 million tons.
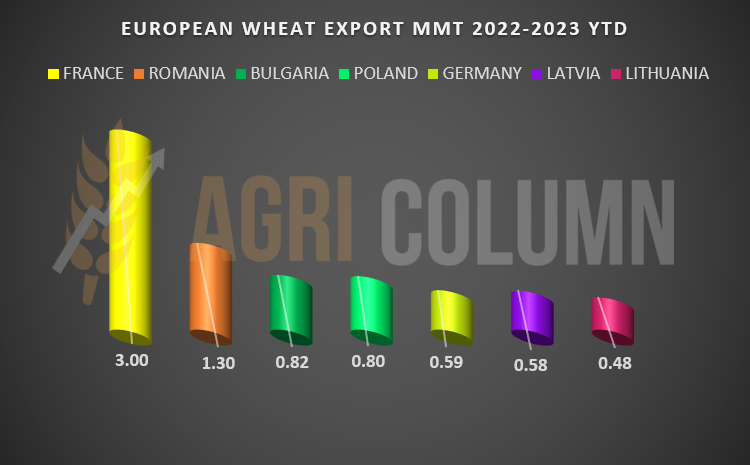
The EUROPEAN UNION still receives a surplus of 0.8 million tons of wheat and we can say that France knew how to draw the winning lot. They aggressively sold in GASC tenders and when everyone was wondering why they are selling when they have no merchandise, they bet on the decline which was evident as early as mid-July 2022.
Thus, we have a picture that illustrates very well the intuitive behavior of France, Romania’s attempt to play penalized by the lower volume of cargo and the proximity to Russia, as well as by the other volumes that make up the approximately 7.6 million tons exported by European Union up to this point.
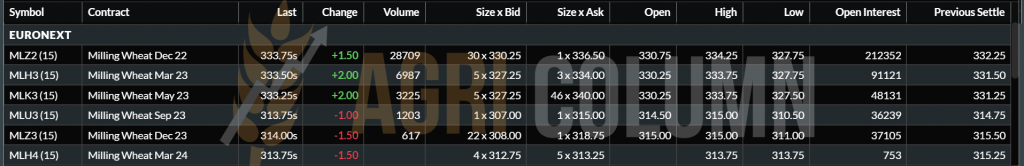
EURONEXT MLZ22 DEC22 –335.75 EUR (+1.5 EUR)
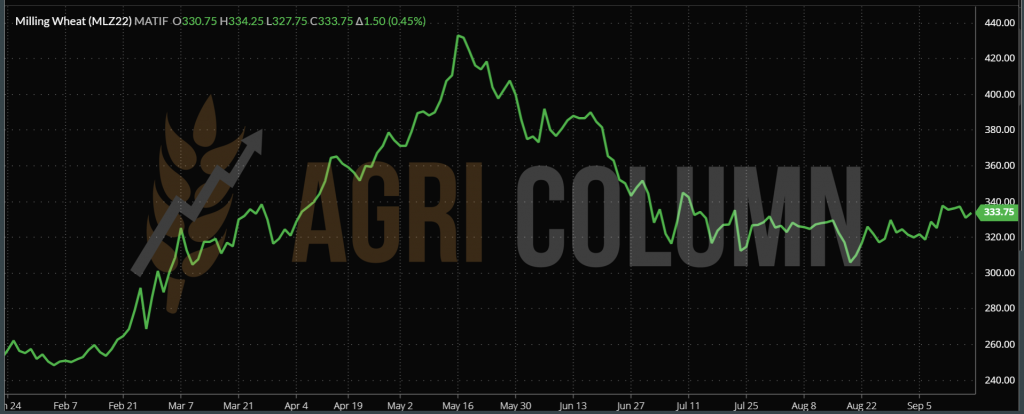
WHEAT TREND CHART – MLZ22 DEC22
GLOBAL STATUS
CANADA is harvesting in full blast and the volume to be gathered is 34.7 million tons, so in line with initial expectations.
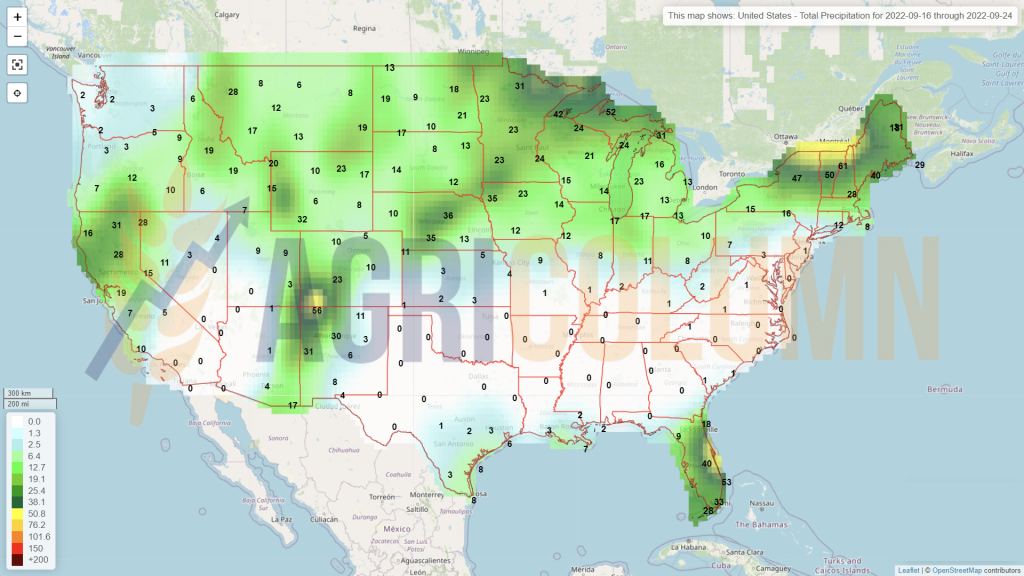
The US has no change and remains at 48.4 million tons. Stocks are similar to August.
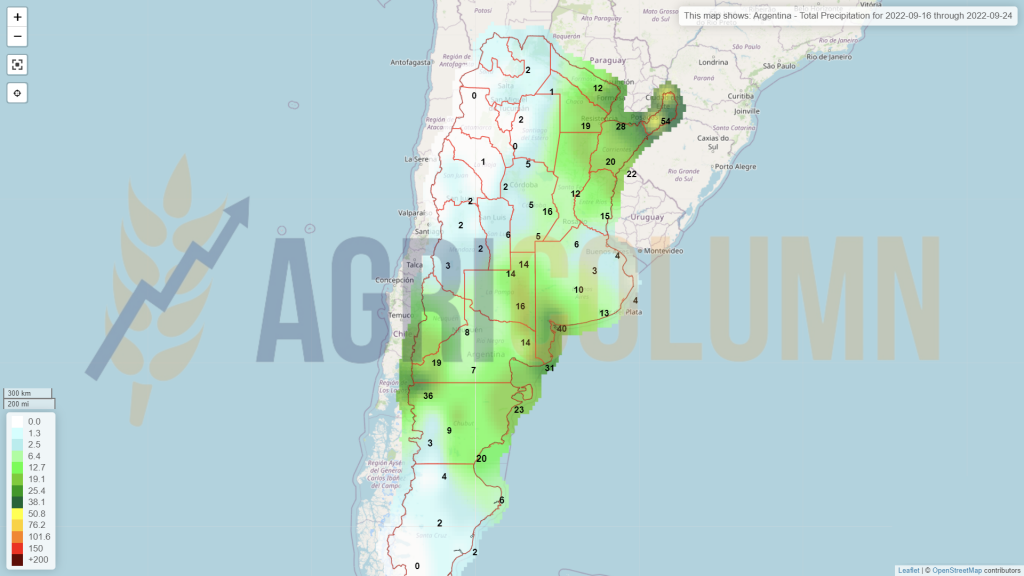
ARGENTINA is experiencing problems related to drought and cold. A significant part of the future wheat crop is under the sign of uncertainty. We note that the area sown with wheat decreased from 6.5 million tons to 6 million tons. To be kept under observation.
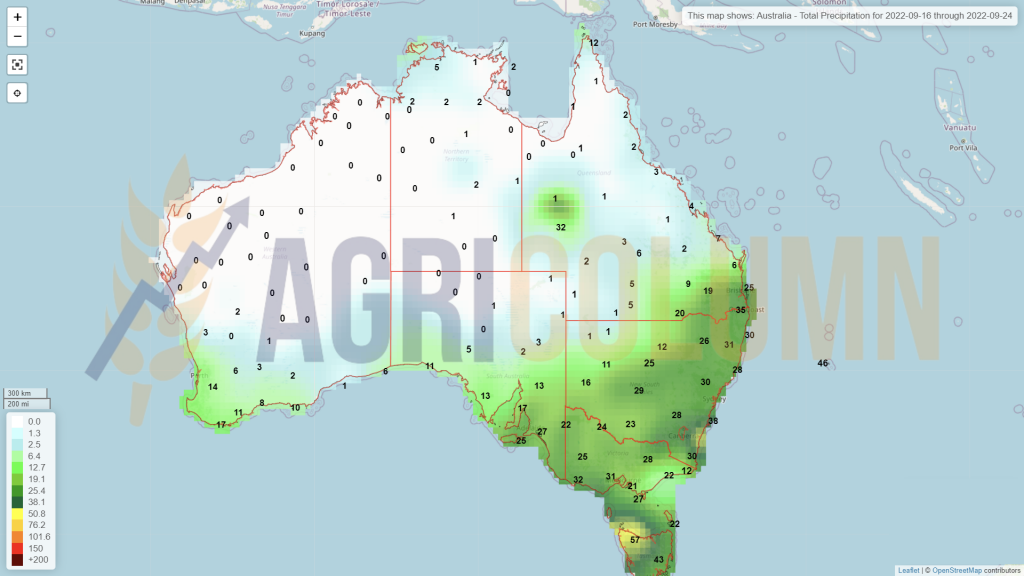
AUSTRALIA is facing a spell of heavy rain, which analysts believe will hurt quality and push Australian wheat away from traditional destinations.
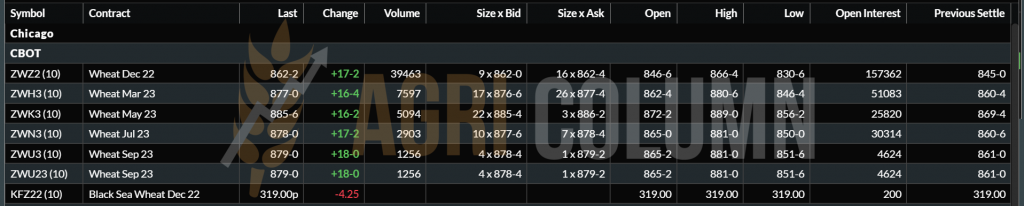
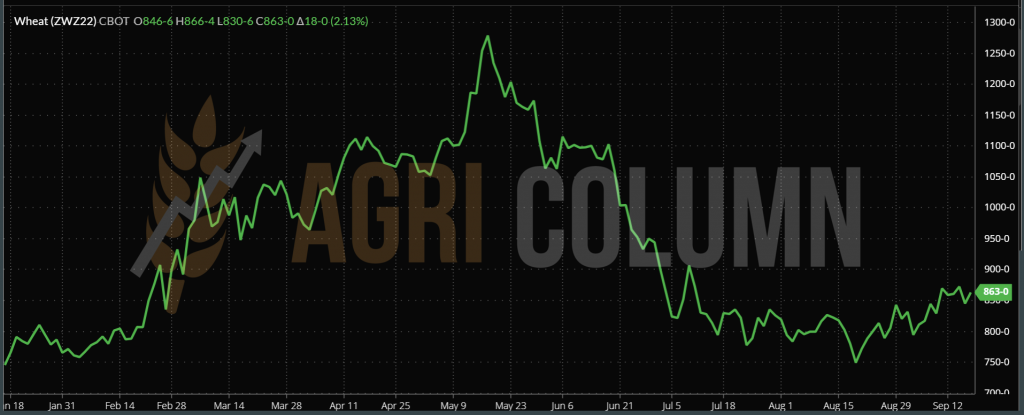
CBOT ZWZ22 DEC22 – 862 c/bu (+17 c/bu = +6.2 USD)
CBOT WHEAT TREND CHART – ZWZ22 DEC22
CAUSES AND EFFECTS
The WASDE report generated a surplus in the Black Sea basin, so we have a surplus of Russian and Ukrainian production. Subsequently, the European Union also generated a surplus of almost 1 million tons.
Right now, the picture is extremely clear for the Northern Hemisphere in terms of wheat volumes. We have a surplus of about 5 million tons, referring to the period before the WASDE report. To this we add the Canadian crop surplus of about 3 million tons and we are waiting for Australia with the 33-34 million tons forecast, representing about 3 million tons surplus compared to the initial estimates.
What factors do we have in the wheat market?
- The US and the potential strike of the 60,000 railway employees seems almost a settled matter at this point. If the strike started, about 30% of American freight would have been effectively blocked.
- RUSSIA, which despite Mr. Putin’s statements, must sell wheat in any form. There is no doubt here. It is simple and clear. I have detailed in previous issues why they are condemned to sell wheat. The fact that they have reduced the fee again to the level of 44 USD/MT severely limits their room for maneuver. But a potential downside to this tax will further depress the price of goods in the Northern Hemisphere.
- The EUROPEAN UNION, which is no longer competitive. With a price level of 335 EUR/MT FOB Constanta, 345 EUR/MT FOB Poland and 353 EUR/MT FOB Germany versus 320 USD/MT FOB Russia, it is clear that the game has been won by the Russians. And clearly, they will have to take advantage of absolutely every opportunity to sell.
- SAGO SAUDI ARABIA has announced a procurement tender for the quantity of 535,000 tons. Considering the relationship between Russia and Saudi Arabia (which are linked through OPEC+), we already see the tender as a 100% Russian affair.
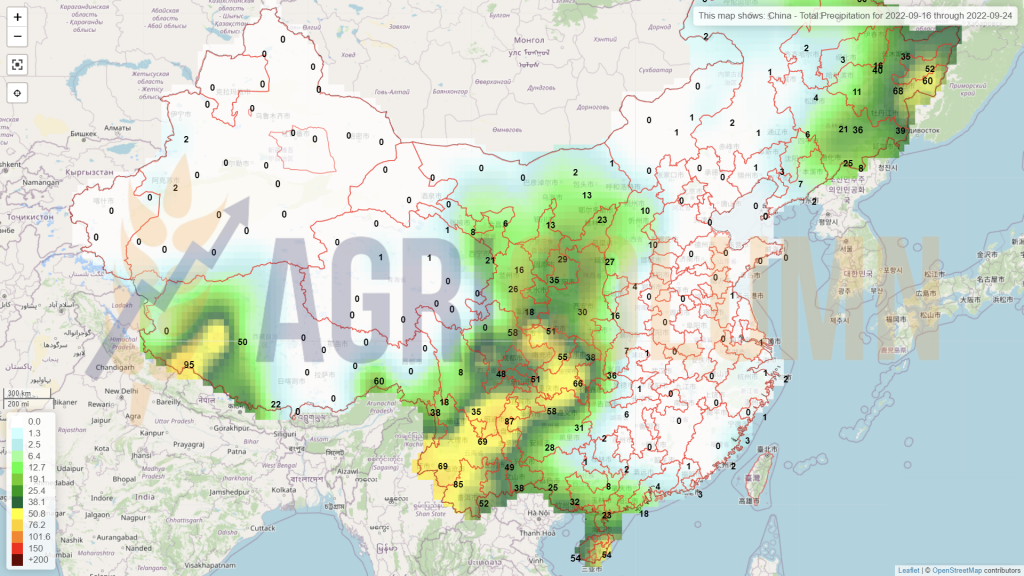
- RUSSIA – CHINA – TURKEY. The meeting of the three leaders of Uzbekistan is heralded as an agreement between the two great powers, China and Russia. But it’s not quite like that. Everyone has interests. Russia wants to sell wheat and fertilizers; China wants Ukrainian corn and wants to make sure this green corridor stays open. Turkey is the beneficiary of the cheap goods coming out through the corridor.
Thus, Mr. XI of China wants to ensure that no one disturbs the green corridor. Russia’s Mr. Putin wants to sell wheat and fertilizer, and operating ammonia -based products through the green corridor will certainly be a first. Russian companies operating in the green corridor, while behind their countrymen kill through bombings, is a picture of chilling cynicism.
Mr. Erdogan, as the keeper of the Bosphorus and Dardanelles passages, is, if you like, a kind of broker-beneficiary, who is trying to increase his role, because the elections are approaching in Turkey as well.
We are certainly seeing a decline in the price of wheat, as we have long anticipated. The firework created on CBOT and EURONEXT was just a reason for the funds to once again make significant amounts of money speculatively. Today, everything tempers and physical market decreases.
Destinations will go shopping again on the back of falling prices, and this will benefit Russian wheat. The scenario I envisioned is happening step by step. The final spice is still missing, namely the FED, which will score again towards the end of the month, when it will increase the monetary policy interest by 0.75% or 1%.
What else will change? Argentina could still unbalance the current balance or we could witness some thoughtless gesture by Mr. Putin, although we believe he is perfectly aware of his current actions.

LOCAL STATUS
The indications of the port of Constanța for feed barley are limited to the level of 270-272 EUR/MT. Farmers and some traders are still holding barley stocks, and that post-harvest growth is not coming.
And it won’t arrive either, because the global pressure unleashed by the fight against inflation creates inertia, even if global demand still exists. The price of barley will not reach the levels of 340-345 EUR/MT, under any circumstances. It is only a matter of time and habit for sellers to understand this.
Autumn barley sowing has started in Romania and the sowing will remain in the same norms, 300,000-320,000 hectares.
REGIONAL STATUS
MIT JORDAN purchased 60,000 tons of barley from Bunge for delivery in the second half of April 2023 at USD 316/MT CFR Aqaba. Today’s price is 7.5 USD/MT lower than the previous tender, which will have delivery in the second half of February 2023. Australian Grain Export, Cargill and Viterra also participated today. The equivalent in the local Romanian market is 240-243 EUR/MT CPT Constanța.

LOCAL STATUS
Corn indications in the port of Constanța are at the level of 280-285 EUR/MT in CPT parity. The activity is extremely intense for this category of goods and the exporters are looking for spaces for the reception of the goods, because that is where the Ukrainian flows, as well as the Romanian ones, line up.
In order to generate as much correct information as possible, we tell you that Ukrainian cargo is bought or offered for 200-205 USD/MT in Reni, and the cost of barges to Constanta brings another cost of 70-75 USD/MT. Thus, the price level of Ukrainian goods reaches the same level as that of Romanian origin, if we also add the profit margin.
In the local market, the demand for corn is obvious and certain processing units indicate prices similar to those of the port of Constanța. We highlight levels of 290-294 EUR/MT here.
Corn harvesting in Romania has reached the level of 18-20% and, naturally, the results are disappointing. We see the same crop level nationally, 8.2 million tons.
CAUSES AND EFFECTS
Although corn is clearly penalized by volume, the current trend is not one of price increases. The idea of retention goods is not one of the happiest. Financing costs are at a minimum of 3 EUR/MT and the future outlook as it stands today does not indicate levels to cover this cost, storage costs and a substantially higher profit.
Our recommendation is that farmers look for outlets in the domestic market. It is competitive at this time and demands this commodity. It is time to close the balance on the corn product, at least partially.
REGIONAL STATUS
RUSSIA remains at 15.5 million tons of corn production and, as we well know, does not count as a player in international trade. The retention trend at the national level is given by the increase in the export tax level.
UKRAINE receives a surplus crop of 1.5 million tons in the WASDE report, which places it with a total crop of 31.5 million tons. To this volume, we must add the remaining unexported difference from last season, of at least 4-5 million tons. This aspect positions Ukraine at a level close to a normal year with crops of 35-36 million tons.
The EUROPEAN UNION has different forecasts. WASDE only drops corn production by 1.5 million tons, while analysis houses drastically penalize the volume, dropping to 52 million tons. We are holding steady at 55 million tons at the moment. Crops have degraded, and an example of this seems to be Hungary, which could harvest only 3 million tons out of the 7 initially estimated.
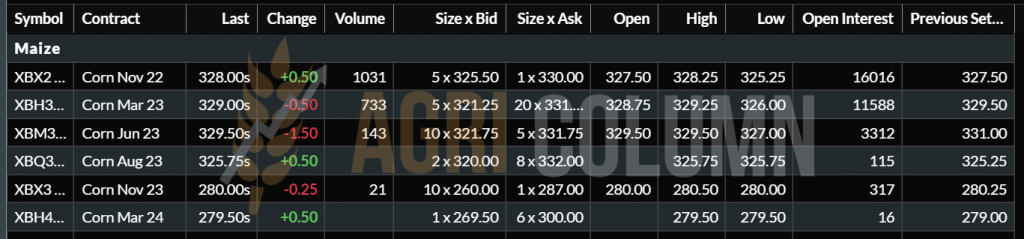
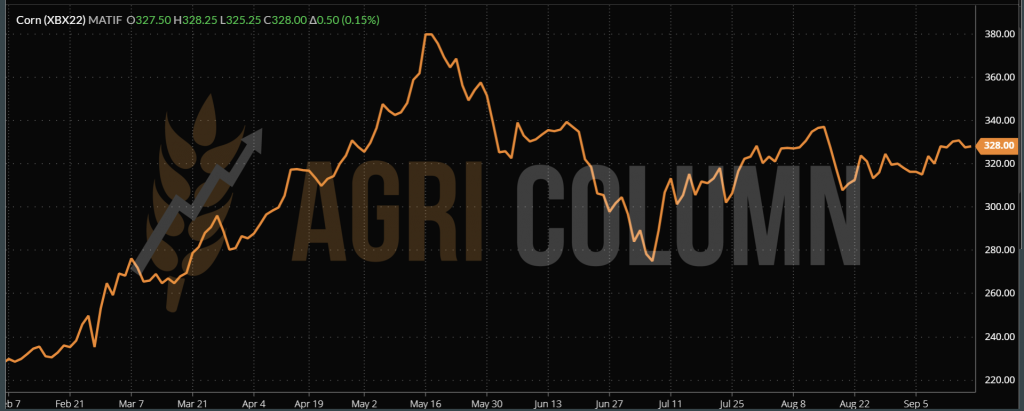
CORN EURONEXT – XBX22 NOV22 – 328 EUR (+0.5 EUR)
EURONEXT CORN TREND CHART – XBX22 NOV22
GLOBAL STATUS
US falls in the crop volume forecast after the WASDE report, which indicates a lower yield per hectare for US corn, from 175.4 bushels/acre to 172.5 bushels/acre. Translated into the European metric system, we have a yield of 10.82 tons/hectare at the moment, compared to 11 tons/hectare according to WASDE August 2022. This decrease generates a difference of 10.5 million tons of corn between the two reports: 364.7 million tons WASDE August versus 354.2 million tons WASDE September.
ARGENTINA indicates problems in the planting process, due to persistent drought. Sowing is on hold at this time, waiting for the rain forecast to come true. To watch and keep an eye on.
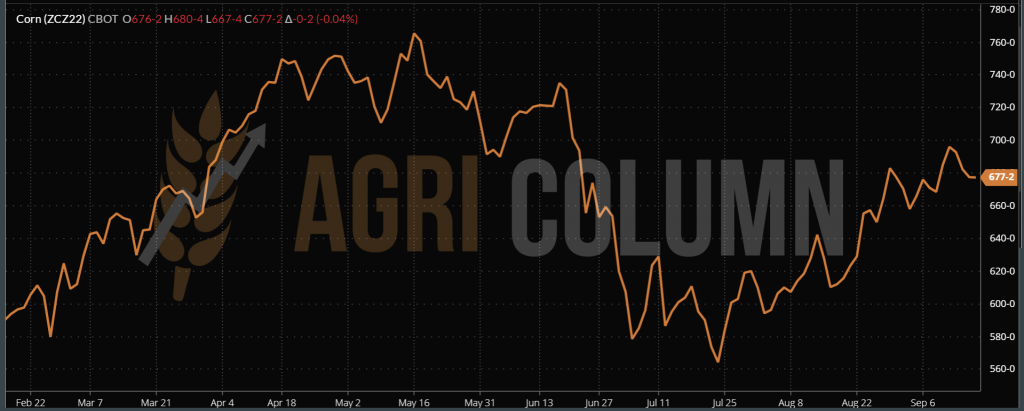
CBOT ZCZ22 DEC22 – 678 c/bu (+1 c/bu)
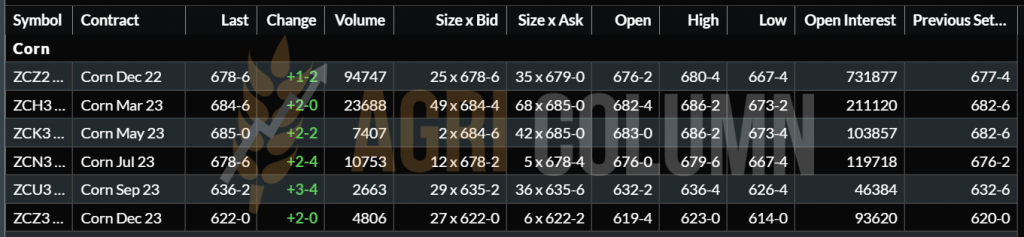
CBOT CORN TREND CHART – ZCZ22 DEC22
CAUSES AND EFFECTS
Maize was supposed to rise in price terms, according to the WASDE report, but it didn’t. The lack of 10 million tons of the North American harvest did not fuel price spikes on the stock exchanges.
In the European Union, however, the lack of volume and the effects of the severe drought associated with this summer’s excessive heat are evident. The same expectation of price increase was generated among the farmers, but it did not happen like that.
WHY? Because Ukraine, through the harvest volume and the rest left unexported from last season, acts as a compensator in the EU. The transit effort applied to Ukrainian goods is rooted in this compensation. Land and water transit movements are aimed at compensating for the disastrous EU maize crop.
China’s appearance on the scene through Mr. XI present in Uzbekistan is a very clear indication that this green corridor will not be disturbed. China has a tradition of trading corn from Ukraine, and this is reinforced by the presence of Mr. XI. In other words, China will source from Ukraine because Ukraine’s logistics and commodity pricing is highly competitive with North and South American origins.
At a price level of 250-260 USD/MT in FOB POC (Pivniy-Odessa-Chornomorsk), plus low cost logistics compared to the Americas, it is very clear and without doubt where China will source.
Thus, with these analyses, we can state that the price of corn will not increase. The green corridor and Ukrainian cargo volumes are essential factors that do not cause price increases. One problem could be a rainy harvest season in Ukraine, which would lead to the need to dry corn. And the cost of gas could be a factor that could exert price traction.
But given the demand for port operation in the three green corridor locations, we estimate that this increase will not happen. To illustrate, let’s just say that the price of corn in CPT POC parity is 190-195 USD/MT, and operating costs up to FOB parity drive corn to be offered at 250-260 USD/MT.

LOCAL STATUS
Rapeseed indications are reported, as is natural, around the Euronext NOV22 indication, with a negative premium of 20 to 30 EUR/MT of cargo in CPT Constanța parity.
In the country, we have the same level of indications for DAP Processor delivery, with the mention that the goods must be delivered after October 10-15, 2022.
Local stocks are very high. The thought that last year’s history will repeat itself has caused many farmers and traders to keep large stocks of goods. The main factor that led to the February-March 2022 rally, namely the lack of volumes, was completely ignored. Today, liquidity from European, Ukrainian, Russian, Canadian and upcoming Australian production exists and the inflationary price bubble is completely deflated.
A small boost could come from November-December this year, but nothing very spectacular.
In terms of fall seeding status, we are seeing an increase in rapeseed acreage compared to what we estimated last week. And we see that the forecasted level for now at the national level, so without 100% certainty, is 670,000 hectares of rapeseed.
The increase is due to many farmers sowing in the area left vacant by the drought. In other words, the land was freed from the remains of the devastated corn crop and replaced by the rapeseed crop, which had a very good yield, being an autumn crop and implicitly benefiting from some precipitation, as well as the lack of the killer heat of summer.
It is an example of maturity among farmers. Securing by protecting and increasing the share in autumn crops is beneficial for the future income related to the 2023-2024 season.
REGIONAL STATUS
The EUROPEAN UNION maintains the status of 9.1 million tons and we are currently in extra season.
RUSSIA maintains the identical status of 3.9 million tons and here we are in an extra campaign.
UKRAINE remains even after the end of the harvest at the level of 2.8 million tons of production volume.
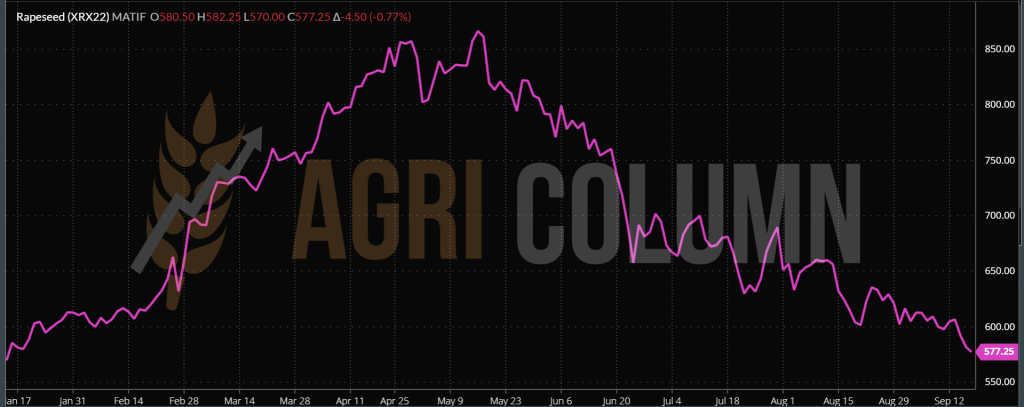
EURONEXT XRX22 NOV22 –577.25 EUR (-4.5 EUR)
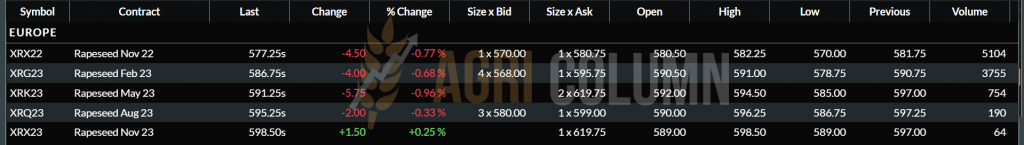
EURONEXT RAPESEED TREND CHART – XRX22 NOV22
GLOBAL STATUS
CANADA is harvesting canola in full swing and we see sources on the ground indicating production is down 0.4m tons from the initial estimate of 19.5m tons. So they will harvest about 19.1 million tons of canola. Demand is boosted, as I wrote many months ago, by biodiesel production units in California, which aim to process and blend 18 million tons of rapeseed or soybean oil by 2025, starting from a level of 1.8 million tons a season ago.
AUSTRALIA still has about a month to wait until the harvest, but there are no indications at this time that it would lead to a degradation of the harvest volume. The forecast remains stable at 6.7 million tons, from an area of 3.6 million hectares.
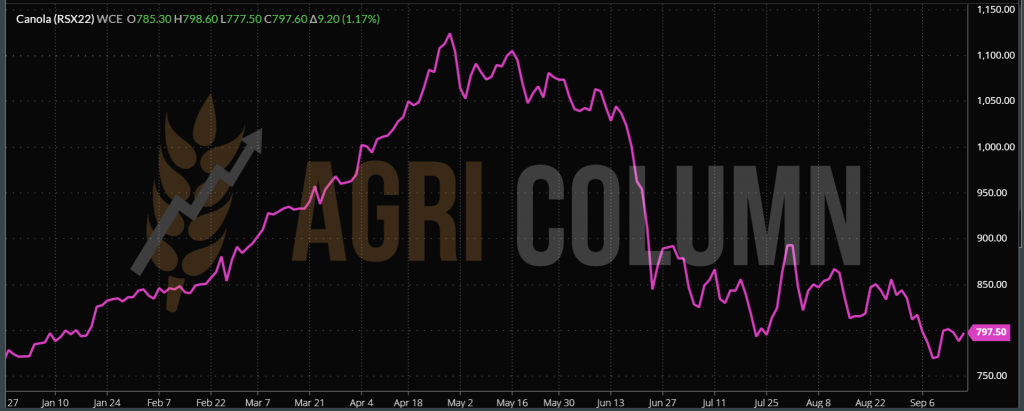
ICE CANOLA RSX22 NOV22 – 797.4 CAD (+9 CAD)
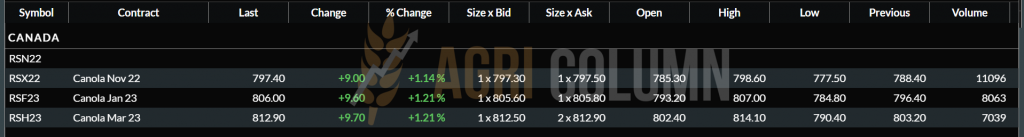
CANOLA TREND CHART – RSX22 NOV22
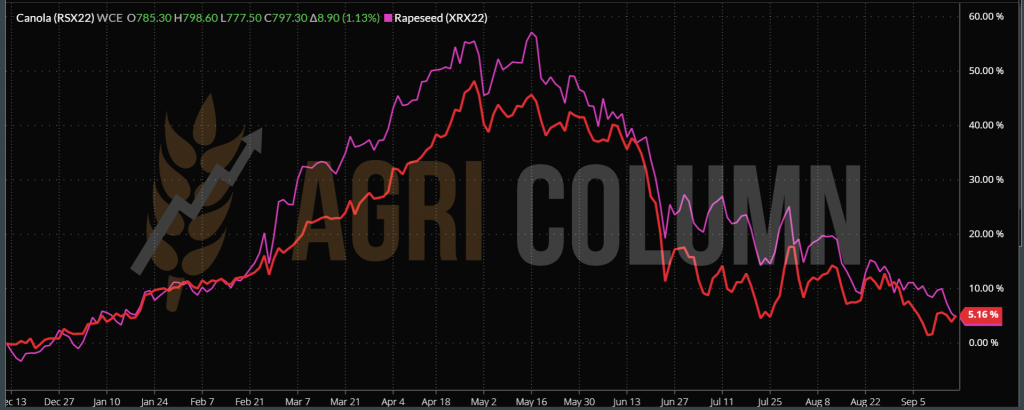
COMPARATIVE GRAPH. EURONEXT XRX22 NOV22 VS. ICE CANOLA RSX22 NOV22
CAUSES AND EFFECTS
Rapeseed has multiple roots and we list the sectors that can influence the price level.
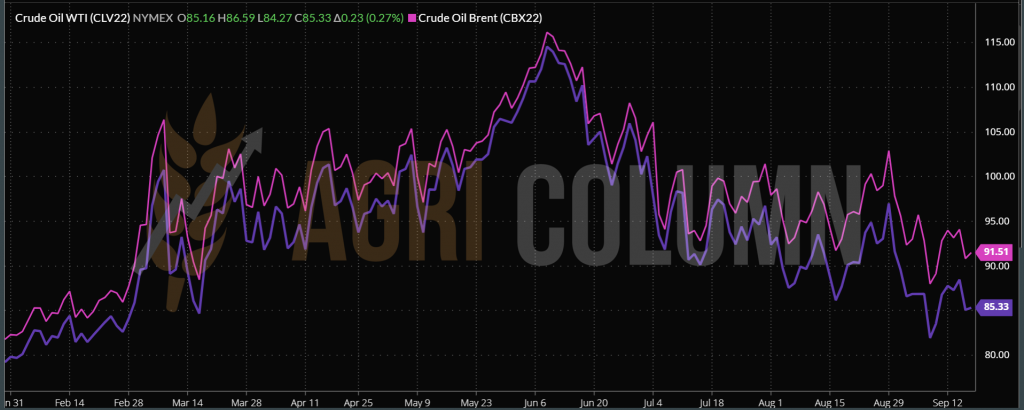
Traditionally, the industrial sector is the main one, i.e. biodiesel production. It correlates with the oil price level, which today is falling to near the 90 USD/barrel BRENT NOV22 level. WTI indicates a level of 85 USD/barrel and thus, the main cause of the decline in the last days of rapeseed trading remains the level of oil.
The relationship of substitution or replacement with soybean oil is also a determining factor in the price decrease. Soybean oil is basically replacing canola oil in the biofuel recipe, and from June to today we have an 18% drop in CBOT indications. It is the second factor that determines the decrease in the price of rapeseed.
The processing of rapeseed in the VEGOIL complex, so for human consumption, is another factor that influences the price. At the moment, the complex is penalized in price due to the excessive availability of palm oil, which acts according to the principle of communicating vessels and on fellow VEGOIL complex.
Correlating the above, it is no surprise that rapeseed is declining dramatically. The aggregated negative correlation of those exposed above led to the level posted by Euronext for the month of NOV22. But regarding the following indications, FEB23 and MAY23, in the perspective of the new crop through AUG23, no positive price trend is seen.
The trend of increasing the area generated in Romania will have successors in the European Union, combining the same elements: areas left free after the effect of the drought on corn, the fear of drought and excessive heat for the following summer and the capture of precipitation during the fall, winter and next spring for autumn crops.
Moreover, European and American model forecasts indicate a warm winter in Europe with positive temperatures. Thus, snow will again be a rarity on the continent, but we hope it will be replaced by rains, because we need water for the autumn crops.

LOCAL STATUS
Indications for the purchase of sunflower seeds have stabilized around the values of 540-545 USD/MT in the CPT Constanța parity. Some buyers are also quoting 535 USD/MT, but if the seller is firm, surely the latter can get the high level mentioned at the beginning.
In the local market, the status is the same as last week, with a lot of goods of Ukrainian origin, which enter and are sold on the territory of Romania. This aspect is not good for the price of Romanian goods, for sure. But this has been obvious for a very long time. We anticipated and wrote about cargo flows from Ukraine as early as March 2022.
Processors line up on a wide band of prices offered for goods, these being dictated by logistical factors. Thus, for delivery to processing facilities, we have an average level of 535-545 USD/MT, while delivery to proximity silos results in the price discount being given against the cost of transport between the storage location and the processing facility, at to which are added the costs of storage and preservation of the identity of the product, which in some cases can total as much as 30 USD/MT.
CAUSES AND EFFECTS
Sunflower seeds have a resistance threshold we estimate at the level of 500 USD/MT. After the harvest pressure will pass, we will see a return of raw material prices, but not spectacularly. There is absolutely no additional reason today to speculate about skyrocketing price increases.
REGIONAL STATUS
UKRAINE estimates raw material exports around 1.4-1.6 million tons, in line with our previous estimates. The flow will feed processing units in Romania and Bulgaria to produce much-needed crude oil for Europe, which is experiencing significant production losses due to drought.
RUSSIA indicates the same crop figures and we reiterate that both their processing capacity and port operation capacity will be a major handicap in their attempt to export the crude oil resulting from the processing. Neither the processing facilities nor the logistics nor the port facilities will allow this huge effort. Not to forget, winter is coming and the weather in that region is particularly harsh, and this aspect will hamper the already undersized port operation.
KAZAKHSTAN nearly doubles sunflower seed production. They too were attracted by the mirage of the void left by Ukraine in the market and certain foreign companies entered the country financing and buying forward very large quantities of goods. In percentage terms, the increase in production appears to be high, 41% compared to last year, but if we refer to tonnage, things have a different weight. Kazakhstan will produce 270,000 tons of sunflower seeds this season, compared to 191,000 tons last season. They are not large amounts, but they indicate the general trend of overproduction of regional raw material.
The EUROPEAN UNION remains at the same level of 9-9.2 million tons, Romania being the most penalized in terms of the decrease in production volume.
CAUSES AND EFFECTS
Argentina cannot yet be factored into global Supply & Demand due to the long lead time until harvest. Argentina has normally entered the seed planting period. Their ambitions, also influenced by the mirage of lack of availability generated by the absence of Ukraine, are 2 million hectares, with a harvest forecast of 4.2 million tons, compared to last year, when from an area of 1.6 million tons generated 3.35 million tons of production.
But this season, Argentina is also going through an extreme drought, and Argentine wheat is the first to be penalized. Today it is not very clear to see the 2 million hectares that want to be planted because of the extreme cold and the acute lack of precipitation that has lasted for a very long time. Normally, the Buenos Aires region accounts for 53% of the sunflower seed harvest. The other two participants in the seed volume are Chaco with 17% and Santa Fe with 13%.
Turkey is playing according to its own interest and it is normal to be like that. From September 15, 2022, they legislated an import tax on crude sunflower oil of 10%. In this way, Turkey indicates that it is much more cost effective (which is correct) to process the seeds instead of importing the crude oil. Processing results in a much higher added value than refining and bottling. Thus, Turkey sees a normalization of crude oil trade from Ukraine and, implicitly, from Russia, clearly indicating that it is waiting for the raw material to the detriment of crude oil.
Palm oil is finding support around MYR 3,600/t, but stocks are still very high in Indonesia and the price index for setting the export duty has dropped, clearly suggesting the need to export and by implication price degradation. Palm oil takes the lead in terms of demand in Asia and is preferred over soybean oil in terms of price.
All the above causes lead us to the following short-term effects:
- The tariff barrier imposed by Turkey stabilizes the price of sunflower seeds.
- The same tariff barrier prevents crude oil sellers from Ukraine and Russia from lowering their price levels, even matching them with the effects of the Turkish import tax.
- The indication is extremely clear. After February 5-10, 2022, we will begin to see an increase in commodity trade from Russia due to processing-operational incapacity.
- The platform we are on today is extremely fragile. If things deteriorate in Argentina, we will clearly see a positive change in sunflower seed quotes, but this increase will be partially offset by trade in Ukraine.
- If the green corridor will continue to work (and we believe it will), then the Ukrainian crude oil trade will increase in weight and will not support price increases in the commodity trade, which commodity today has a tax level of 8% for export.
- If the corridor is disrupted, we will see an increase in the level of Ukrainian raw material trade from today’s estimates of 1.4-1.6 million tons to around 2.6 million tons.
But even then, today’s price values will hold for a while. The support given by the Turkish tax, as well as the passing of the harvest pressure, are arguments for stabilization for the coming period.

LOCAL STATUS
Local soybean processing industry guidance is at 570-580 USD/MT on a processing unit DAP basis. If the commodity is sold to local processing units, the amount of coupled support is added to this level.
GLOBAL STATUS
The US rated 56% of the soybean crop as good to excellent, down one percentage point from last week.
25.3 million tons of US soybeans for 2022/23 exports were recorded as of September 8 – about 45% of USDA’s current forecast for the full year. That’s above-average progress and better than last year, but could stagnate in the absence of solid sales in the next few weeks.
WASDE reports soybean production down 3 million tons, from 392.79 million tons in August to 389.77 million tons in September. The decline comes from the degradation of US per hectare productivity, which falls from 51.9 bu/acre to 59.5 bu/acre.
This generated an increase in the price of soybeans in CBOT quotations. Chicago Board of Trade soybean futures rose to two-and-a-half-month highs on Monday after the USDA cut domestic crop estimates more than expected. Later, by the end of the week, the CBOT NOV22 soybean indication fell amid profit-taking by hedge funds.
ARGENTINA. The soybean export incentive program worked, bringing soybeans to market. A total of 5.7 million tons of Argentine soybeans have been sold since the beginning of the implementation of the “soy dollar” program on September 5, according to data from the Rosario Grain Exchange (BCR). Total 2021/2022 sales reached 57%, up from 64% a year earlier.
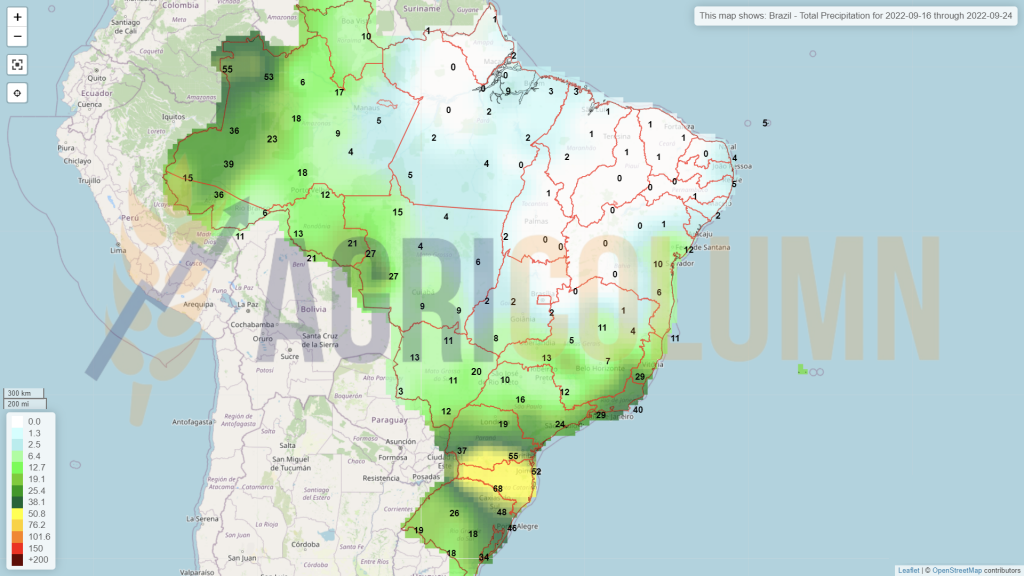
BRAZIL. Abiove, a trade group representing Brazil’s oilseed processors, on Wednesday revised its forecast for 2022 soybean production to 126.9 million tons, up 0.2 percent from August. For processing, it raised its estimates by 300 tons to 48.9 million tons. Exports were revised up slightly to 77 million tons from 76.8 million tons.
CHINA. The pace of acquisition was too slow before, but now it is starting to accelerate. China has purchased Argentine soybeans, about 40 carloads, for delivery in September/October, thus reducing the need for soybeans of US origin. Cargoes sold in China generate greater liquidity in Argentina and improved processing margins in China. Next, China is looking for another 10 soybean cargoes of Argentine origin.
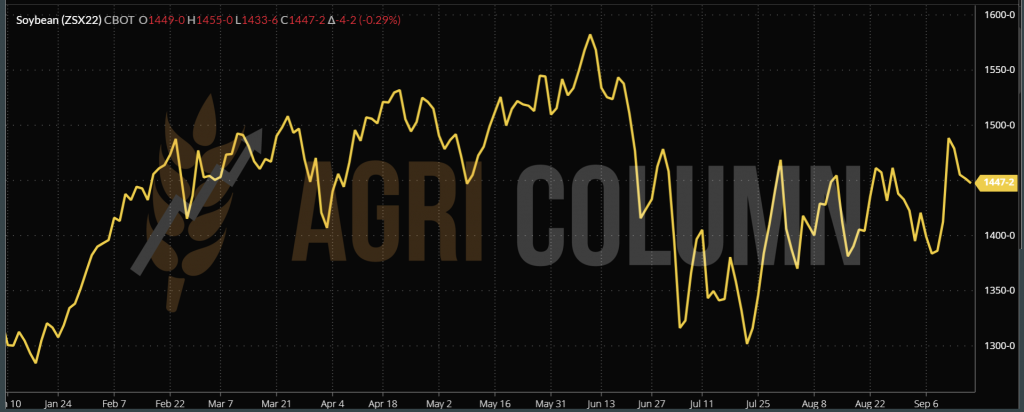
CBOT SOYBEAN – ZSX22 NOV22 – 1,446 c/bu (-5 c/bu)
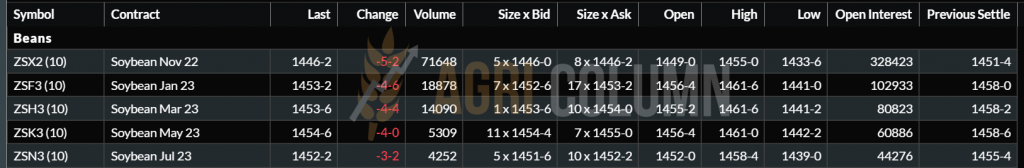
CBOT SOYBEAN TREND CHART – ZSX22 NOV22


WTI 85.33 USD/barrel | BRENT 91.51 USD/barrel

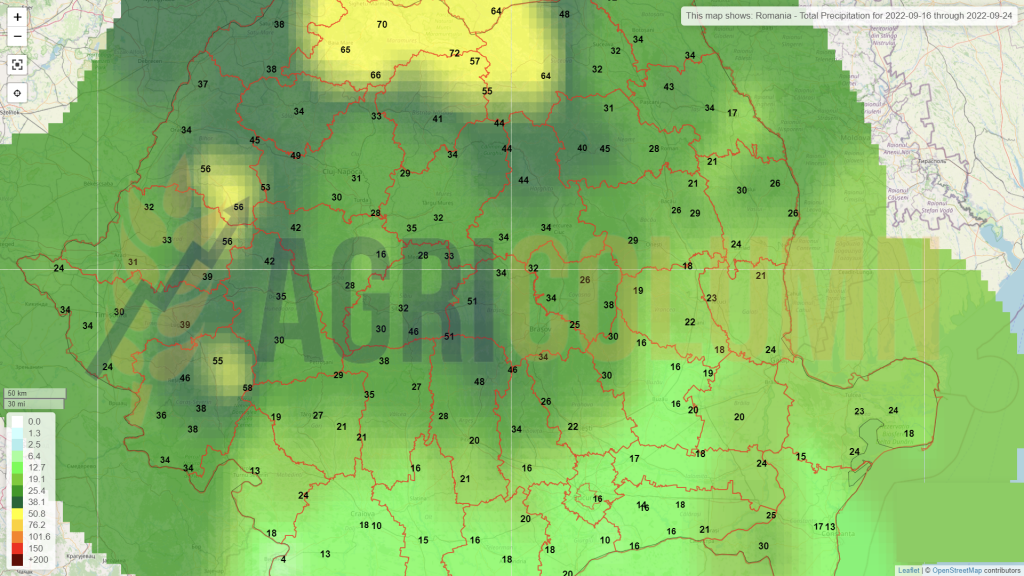
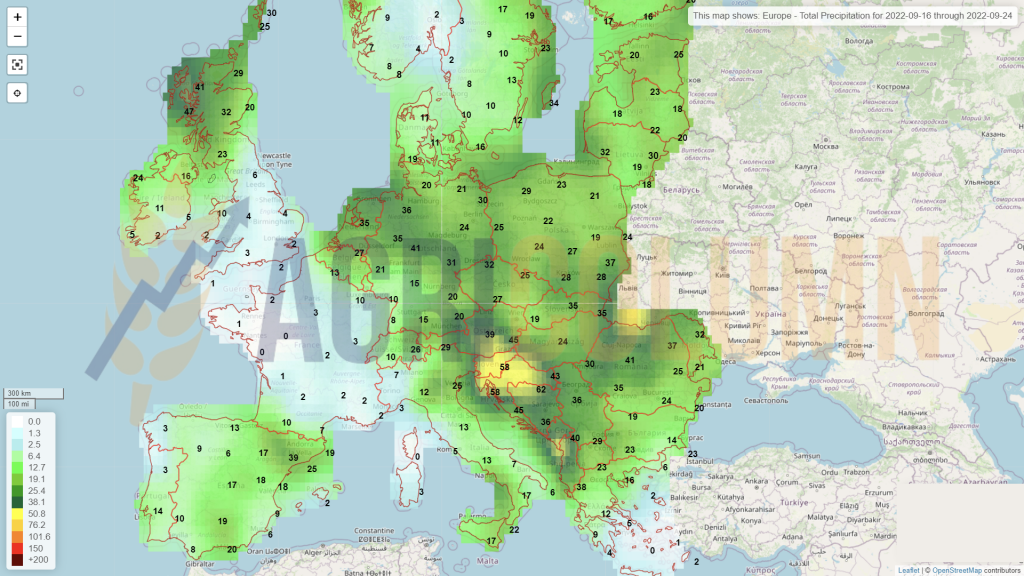
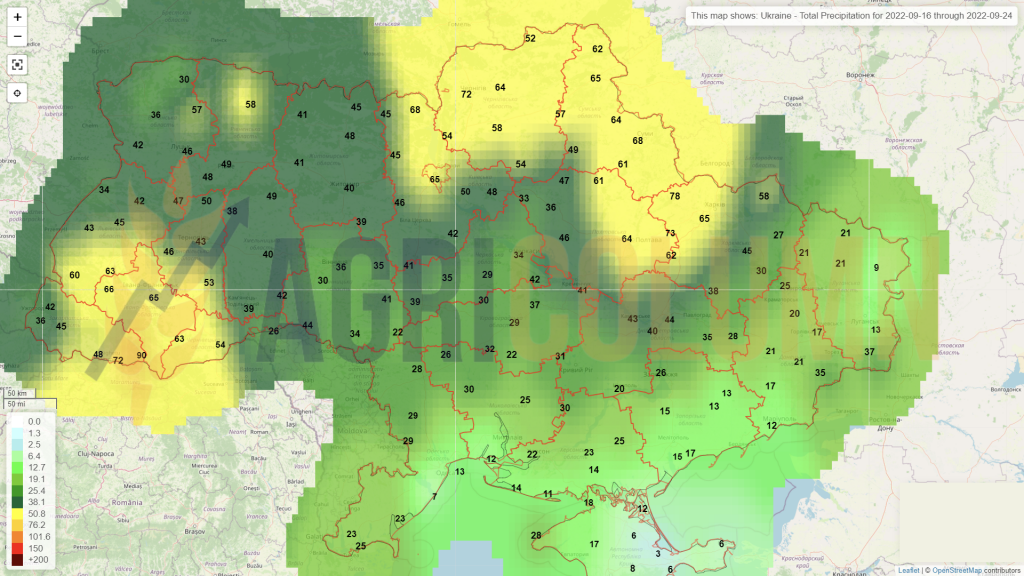
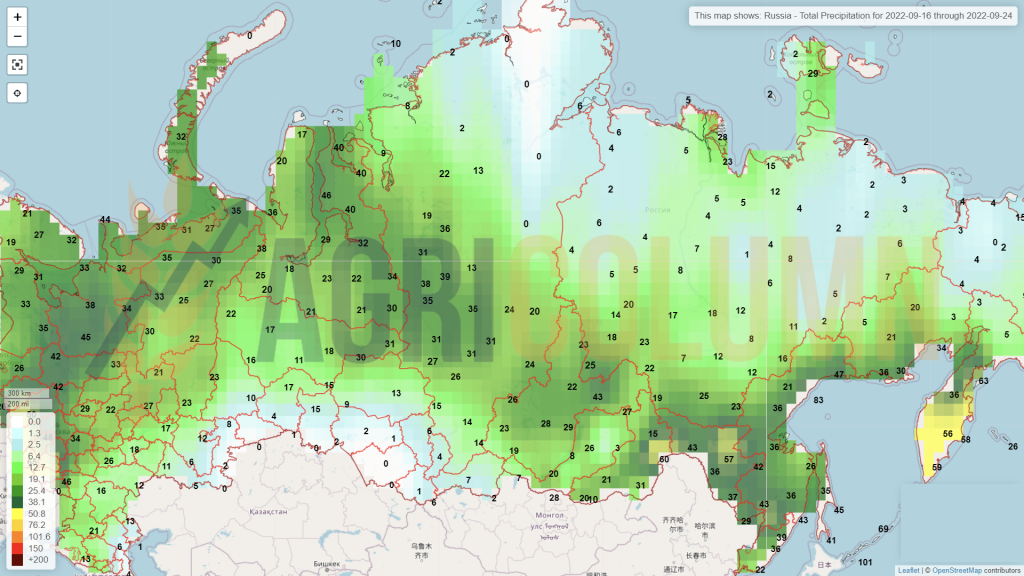
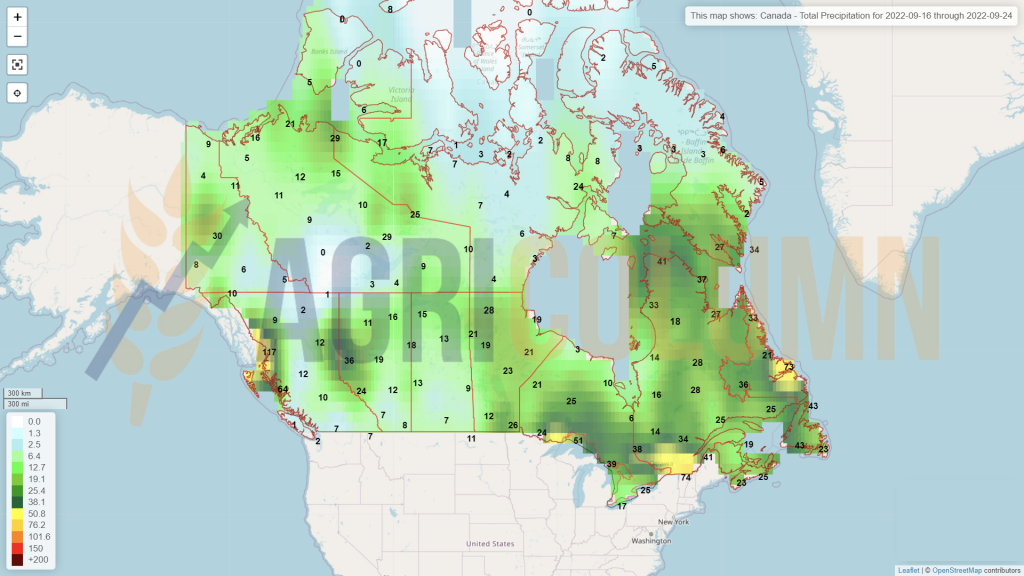
16-24 September 2022
Romania
Europe
Ukraine
Russia
Canada
USA
Brazil
Argentina
China
Australia