This week’s market report provides information on:

LOCAL STATUS
The price indications for the port of Constanța are around 350 EUR/MT for milling wheat. Feed wheat is still broken down negatively by 25 EUR/MT.
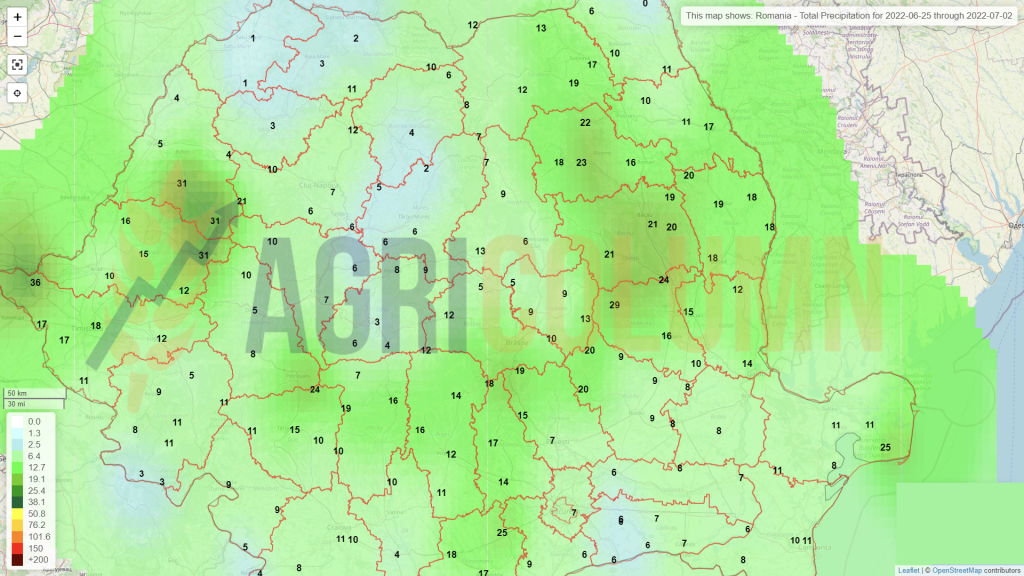
Harvesting has started in Romania and the first batches indicate two distinct things. On the one hand, there are problems in some areas of the country related to the Test Weight, but granted with a very good level of protein. On the other hand, we have an element that reduces the level of harvested volume. Indeed, in areas with extreme pedological drought a norm of 3-3.5 tons/hectare is the reality. And this penalizes the volume of harvest in the areas affected for a long time: Vrancea, Vaslui, Bacău, Galați, as well as a part of the Southern Plain (Bărăgan) and the Dobrogea area.
In the other areas of Romania, however, wheat looks good in forecasts and will partially balance the losses in the indicated areas. At the southwest level, which includes the Teleorman, Olt, as well as the Timiș-Arad area, the wheat is robust in terms of volume. In fact, in the North-West there are the same premises. The center of the country indicates the same robust status.
CAUSES AND EFFECTS
What was supposed to happen happened, namely, the harvest pressure generated by the arrival of the harvest moment. Apart from the fact that the trade in goods in the Black Sea basin is low due to the war and the delayed demand, logistics is the one that greatly lowers the price.
We will see an increased pressure on the price of wheat, the port of Constanța being already blocked by Ukrainian goods. And we come back to this subject, because it is an extremely important one. The local logistics means are engaged in the Ukrainian flow of goods. Wagons, barges, trucks are engaged in the transport of goods.
We need to make a very clear difference in this context. It is not the Ukrainian farmers who are engaged in this logistical process, but the companies that carry out trade. They sell at a big discount in order to extract the profit from the goods and to be able to continue the production cycle.
So there is a very big difference in nuance that we want to emphasize clearly and firmly. Ukrainian farmers do what any farmer in this world would do, produce and sell. However, the supply chain is in the execution of traders, so farmers cannot control this process. There are two totally separate things.
Our opinion on what will happen next is that the real logistical nightmare has not yet begun. July 2022 will be the hardest. Ukraine will start harvesting and so will Russia. Then the climax of the pressure and the logistical nightmare will be reached, which will be poured on the Romanian farmers and goods.
In addition, unsold cargo flows due to Serbia’s export restriction, over 2 million tons of wheat and corn, will seek their way to Constanța on the Danube.
In all the conditions given above, we have supported and outlined measures to segregate cargo flows. so that each of them has its own route and prioritization. But in all this context, the news came about the resignation of the Minister of Agriculture. We do not comment on the reasons, we do not position ourselves, but this negatively impacts the Romanian agribusiness.
Extraordinarily bad news, which fell exactly when it shouldn’t, just when we needed a strong hand, which had to manage all the above aspects, as well as provide support to Romanian farmers. And this is happening now, at harvest, near July, when the port of Constanța is already blocked.
REGIONAL STATUS
BULGARIA: We expect the wheat harvest to be close to last year. Whether it will be 6.5 million tons or 6.7 million tons will depend on the state of sowing in different parts of the country, “said Petar Kirovski, from the Bulgarian Agricultural Ministry, in telephone interview for Reuters.
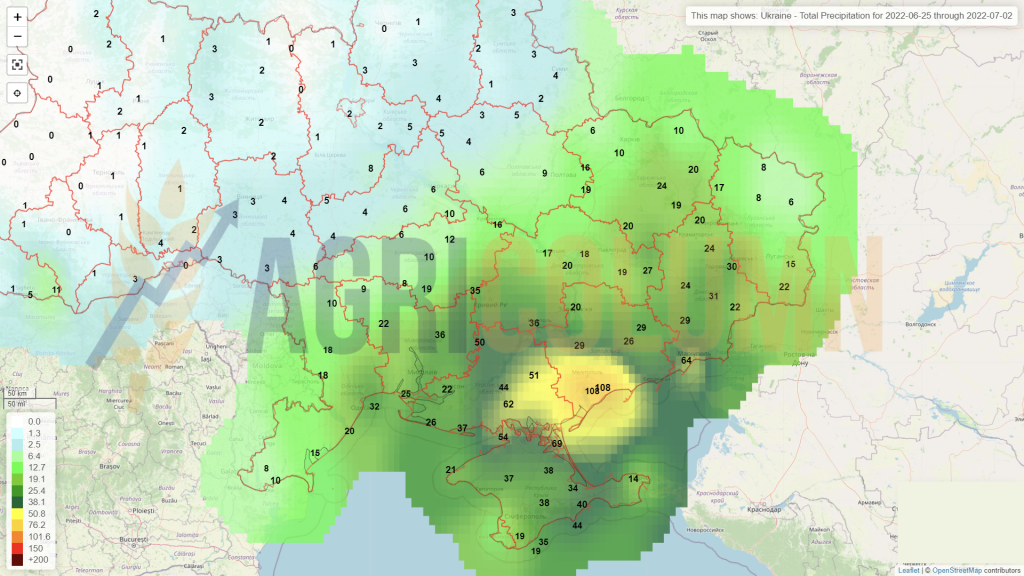
UKRAINE indicates an increase in wheat export forecast of at least 2.2 million tons, bringing it to 12.5 million tons.
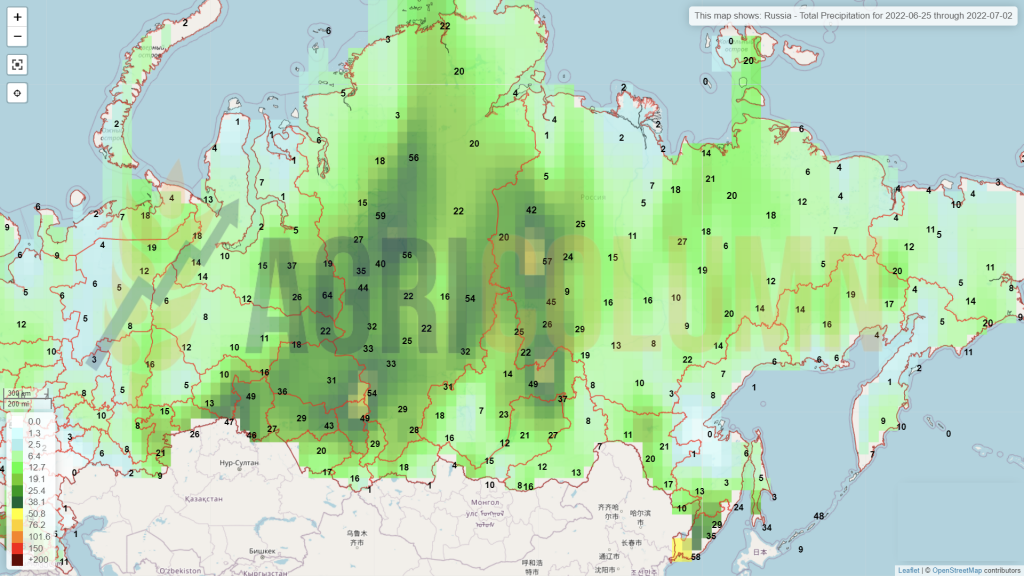
RUSSIA indicates an increase in the export volume of wheat from 42 million tons to a level of 50 million tons. Let’s not ignore the fact that they have not exported at least 4 million tons since last season, which must be added to this year’s level. And, of course, the source of the 8-10 million tons that will be shipped additionally is Ukraine, which we all know. At the same time, a change in the charging system is announced. At the time of writing, Russia has started harvesting in the South and all indications are already leading to a very good level of production per hectare.
Russia is moving ahead of the US and the EU again. Dubai becomes the new Switzerland for Russian merchants. Russian companies leave Geneva for the business capital of the United Arab Emirates.
Dubai’s many free trade zones, proximity to Middle Eastern energy producers and low taxation have already proved attractive, even though the city still has to gain territory in front of global centers such as Singapore, London, Geneva and Stamford. Last year, Dubai Multi The Commodities Center, together with the Moscow Chamber of Commerce, hosted an event designed to attract Russian companies to set up companies in the city.
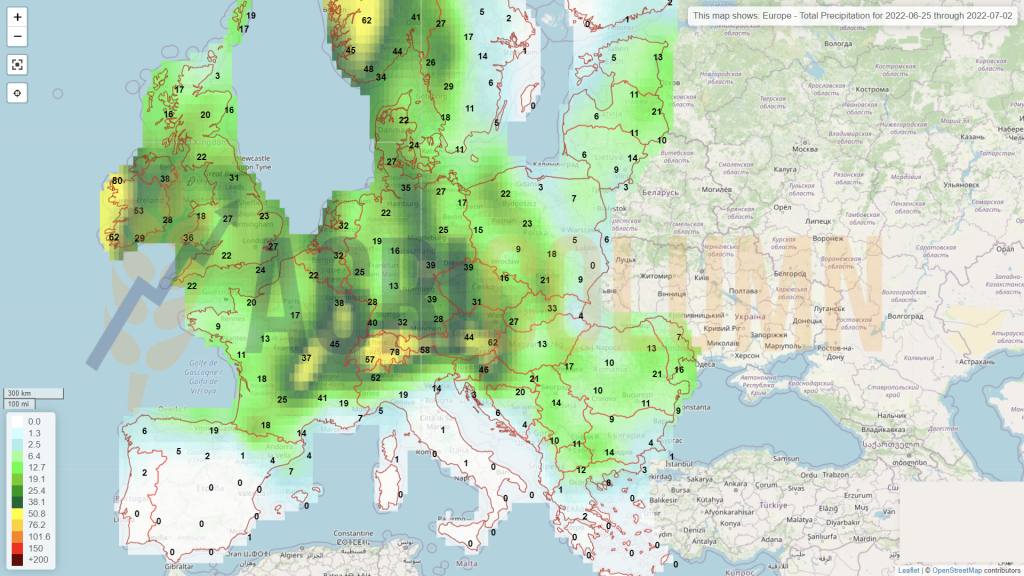
In the EUROPEAN UNION, the harvest has begun, with all the problems created by the prolonged drought. The harvesting conditions in Spain and France are lower than the forecasts, but the defining word is for the time being, slightly lower, taking into account that France has harvested only 3-4%. Over the weekend, however, harvesting was halted in France amid rains and storms.
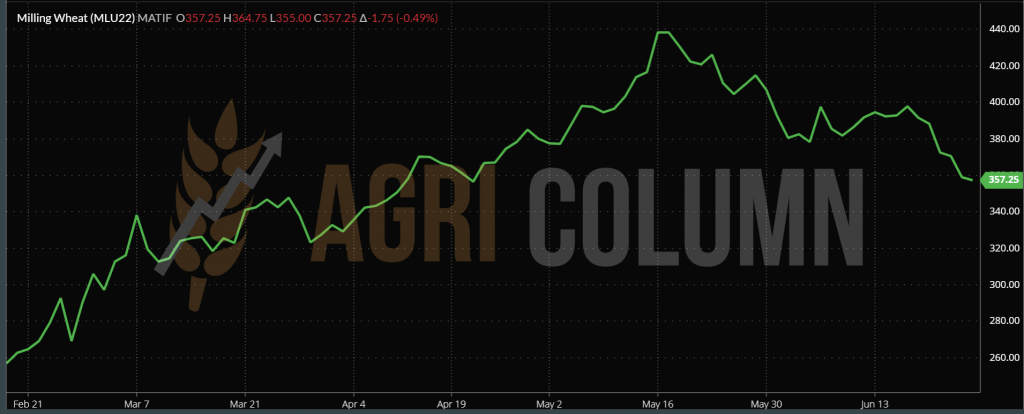
EURONEXT MLU22 SEP22 at the close of June 24, 2022 – 357.25 EUR (-1.75 EUR)
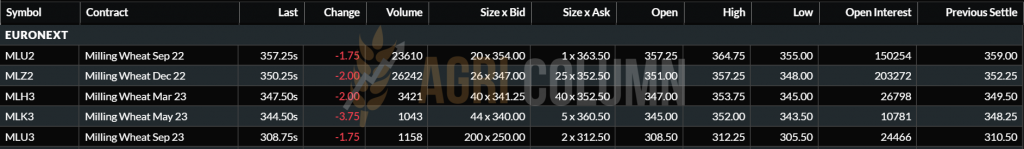
WHEAT – EURONEXT TREND GRAPHIC – MLU22 SEP22
GLOBAL STATUS
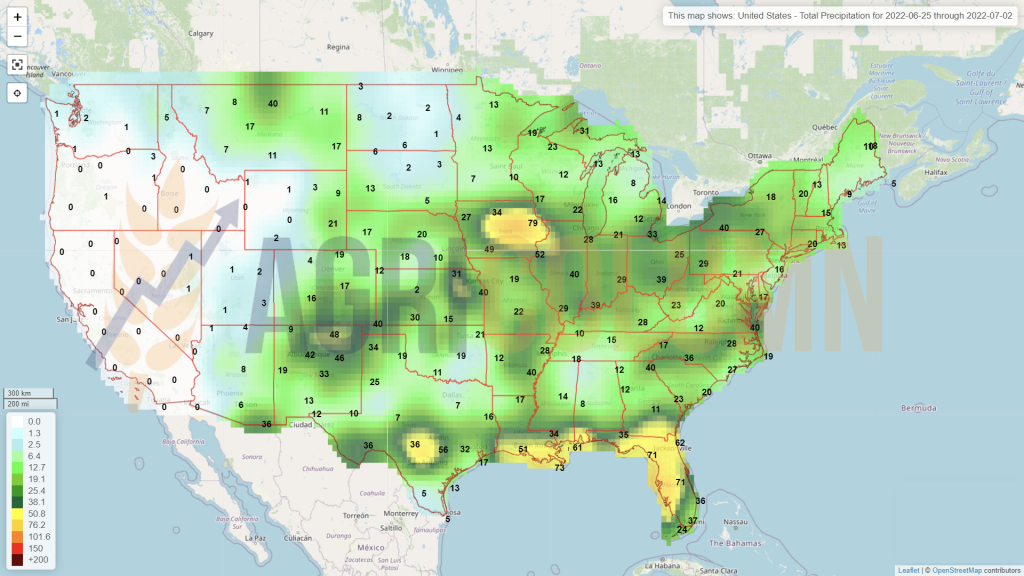
The USA harvested about 26-27% of winter wheat, and the percentage of good to very good rose 1%, from 30 to 31%.
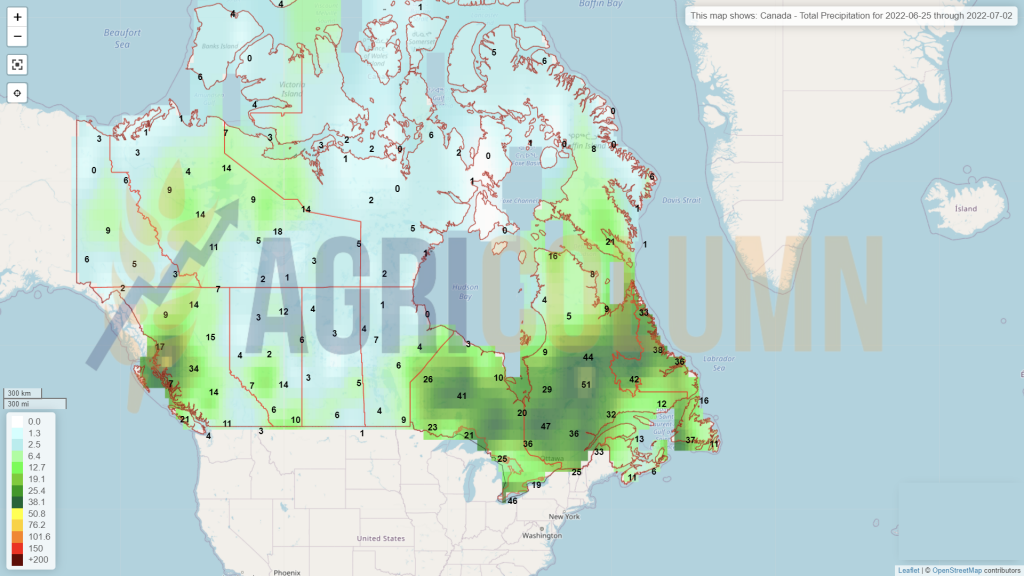
CANADA is in the same status as a very good harvest forecast. About 32 million tons are expected.
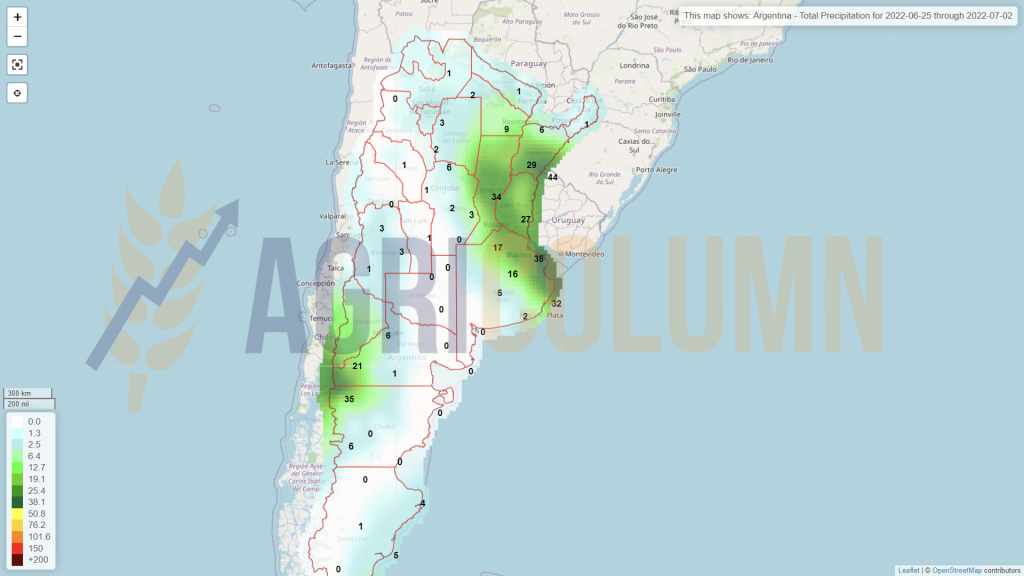
ARGENTINA remains unchanged. The drought creates serious difficulties for farmers in the sowing process and the forecast remains at 18.5 million tons, with a declining export level for the current season, of only 10 million tons instead of 15 million tons, but protectionism will make room, for sure.
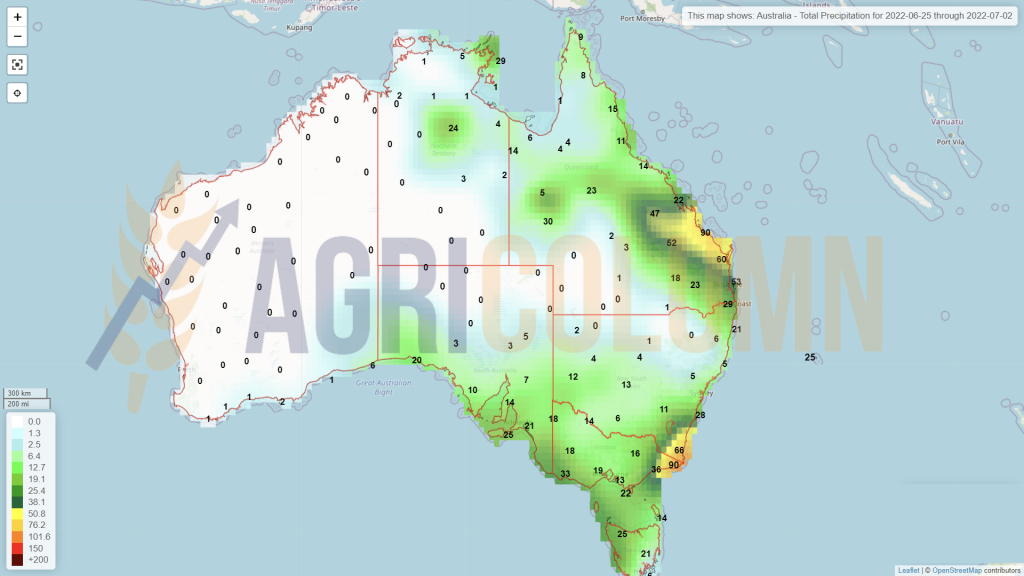
AUSTRALIA is also unchanged, with a level of 32 million tons of production, compared to 30, initial estimate.
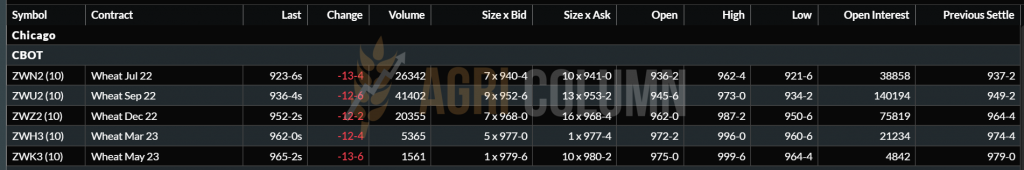
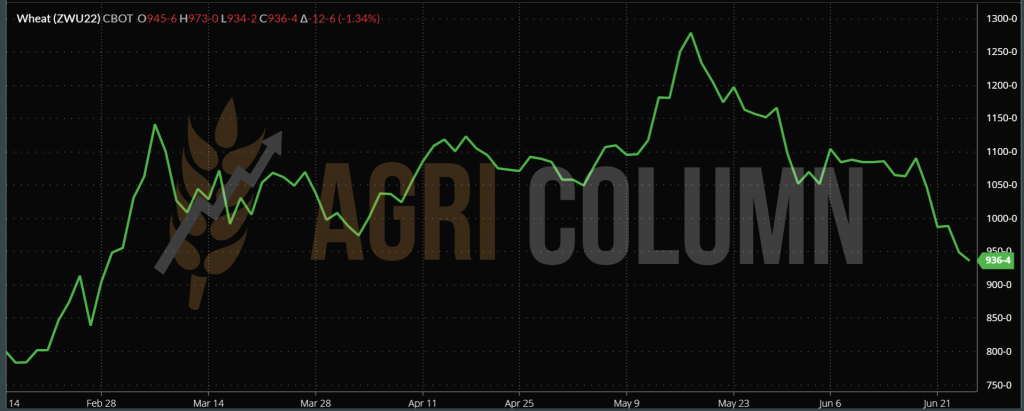
CBOT ZWU22 SEP22 – 934 c/bu (-12 c/bu = -4,4 USD)
CBOT WHEAT TREND GRAPHIC – ZWU22 SEP22
TENDERS AND PRICES
ODC TUNISIA has purchased 100,000 tons of wheat.
- 3 x 25,000 tons from Casillo at 439.68 USD/MT
- 25,000 tons from Finagrit at 438.5 USD/MT
- Origin: Black Sea or France
- The price was lower by 13.78 USD/MT compared to the previous tender.
TCP PAKISTAN has launched a tender for the purchase of 500,000 tons of milling wheat, shipped between August and September 2022. The deadline for submission of tenders is 1 July 2022.
EGYPT‘s supply minister said on June 21 that Egypt must import 5 million tons of wheat for fiscal year 2022-2023, according to Reuters. In parallel, they have so far purchased 4 million tons from the local market. Normally, GASC is responsible for the acquisition of 5.5-5.7 million tons per year. Another 6 million tons come from private imports.
SAGO from SAUDI ARABIA supplies 540,000 tons of wheat from SALIC. SAGO has selected SALIC to supply 300,000 tons of wheat, the volume being divided into 5 shipments that will arrive in Saudi ports between November 2022 and January 2023. This is the second part of a purchase of wheat from SALIC, according to the announcement. The first part of the tender was announced at the beginning of the month, where 240,000 tons of wheat were reserved, also from SALIC, for transport from August to October. A third final part of the tender was also announced, which would be completed by the end of July. The total volume that SAGO expects to buy from SALIC is approximately 700,000 tons. This comes in the context in which Saudi Arabia has cultivated foreign investment in the agricultural sector and while the state importer SAGO continues to obtain volumes of wheat from foreign companies.
BANGLADESH is trying to secure its supply of wheat from Russia under a government-to-government agreement after India, its largest supplier, banned grain exports last month to limit local prices, government and trade officials told Reuters on Wednesday.
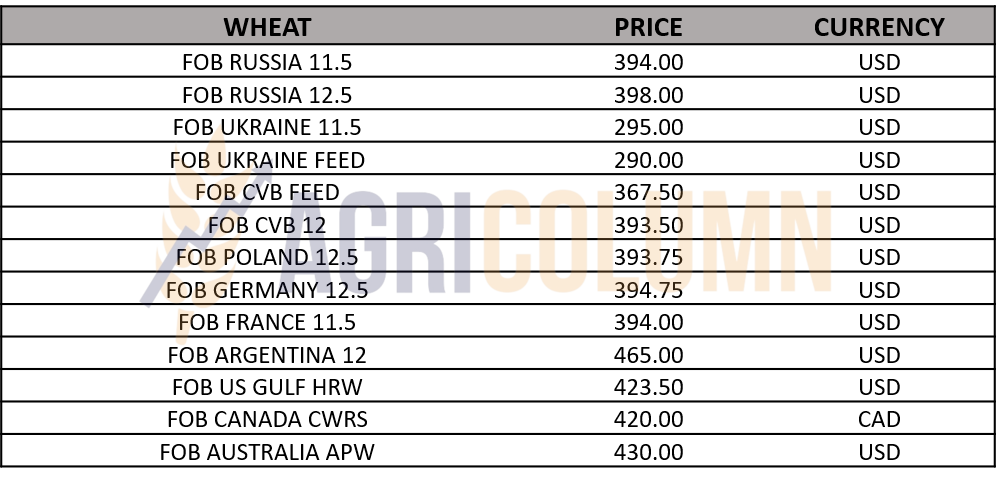
WHEAT PRICE INDICATIONS IN MAIN ORIGINS
CAUSES AND EFFECTS
All we saw the other day, an effective roller coaster, was nothing but the combined effect of a few factors that we list in turn:
- The FED generated a 0.75% interest rate hike and, after three days, everyone breathed a sigh of relief. Nothing anticipated the storm that followed, with decreases for 4 consecutive days. The funds went out of position en masse, liquidating, because Jerome Powell said clearly and bluntly that he wants a soft landing and will not force the funds to liquidate instantly, but only upon expiration, which is what happens. July 2022 is a landmark for CBOT.
- The Russian crop forecast, which, even if not guaranteed by the USDA, enters the traders’ table.
- Rumor has it that Russia will change the floating tax, today worth 146.1 USD/MT. Lowering the tax level would boost sales, in view of the fact that the difference will go back to farmers and thus they will sell to the export market. Moreover, we understand that they would like the change from USD to RUB, and the first signs of barter, vegetables against wheat, come from the Pakistan area. These are clichés we’re used to. Let’s be realistic, how many vegetables and how much wheat?!
- Harvest pressure, because the European Union has entered the harvest, and so has Russia.
- Logistics, which generates blockages, due to the demand for transport units, barges, wagons and trucks.
However, things are tempering and the wheat is positioned at the level of 355-358 EUR, according to Euronext. Here it will have a linear route, which will be disturbed only by certain intermittently generated politically, because the crops are somewhat known, and the destinations are in the position of hand-to-mouth, i.e., buy little by little, to wait for certain discounts.
At present, the overall balance of wheat is negative, but not by much. The fact that Russia and Ukraine forecast higher yields influences the price in the harvest pressure.
There will be plateau phases, with stagnation on the landings and then top-down spikes, unconditionally generated by the funds’ motivation to build a margin (as far as interest allows), generated by the supreme weather condition and, of course, by the political factor, which became the main actor in a troubled and moving world.

LOCAL STATUS
Harvesting has begun and is in normal mode for this period. Areas with low production alternate with those that generate production of more than 7 tons per hectare. But, obviously, Romania does not compare with 2020 in terms of production, and barley is no exception.
The port of Constanța was granted with the effects of the price decrease and we see the level of barley at 300 EUR/MT in the CPT parity.
CAUSES AND EFFECTS
The decrease generated by the harvest pressure and the frontal effect of the FED was also reversed on barley.
The award was made even before the price decrease, through the concluded tenders:
- MIT JORDAN purchased 60,000 tons from Ameropa, at a price of 407 USD/MT CIF Aqaba, with delivery in October 2022. Another 60,000 tons were sold under the same conditions, but with delivery in the second half of November by a Australian company, which tells us a great deal, including the fact that Australia is becoming a serious competitor in the East. The effect of good harvests makes them competitive.
- ODC Tunisia purchased 50,000 tons of barley (2 x 25,000 tons) from Ameropa, at a price of 387.9 USD/MT. The origin is the Black Sea basin. The price was 48.12 USD/MT lower than in the previous tender.
July will certainly bring new sales and we will be able to see positive price bargains for feed barley, in direct agreement with the price of feed wheat as the main indicator.

LOCAL STATUS
The price of maize in the CPT Constanța parity deteriorated, in turn, in accordance with the effects of the other price decreases of the goods. The old corn crop is indicated at the level of 300 EUR/MT, while the new crop is quoted at 280 EUR/MT.
The development of corn from the point of view of culture is a normal one so far, but water is the element that will play a main role in the development of the crop and in terms of the volume of corn that Romania will produce.
CAUSES AND EFFECTS
The volume of local maize will be compared with that of the EU and, normally, with that of the neighbors, in this case Ukraine. A Ukraine that is striving on all sides to extract the goods so that it can continue. But all this logistical effort puts a huge pressure on Romania.
Logistics costs have doubled and are extracted from the origin of the goods. In our case, directly from the pockets of farmers. Ukraine is no exception, on the distribution chain starting from the price offered by the buyer, all costs are borne by the seller, through discounts applied to the price.
The pressure of Ukrainian flows will also be strengthened by the flow from Serbia, which will lift export restrictions on goods and about 1.5 million tons of corn will seek their way to the port of Constanta, in this context in which river units are employed in extreme numbers. The first consequence is the effective doubling of the cost of barges on the Danube. The second will be the level of the Danube in case of a dry summer, which would seriously suffocate the operating capacity and thus diminished by the small number of barges.
The leading members of the European Union meet and discuss, make political statements and take group photos. And that’s it. Otherwise, nothing happens. Nothing. We bring back to your attention the slogan 20 million tons in 3 months and we see that 1 month has already passed. July is coming, which will be very difficult. The port of Constanța is already blocked and the beautiful and reassuring words have been forgotten.
For a clarity of the logistic estimate, the Port of Constanța is the only viable option for the transfer of Ukrainian corn. The low logistical cost for Asian destinations, as well as its total capacity, make it the focal point of this campaign. But with what? With what railway and river infrastructure? Political statements said they would send transhipment and transfer facilities, thousands of wagons. Where are they, I ask? Nowhere, I’m telling you. For the simple reason that the countries of the European Union must also harvest, and the need for wagons is obvious. Only about 50-60 wagons were assembled, according to Politico.
Discount of Ukrainian goods, associated with the port blockade and the actual lack of logistics will place a huge weight on Romania’s corn production. And let’s not forget, Ukraine will also harvest, so the 20 million tons will turn into 48-50 million tons soon.
July 2022 will arrive soon and we will see ourselves in chaos and disaster in all its splendor.
REGIONAL STATUS
UKRAINE will generate, according to the latest forecasts, 27.7 million tons of maize, up 2.7 million tons from the last forecast, indicating a potential export volume of at least 19-20 million tons from new crop.
RUSSIA remains in the same forecast parameters, 15.5 million tons, with an export tax calculated at the level of 88.7 USD/MT for this week.
The EUROPEAN UNION remains at the value of 66.8 million tons, so without changes.
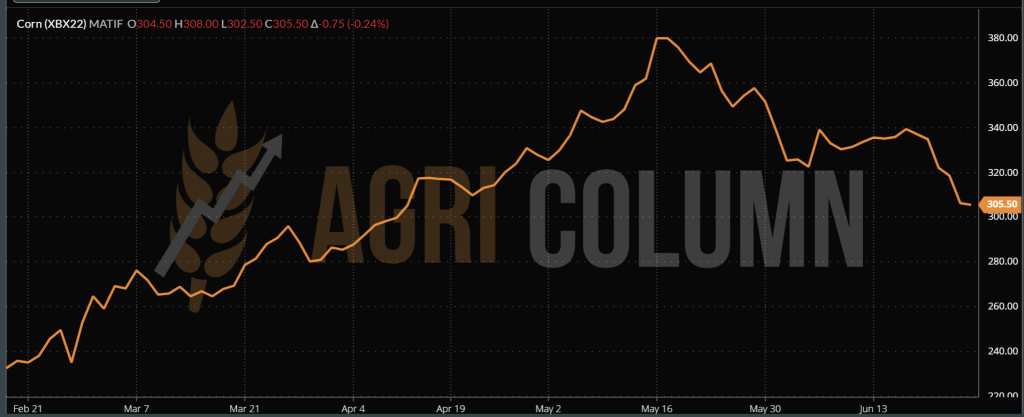
EURONEXT XBX22 NOV22 – 305.5 EUR (-0.75 EUR). The reverse of the harvest is very low.
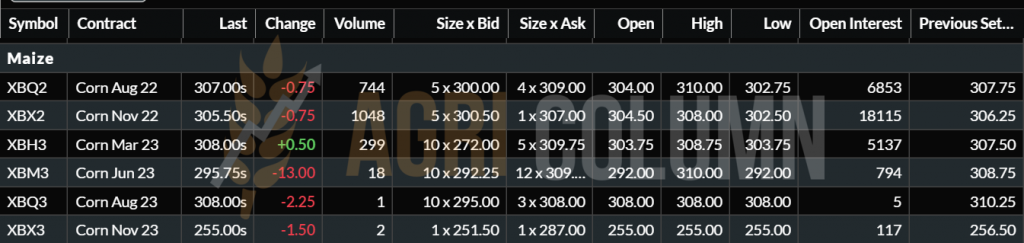
CORN – EURONEXT TREND GRAPHIC – XBX22 NOV22
GLOBAL STATUS
The US is awaiting the final results in terms of area and estimated productivity per hectare for maize on 30 June 2022. It is a very important moment, which will generate price movements. Soil moisture continued to drop in the American corn belt. Today’s value is the lowest for this date, from 2008 to today. The soil moisture is expected to decrease further over the next 10 days. Rainfall is critical in the next 12-15 days to support corn pollination.
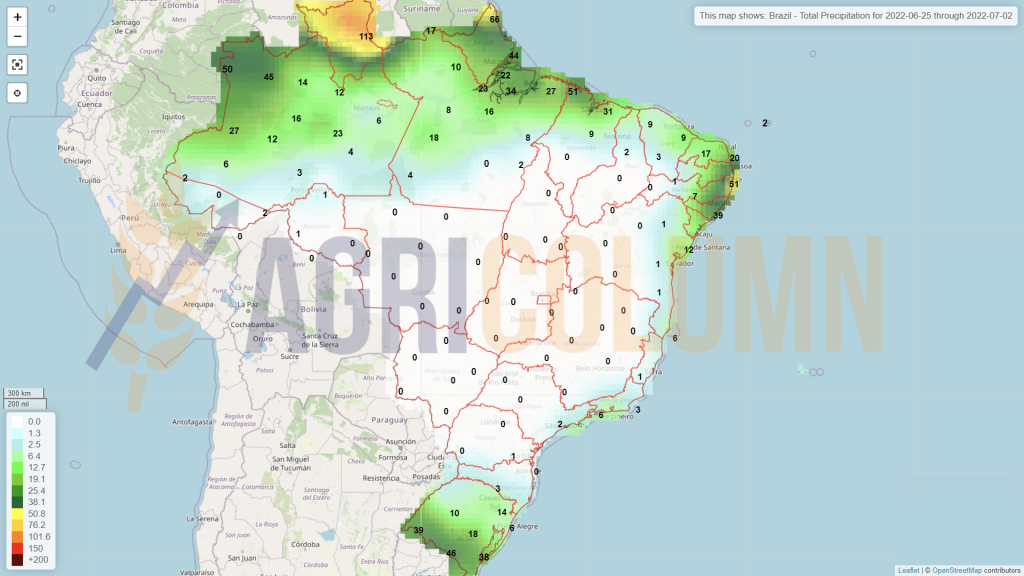
BRAZIL still indicates a very good harvest level of Safrinha, there are no changes at this time.
ARGENTINA is outside the harvest window.
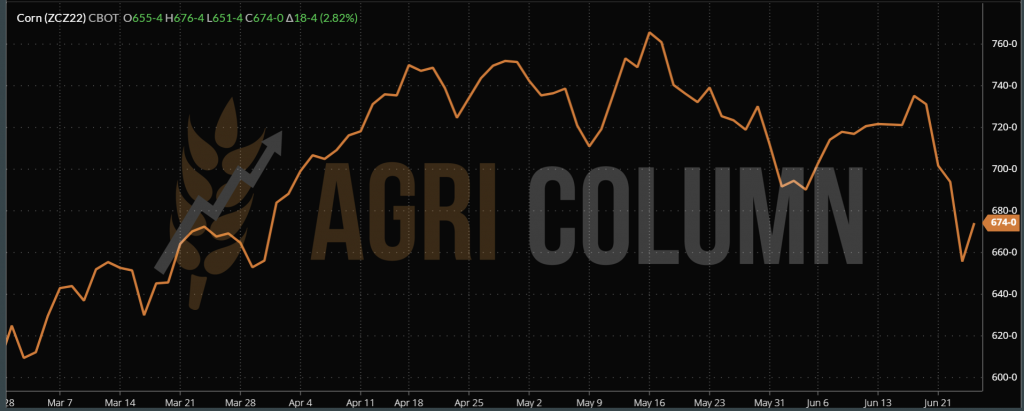
CBOT ZCZ22 DEC22 – 674 c/bu (+18 c/bu = + 7USD), based on the expected precipitation in the USA
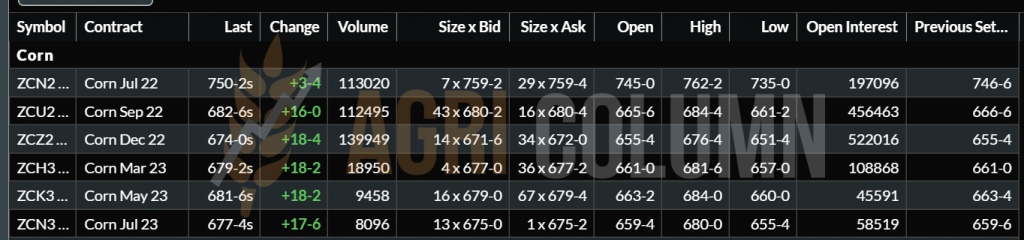
CORN – CBOT TREND GRAPHIC – ZCZ22 DEC22
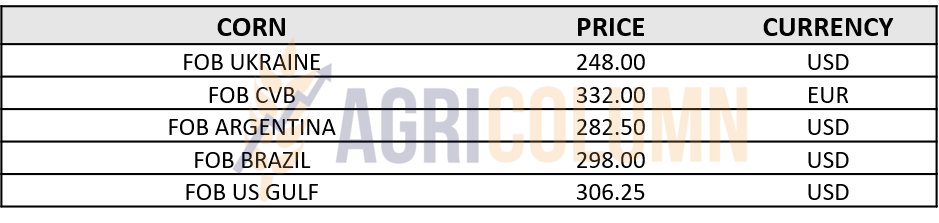
CORN INDICATIONS IN MAIN ORIGINS
CAUSES AND EFFECTS
The effect of the FED has also caused a sharp decline in the case of corn. The liquidation of the positions caused the price to decrease suddenly, from 736 c/bu to 655 c/bu, representing a difference of 81 c/bu = 31.88 USD.
Corn is not yet at the beginning of the price life cycle, referring to the new crop, and things can change with extreme volatility:
- Global volume forecasts are rising. They could be fined by US results on June 30. Then we could see a reduction in American volume.
- But this lower volume will initially be offset by the increase in Ukraine, Russia and South American forecasts. With one condition: Ukrainian corn to find its way across borders.
In conclusion, the plateau phases of the price will be shaken by the weather factor as the first actor (June 30), then the FED announcement will come again and, naturally, the last arbiter will be the political factor (the situation in Ukraine).
But one thing is certain, corn is and will be in the world, just like in the case of wheat. It exists, but the sellers are different. And, if we evaluate the last two FED interest rate announcements, we always have an impact of 30-35 EUR/MT compared to the price of physical goods.
Let us remember together the month of November 2021, associated with June 2022. 0.5% increase in November 2021 and a decrease of the price of 35 EUR on EURONEXT, then 0.75% June 2022 and a decrease of 35 EUR on EURONEXT.
THE WORLD MUST BE FED, WHEAT AND MAIZE ARE SOCIAL ELEMENTS, BUT:
- Fertilizer costs are very high.
- Gas costs have been raised by Russia, by stopping deliveries to certain EU countries. Gas is an ingredient in the manufacture of fertilizers and, therefore, keeps the price high, through its composition in the complex. Azomureș Romania announced that it will stop production again, due to the price of gas.
- Fuels are very high in price and are the main component in agribusiness.
How is all this resolved if commodity prices fall but costs remain high?

LOCAL STATUS
The first indications of rapeseed oil content in Romania are positive and encouraging. They are above the 42% level. It’s a great start, thinking we’re first rapeseed cuts these days in Romania.
Price indications are subject to permutations, depending on the interests of buyers. We refer here to the indicative complex EURONEXT AUG22. Thus, buyers increase the difference from AUG22 to minus 50 EUR.
In other words, after four days of dramatic declines in rapeseed, the push received at the end of the session on June 24 did nothing but widen the gap. If in the morning the buyers were positioned at minus 20 EUR compared to AUG22, the increase was canceled by the increase of the difference by the buyers at minus 50 EUR. In practice, nothing was gained.
It is, if you will, a repositioning in the face of demand and supply from buyers, a grant in the face of a growth spurt from Canadian canola, where June 24 was the end of the indication JULY-22.
CAUSES AND EFFECTS
A rich crop in perspective generates a lower price level. A buyer clearly knows several things:
- Extremely many farmers have nowhere to store rapeseed.
- Even if they do, they do not have the technical knowledge necessary to preserve the identity of the product.
- It is a cash commodity and is sold to ensure the need for cash on farms, against the background of maturities and the need to cover the volume of fixed and variable expenses.
- The large volume creates the peace that these goods will be available in the market and therefore purchases can be made with later delivery, adding a storage cost to the price of the goods.
REGIONAL AND GLOBAL STATUS
Europe, Ukraine and Canada look very good in terms of volume. Australia promises very high values, close to 6 million tons. China and India, even if they do not export, show very good volumes.
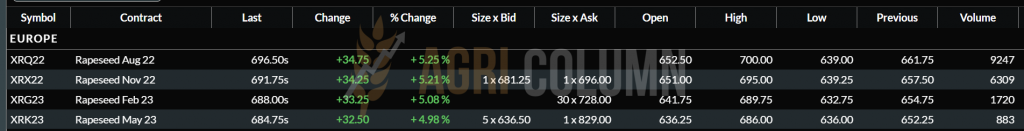
EURONEXT XRQ22 AUG22 – EUR 696.5 (+34.75 EUR) at the end of the session, after four days of dramatic declines.
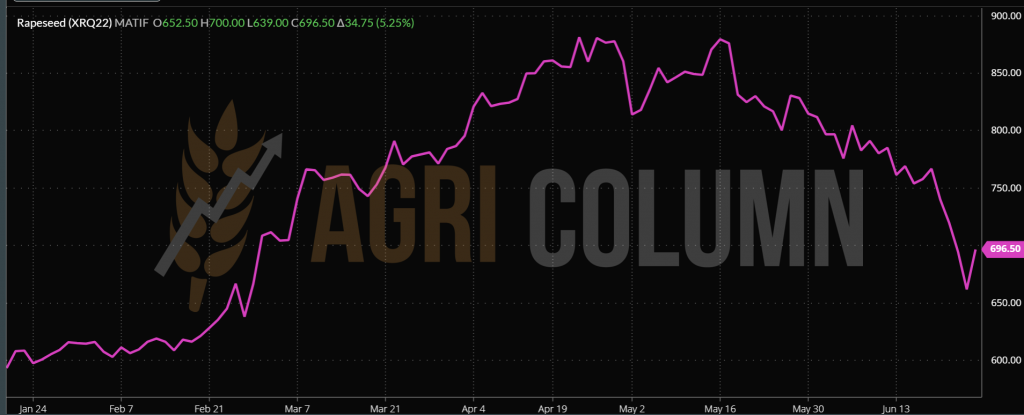
GRAPHIC TREND RXQ22 AUG22 RAPY. We set off on June 17 from 766 EUR and the dramatic drop from this level stopped at 662 EUR. There is a level difference of 104 EUR/MT. The increase of 34.75 EUR is only a temporary PALEATIVE.
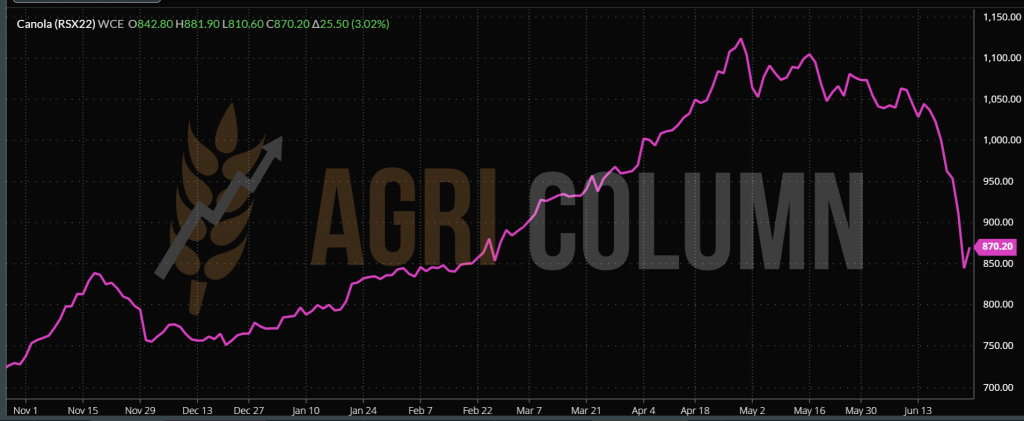
ICE CANOLA RSX22 NOV22 (+25.5 CAD at the closing date of June 24, 2022)
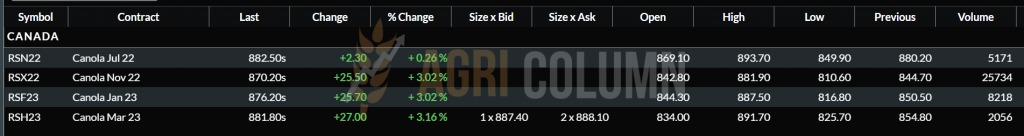
The chart below shows us a level difference of 200 CAD (Canadian dollars) scattered over a few days.
GRAPHIC TREND ICE CANOLA:
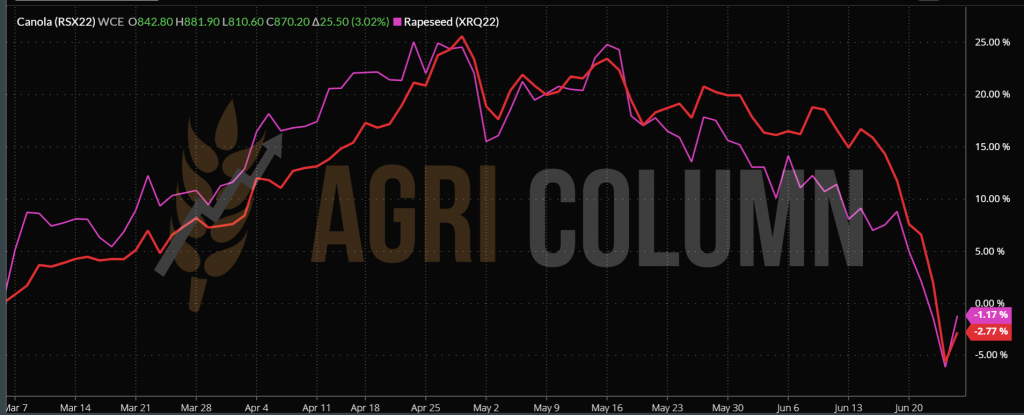
CORRELATION BETWEEN THE TWO SCHOLARSHIPS. THE ROUTE IS IDENTICAL ( canola – red line; European rapeseed – pink line)
CAUSES AND EFFECTS
- The FED effect is extremely strong in the RPS + CANOLA complex. The level of guarantees applied to the funds is much higher in the case of rapeseed and canola, due to the value algorithm. For example, guarantees for wheat relate to a level of 350 EUR, while for rapeseed it amounts to 696 EUR. The financial effort is therefore very high in covering the guarantees and the return is not satisfactory (income minus expenses).
- Indonesian palm oil is losing ground in terms of price and leading to a decline in the VEGOIL complex.
- The volumes can be seen very well on the horizon. The application is covered until October.
- FED stages are still waiting for us: July, September…
- Normally, the application for rapeseed must arrive without delay from November 2022. But then we will know the areas sown with rapeseed in the European Union, as well as in Ukraine, Russia. It is another influencing factor in price, which exists and can be seen.

Indications of sunflower seeds suffer significant declines. The port of Constanța withdraws at a maximum level of 550 USD/MT. During this time, processors indicate values of 540 USD/MT, and some even 520 USD/MT.
The Romanian sunflower crop shows a very good potential at the moment. We have not seen any change in vegetation in the time since last week’s report to date.
CAUSES AND EFFECTS
The volume that can be seen on the horizon causes the price to be drastically penalized. Normally, it had to be set at 580+ USD/MT. The oil is not low at this level and so 550 USD/MT is a somewhat undervalued price. But the volume factors associated with other factors that we will describe below make today’s levels much lower.
- The dilemma that farmers will have will be where to store sunflower. What to give up? Wheat or the volume of corn that will arrive immediately after sunflower?
- Very expensive logistics, which makes the price actually evaporate in the farmer’s yard. And we are talking about sunflower seeds that have a much lower hectolitre mass than cereals.
But after the harvest, when things relax, the price changes will not be long in coming. And that’s because, at the same time, processors and exporters know that Romania is the only basin of zonal origin.
As a counterweight, we could evoke the Ukrainian flow of raw materials that will cross Romania and, certainly, at today’s discounts, will be captured by the domestic market on the way to the port of Constanța. But even there it will influence the Romanian goods through the price level.
REGIONAL STATUS
THE EUROPEAN UNION indicates the same volume level, of 10.9 million tons and it would not be surprising to see an upgrade during the harvest, of at least 0.1-0.2 million tons.
UKRAINE remains at the level of 9.5 million tons 2022 crop forecast.
CAUSES AND EFFECTS
Ukraine has managed to cross its borders with 186,000 tons of crude oil and 375,000 tons of sunflower seeds. 82% of the crude oil went to the European Union. Let us remember that the EU used to import about 200,000 tons of crude oil from Ukraine every month before the conflict. Thus, supply began to normalize.
Ukraine slows down the pace of processing and at least 8 units stop. Logic says that you process in vain if you can’t transport and, implicitly, sell. This creates the premises for a much higher flow of raw materials. If we estimate the old crop and the new crop, we can easily reach a level of 13.5-14 million tons.
Also in Ukraine, at least two processing units have started incinerating sunflower meal due to lack of marketing opportunity and lack of storage space.
The above conclusions are that the aggregation of all factors indicates the depreciation of the price of the raw material for a period of time. Associated with the fact that India has reduced the demand for sunflower oil with the intention of an agreement with Russia, we have another factor that potentiates the decline.
Russia, on the other hand. has a very high tax on the export of sunflower oil. Until July 31, it will remain at 520 USD/MT and after this date it will increase to 560 USD/MT. But if Russia captures the Ukrainian oil production, it will generate a much lower tax to boost exports.
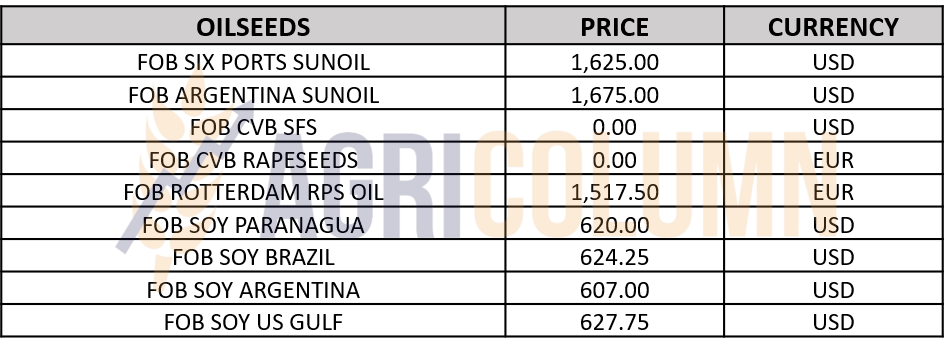
CSFO AND OILSEEDS INDICATIONS IN MAIN ORIGINS (old crop)

LOCAL STATUS
The prices of the new soybean crop were degraded by over 40 USD/MT, reaching the level of 600 USD/MT, DAP Processor. The effects of the roller coaster also affected the price level of the future crop in Romania.
GLOBAL STATUS
The United States is waiting for June 30, the time to certify the areas and the estimated productivity of soybean cultivation, which, at the moment, is set at 126 million tons, a very high level.
SOUTH AMERICA remains the same in forecasts with Brazil at 149 million tons and Argentina at 55 million tons.
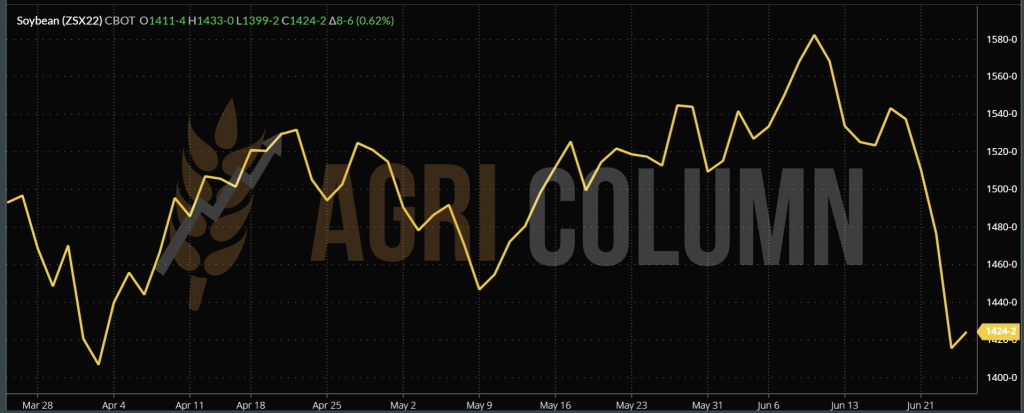
CBOT generated a small firework after the decreases caused by the FED, but the indication ZSX22 NOV22 is relevant for the new crop and, as we see, the difference between JUL/AUG and NOV IS CONSISTENT in terms of HARVEST INVERSE.
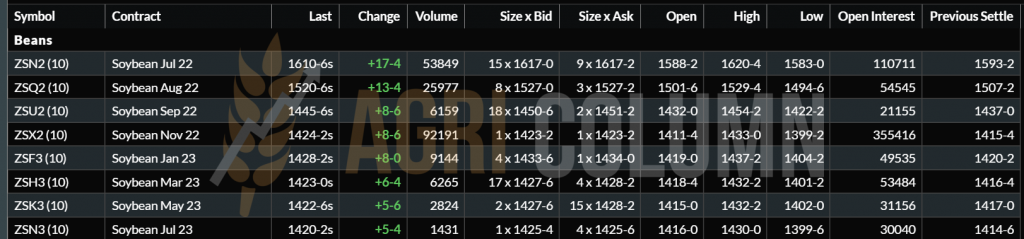
CAUSES AND EFFECTS
- FED catches soybeans in the mixer and reduces it in price.
- Crop volume is an additional pressure factor.
- The VEGOIL complex is influenced by palm oil and contributes to the resettlement of soybeans on other, lower levels.
- July 2022 was the indication that closed on June 24 and so the fireworks will not last too long.
The surplus commodity will generate a much lower price for soybeans than the peaks we are used to. The difference of 160 c/bu (-60 USD) displayed by CBOT between the old and the new crop clearly indicates the decreasing trend.


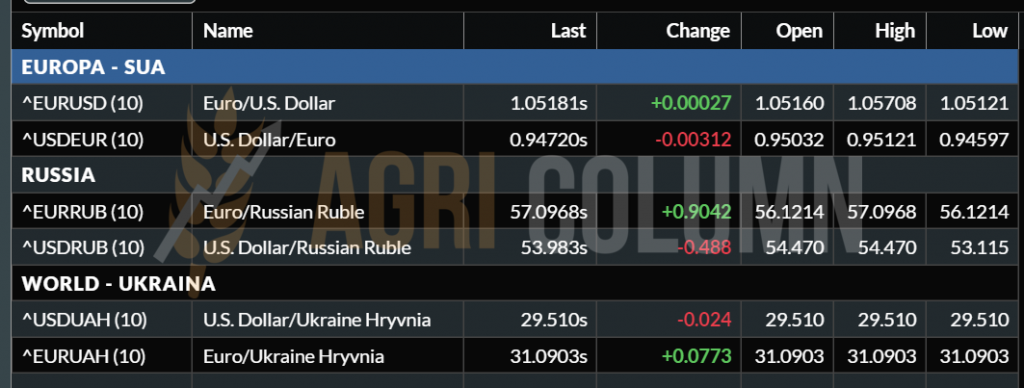
EUR-USD 1:1.0518

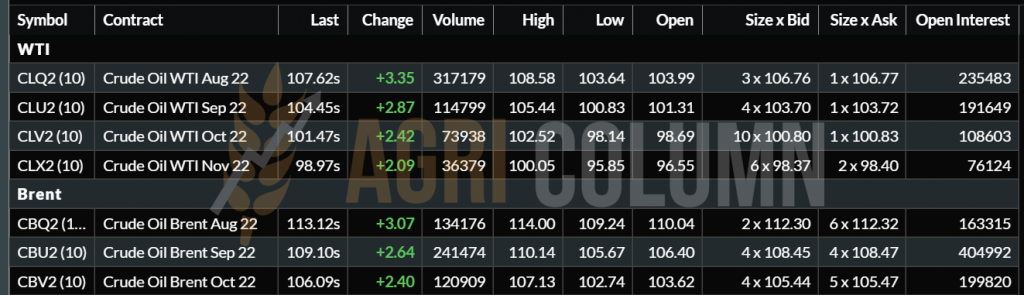
WTI 107.62 USD/BARREL | BRENT 113.12 USD/BARREL

25 June – 1 July 2022
Romania
Europe
Ukraine
Russia
Canada
USA
Brazil
Argentina
China
Australia