This week’s market report provides information on:

LOCAL STATUS
Wheat swings between Politics and Weather. 10 EUR/MT was the level difference of the last days. We see a level of 385 EUR/MT in the CPT Constanța parity, fully granted with the level of the last GASC tender. The price difference between milling and feed wheat remains in the range of 22-25 EUR/MT, a sign that the demand for milling wheat is much higher and buyers estimate a higher share of feed wheat, to the detriment of milling wheat.
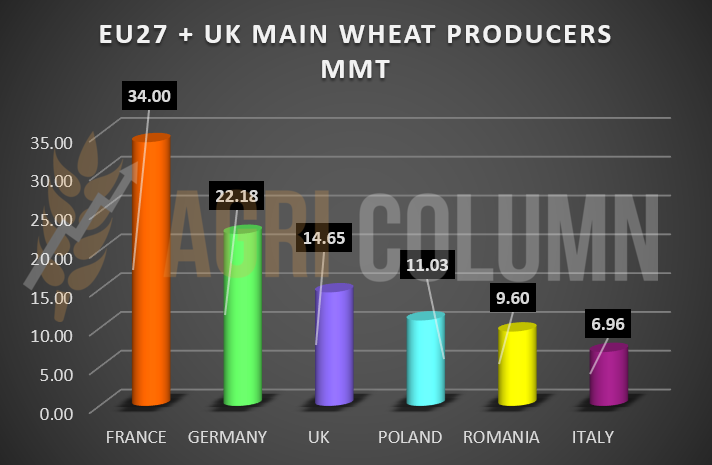
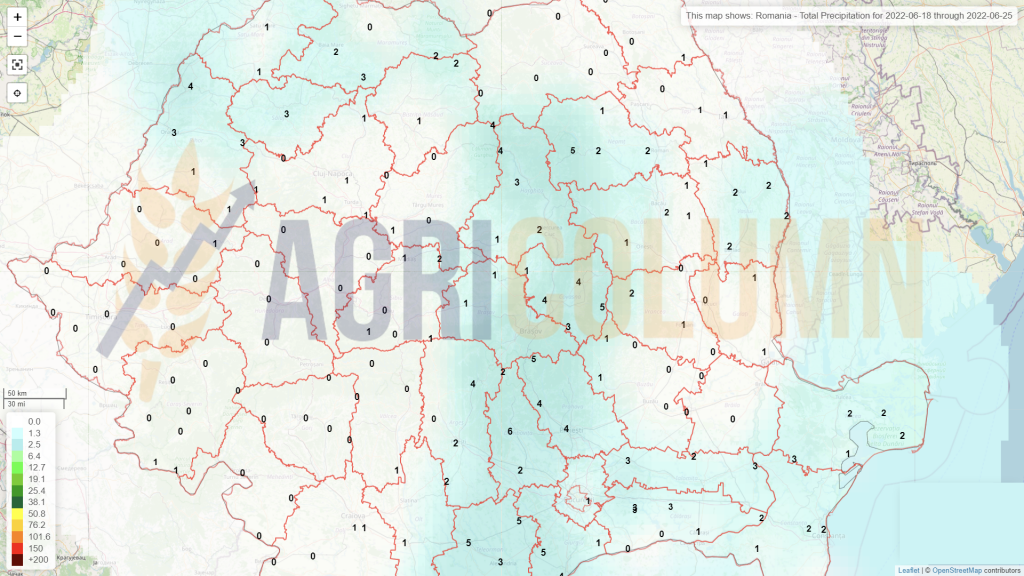
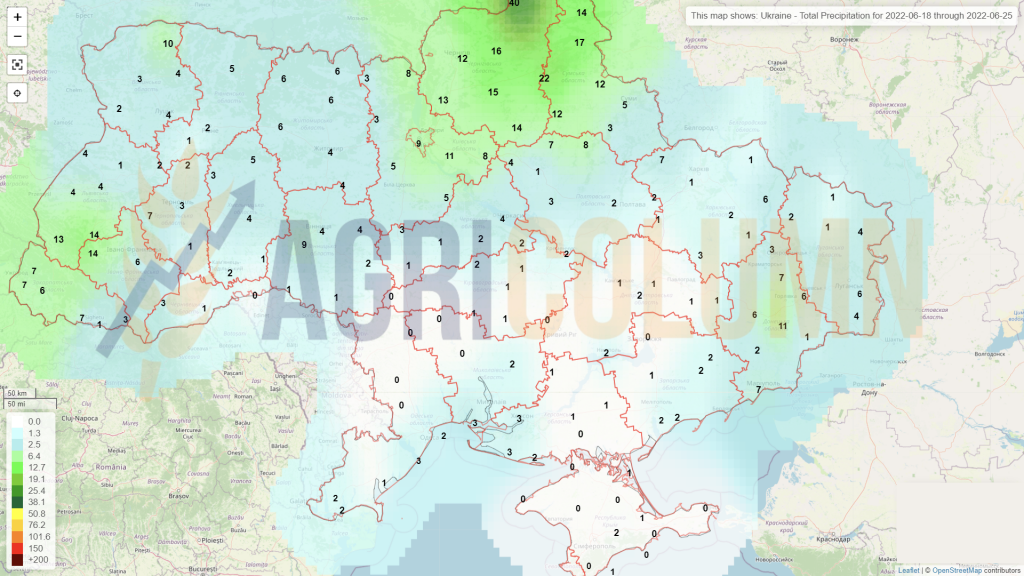
According to Geosys, Romania is forecast much better than the period before the rainfall. The harvest volume receives a substantial upgrade, reaching an estimated 9.6 million tons. Normally, this would be the average production level of Romania. Of course, there are areas with moderate and extreme drought problems, but there are also areas that balance positively. Water was an unexpected gift that farmers received when they expected less and when their wheat was in a later stage of development. This normally facilitated almost perfect development and so many areas that were sown later in the autumn were direct beneficiaries.
CAUSES AND EFFECTS
Due to the rainfall, we may see that wheat will be delayed in harvest and will overlap with rapeseed harvest, which will be delayed in turn.
The port of Constanța is already under great pressure and this is visible. Many buyers have increased the logistics costs between FCA Farms and Port or their silos and Port. We already have the confirmation of the logistical pressure that will be reversed in the price that farmers will receive on their goods. It’s not a positive thing at all and I’ve been predicting it for at least 2 months.
Example:
- Brăila-Constanța 30 EUR | Corabia-Constanța 33 EUR
- Giurgiu-Constanța 30 EUR | Călărași-Constanța 28 EUR
As a final conclusion, we will have the associated logistical costs reversed towards the origin of the goods and, in addition, the harvest pressure will generate discounts, amid logistical blockages caused on the one hand by the lack of means of transport (river, railway and road, accessed also by Ukrainian goods), as well as the extremely visible port blockade at the moment.
REGIONAL STATUS
UKRAINE does not yet see any green light on the horizon for the extraction of goods. Ukrainian wheat has the largest share in the southern region and problems are beginning to worsen. At the declarative level, politicians are setting directions, but in real life, nothing is really happening. The kilometer queues at the western borders are silent witnesses to this effect of lack of concrete action. And this naturally leads to large discounts on goods, as well as double logistics costs.
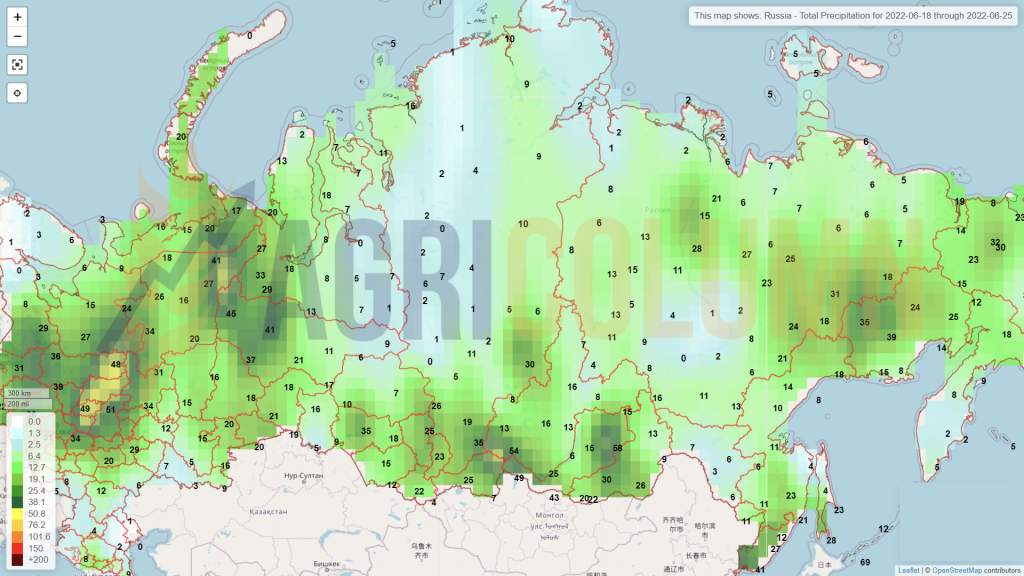
RUSSIA also has problems: large stocks of wheat on its territory, a strong ruble (which reduces the value in the internal market), distressed logistics (large ships cannot enter due to sanctions). To all this we add the famous floating tax. Russian 12.5% PRO wheat is offered at 430 USD/MT FOB Kavkaz. However, as we have predicted, Russia is setting up separate wheat sales channels through “G2G” (through intermediaries) to various government agencies in the main wheat importing countries, as follows: GASC Egypt, TMO (TMO TURKEY can now buy grain without public tender from “state-owned companies”), TCP Pakistan, OAIC Algeria, GTC Iran, DDGS Bangladesh, Hoboob (Syria), STC India.
FRANCE will reduce the production of milling wheat by up to 33-33.5 million tons. Lack of water causes volume problems. And this is starting to show from the barley yield, which doesn’t shine at all.
ROMANIA is starting to be highly sought after by Singapore trading hubs. Faced with the prospect of a negative volume balance, they offer Romanian wheat in the condition of CIF Southeast Asia delivery at values of 470-480 USD/MT, which leads us to CPT Constanța values between 388-398 EUR/MT.
Egypt has so far purchased 3.9 million tons of local wheat during the current harvest season, surpassing last season’s total by 300,000 tons. The government, which provides subsidized bread to more than 70 million of Egypt’s 103 million people, has set an ambitious target of buying 6 million tons of local wheat this year, two-thirds more than in any of the last two years.
Egypt says farmers must provide the state with at least 60 percent of their harvest, up from 40 percent it bought last year. Fines and even imprisonment are imposed on those who do not comply. The rules are intended to prevent farmers from withholding more of their feed and traders from selling wheat on the open market.
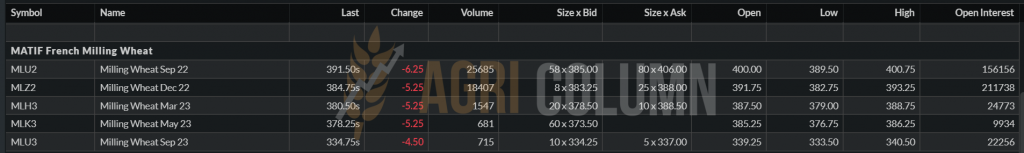
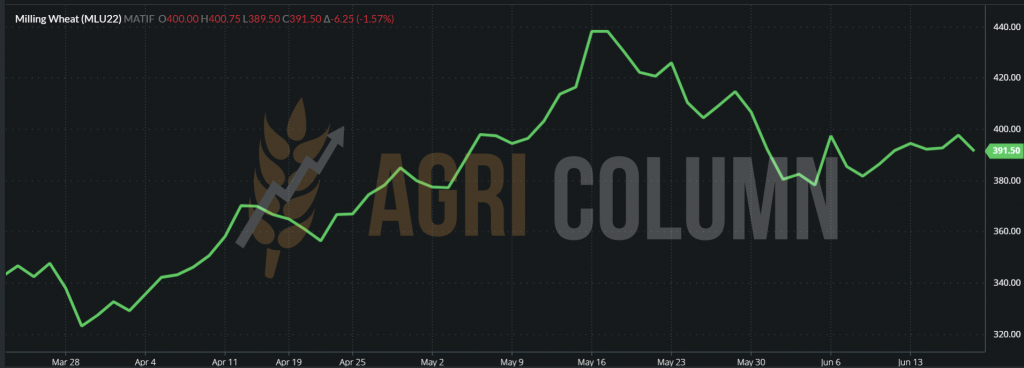
EURONEXT in front of a technical meeting of Profit Taking, reverberated from CBOT.
EURONEXT WHEAT MLU22 SEP22 – 391.5 EUR (-6.25 EUR)
WHEAT – EURONEXT TREND GRAPHIC – MLU22 SEP22
GLOBAL STATUS
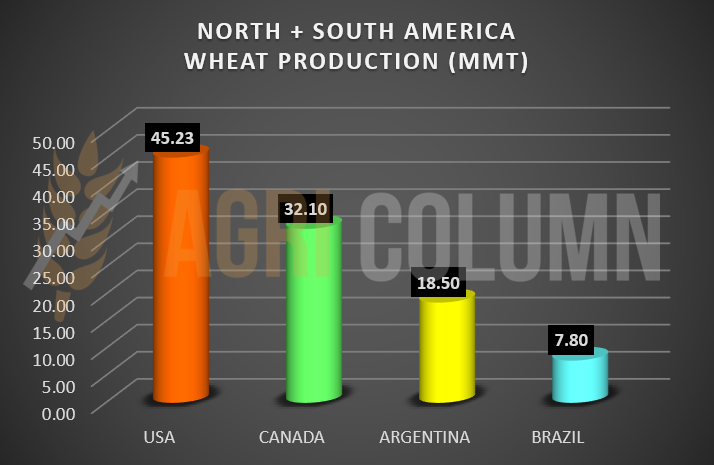
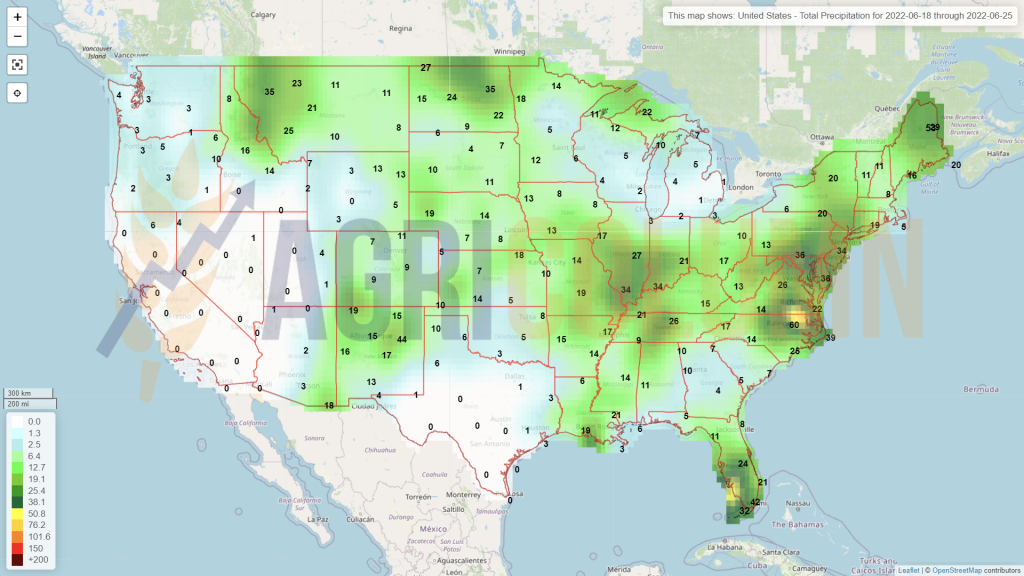
The US is lowering its forecast to 45 million tons, according to Geosys, and is certainly approaching the level of 44 million ton of wheat production (our estimate).
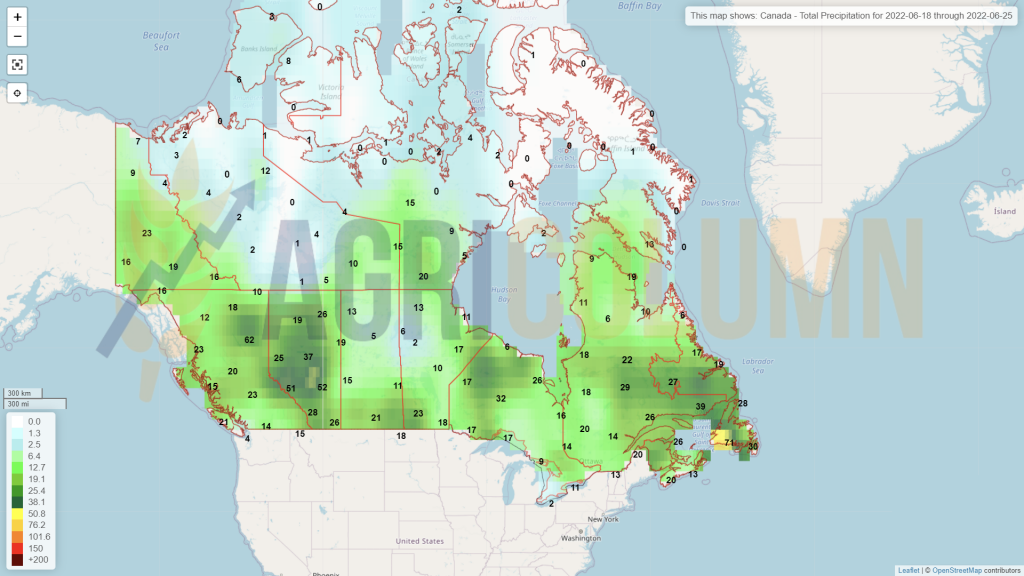
CANADA supports 32 million tons, 2 more than the initial estimate, and this is the end result of the Weather factor, which was extremely generous.
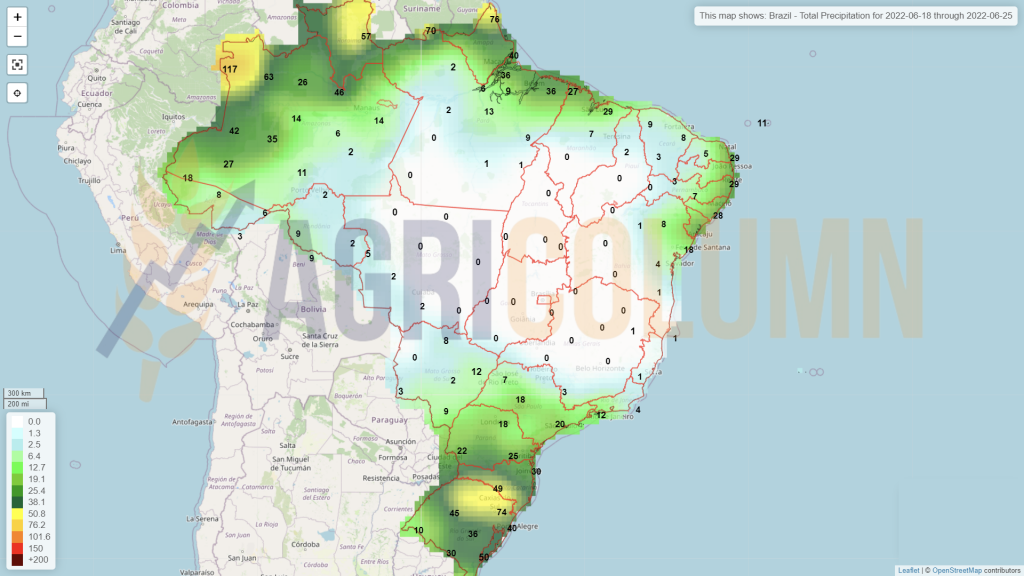
BRAZIL remains forecast at 7.8 million tons for the time being. This is the level of coverage for Brazilian wheat, which supports domestic consumption.
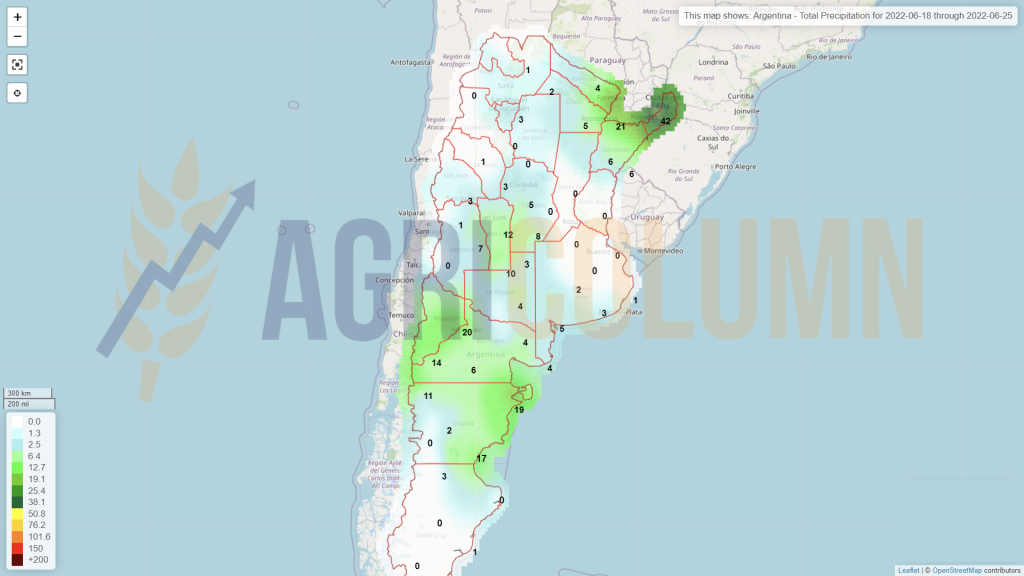
ARGENTINA is facing problems in sowing wheat. Due to the acute lack of rainfall, Argentine farmers are unable to carry out sowing operations. Progress is slow and there are already sharp problems on the horizon. From an estimate of 20.5 million tons, it has reached 18.5 million tons. In total, only 30% of the area has been planted with wheat since June 8, down 6.2 from the same levels a year ago, according to the latest estimates from the Buenos Aires Grain Exchange (BAGE).
And the government of President Alberto Fernandez has imposed a series of safeguards to address rising levels of domestic inflation in the country, warning of rising export taxes and potential additional measures to protect the domestic market and bringing even more uncertainty to the agricultural sector.
The measure that has the greatest impact on trade in cereals is the so-called “equilibrium volumes” first imposed on wheat in December 2021. They automatically ban exports and trigger other restrictions when a volume threshold is set.
For wheat, the export quota was set at 10 million tons for 2022/23, about 4.5 million tons below exports in 2021/22, when the country hosted a record crop of 22.4 million tons.
“There is a lack of responsibility on the part of the Argentine government, which, instead of encouraging the sowing of wheat so that we reach 20 or 22 million tons, has stopped exports at ten million tons,” said Luis Miguel Etchevehere of the Society of Rural Development of Argentina (SRA) at a global conference last week. “The world should not expect Argentina to make a significant contribution to its export volumes this year.”
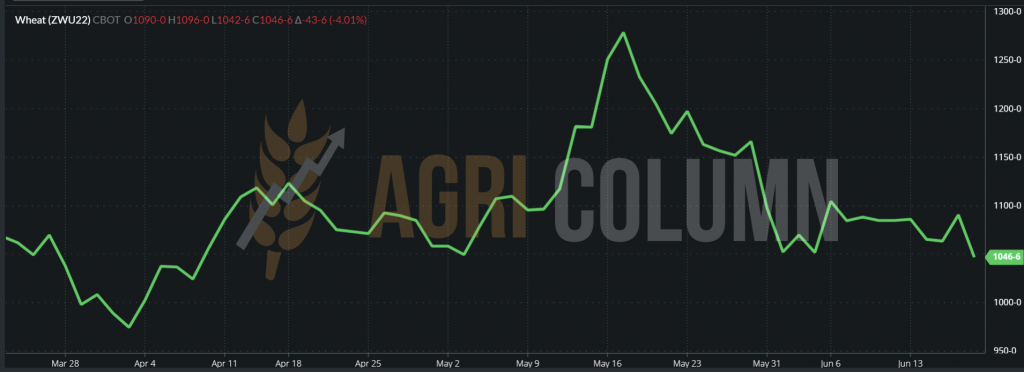
CBOT – a technical session of Profit Taking. The July deadline is approaching and the funds are starting to liquidate the positions or move them (roll over).
CBOT ZWU22 SEP22 – 1,046 c/bu (-43 c/bu = -15.8 USD)
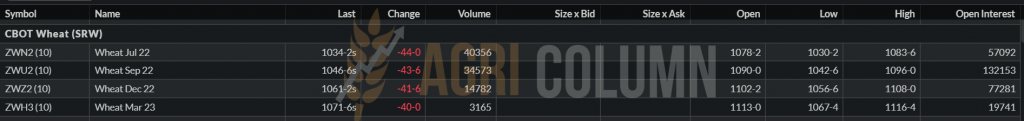
WHEAT – CBOT TREND GRAPHIC – ZWU22 SEP22
CAUSES AND EFFECTS
We already have a confirmation – the FED announcement of an interest rate increase did not create the effect of a collapse in the agricultural commodities market. The increase of 0.75% to 1.75% did not negatively affect the price of raw materials. There will be another 0.75% increase in July, 0.5% in September, and November and December will also bring 0.25% increase.
We have an eloquent picture of global crops and we can say that the volumes will be affected by heat and drought. Productions are declining at European level, and this in first cuts. The United States will also be penalized at least 1 million tons for wheat production.
In South America, Argentina has problems sowing due to the drought, to which is added a protectionist policy reducing the level of exports by 4.5 million tons, which means quite a lot.
The technical session on CBOT was reflected on Euronext. The July 2022 deadline is approaching and it is time to step down. Then CBOT will align with SEP22.
With Russia, which, despite its large stocks, has logistical and declining prices in the domestic market, we will certainly see a narrowing of the wheat supply.
Wheat will start to rise, it will start to be demanded, but locally, in Romania, farmers will be penalized by the logistics and constraints generated by port blockages, as well as by the lack of availability of means of transport.
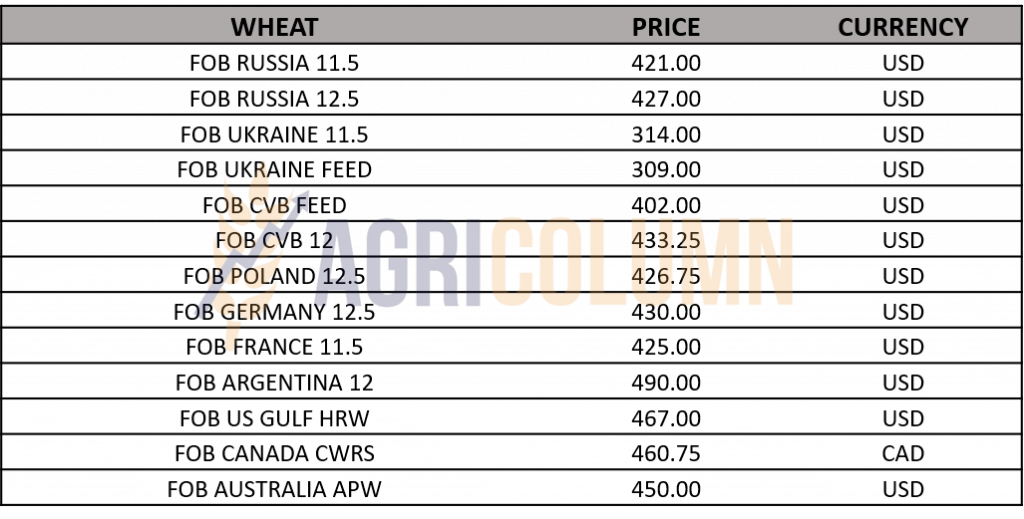
WHEAT PRICE INDICATIONS IN MAIN ORIGINS

LOCAL STATUS
The indications for barley in the port of Constanța are at the level of 335 EUR/MT. In some cases, they can reach up to 340 EUR/MT, but here they stop, at this moment. The wave of execution is still at its peak, and deliveries for old contracts are underway.
In this context, we record a sale of barley to Jordan at a price of 428 USD/MT CIF Aqaba. Converted to the CPT Constanța parity, it indicates a level of 355-357 EUR/MT.
Harvest results are different in many parts of the country. There are in the south of Romania areas with a disappointing production, of only 2.5-3 tons per hectare and a Test Weight below the minimum, i.e., below 58 kg/hl. In the Vrancea area, the results are also very poor, this area being known as one strongly affected by the extreme pedological drought.
CAUSES AND EFFECTS
After the June contract execution, we will see declining interest in feed barley. August, in turn, will generate demand. The next application period for feed barley will be in January and February 2023.
We mention this to generate the necessary information for potential feed barley sellers. There are stages of demand as well as stages of lack of demand.
REGIONAL STATUS
EUROPEAN UNION. The European barley crop is facing the same problems – mixed production, mixed quality and the USDA has led to a decline in European feed barley production. The Geosys volume forecast is 51.65 million tons.
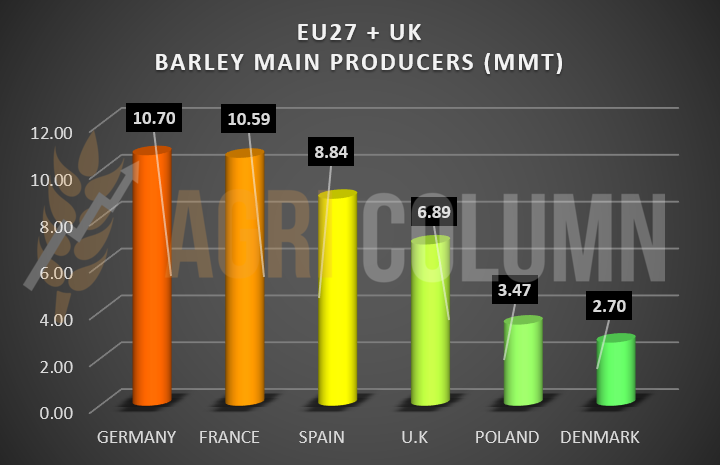
RUSSIA is indicated by Geosys with a crop of 19.28 million tons, up from the previous season, when they harvested 17.5 million tons.
UKRAINE has an indication of 6.25 million tons, compared to 10 million tons last season.
GLOBAL STATUS
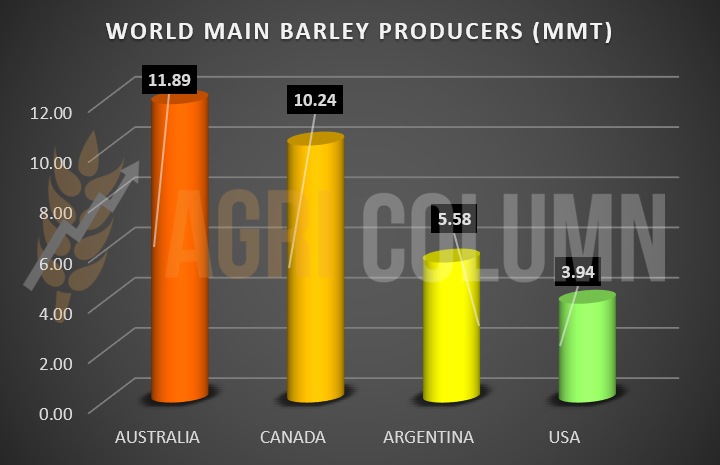
AUSTRALIA is indicated by 11.9 million tons, representing a much lower production than last season, when they harvested 13.7 million tons.
CANADA will generate 10.25 million tons of barley. It is a very good production, compared to the previous disastrous season, when they harvested only 6.8 million tons.
ARGENTINA will produce 5.6 million tons, a stable volume identical to the previous season.
US is estimated at 3.95 million tons, up from last season, when they harvested only 2.5 million tons.
CAUSES AND EFFECTS
- Global barley production is in deficit with demand.
- Quality and quantity are mixed across the EU.
- Imbalances may occur during harvesting.

LOCAL STATUS
The indications of the port of Constanța for old crop corn are set at the level of 315 EUR/MT, with small differences between buyers. The new crop is indicated at 307-309 EUR/MT, a price level that has remained in the same area.
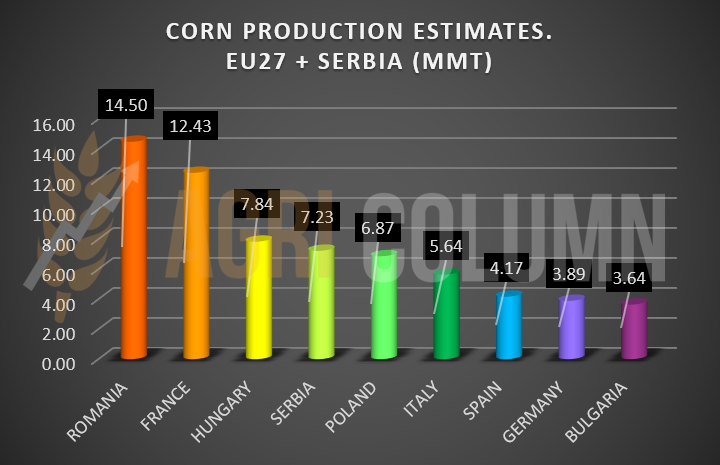
Romania receives a forecast upgrade due to rainfall, and Geosys strengthens this, raising the level from 13 million tons to 14.5 million tons. Rainfall has eased farmers. Crop development is under good auspices, especially since no high temperatures have been recorded and water has had time to enter the soil.
CAUSES AND EFFECTS
Corn is and will be affected by the logistics complex. It will come inertia just like a snowball, which will roll down the valley becoming an avalanche. Logistics costs will bite from the price of goods and the logistics complex will retain several percent of the price.
A heat wave will pass over Romania this week. Ideally, it should not stand still and affect plant development. According to forecasts, the wave will pass and will not stop, moving to Ukraine and Russia.
REGIONAL STATUS
FRANCE does not receive an upgrade to the maize crop, remaining at 12.5 million ton. But, as we know, compared to Romania, France has the advantage of productivity.
SERBIA is valued at 7.25 million ton of corn and the indications so far are good.
HUNGARY is also approaching 8 million tons, more precisely 7.85 million tons.
UKRAINE has finished sowing corn and we have an area of 4.6 million hectares. Compared to 2021, when they sowed 5.5 million hectares, we have a decrease of 900,000 hectares. Reflected in production in 2022, Ukraine will harvest only 25 million tons, compared to 42 million tons in 2021. It is a production deficit of 16 million tons, which will be reflected in the global supply and demand balance, but later. Much later, not now.
But nothing has changed in terms of attempts to unblock Ukrainian exports. We are in the same game of chess as Russia, which claims that they do not block exports. Ukraine needs to demine its port areas. But all this time we are wondering what happens to the ships stranded in the Ukrainian terminals? The goods are certainly depreciated.
Maintaining the quality of the goods in those huge tin barns from February 24, 2022 until today is a very difficult thing to do, especially since the temperature values are very high and nothing can generate transfer and aeration operations on the goods.
As for the transfer corridors across the western borders, nothing new. These are just meaningless political discussions. Nobody moves anything at all. Everyone is walking around Kyiv and campaigning in Ukraine, posing with President Zelensky and that’s it.
You can understand the frustration of the Ukrainians and the pressure they are exerting at the diplomatic and lobbying level. You can understand the desperation with which they pay very high logistical costs, as well as the discounts they charge on their own goods. Nothing happens in an organized and structured way. Nothing is outlined as an extraction plan, which sets out all the operational and logistical steps, as well as the bureaucratic ones. And not to mention the human resources needed in this case. It’s just total chaos.
RUSSIA will generate a volume of 15.5 million tons, with an export projection of a maximum of 5 million tons. Russia has therefore received a 1 million tons crop upgrade.
CROP ESTIMATES IN MAIN PRODUCING COUNTRIES (EU27 + SERBIA)
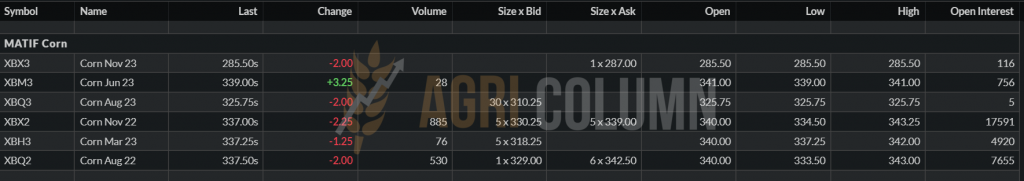
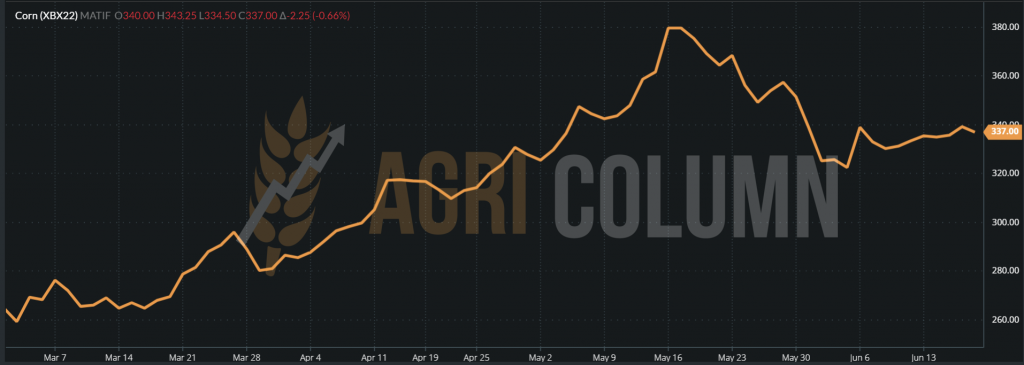
EURONEXT XBX22 NOV22 – 337 EUR (-2.25 EUR)
CORN – EURONEXT TREND GRAPHIC – XBX22 NOV22
GLOBAL STATUS
The United States is awaiting the results of the performance indicators on corn. This will happen around June 30, 2022. Then we may see productivity per hectare granted according to preliminary analyzes by Barchart, which reduced the American crop from 177 bu/acre to 174 bu/acre. Transformed into the European metric system, these figures indicate a decrease from 11.1 tons/ha to 10.92 tons/ha. Converted into missing production, we have an indicative figure of almost 8 million tons.
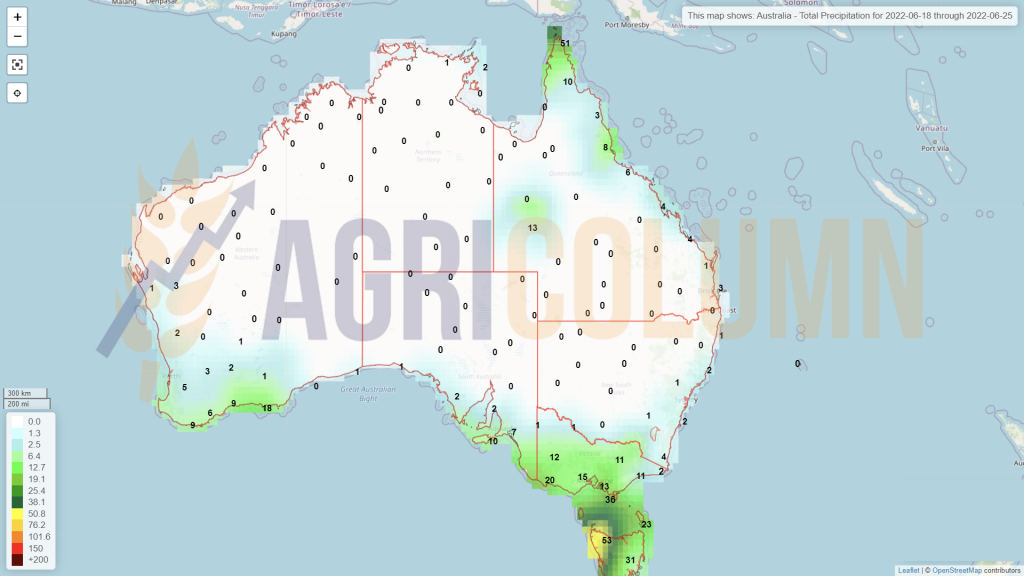
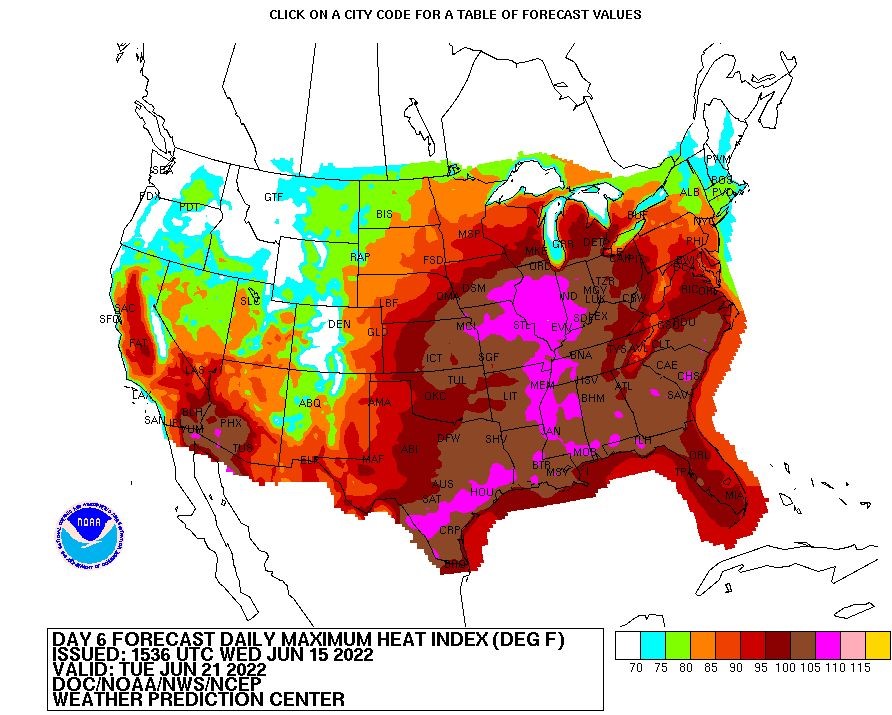
At the same time, the United States is already experiencing an extreme heat wave that is sweeping the Corn Belt, which is not a good thing for corn, especially now, after sowing and sprouting. Although fears are low at the moment, we could see a new episode of La Nina, and if that happens, the weather factor will be the driving force this year, for the simple reason that corn is the prerogative of the two Americas, North and South. Below is the NOAA forecast for June 15-21, 2022.
No change in Brazil and Argentina in terms of the volume that Brazil will generate at the end of the Safrinha harvest (116 million ton), nor in the projected volumes for future harvests (126 million tons Brazil and 55 million tons Argentina).
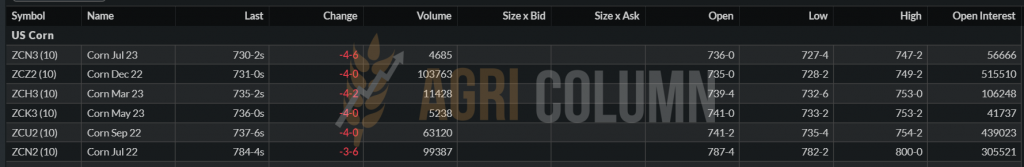
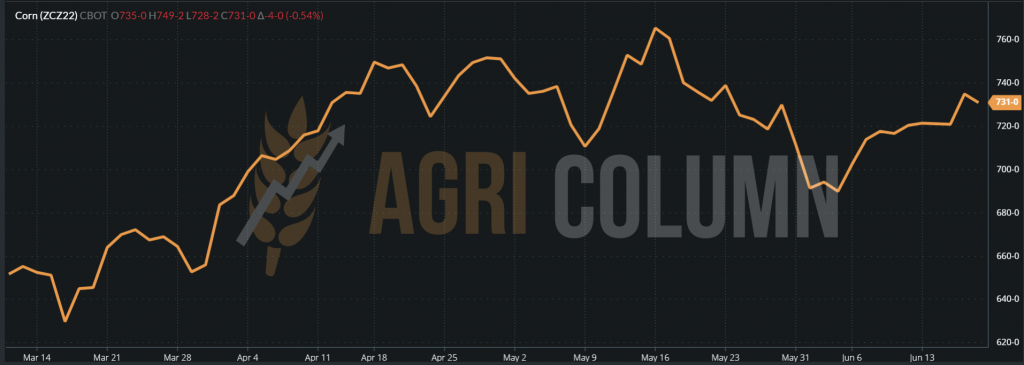
CBOT ZCZ22 DEC22 – 731 c/bu (-4c/bu, an insignificant decrease)
CORN – CBOT TREND GRAPHIC – ZCZ22 DEC22
CAUSES AND EFFECTS
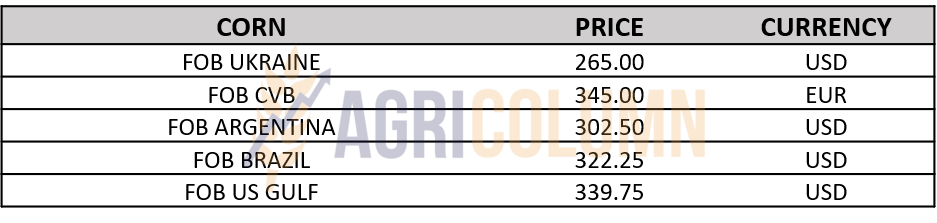
Regional corn (Romanian and Ukrainian corn that manages to cross borders) is in continuous demand in Asia. Price and logistics compete very well with South and North American origins.
American corn is continuing its export programs without any problems at the moment. USDA inspections are clear confirmations.
South American corn (future crop) is currently balancing the lack of 16 million tons in Ukraine and the potential shortage in the US (caused by lower productivity).
However, at this moment, regarding the difference expressed on CBOT between the old and the new crop, we find a difference of 54 c/bu between the indications DEC22 and JUL22, a sign that the trust in the new corn crop is in its place.
CORN INDICATIONS IN MAIN ORIGINS

LOCAL STATUS
The price level of rapeseed in the port of Constanța or DAP Processor is starting to decrease. It is about increasing the basis, with reference to AUG22. Thus, the quotations reached AUG22 minus 12 EUR/MT.
This is due to the indications of increased volume in Romania, which, according to the latest data generated by the Geosys system, reached 1.6 million tons of crop forecast. Therefore, the buyers went into a state of relaxation. Large processors have already purchased the level of volume required for the first tranche of processing and no longer show a significant interest in the goods. The desire is to buy with late delivery and as cheap as possible. Logically, since the volume generated by Romania covers the internal processing, quoted at about 0.5 million tons. It thus enters the state of behavior called “buy later, buy cheap”, i.e., the later you buy the goods, the cheaper they will be.
POST SCRIPTUM: The first cuts have already been made to rapeseed. Combine in chains in Bărăgan (Romania) were seen in tests.
CAUSES AND EFFECTS
Euronext price corrections are granted in the global market, which is constantly governed by supply and demand. This is and will remain essential.
Identically, rapeseed has a route – processing in the first stage, and then it goes into wait to make way for sunflower seeds. Further processing is taking place again in December, so the potential will then be exercised.
REGIONAL AND GLOBAL STATUS
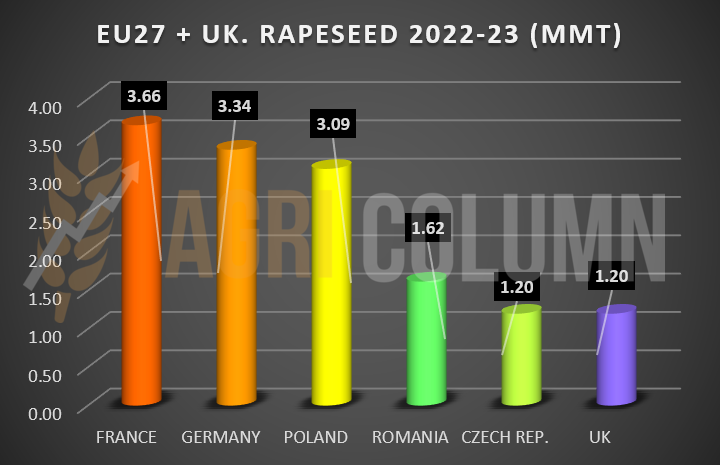
The European Union will generate a crop of 18.4 million tons. The increase in volume was 700,000 tons, which impacted the price of rapeseed. Compared to last year, it is more than 1.2 million tons, which says a lot.
UKRAINE generated a volume of 2.85 million tons. Despite the increase in area, the effects of the war are seen in productivity per hectare.
RUSSIA generates a volume of 2.8 million tons, similar to last year.
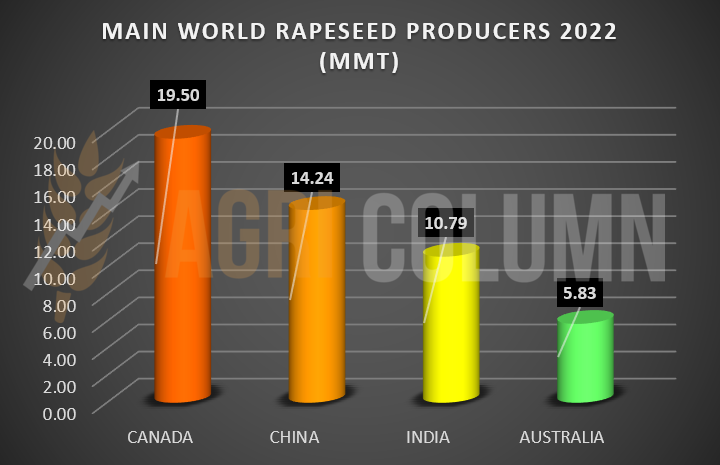
CANADA looks extremely promising, with a volume forecast of 19.5 million tons, but expectations are much higher after the rains received. Last year they had a total disaster of only 12 million tons harvested.
AUSTRALIA is surpassing itself. It is, once again, the effect of the rains. The indicated volume level is 5.85 million tons. It is true that the level is lower than last year, but compared to 2019-2020, when they harvested only 2.3 million tons and 2020-2021, when they had a volume of 4.5 million tons, we can say it’s a step forward.
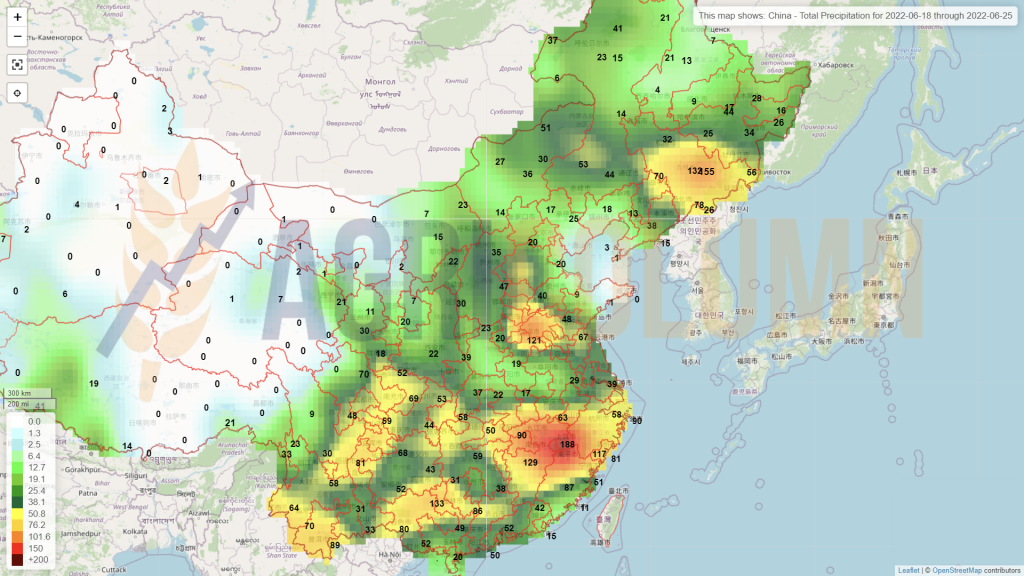
CHINA has a volume of 14.25 million tons, higher than last season, due to the increase of the area destined for rapeseed. But it is not origin, that is, it does not export.
INDIA forecasts 10.8 million tons, up from 8.5 million tons last season. However, as in the case of China, this increase is due to the increase in area. Also, India is not an origin, so it does not export.
EU-27 + UK 2022 rapeseed volume forecast
RAPESEED 2022 – MAIN PRODUCERS AND VOLUMES (MILLION TONS)
EURONEXT is closing higher, but ICE Canola has posted declines, so we expect a drop in opening fueled by the decline in the price of crude oil by more than 6 USD/barrel.
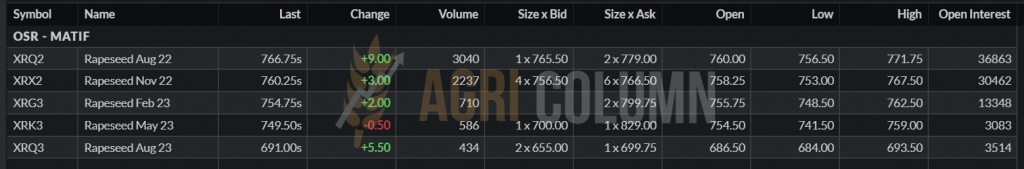
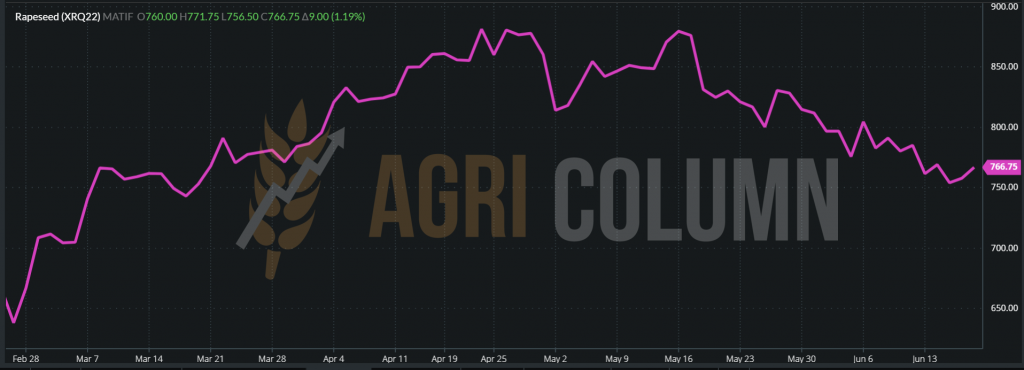
EURONEXT XRQ22 AUG22 – 766.75 EUR (+9 EUR)
RAPESEED TREND GRAPHIC – XRQ22 AUG22
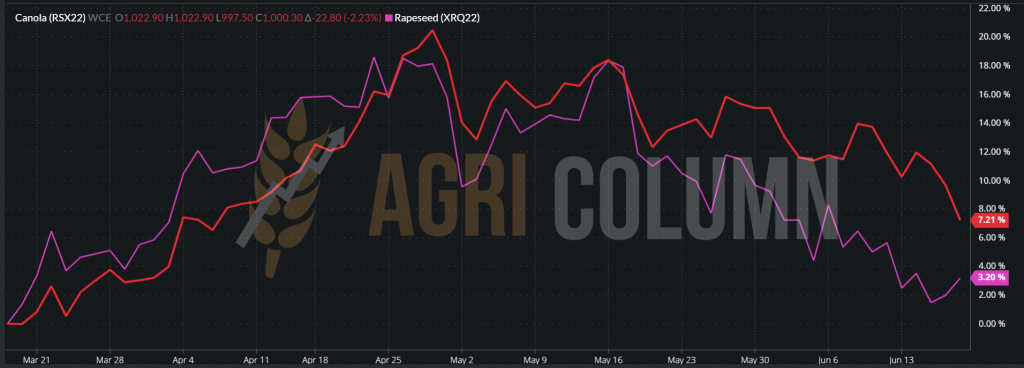
ICE CANOLA RSX22 NOV22 – 1,000 CAD (-22.8 CAD)
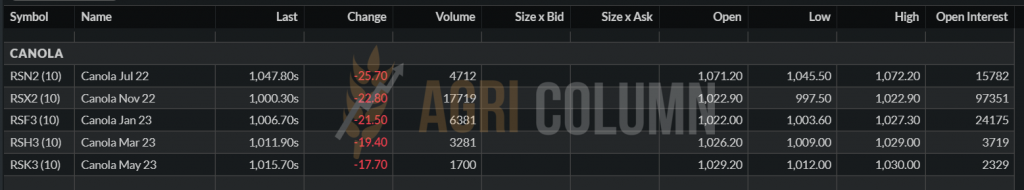
COMPARISON – RAPESEED (XRQ22 AUG22) VS. CANOLA (RSX22 NOV22)
CAUSES AND EFFECTS
The volume of rapeseed per aggregate for Europe, Canada and Australia is at a very high level.
India and China, even if they do not export, will import less due to good domestic crop forecasts.
We were adding everything under the political factors, namely Germany’s intention to eliminate rapeseed oil from biodiesel.
And as a result, the rapeseed’s growth potential has stopped. There are enough volumes at origins level and good volumes in destinations, plus an intention to reduce industrial consumption.
Everything is collateral impacted by the VEGOIL complex:
- Indonesia resumes export of palm oil to regain market share,
- Sunflower volumes can be seen very well in the European Union
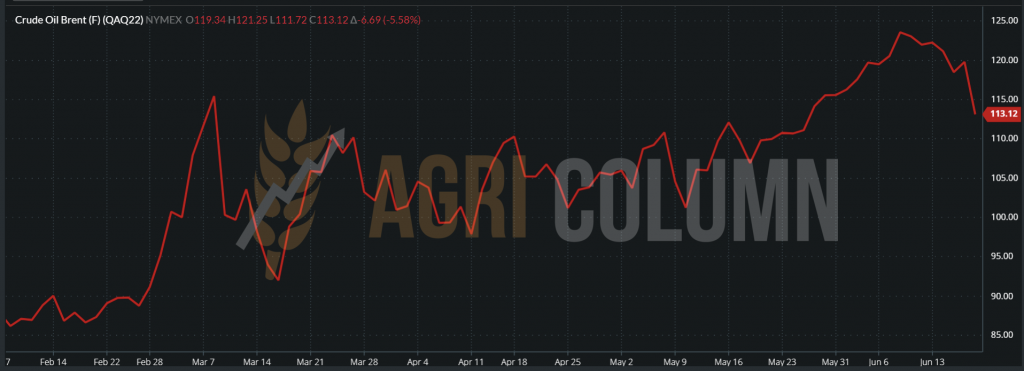
And finally, there is the correlation with oil, which fell to the level of 113 USD/barrel, in the BRENT AUG22 indication.
Thus, the rapeseed stops its fulminating course and will enter a cadence of demand. It will have demand periods, it will have peak periods, but with all the factors listed above, we do not see a potential of over 800 EUR/MT in the next period. There is no element of growth. It will weigh between 760-780 EUR/MT.

LOCAL STATUS
Indications for the new sunflower seed crop are declining. We see a maximum of 645 USD/MT offered in the domestic market, as well as in the CPT Constanța parity. It is a sign of a good offer in terms of the forecasted volume of goods for Romania. The bonus indications for sunflower seeds with high oleic acid content are maintained at a level of 35-40 USD/MT. Of course, the main criterion of at least 82% oleic acid content must be met, but the recognized hybrids do not give emotions and this parameter will certainly be met.
The precipitations gave a relief to the Romanian farmers. They see how the water supply has practically generated a certainty for the sunflower seed crop. The trust thus established, our sale recommendation is clear. The good forecast will generate the entry of buyers in the behavior “I do not buy the first 20,000 expensive tons; I wait to buy the next 20,000 cheap tons”. It is a standard way of acting in the market. Each party wants to keep a profit and, if both parties are in the right position, the end consumer is at an advantage.
The competition on the retail market is fierce and the Romanian processors know this. They are very well calibrated by brand and quality, basic elements that increase the confidence of the final consumer. Why do we lean on this? For the simple reason that the quality parameter is respected by processors. And we are talking about a product traceability that eliminates the potential for contamination with goods that exceed the limits of use of pesticides and other crop protection products. The technical and quality norms that Romanian processors practice are at very high standards and we recognize these things. Practically, health is at the forefront and no batch of oil goes to bottling until it is stored in very large batches of 2,000-4,000 tons and the final test called “positive release” is performed. In other words, oil samples are sent to accredited laboratories in the European Union for final certification.
CAUSES AND EFFECTS
The forecasted volume of goods decreases the price of goods. In this context, farmers need to secure their parcels of goods, they need to capture areas of interest in terms of price level.
The harvest pressure will also bring down the price level and it should come as no surprise that we will see sunflower seeds falling even more, maybe by 30-40 USD/MT.
Logistics (transport) will have a huge impact on the price. Being a very light commodity compared to cereals, the volume is large compared to the weight. Therefore, the logistics costs will push the price to the origin of the Farm.
Also, in logistics we will see an additional pressure that will be consolidated in the high price of transport. This additional pressure is and will be generated by the lack of availability of means of transport.
REGIONAL + GLOBAL STATUS
The European Union is still set at 10.9 million tons of projected volume.
UKRAINE has finished sowing sunflower seeds and we have a final area of 4.7 million hectares. This area will generate 9.5-9.7 million tons of seeds, with a productivity of 2.07 tons/hectare. It is a strong contrast to last season, when Ukraine generated a production of 17.5 million tons of seeds on an area of 7.1 million hectares, with a yield of 2.46 tons/ha.
RUSSIA is declining in production due to reduced sown areas. It sowed only 8.7 million hectares and, with a yield of 1.67 tons/ha, we reach a volume of 14.5 million tons, down 1 million tons compared to last season, when it generated 15.57 million tons, from an area of 9.6 million hectares.
CAUSES AND EFFECTS
The decrease in the price level of crude sunflower oil is due to the decrease in the price level of palm oil in the VEGOIL complex.
The generous volumes of the next soybean production also led to decreases in the VEGOIL complex.
The volume generated by the European Union determines a relaxation of the price level and it is not excluded to see future decreases, generated by logistics and abundance.
Ukraine and its transfer of raw materials to the EU are lowering the price. Freight and oil flows are eroding prices, in turn. The price indications for crude sunflower oil, according to Platts, for the OND stripe (Oct-Nov-Dec) are around 1,540 USD/MT. This financial estimate is made for the Black Sea basin and merges Ukraine, Russia, Romania and Bulgaria.
Russia, through its export tax on crude oil, still maintains a high price level due to its effect on Ukraine. Southern Ukraine and the restriction of the use of Black Sea ports have an effect on the exchange of ownership of goods. Russia will seize some of its Ukrainian goods and sell them to the already created aisles. One of them is practically the largest: India. This country imports a level of 2 million tons of crude sunflower oil annually.
Missing genetics from Russia and partly from Ukraine will affect the production of sunflower seeds and other commodities next year.
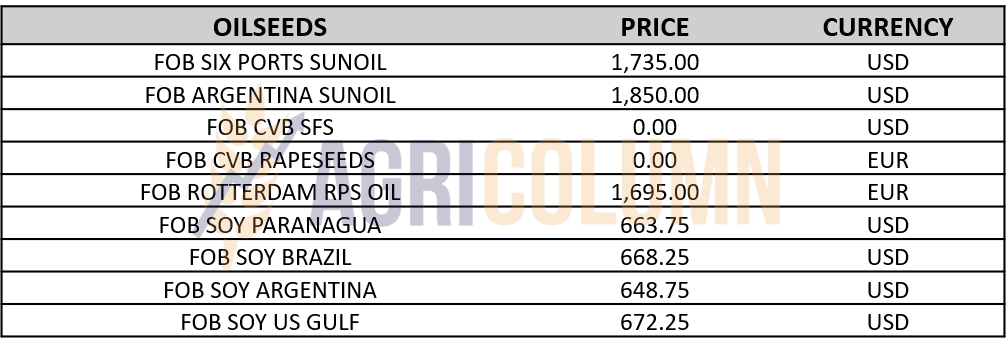
CSFO AND OILSEEDS INDICATIONS IN MAIN ORIGINS

LOCAL STATUS
The price indications of the new soybean crop remain in the area of 630-640 USD/MT. However, it is premature to talk about a formed market, but the development of crops in the field has started. The rains helped the start and now the soybean crop has a path eased by these rainfalls.
CAUSES AND EFFECTS
Expenditure on irrigating soybean fields will be added to the cost per hectare. The heat will arrive immediately and the plant needs water, only water.
The advantage of the crop in Romania is the fact that it benefits from a coupled support, which brings it a financial surplus, in case of sale to a local processor. The disadvantage of selling to a local processor is given by the reception standard, which states a maximum broken kernels level of 6%.
In the case of a buyer who will ship these goods within the Community or to a non-EU market, this parameter changes. He accepts the goods with a maximum of 15% broken kernels. And if we convert from the price of 640 USD/MT to a 1:1 penalty system, we notice that, if the goods have, say 15% broken kernels (for various reasons, poorly adjusted combines, faulty and multiple handling of grains, etc.), the farmer in question loses 57.6 USD/MT.
Romanian soybeans also have the advantage of being non-GMO and this facilitates their access to other niche markets in Western Europe, such as ingredients in finished products for human consumption, products for newborns and others.
The disadvantage is that it will always be compared in terms of replacement, i.e., the costs of freight and transport from South American or North American origins to the processing units are reversed and thus the price is fixed.
Soybeans themselves are not priced by soybean oil, but by meal. In other words, the primary product is meal, and oil (18% content) is a by-product.
GLOBAL STATUS
US indicates very good figures through NOPA (National Oliseeds Processors Association) for the old soybean crop, with a higher processing rate YOY with reference to May + 4.6%, and in terms of volume, 171 million bushels, i.e., 4.65 million tons, in total.
The sowing also ended in the USA, and the production forecasts are 126 million tons, 6 million tons higher than last season. This is due to the increase in soybean area to the detriment of maize, which had high costs with fertilizers. Thus, the USA increased the soybean area by 1.5 million hectares, from 35 million ha to 36.5 million ha.
BRAZIL will generate a very high production of soybeans, of 149 million tons, compared to 126 million tons in the previous season. The area allocated to soybean cultivation reached 42 million hectares, increasing by 1 million hectares compared to last season.
ARGENTINA will also generate a very large production of soybeans. The volume forecast reaches 51 million tons, compared to 43.4 million tons in the previous season. The area allocated to soybean cultivation is increasing by 1 million hectares, to the level of 17 million hectares.
PARAGUAY will generate a volume of 10 million tons after the disaster of the previous season, when they harvested only 4.2 million tons. The area increased marginally by only 150,000 hectares, to the level of 3.45 million hectares.
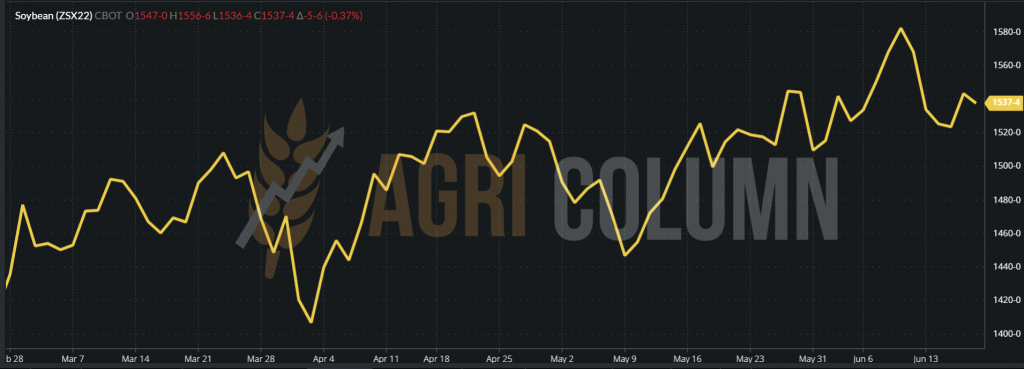
CBOT ZSX22 NOV22 vs. ZSN22 JUL22 | 1,537 c/bu vs. 1,702 c/bu (-165 c/bu = -60 USD)
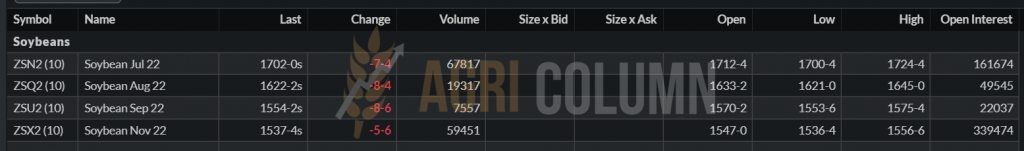
SOYBEAN TREND GRAPHIC – ZSX22 DEC22
CAUSES AND EFFECTS
- USA + 6 million tons
- BRAZIL +23 million tons
- ARGENTINA +7.6 million tons
- PARAGUAY +5.8 million tons
TOTAL = +42.4 million tons
The surplus commodity will generate a much lower price for soybeans than the peaks we are used to. The difference of 160 c/bu (-60 USD) displayed by CBOT between the old and the new crop clearly indicates the decreasing trend.


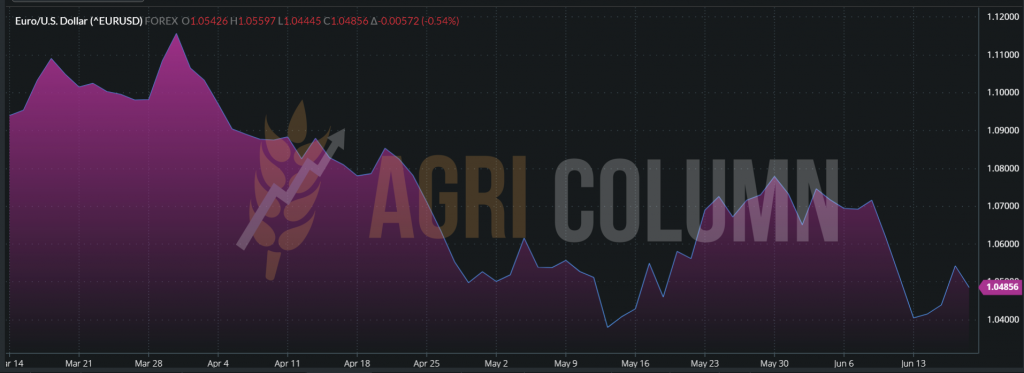
PARITY EURO/USD TREND GRAPHIC

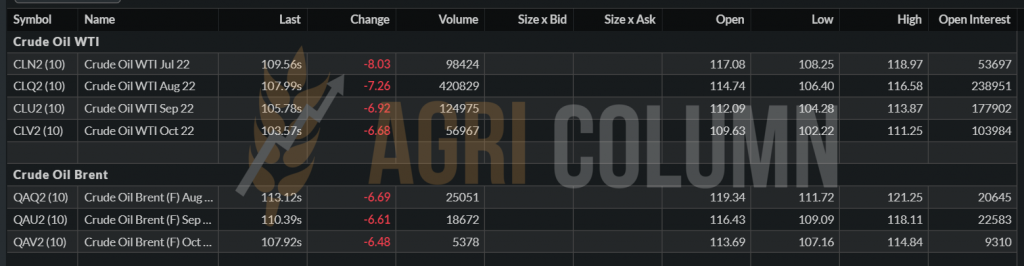
FOSSIL ENERGY TREND GRAPH – BRENT QAQ22 AUG22

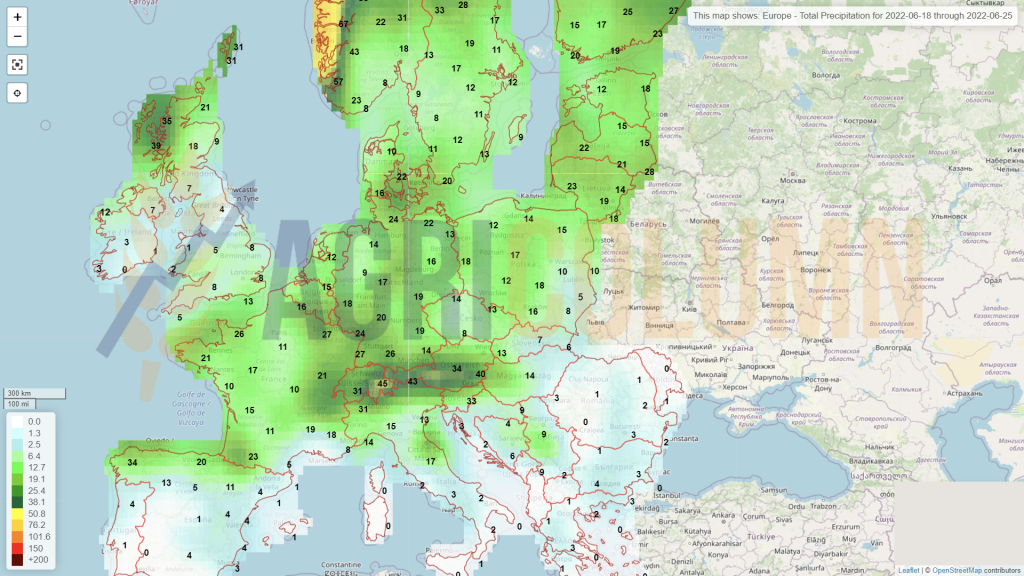
18-25 June 2022
Romania
Europe
Ukraine
Russia
Canada
USA
Brazil
Argentina
China
Australia