This week’s market report provides information on:
LA NIÑA – STATUS AND EVOLUTION
La Niña is in a phase of weakening towards neutral, but in March-May a revitalization is forecast.
La Niña is likely to continue in the spring of the Northern Hemisphere (77% chance in March-May 2022) and then move to neutral ENSO (56% chance in May-July 2022).
Below average sea surface temperatures (SST) weakened in January 2022, although the anomalies remained negative in most of the central-eastern and eastern equatorial Pacific Ocean. ENSO indices remained between -0.5 ° C and -1.0 ° C in the last week, except for the Niño-4 index, which was -0.2 ° C.
In contrast, underground temperatures (on average between 180 ° -100 ° V and 0-300m depth) tended to approach average during the month. This large change in recent weeks has reflected the progression eastward of a small number of degrees Kelvin downwards, as indicated by the rise in above-average ground temperatures in much of the Pacific.
Below average ground temperatures were limited in the eastern Pacific Ocean at the end of the month. For the monthly average, low-level equatorial winds were close to average in much of the Pacific, while upper-west wind anomalies remained over the east-central Pacific Ocean. Convection below average strengthened near and west of the date line, while convection was close to average over Indonesia. Overall, the ocean-atmosphere coupled system reflected a weakening of La Niña.
The average IRI/CPC simulations for the Niño-3,4 SST index continue to predict a transition to ENSO neutral during the spring of the northern hemisphere. As the trade winds from the east have recently strengthened and are expected to continue in the short term, the consensus of forecasters favors those models that suggest a slower decline of La Niña in the spring.
However, ENSO-neutral is still expected to return by summer in the northern hemisphere, although the chance does not exceed 57% between June and August 2022, reflecting the uncertainty associated with the spring predictability barrier. In summary, La Niña is likely to continue in the spring of the Northern Hemisphere (77% chance in March-May 2022) and then move to neutral ENSO (56% chance in May-July).
La Niña is expected to affect temperature and rainfall in the United States in the coming months.

LOCALLY
Wheat potential continues to erode. The price offered in the port of Constanta did not exceed the value of 260 EUR/MT on Friday afternoon. For feed quality, it decreased by 11 EUR/MT. However, this decline was generated by the actions of investment funds, which made a very large profit- taking move after the WASDE report, although the report indicated a prospect of price increases. This is due to the less pleasant outlook for declining production in the Middle East, namely Syria and Iraq, which has damaged global production by 2.18 million tons to 776.42 million tons.
The increase in global consumption by 0.61 million tons also contributed to the appreciation of the indications due to a more intense use in Canada by about 1.7 million tons, but partially offset by China, which decreases it by 1 million tons. In the end, global wheat stocks fell by 1.74 million tons, which added all the ingredients for bullish behavior, i.e., growth. But, as we all noticed, the funds played aggressively in a very short time, and in a flash, they also extracted the profit.
What we are indicating, however, is a return of wheat indications. As of Monday, the funds are actively re-entering the market and we are measuring the appreciation of the stock market indications in green and the 2-digit figures in the CBOT, as well as the European ones, which reach the figure +4 (EUR).
The new wheat crop is quoted at the level of 235 EUR/MT for delivery to the port of Constanța, with a discount of 6 to 8 EUR/MT in the case of feed quality. However, as things stand in Romania at this time, we withdraw the recommendation of 2-3 weeks ago for the forward sale of 1-2 tons per hectare. The condition of wheat in Romania is not very good at the moment and we want no farmer to suffer because they will not be able to honor a contractual amount. 2020 had enough consequences so to not repeat it once again.
The signs of concern raised by farmers are clear indications that we are not moving towards something positive. The indication of a decrease of 1.4 million tons in the potential of 9.6 million tons of the 2022 crop currently has a side that can increase in a negative sense, of course, i.e., the loss is much higher.
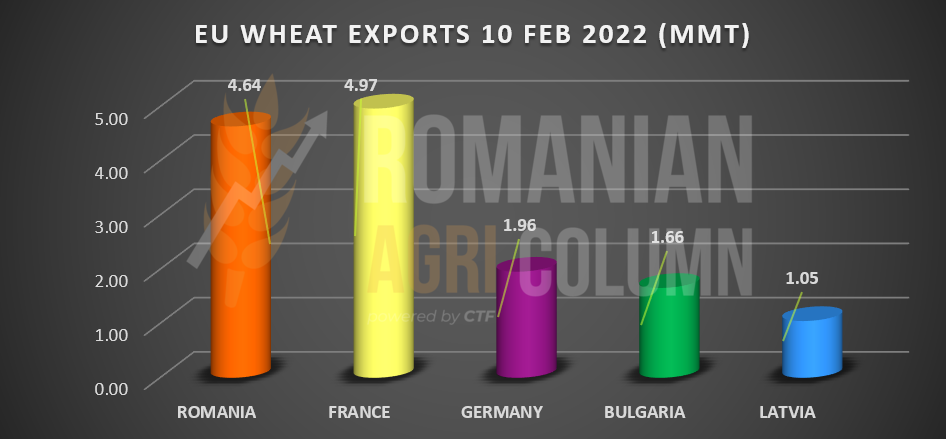
Romanian wheat has reached an export level of 4.64 million tons at this time, strictly referring to the 2021 crop. At European level, France leads with 4.97 million tons. Out of a total EU27 export of 16.92 million tons, France and Romania combined have a level of 9.61 million tons, i.e., a market share of 57% of the total EU27 export accumulated until February 10, 2022.
REGIONALLY
Russia has entered into a wheat supply agreement with China, and goods are already on their way to the Far East. With a sales rate of 30,000 tons per day, a new Silk Road is looming, a road linking Russia to China.
Russia announces the introduction of an export quota from February 15 to June 30, worth 8 million tons, distributed among the best performing exporters, taking as a reference the period between DEC2020 and NOV2021. This export quota will operate under the MOEX index (Moscow Stock Exchange). However, if this quota is exhausted, the export may continue with 50% of the value of the export duty at that time, but not less than 100 USD/MT.
How to interpret this new Russian message? Simple – another attempt to raise the price level in the Black Sea basin and, implicitly, of wheat globally. Will this approach be supported, taking into account the fact that Russia at the time of writing has an export level of about 24-25 million tons of the 2021 crop? The USDA maintains the level of Russian exports unchanged at 35 million tons.
Russia also blocked access to the Kerch Strait and the Sea of Azov for several hours under the pretext of military exercises. At the time of writing, access is free.
Ukraine is accelerating to transfer the remaining wheat for export and is superior to Russia in terms of selling price.
French feed wheat has a very good sales rate to China, due to the fact that the latter replace soybeans that no longer have the expected volume in South America with feed-specific wheat.
EURONEXT resonated identically with CBOT in the profit-taking operation carried out by the investment funds and we see an initial downward path followed by a return.
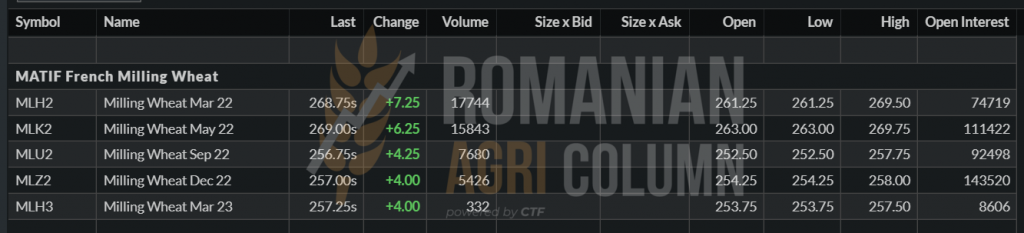
What is very interesting to note is the crop inverse between MLH22 and MLU22 SEP22. It adds up from the old crop to the new. The difference of 12 EUR is quite small and indicates the imminence of a growth point.
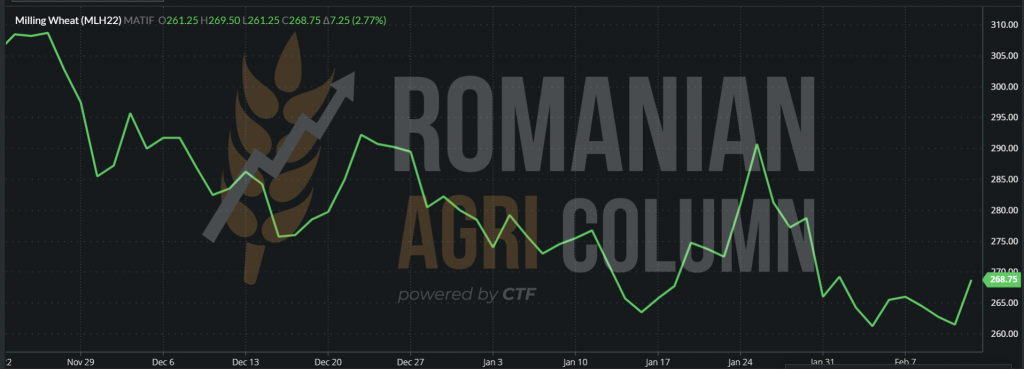
EURONEXT MLH22 MAR22 – 268.75 EUR (+7.25). Fear of imminent conflict or the effects of the WASDE report? See you in the next few days
EURONEXT TREND GRAPHIC – MLH22 MAR22
GLOBALLY
Trap everywhere. Wheat proved that it will follow whatever catches its attention, but it also proved that it has no resistance. It’s been a while since the wheat markets have reacted to developments in the Black Sea, but when the threats to shipping are mentioned, the market will move. The other issue with wheat is soybeans, as spring wheat will eventually need acreage, and at these prices relative to soybeans and corn, it shows that a lower level of acreage in the U.S. could easily be a possibility. In terms of weather, we notice that the humidity is constantly appearing in the forecasts for winter wheat areas in North America, but also North Africa and Eastern Europe need precipitation so the wheat equation is far from being solved.
This is a description of what is happening on the North American continent, more precisely in the USA. All indications are that there will be a decrease in the area that will be sown with wheat in the spring, as a result of the appetite for corn and soybeans and the lower yield of wheat per hectare in the USA.
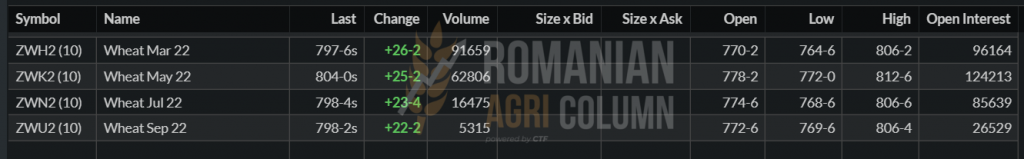
CBOT actually directed prices according to the WASDE report, extracting the profit in a flash formula, although the indications led to an increase in price. And then they re-entered the game with fervor, as February 18 is quite close and the liquidations in the area of the end of the MAR22 period are also very profitable.
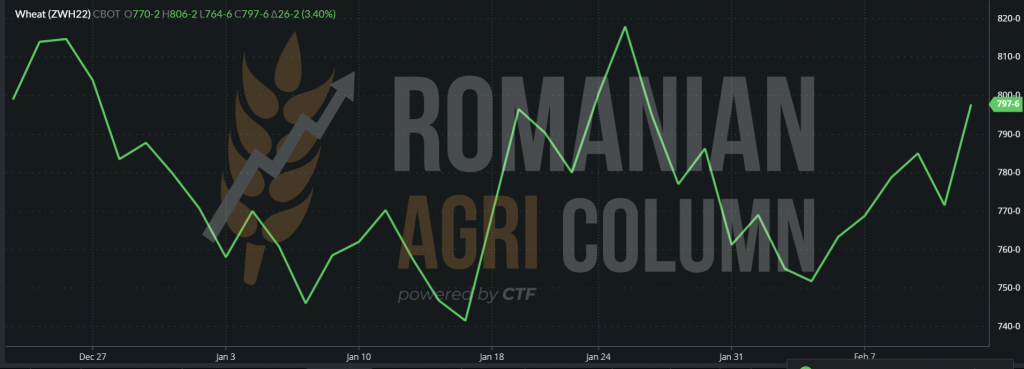
CBOT ZWH22 MAR22 – 797 c/bu (+ 26 c/bu = + 9.55 USD).
CBOT ZWH22 MAR22 TREND GRAPHIC. There is a vertical rise in the last trading session.
PRICE INDICATIONS IN VARIOUS ORIGINS

ANALYSIS
- The weather? Politics? WASDE report? 3 decision factors. Each taken separately brings a growing trend.
- The weather indicates developing problems over large areas of the US, Europe, North Africa and Romania, by default.
- The policy could lead to a sharp rise in prices due to the strangulation of the supply chain in the Black Sea basin.
- WASDE can extract destinations from hand-to-mouth behavior and return them to stock piling mode.
- All three aggregate factors indicate an undesirable scenario.

About barley we have only the indications of the port of Constanța, which offers 245 EUR/MT in the CPT parity, and the new crop is indicated at the level of 215 EUR/MT in the same parity, at least for the moment.
Globally, the WASDE report saw a drop in global production from 147.05 million tons in January to 145.79 million tons, down 1.26 million tons. Consumption also fell by 1.38 million tons, from 151.45 million tons in January to 150.07 million tons. It is a direct consequence of the decline in global production. Stocks were also down 0.42 million tons, from 17.09 million tons to 16.66 million tons.
Barley is therefore still attractive in terms of demand these days. The price difference of 15 EUR compared to milling wheat is due to the lack of liquidity at national level.

LOCALLY
The local corn market indicates a slight increase, up to the level of 249-250 EUR/MT in the CPT Constanța parity. Indications rose from 245 EUR/MT over the course of a few days due to the results of the WASDE report, which did not generate enough optimism in South America.
At the same time, in the Black Sea basin, there is an intensification of political tension, another factor that generates enough uncertainty, so we have a support of two factors, namely the weather and politics.
The new corn crop has primary indications of 208-210 EUR/MT, but the crop inverse is not encouraging at this time. EUR 40 is an inverse which, combined with the weather factor, does not push for a security of any amount through forward contracts at this time. The weather shows no signs of precipitation ahead of spring work, so the potential for new corn crop forward signing should be a more distant scenario.
REGIONALLY
Ukraine continues to do what it knows best, namely to export corn. There is some precipitation in this regard. The two factors combined, Weather and Politics, lead to increased sales and wider port operations. The weather has softened somewhat in the region and allows logistics to have a more sustained pace and Politics, at the level of rumors, indicates the imminence of the Russian attack.
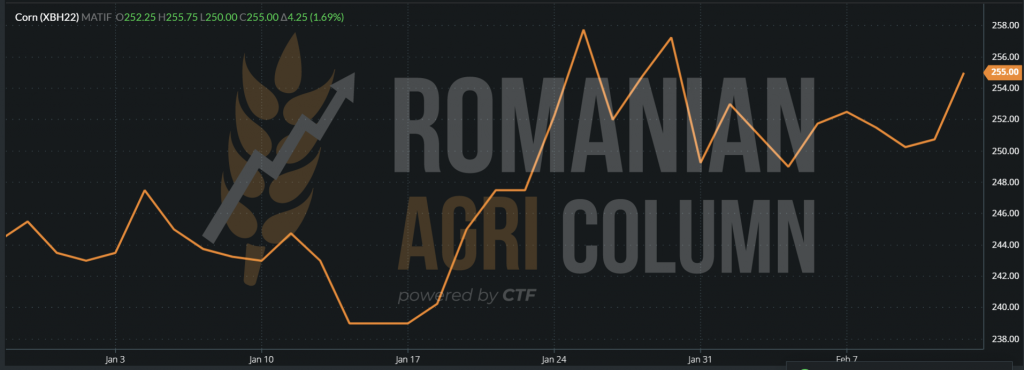
In the European stock market plan, we see the recovery of the indications. EURONEXT XBH22 MAR22 – 255 EUR (+4.25 EUR) at the close of 11 February 2022
Sell-off movement of investment funds immediately after the WASDE report generated a decrease, after which the return was made gradually, as we can see in the trend chart of XBH22.
MAR22 – the decrease from February 9 was caused by the sell-off of funds.
The estimate of the European corn crop indicates a decrease in production in 2022 by a minimum of 3 million tons. This comes from an estimate of a decrease in production potential, given the lack of rainfall. The areas where problems are already estimated are Romania and Bulgaria, southern France and Spain. Thus, from a potential of 67 million tons, the figures indicate 64 million tons. In future issues, we will return to the situation in each EU country.
GLOBALLY
A real scenario with repetition is happening in South America. We have crop cuts in Brazil, and Safra is first on the list. Brazil’s total crop potential has been reduced by 6 million tons, according to WASDE (access the latest WASDE report generated by Romanian Agri Column Friday). However, CONAB, the Brazilian agency does not agree on these figures. They are about 1 million tons lower. We admit that the difference is not big at the moment. But we could, if the weather helps, see a recovery in the production deficit through Safrina, the second Brazilian corn crop.
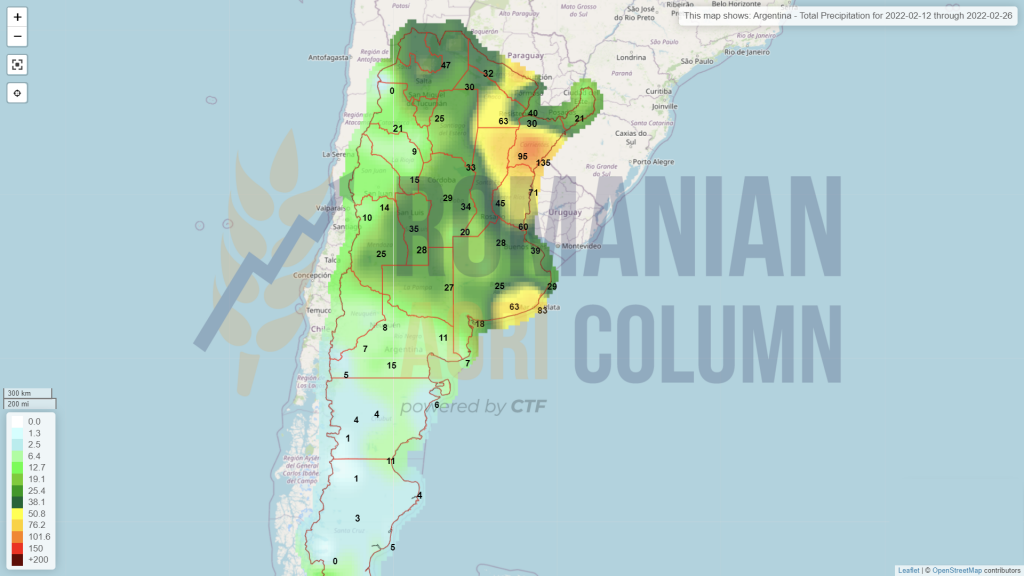
Argentina is in a similar scenario. The rains have not appeared and the forecast is dry for the whole month of February. Argentine maize is suffering and this costs BAGE an estimated 3 million tons, from 54 to 51 million tons forecast volume. However, WASDE did not consider any cuts in Argentina, indicating the USDA’s reluctance to provide complete information. Certainly, however, global traders have accessed and entered these figures in their books. We will see these cuts in the next report in March.
The figures indicated by WASDE created an emulation on CBOT, i.e., an increase in quotations generated by the results of the report, which indicated a decrease in overall production by 1.65 million tons, to the level of 1,205.35 million tons, but offset by a decrease in consumption by 0.95 million tons and, subsequently, a decrease in stocks by 0.85 million tons. Thus, the quotations went up for a short period of time, more precisely during the trading session, when EURONEXT was closed. Then, the next day, the funds reversed the trend through a profit-taking operation, lowering the quotations, due to these operations. However, on February 11, things started to return to normal, meaning that prices were rising, with traders aware of the development problems in Argentina, Brazil and Paraguay.
CBOT ZCH22 MAR22 – 651 c/bu (+9 c/bu = 3.54 USD)
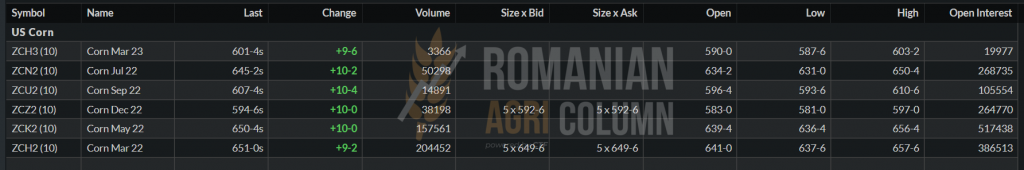
CBOT ZCH22 MAR22 GRAPHIC TREND. We notice on the right of the graph the decrease, then the ascent in the ramp.
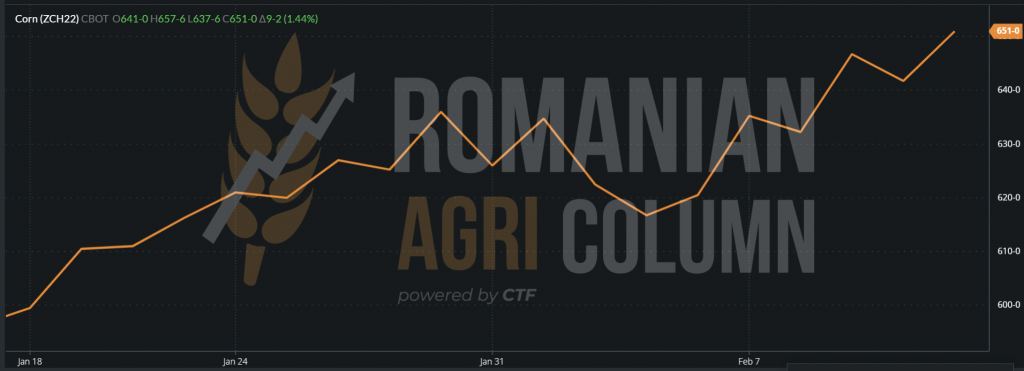
But things will not stop there. On February 18 and the following week, we will see other large profit taking and roll-over operations on the indication ZCK22 MAY22. From February 18, we will move our attention and watch ZCK22 MAY22, because ZCH22 MAR22 will expire.
PRICE INDICATIONS IN VARIOUS ORIGINS

ANALYSIS
- Corn has support in the Black Sea basin – weather and politics.
- Corn is catching support from the weather factor and from South America.
- The life cycle of the corn price is in progress and is fully supported at this time. Tensions in the basin, weaker South American crops, constant demand and human, feed and industrial use are the guarantee of progress in the future.

LOCALLY
The local rapeseed market indicates new crop values of 590 EUR/MT in the CPT Constanța parity, which, granted with the indication AUG22 XRQ22, means a negative premium of about 29 EUR/MT. Inland, a level of 575 EUR/MT is offered for FCA Farms, which reflects a level of minus 45 EUR/MT compared to the EURONEXT indication we see displayed at the close of the trading session on 11 February.
What we see, however, is a much higher potential, granted with a negative premium level of maximum 5 EUR compared to AUG22 and maybe even equal or positive, due to the status of the rapeseed crop in Romania, from a vegetative point of view. Lack of water is a major problem already in Romania and absolutely nothing can be seen on the horizon during the whole period of February.
Moreover, the strong feeling of the early arrival of spring is greatly accentuated by the positive temperatures forecast for the next period. Not entering the vegetation would be the problem, but a late spring frost, which could compromise the local rapeseed crop in some regions.
Apart from the potential of the weather, we still see regional and global stocks at very low levels, leading to long-term support for the 2022 crop. The return and recovery of stocks is only possible over a period of at least 2 years of very good yields, which can cover current and accumulated demand in stocks.
REGIONALLY
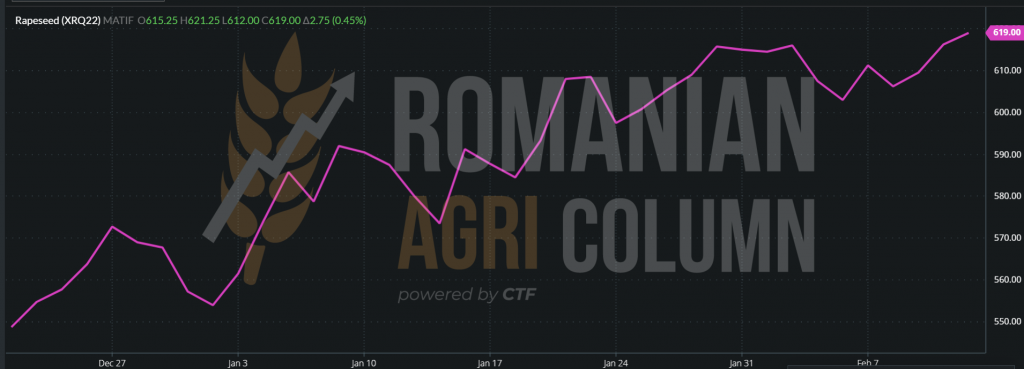
EURONEXT is closely linked to the Brent and WTI oil quotations and at the close of 11 February raised the AUG22 XRQ22 to 619 EUR.
EURONEXT XRQ22 AUG22 – 619 EUR
Will the 620 EUR barrier be exceeded? Surely. Will we see rapeseed at 630 EUR or above? Surely. Time will tell. Even if the rapeseed in Ukraine promises a production level of 3 tons/hectare this season, there are only a maximum of 3 million tons. The EU has 17 million tons and drought problems will bite off the officially estimated potential.
EURONEXT XRQ22 AUG22 TREND GRAPHIC
GLOBALLY
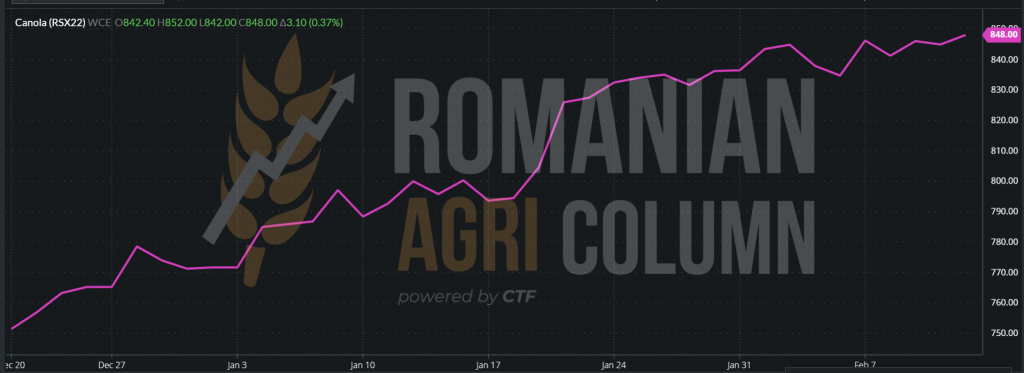
Canada will begin sowing rapeseed in April. At the moment, they are out of season. Australia is also out of season. The CANOLA Stock Exchange indicates an increase for the new crop, as follows: NOV22 RSX22 – 847.9 CAD (+3 CAD).
RSX22 NOV22 CANOLA 848 CAD + 3 CAD
ANALYSIS
- Rapeseed has a much higher potential than these days. The crop inverse decreases from the old crop to the new crop. Today we have a level of 72 EUR.
- Purchasing guidelines need to be correlated a little better with EURONEXT AUG22 to increase attractiveness. However, we usually recommend signing to the fastener to capture the future potential.
- Canada has been and will remain the focal point of rapeseed/canola production in 2022 as well.

LOCALLY
The local indications in the port of Constanța in the CPT parity are at the level of 670-680 USD/MT. Inland, prices range from 660-670 USD/MT in FCA parity. At the moment, we have a level that has lasted for about 2-3 weeks. But it is precisely this period of stagnation that raises the question, namely whether the price will continue to rise.
Related to the RON/USD exchange rate, we are at a fairly high RON equivalent. Last year the price indications were really high, but the RON/USD exchange rate also had a different ratio. Thus, today we had a BNR exchange rate of RON 4.3392 for 1 USD, and on February 11, 2021 we had an exchange rate of RON 4.0194 for 1 USD.
Reporting last year’s level of sunflower seeds in the CPT Constanța parity as an average price of 700 USD/MT, we have the following RESULT compared to the current level of 680 USD/MT in the same parity. Please note that in CIF Marmara we have a price of 725-728 USD/MT.
- 11 FEB 2021: 700 USD * 4.0194 = 2,813.58 RON
- 11 FEB 2022: 680 USD * 4.3392 = 2,950.00 RON
What we want to express here is just the fact that, simply referring to the national currency RON, the price is much higher today compared to February 11, 2021.
The new crop is quoted at the level of 570 USD/MT, with a inverse of 100-110 USD/MT. At the same time, the indications in Hungary are quoted at a level of 610-620 USD/MT for the new crop. They follow the same crop inverse of 100-110 USD/MT, the price of the 2021 crop being at the level of 710-715 USD/MT.
REGIONALLY
The price of sunflower oil in Ukraine (as a reference, Odessa) has an indication of 1,385-1,388 USD/MT, with an ASK set at 1,420 and a BID at 1,380 USD/MT. Buyers’ interest remains high, as the price of sunflower seeds has reached 700 USD/MT and above. In Russia, the price of seeds is at the level of 540 USD/MT, but let’s not forget the export tax of ½ from the value of one ton, but not less than 320 USD/MT, plus the export tax of crude oil of 260 USD/MT.
GLOBALLY
The indications in Rotterdam are quoted at the level of 1,450 USD/MT ASK vs 1,435 USD/MT BID for March 2022, with an increase of 10 USD/MT for April. At the level of processing volumes, there is a surplus of goods, according to some analysts of about 20% more than last year. Which is partially correct. And we are referring to last year’s shortage of raw materials, which caused oil production to fall below the current year’s level.
Argentina harvests sunflower seeds and is currently at a 38-40% harvest level. BAGE indications are 3.4 million tons, while the USDA generates a level of 3.1 million tons.
We come to the analysis of the price ratio between palm oil and sunflower oil, which is not positive, as usual, in favor of the latter. And we also talk about the condition of soybean oil in relation to complex partners, sunflower oil and palm oil.
CSFO is at a much lower price level than the other two components of the complex. Clearly, palm oil suffers from low production and the fact that the two major producers, Malaysia and Indonesia, are struggling with raw materials damaged by the rains caused by La Nina and the lack of labor in Pakistan, India. and Bangladesh, amid the Covid-19 pandemic. Indonesia even imposed a restriction on the level of exports, lowering it by 20%.
About soybean oil we have a clear indication of the lack of raw material generated by the cut production in Brazil, Paraguay and Argentina. But let’s not forget some very clear parameters in this whole report from the VEGOIL complex, namely:
- The primary product extracted from soybeans is not oil (18%), but meal. Thus, with the global production decreased this month by WASDE, we see a factor of compensation from China, which reduces its soybean imports by exactly the 8-9 million tons missing. Thus, processing for extraction of mail and soybean oil will decrease the use due to lack of processing, soybean oil being a substitute.
- Cultural specificity. Sunflower oil has a European specificity in the Black Sea region as well. The expected overproduction will thus generate enough goods for Europe and the countries around the Black Sea. Europe itself is reducing the use of palm oil due to deforestation. So there is an abundance, because mainly sunflower oil is used regionally. India alone generates an annual import of 2 million tons, which it replaces from Ukraine (which in turn has sufficient raw material production this year).
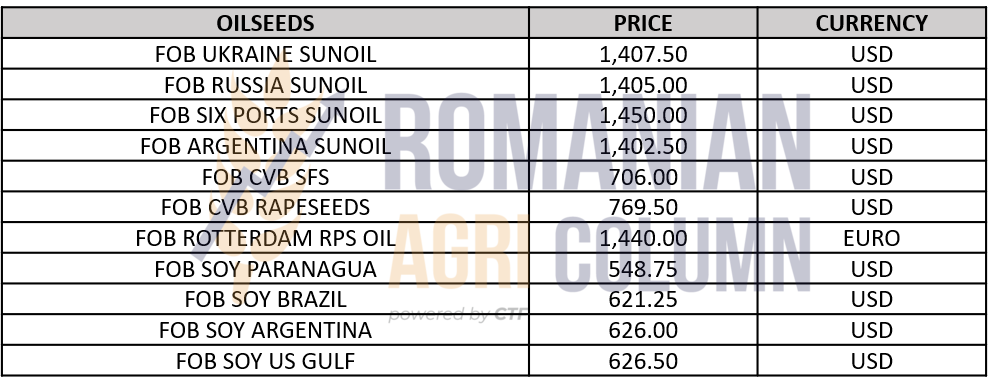
OILSEEDS INDICATIONS IN VARIOUS ORIGINS
ANALYSIS
- In other words, due to the cultural specifics of use, sunflower oil lags behind colleagues in the complex, although it was traditionally ahead of them in terms of price.
- The other two colleagues in the complex have different roles, that of soy substitute, that of palm for specific use in Asia.
- And, just as a conclusion, sunflower oil is not a substitute in the complex, and normal production this year penalizes its price.
- It does not need to be replaced, because it cannot be replaced regionally from a cultural point of view.

LOCALLY
We do not see significant changes locally in terms of stocks and prices for soybeans. They remain in the same range of 670 USD/MT, but when marketed for purposes other than inward processing, farmers can no longer access coupled support per hectare.
REGIONALLY + GLOBALLY
Here, things have a different turn, other ramifications. And we will start with the productions in South America, where, following the WASDE report, we see generated production losses of 5 million tons in Brazil, from 139 to 134 million tons. We have cuts in Paraguay from 11 million to 6.5 million tons, so 4.5 million tons. And, at the same time, an incipient production cut in Argentina of 1.5 million tons to the level of 45 million tons.
However, the local analysis houses do not have the same figures as the WASDE report. Thus, CONAB sees further in Brazil a decrease to the level of 125 million tons, successively passing through forecasts of 133, 130 million tons, to this very low level. Paraguay is down to 4.5 million tons, compared to what WASDE sees, a total of 6.5 million tons. Argentina is in a totally unfavorable scenario. The rains do not return for the whole month of February, and thus it is very close to the nightmare scenario of 2018.
The USDA certainly saw all this when it issued the February WASDE report. But, as usual, it delivers information little by little, month by month, to try to maintain a balanced market.
For the time being, the compensation comes from China, which reduces soybean imports for processing to 94 million tons, compared to the initially estimated 100-102 million tons.
In terms of the stock market, we witnessed a rally on the date of publication of the report, the soybeans easily passing the level of 1,600 c/bu, but the next day, the funds carried out the sell-off operation, reducing their positions by profit taking. It is a blitzkrieg, a profit-making move, although the physical market clearly shows a rather large production deficit compared to the initial forecast.
Such a scenario awaits us soon, more precisely starting with February 18, 2022, due to the approach of the expiration date of the indication MAR22 ZSH22. We will see the same sell-off or roll-over movements for the indication MAY22 ZSK22.
In the physical market, production-level tuning will be done gradually, so by the next USDA-generated WASDE report we will quantify the level of cuts and record the numbers generated by local analysts in South America.
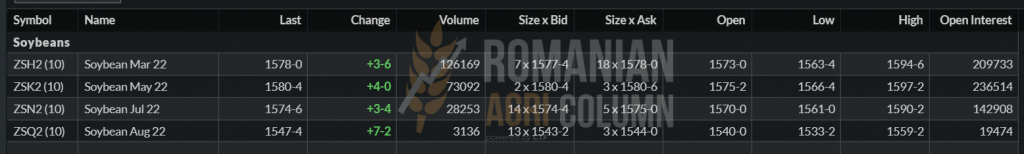
But let’s look at the CBOT stock quotes from February 11, 2022, as well as the usual chart, which will show us these episodes in the form of figures and graphs.
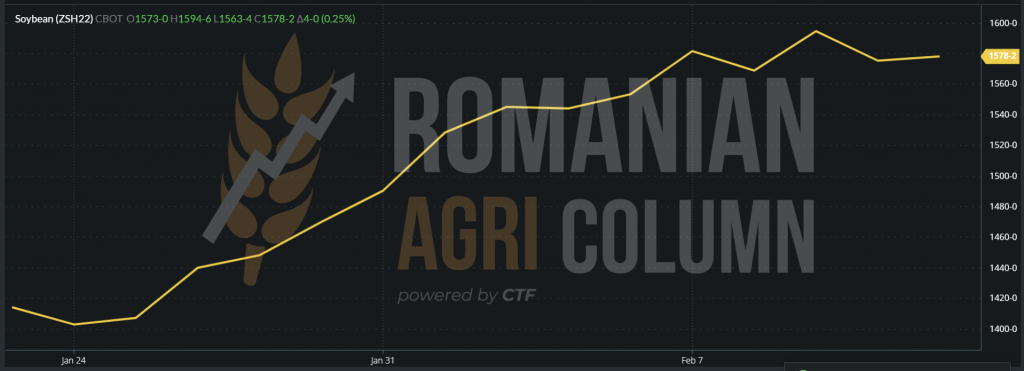
CBOT ZSH22 MAR22 – 1,578 c/bu
CBOT ZSH22 MAR22 – TREND GRAPHIC | Notice the rise and fall on the day of the report and the next day.
ANALYSIS
- The South American soybean crop is still suffering from drought, and successive production cuts indicate a much lower level than WASDE has indicated.
- The funds did what they know best to do, they speculated on the bullish moment generated by the report, extracting the profit the next day.
- The March report will clarify a lot, although from now on we have clear indications of much larger cuts. The compensation comes from lower processing usage in China.

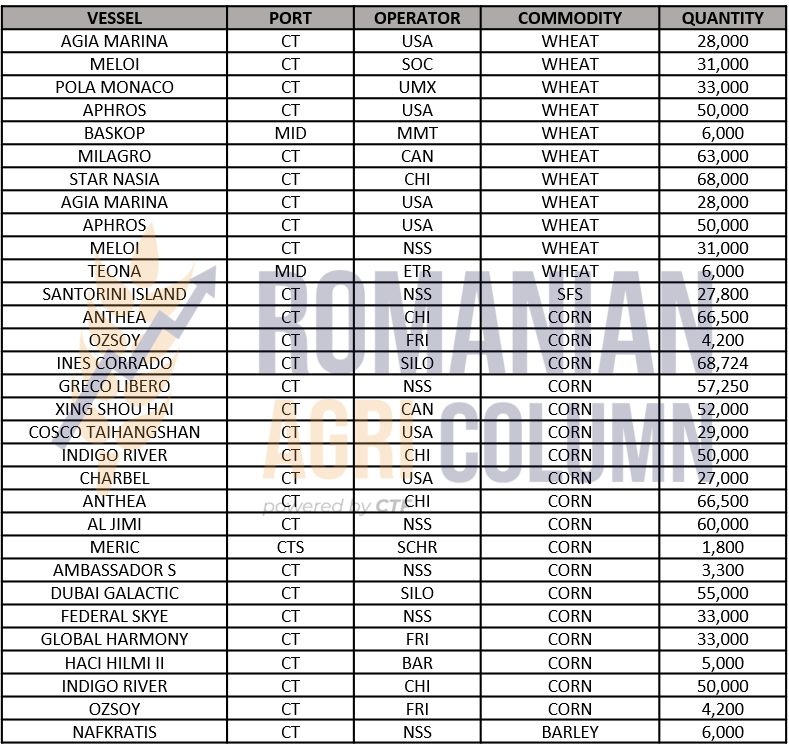
400,000 tons of wheat and 670,000 tons of corn


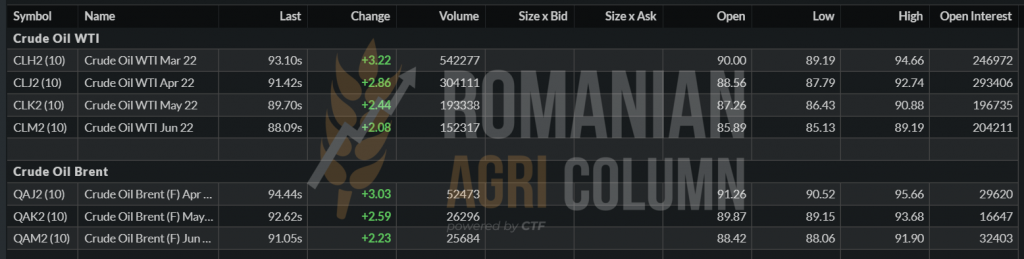
BRENT $ 94.44 | WTI $ 93.10
NEXT STOP – 100 USD/BARREL

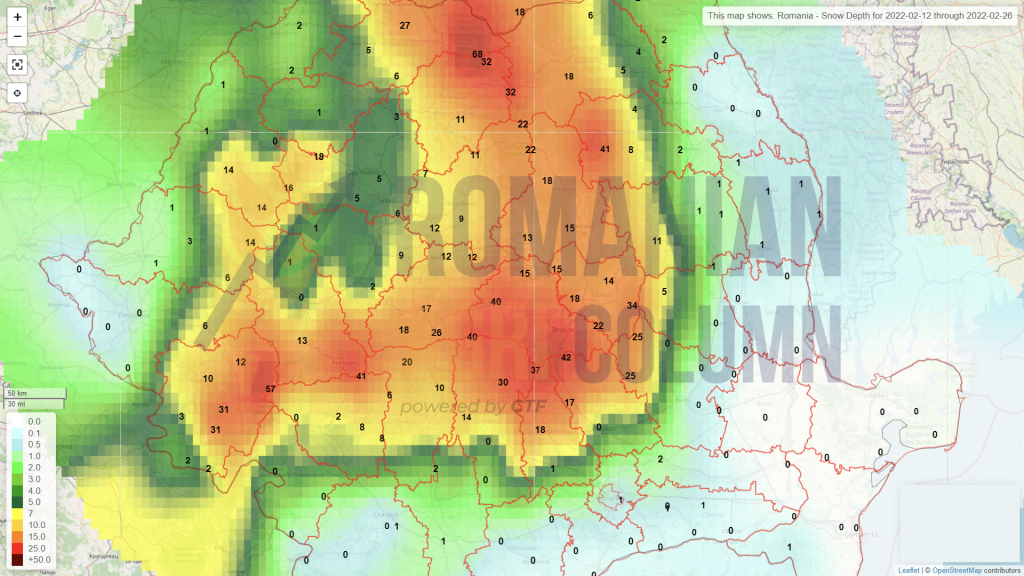
16-26 February 2022
Romania (snow)
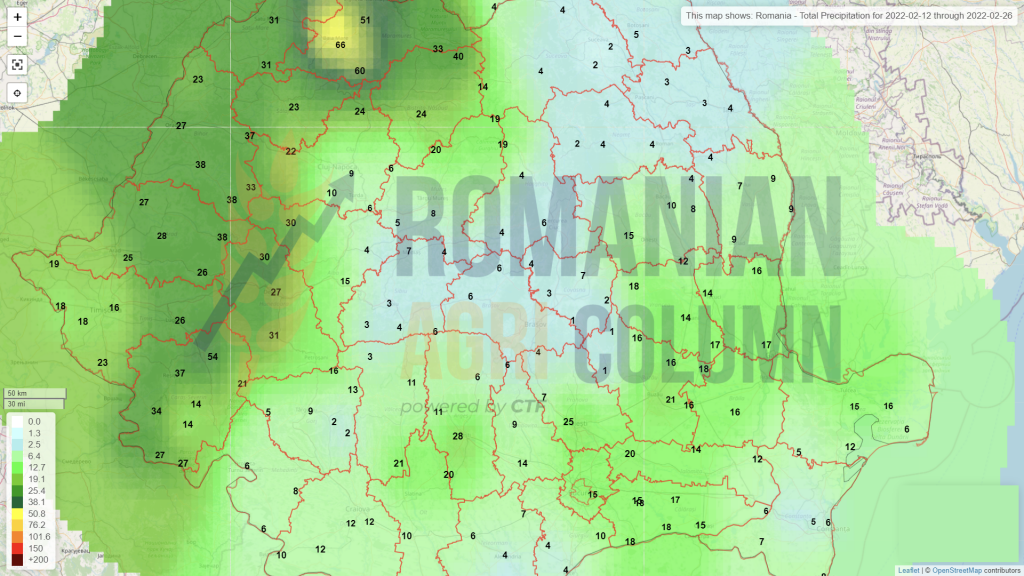
Romania (rain)
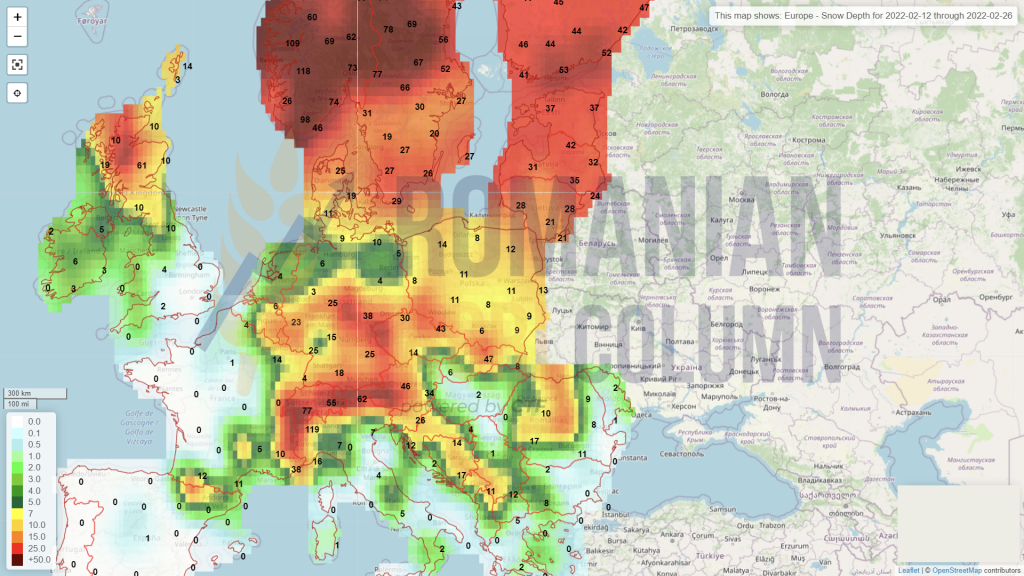
Europe (snow)
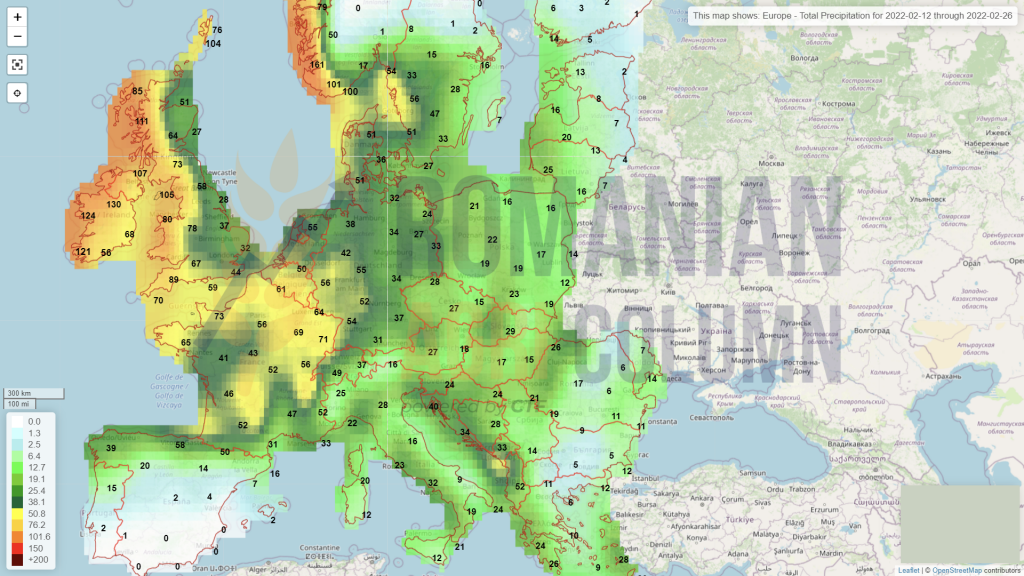
Europe (rain)
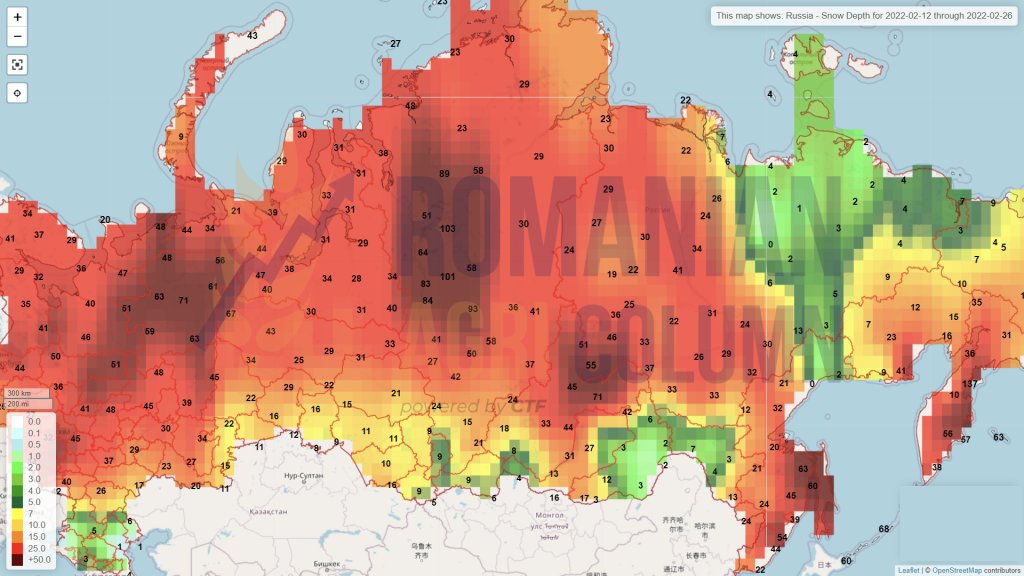
Russia (snow)
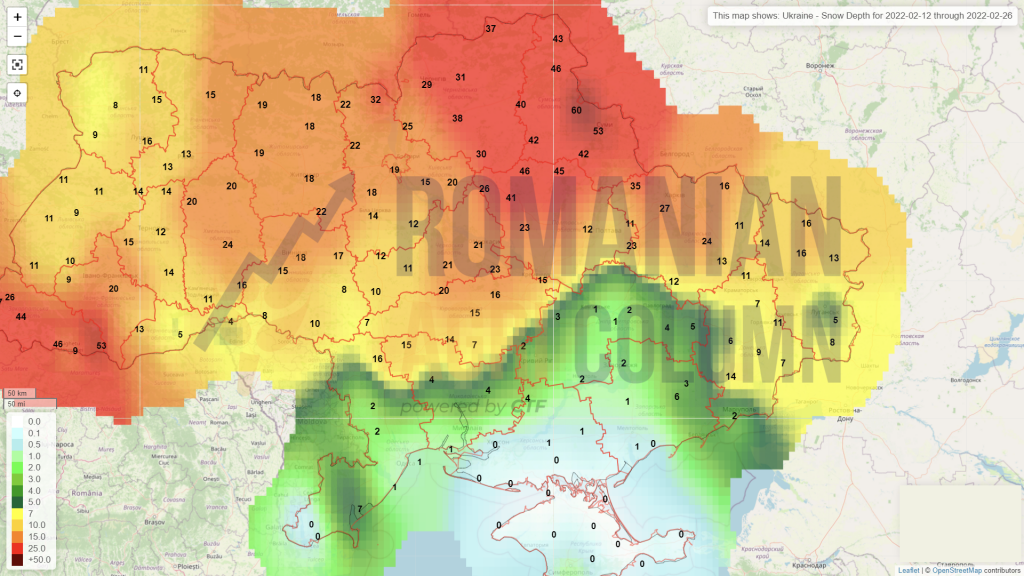
Ukraine (snow)
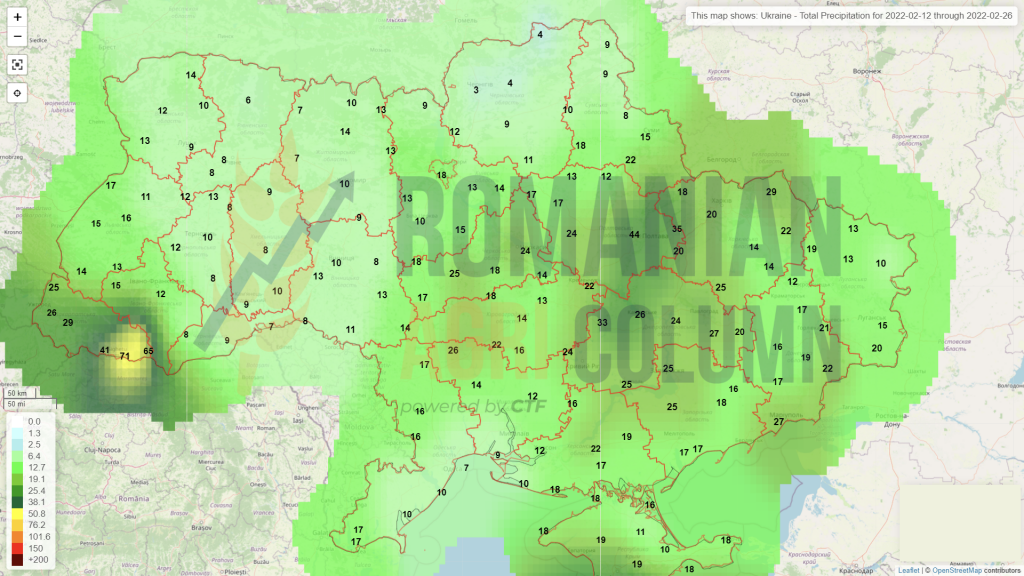
Ukraine (rain)
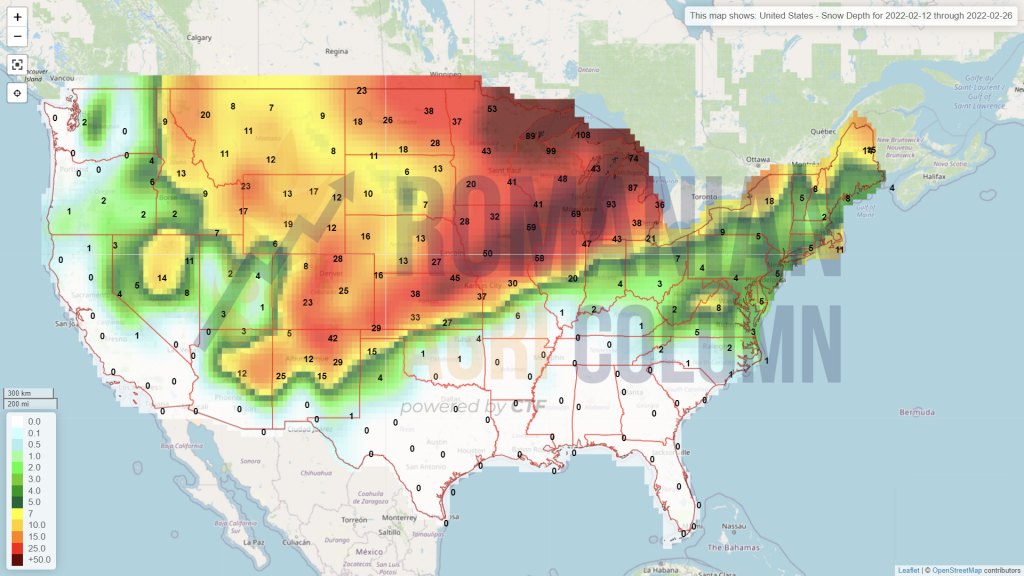
USA (snow)
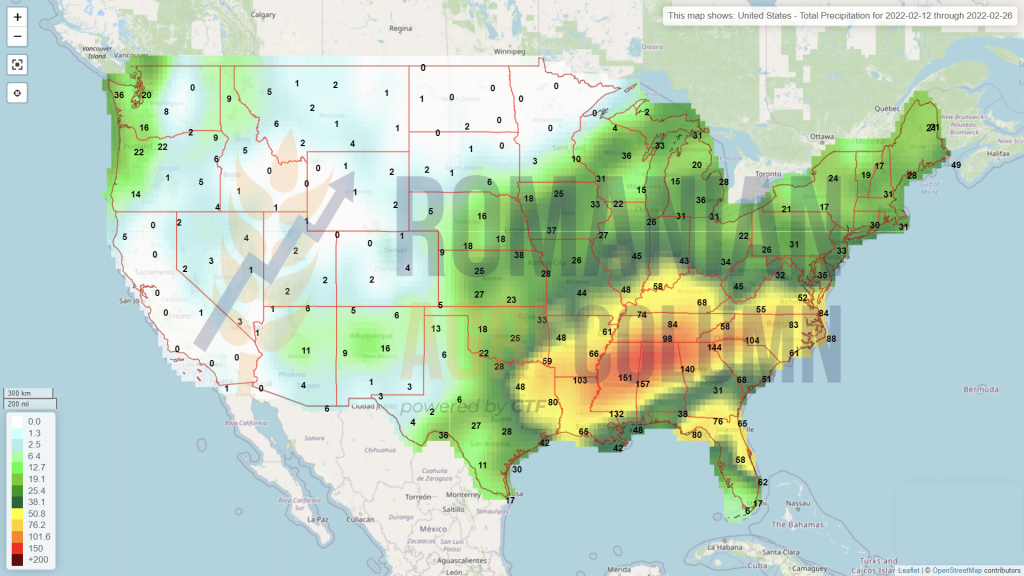
USA (ploi)
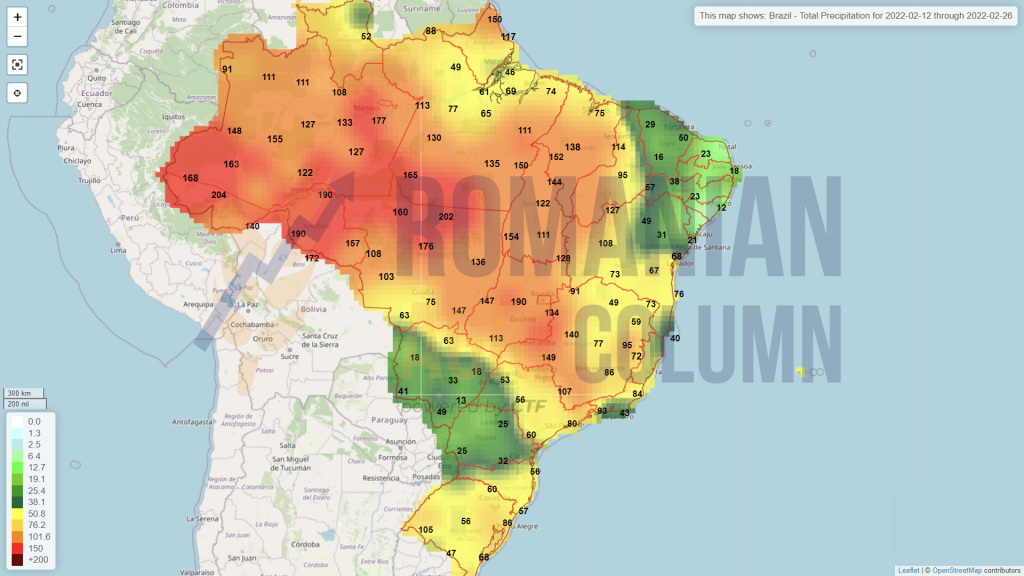
Brazil (rains)
Argentina (rains)