This week’s market report provides information on:
|

Wheat market
Wheat quotations in the port of Constanța remain firm, and demand is constant. The basic indications are at the level of 270-272 EUR/MT in the CPT parity. The lower class of feed has an indication reduced by 8-10 EUR/MT, depending on the buyer. In the country, buyers compete at levels of 252-262 EUR/MT FCA Farms. Lots are traded according to the needs of each farmer, between 200 and 2,000 tons.
Entering the plan of the sowing season in Romania, we note quite serious problems at the national level regarding wheat planting, which on November 3, 2021 was at the level of 1,665,000 hectares from the forecast of 2,150,000 hectares, i.e., at a degree of 77% achievement. The sowing window is still open until November 20, with the support of weather. The difference of 23% can be recovered, but it is not to be neglected in the context of the next season.
Last Monday, the price of wheat rose on Euronext at a steady pace, reaching values of 297 EUR/MT during the trading day. The increase was generated by a very large acquisition, of 1,268,000 tons by Saudi Arabia, in a single transaction. It was the largest volume traded in a single tender in the last three years.
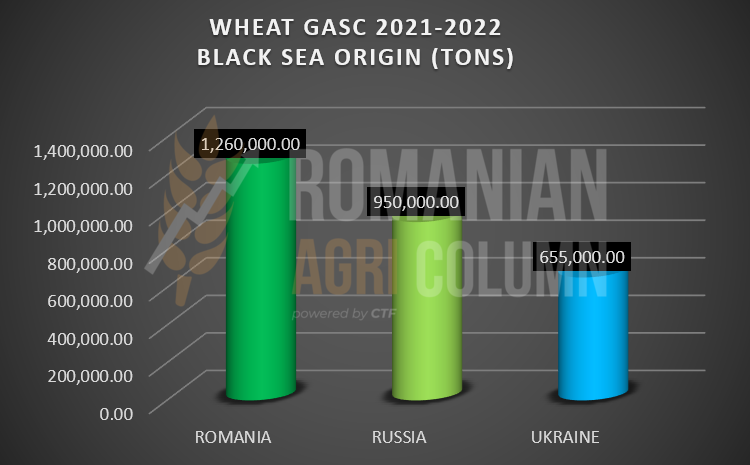
Aggregated with this volume, a new GASC Egypt tender arrived, less than a week after the previous one, which added another 180,000 tons to the volume purchased so far by GASC, i.e., 2,865,000 tons. The volume forecasts indicate a need for another million tons to be purchased by GASC Egypt by the end of the year. This is their pace of acquisition each season.
GASC ACQUISITION GRAPH 2021-2022
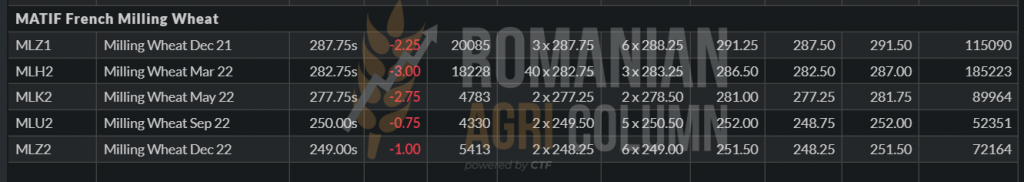
After the emotions generated by the acquisition of Saudi Arabia dissipated, a few days of return to 290 EUR on EURONEXT followed, but the investment funds made inevitable profit taking and thus the corrections brought the wheat back to 287-288 EUR/MT in the MLZ21 quotation of EURONEXT.
EURONEXT MLZ 21 – 287.75 EUR at the close of November 5, 2021
WHEAT PRICE GRAPH April 12 – November 5, 2021. The difference between the two dates is about 90 EUR.
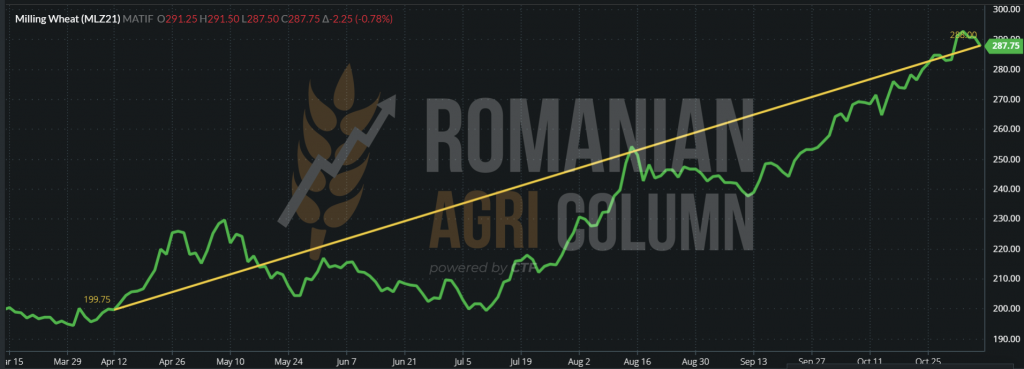
In light of the above, we already have clarifications of the rise, but also of the decline that followed on EURONEXT in the last week:
- The price rally in Euronext was triggered by the two auctions, which totalled 1,448,000 tons of wheat, and if we add the previous GASC auction (7 days difference), we reach the figure of 1,808,000 tons.
- We do not overlook the batch of 60,000 tons of wheat purchased by the Jordan at a level of 374 USD/MT CFR Aqaba.
- The average price level of the Saudi tender with January-April delivery was 377 USD/MT C&F, with optional origin: Black Sea, Europe, Australia, USA.
- The investment funds speculated with aplomb the moment of emotion generated by the volume of almost 2 million tons acquired in a very short time.
Black Sea Wheat also marked levels of 347 USD DEC 2021, but at this moment, the indications have retreated to the value of 343 USD, which reflects the granting with the other stock exchanges. However, if we transform 343 USD, at a parity of 1.156, we get a level of 296.7 EUR. This level will mark a benchmark in December, with physical market indications being 334 USD (289 EUR) FOB Russia and 332 USD (287.2 EUR) FOB CVB for milling wheat.
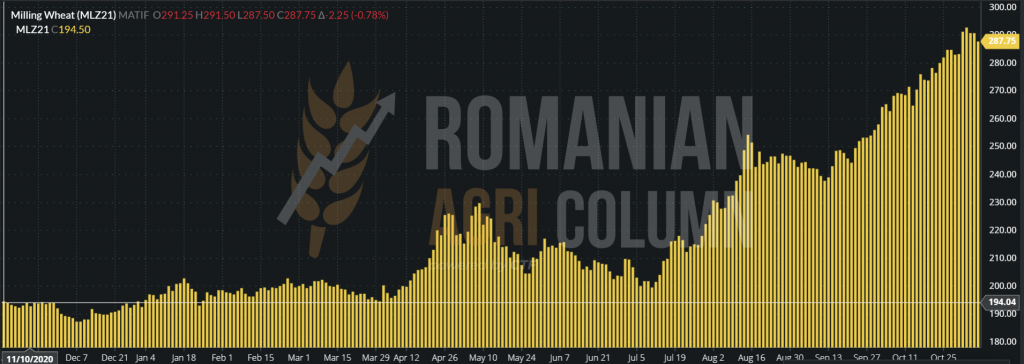
Let’s analyse together where we started a year ago and where we are in terms of prices and quotations at European level. It is a visual exercise to be able to generate what is seen in the next horizon. In the left corner, in yellow, we see the indication of 194.5 EUR for the date of November 10, 2020, and in the right corner we have a level of 288 EUR. We have a difference of 93.5 EUR/MT.
And now let’s go on our journey through the main areas of origin, to see what is the status of crops in general, because we have a lot of information on wheat:
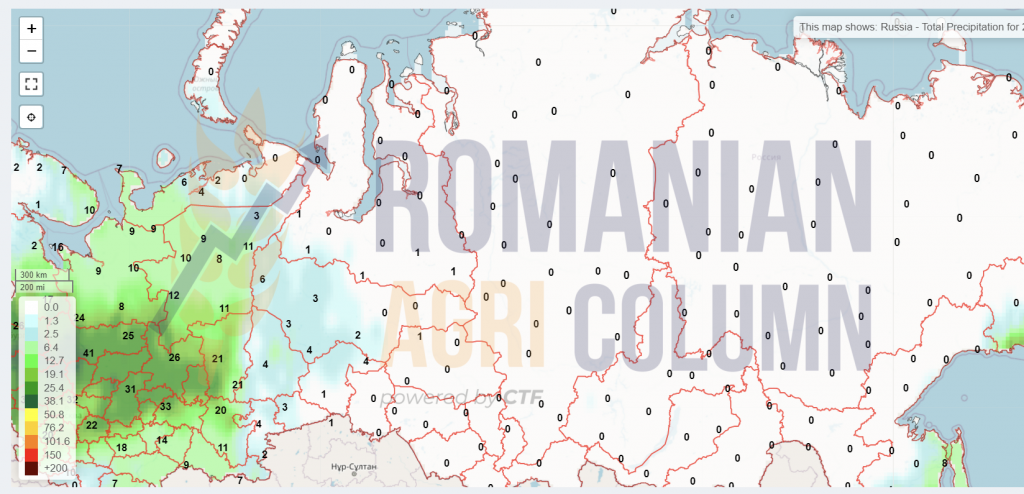
- RUSSIA indicates problems, despite the sufficiency it shows. The problems are due to the rainfall deficit, especially in the Volga area and due to the closure of the planting season, which generated a deficit of about 1 million hectares (can be recovered in spring).
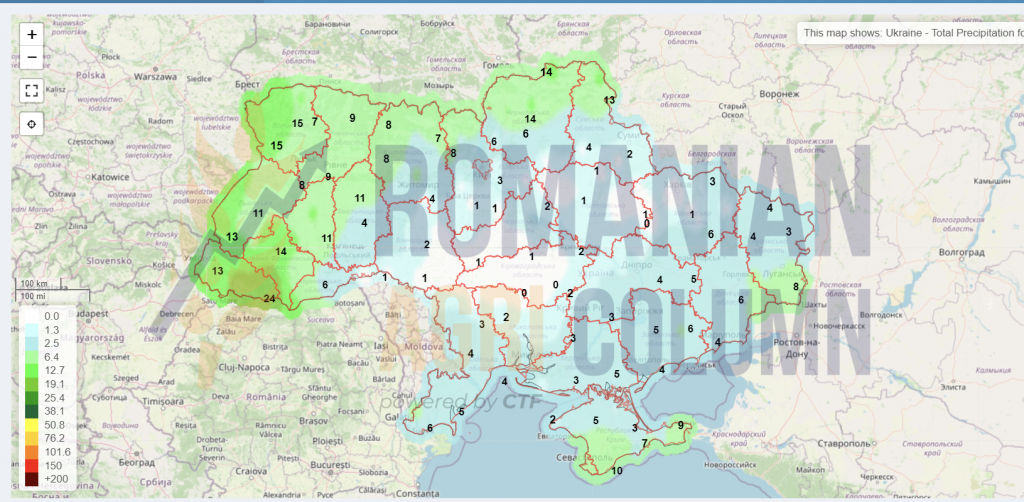
- UKRAINE indicates stress caused by a lack of rainfall, but it is not worrying yet.
- The EU indicates good vegetation conditions for wheat planted in autumn. The moisture level in the soil generates hopes for a good crop.
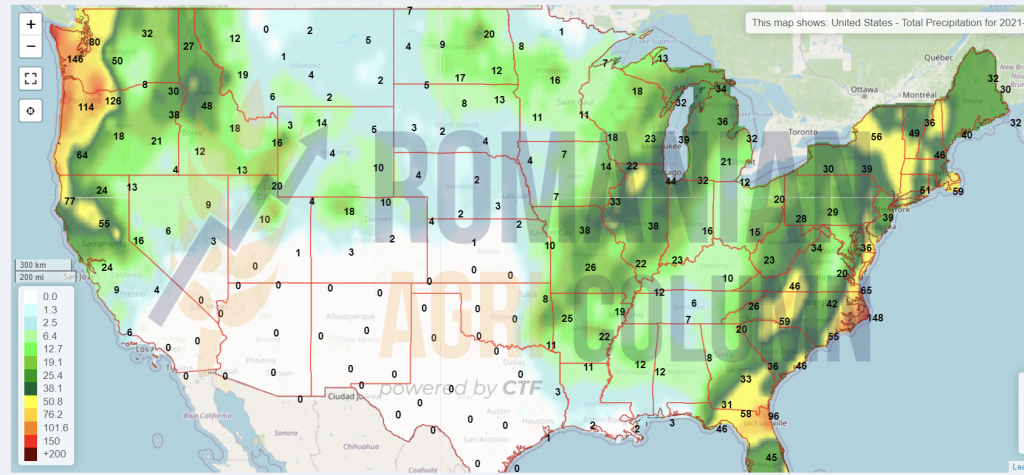
- The USA indicates a good to very good condition of wheat vegetation of 45%, but at the same time, we notice 21% in poor to very poor condition due to the lack of precipitation. Representative in this regard are the American states of Oregon, Montana, Texas, Colorado, Washington and South Dakota.
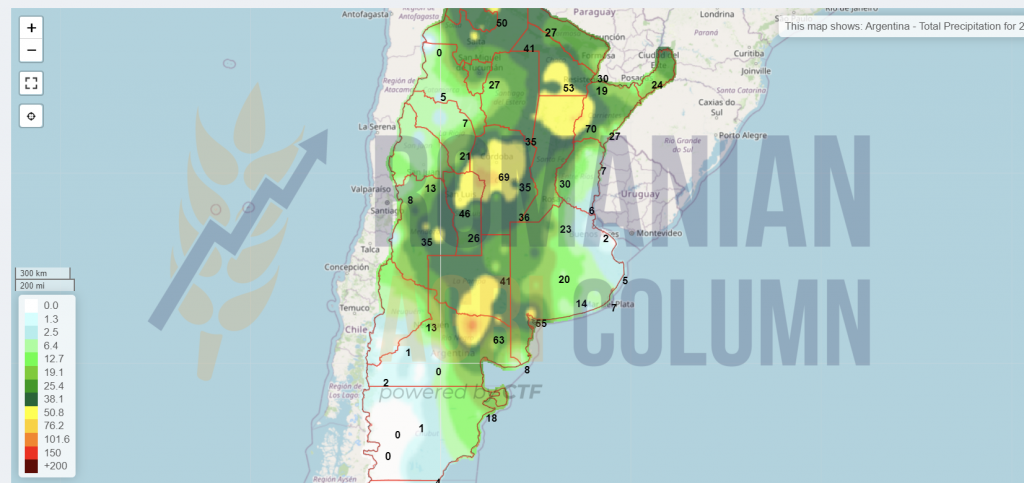
- ARGENTINA harvests wheat.
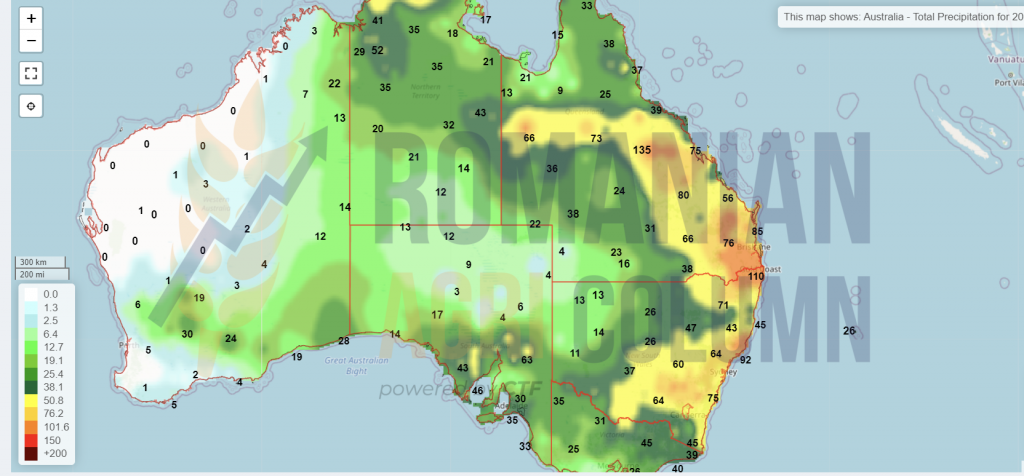
- AUSTRALIA harvests wheat, but rains hinder the process and we will not be surprised if quality problems arise.
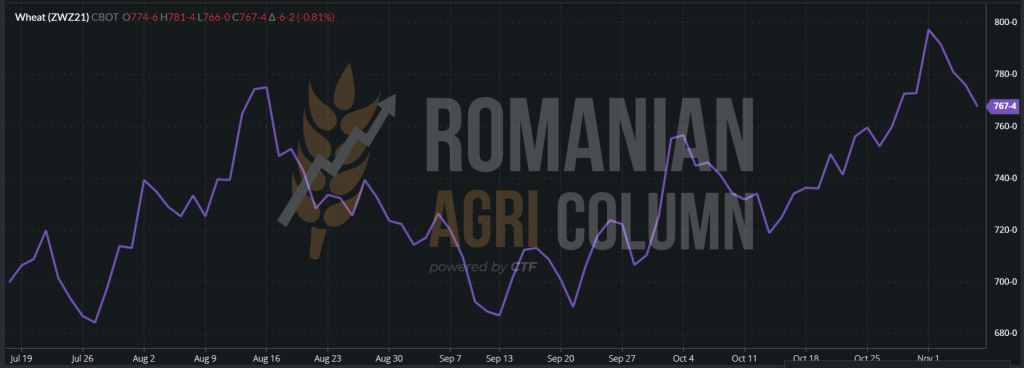
Regarding the US stock market indications, we note the same carousel as in Europe, against the background of the Saudi and Egyptian auctions, augmented by the actions of the investment funds, which also performed “profit taking” on CBOT.
You can easily see the peak generated at the level of 797 c/bu = 292.85 USD and then the sharp decrease to the level of 767 c/bu = 281.82 USD.
WHAT’S NEXT?
First, we have the AMIS – FAO estimates of 4 November 2021 which indicate the following in terms of production, consumption and stocks globally:
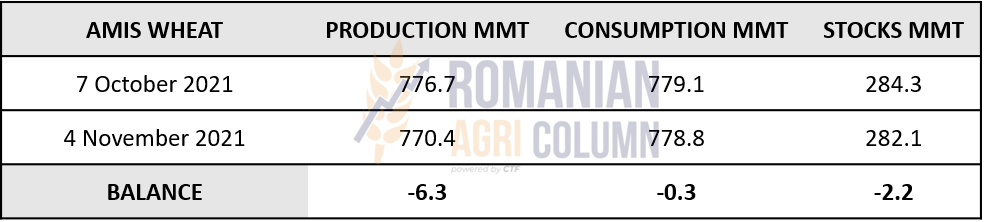
- Global production is down 6.3 million tons, following declines in Iran, Turkey and the United States.
- Global consumption fell by 0.3 million tons, insignificant we could say.
- Stocks are down 2.2 million tons due to Canada, the US and Russia.
So we have an offset of minus 8.2 million tons, according to AMIS.
Secondly, the USDA report of November 9, 2021 is not far. Initial estimates generate a bullish ratio to wheat, i.e., the outlook is not the most favorable in terms of production, consumption and stocks.
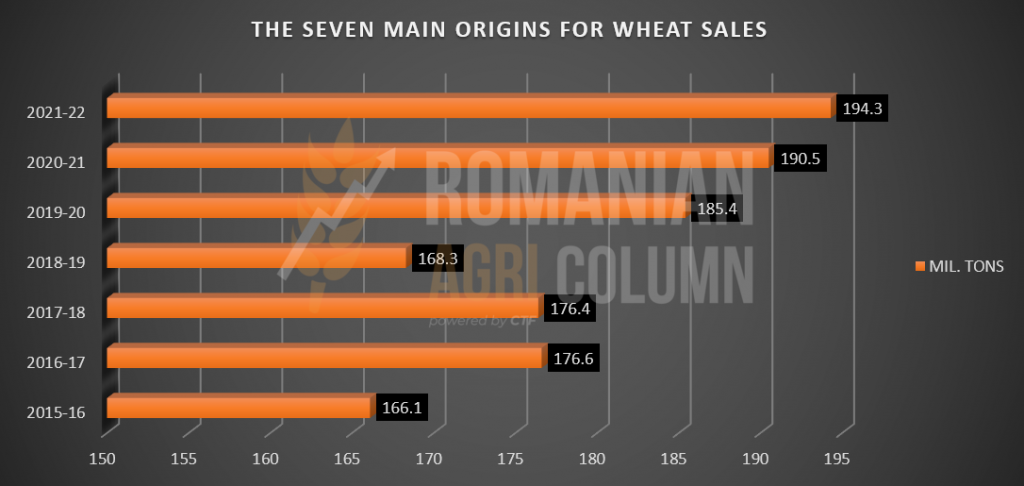
The level of wheat sales globally, compared to the 7 major exporters indicates the highest level in the last 7 seasons. In addition, the level of estimated volumes for export of the 7 major exporters is at the lowest level in the last 8 years.
ANALYSIS
- Demand is higher than supply in the case of wheat.
- Logistics still hangs in the balance of prices.
- Saudi Arabia could afford to double the auction in volume, paying a benchmark price, 377 USD/MT. But what will underdeveloped countries do?
- The USDA report on November 9 will generate the same bullish effect. Surprises have nowhere to come from. Australia and Argentina are reaping, but the estimated volumes are already in the calculations.
- At least until the end of January 2022, wheat will have a healthy trend, then we will see the state of crops, as well as the levels of sales made by Russia so that we can predict a possible trend reversal scenario.
Barley market
The indications of feed barley in the CPT Constanța parity have been stagnant for a few days around 235 EUR/MT, the interest being constant from the exporters. In Romania, certain batches of feed barley are starting to be marketed, most of them against the background of problems faced by pig farms. Many of these farms are devastated by swine fever and the herds are decimated, so that the level of the heads is constantly decreasing. This causes pig farmers to the sell barley purchased at harvest. There is still a long way to go before repopulation and the side effects cannot yet be quantified.
Interest in feed barley is also generated by customers of pig farms in Bulgaria, who are looking to originate in the southern part of Romania to meet consumption needs.
In terms of tenders, we note a new cancellation of a Jordanian one on November 4 due to non-compliance with the quorum, i.e., only 2 companies offered quantities to the Jordanian state.
Furthermore, the balance of production versus consumption of barley globally remains negative. Barley remains in its growing trend, actually pulled by feed wheat whose indications are about 25 EUR/MT higher.
Corn market
In Romania, harvesting is in full swing, especially in the central and northern areas of the country. We see how the volumes make their way from the fields to the storage spaces or to the buyers who already have contracts concluded for this purpose. The port of Constanța currently indicates a level of 238-240 EUR/MT in the CPT parity. The indication will be maintained for a few more days due to the fact that a deadline for delivery of goods remains November 15. The price is also supported by the fact that in Ukraine rains are expected to stop the corn harvest for a while.
After November 15, we will see a decrease of 3-4 EUR/MT in corn price. Harvest pressure has its say. Volumes have to travel a route, and many of the farmers do not have the necessary storage space to wait for the winter months.
We notice once again how the law is circumvented and we refer to traders who are also carriers and who circulate over tonnage on Romanian roads. Thus, they compete with other law-abiding traders. We do not resume the subject in detail. We understand that the authorities know the phenomenon and control it, but our suggestion is to do it with much more inclination towards details and without segmenting in this chapter. At this level of price of goods and transport cost, the tax base for the Romanian state decreases greatly. It is our duty to encourage compliance with the law and to point out certain inaccuracies in this regard.
Romania will generate a volume of 15 million tons, with the support of farmers in the center and north of the country, who have yields per hectare that offset the decline in production in southern Romania. At this moment, in terms of volume, Romania is on the 1st place in the European Union and maintains its position of origin basin from this point of view.
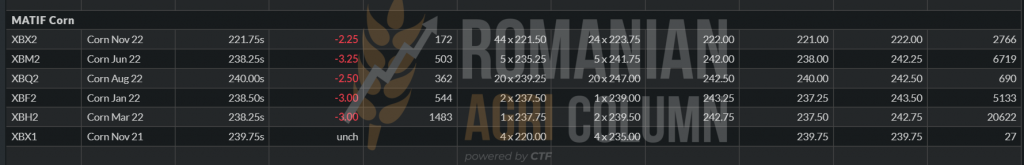
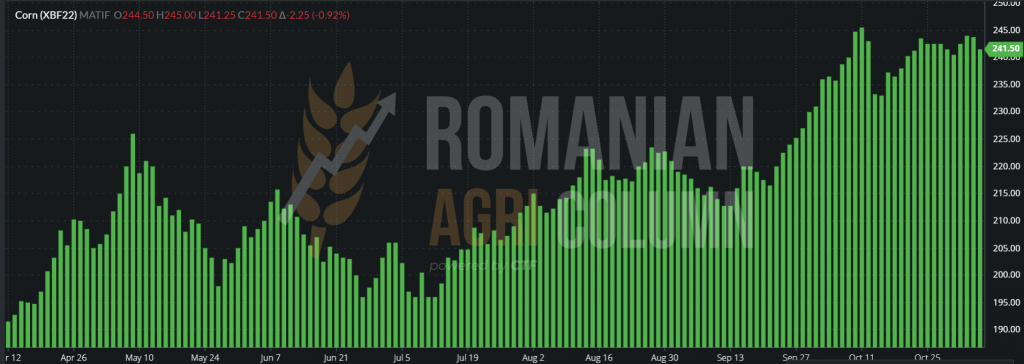
In the European stock market plan, we notice the degradation we estimate. The indication XBF22 is approaching the level of 238 EUR and, acting as a basis, the Port of Constanța will certainly rally in price soon. The effect of waiting for a favorable USDA report generates distrust in corn.
XBF22 – EUR 238.50 at the closing date of 5 November 2021
TREND XBF22
In the Black Sea basin, Ukraine is effectively in full blast in terms of maize harvesting. The level of production per hectare is stabilized around 6.45 tons and the level of harvest has reached about 48%. In the coming days, there will be rainfall that will stop the harvest. This will provide price support in the Black Sea basin, but for a short time.
As we know, Ukraine will generate an export level of 32.5 million tons and the competitive advantage of corn in the basin and in the EU is (still) the logistical cost. Transportation costs to NE Asia from the basin remain at the level of 66 USD/MT, compared to the logistical cost of American corn, indicated at the level of 86 USD/MT. The difference of 20 USD supports the price in the Origin of the Black Sea. It is the main engine of corn sales that competes with the huge American crop.
We still see stability at 280 USD/MT, but no carry for the coming months. Romania decreases the price level in offers for December by about 1 EUR/MT, to the level of 249 EUR/MT FOB.
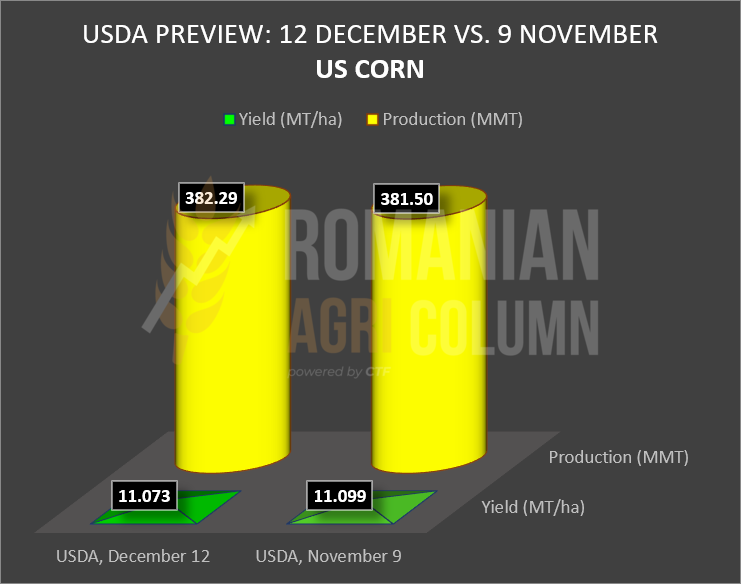
US crop estimates are growing close to the USDA report, which will be released on November 9th. As a forecast, the information is generated that the productivity is much higher than the previous report and thus it increased from 176.5 bu/acre (11,073 tons/ha) to 176.9 bu/acre (11,099 tons/ha). Production also received a surplus of 0.8 million tons. For compliance, 1 acre = 0.4049 ha.
US corn exports do not exceed the slow pace to which we have become accustomed. However, American corn has the largest share in exports to China. Weekly exports of 1.22 million tons increased by 9% compared to the previous week, but decreased by 17% compared to the average of the last 4 weeks. They have taken place in countries that regularly buy goods from the USA, but outside CHINA.
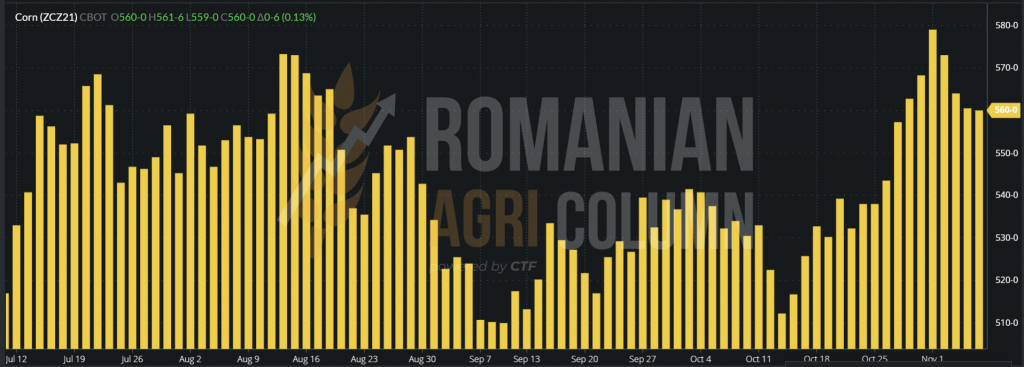
CBOT indicates 554 c/bu. Here, identically, corn enters the downturn, generated by expectations of increased production, the USDA ratio and the slow pace of sales.
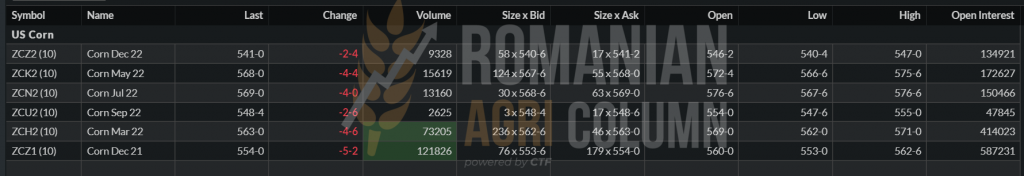
CORN – CBOT ZCZ21 GRAPHIC
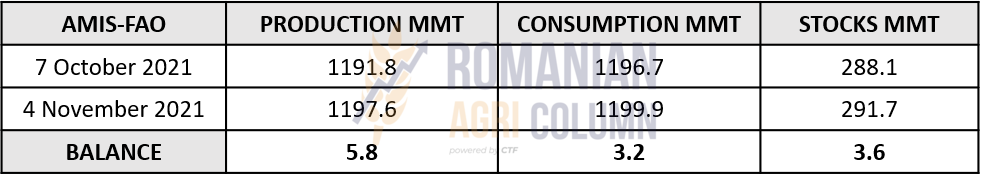
AMIS – FAO released a new forecast on global production, consumption and stocks on 4 November 2021. Production receives an upgrade of 5.8 million tons due to increases in Brazil, India and Africa. Consumption increased by 3.2 million tons due to the pace of industrial use, and stocks generated an increase of 3.6 million tons due to the Brazilian and American inventory. In total, we have an offset of production and consumption of +2.6 million tons, which is aggregated with the excess of stocks and we have a positive level of 6.2 million tons.
ANALYSIS
- Forecasts of production growth in the US, along with a positive stocks level will generate a higher volume of corn available on the market.
- Higher consumption will not be able to offset the increase in production, nor the inventoried stocks.
- The weather is a factor that supports the price in the Black Sea basin. The rains that will furrow Ukraine will generate support in the basin.
- On November 9, expectations are for a positive production ratio due to the increase in productivity of the American crop, and this, aggregated with the slow pace of exports, would mean a bearish trend.
Rapeseed market
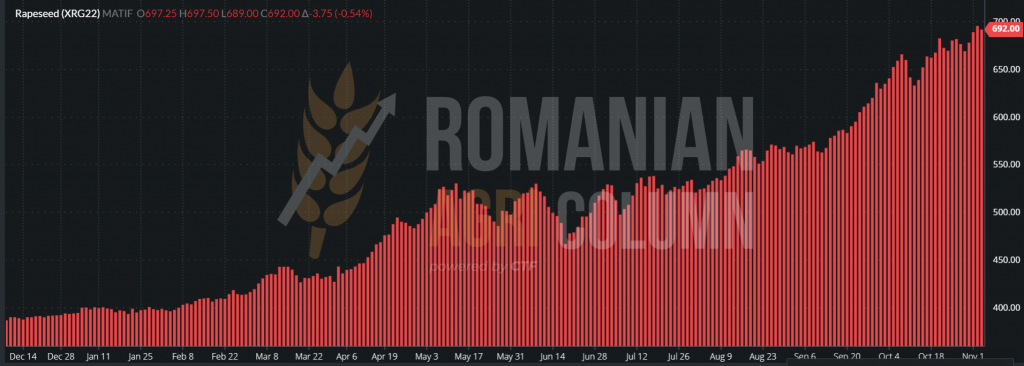
Rapeseed still gives us the same stability trend generated a few months ago. According to our estimates, the indication FEB22 rose to the previous level of NOV21 quite quickly, the support being generated by the demand for crude oil as well as energy.
Our demand forecasts come true again. Processors have started acquisitioning and their interest is starting to increase for the batches of rapeseed stored on farms or in the stock of other intermediaries.
CVB currently indicates a level of 805 USD/MT FOB, i.e., 695 EUR/MT, which leads us to a 685 EUR/MT CPT, with the exporter’s margin included. Processors have to line up and pay the same level as the DAP Factory, probably discounted by the transport difference between the factory and the port, but not necessarily, given the interest.
The difference between FEB22 and AUG22 on EURONEXT is -93 EUR, which is the crop inverse (New Crop – Old Crop). This is generated by the confidence in the new crop, the surplus of hectares generated by the European Union and the status of crops so far related to the 2022-2023 harvest.
EURONEXT XRG22 – 685 EUR at the close of 5 November 2021
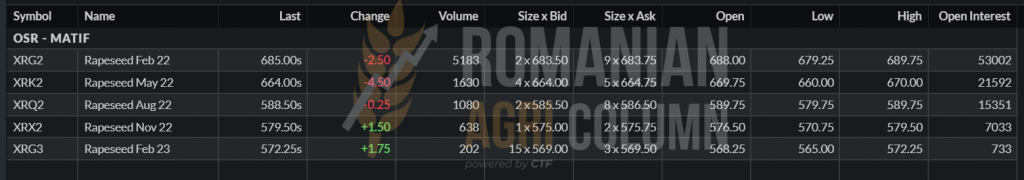
XRG22 DEC20-NOV21 GRAPHIC
The port of Rotterdam indicates a level of 1,540-1,550 EUR/MT of RSFO (rapeseed oil), increasing by 40-50 EUR/MT, a sign of demand and uncovered contracts. The fundamentals are respected in a market that generates balance and we refer to FUTURES vs PHYSICAL MARKET. But when the balance between supply and demand is negative, the correction comes from the physical market.
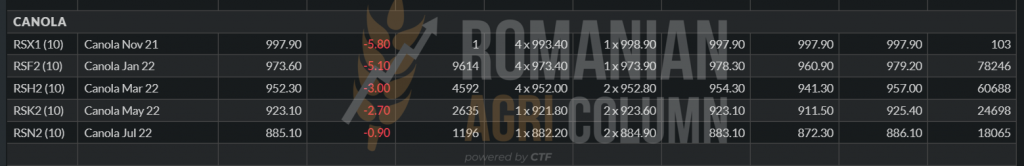
On the other side of the ocean, we see that the indications of canola are close to our estimate of 1,000 CAD/MT. It is, in fact, the logic of the puzzle we compose daily and of our analysis of supply and demand.
RSF22 – 973.6 CAD JAN22
ANALYSIS
- Rapeseed receives a new breath of vitality in price, according to our forecasts.
- Support comes from uncovered demand and uncovered contracts, as well as from future sales (December-February 2022).
- According to issue 43 of Romanian AGRI Column, the future of rapeseed is excellent and promising in terms of track record and combined demand.
Sunflower seed market
The price of sunflower seeds has deteriorated since a few days ago. This was due to the pressure of oil sales in the Black Sea basin. In this context, we see a level of 370 USD/MT in the CPT Constanța parity, this level being similar to the one posted by the Port of Varna.
The price of seeds is currently in a plateau and stabilization phase at these values. But logically, farmers have no appetite for sales at this time. Their expectations rise to levels other than those posted today and important batches are in their stocks.
However, December and January will generate demand from the internal market, demand from within the EU common market, as well as demand for exports. This will mean a much higher competitiveness in the price parameter, with a positive trend compared to today’s level. A firm benchmark for farmers is the figure of 700 USD/MT.
If we look at what is happening now in the Black Sea basin and in Europe, we can begin to draw the following map:
- Ukraine will generate a volume of 7 million tons of sunflower oil, compared to the previous season, which was 23% lower. But the comparison is only statistical. Last year’s drought bit deep into the Ukrainian potential and so the relationship of the numbers is somewhat false.
- Ukraine is also fast approaching the end of the sunflower seed harvesting campaign. From 6.5 million ha, they will generate a volume of 15 million tons, with a productivity of 2.3 tons per hectare.
- Russia is in the same status as Ukraine, with the harvest almost finished, with a harvest level approaching 15.4 million tons.
- All Russia drops export tax on crude oil to 190 USD/MT, in an attempt to become competitive in the Asian market and the Middle East. In a tender generated by GASC Egypt, Russia won a lot of 15,000 tons with DEC21 delivery, at the level of 1,440 USD/MT C&F.
- The EU indicates an increase in production of 0.2 million tons from 9.74 million to 9.94 million tons. This surplus, if we can call it that, will not generate major changes in the long run.
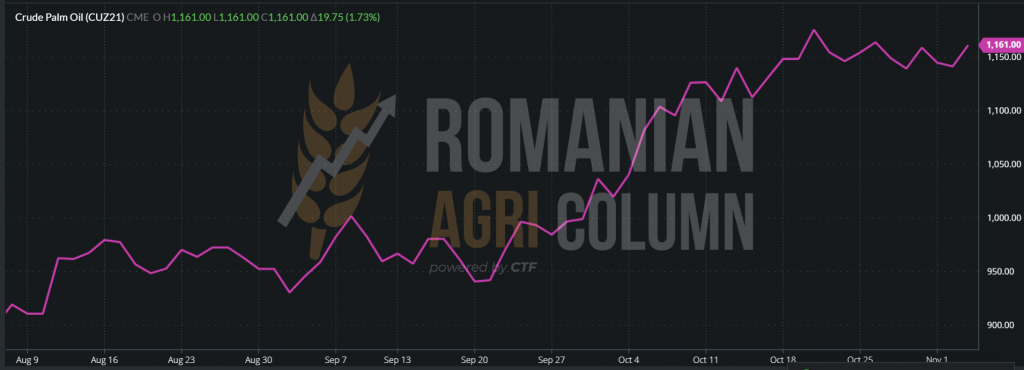
- The Black Sea Basin generates prices of 1,400 USD/MT for deliveries in November 2021. The offers for deliveries in December are not very clear. There is a difference between ASK and BID in this regard, a sign that processors see other levels than buyers. But demand is what defines the price, as well as the support of the VEGOIL complex.
PALM OIL TREND – CUZ21 DEC21 NYMEX (VEGOIL COMPLEX)
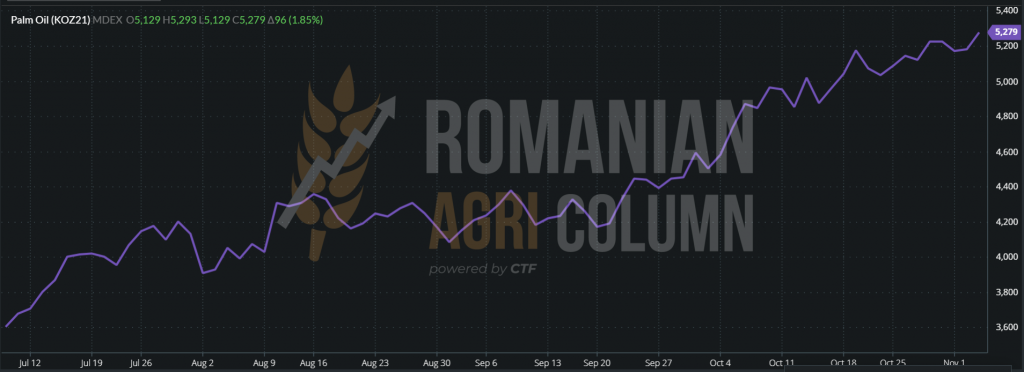
MDEX (MALAYSIA) – palm oil KOZ21 DEC21
ANALYSIS
- The above factors generate the described plateau state, i.e., a status of calm and accumulation in crude oil sales.
- The route and price support will come in the winter months, Asia being a generator that supports sales.
- Let’s not forget the countries that generate the demand for raw materials and that will arrive without delay in the basin, in this case in Romania, from December and January. Turkey, for example, has zero sunflower seed taxation by the end of the year.
- So we will see a return of the price of raw materials towards the end of 2021.
The soybean market
The Romanian soybean market looks the same as last week, with processors indicating a level of 650-660 USD/MT of goods delivered to factories. But their interest becomes somewhat latent due to the fact that the quarterly sales coverage is close to 100% and thus they are no longer forced to compete at higher levels.
Other buyers in the market claim the same interest as before, with price levels being dictated by demand from Western European destinations as well as exports. Because yes, we already have a noticeable demand for non-GMO soybeans.
Overseas, CBOT does not indicate levels of recovery. The indications are manifested statically, in small oscillations, which are reflected around the negative values.
CBOT ZSF22 IAN22
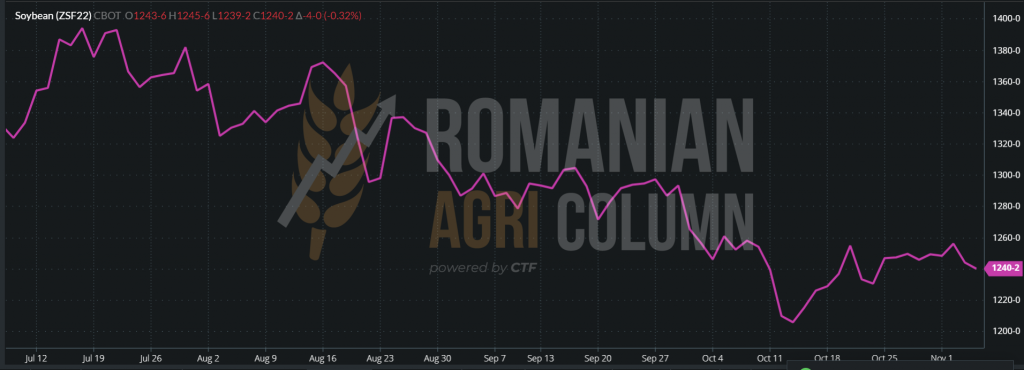
In a preview of the USDA report, we see an increase in the level of US production from the increase in yield and the difference expressed in figures is 1 million tons in addition to the level of the USDA report of October 12, 2021. In other words, the forecast indicates 122 million tons vs 121 million tons last month.
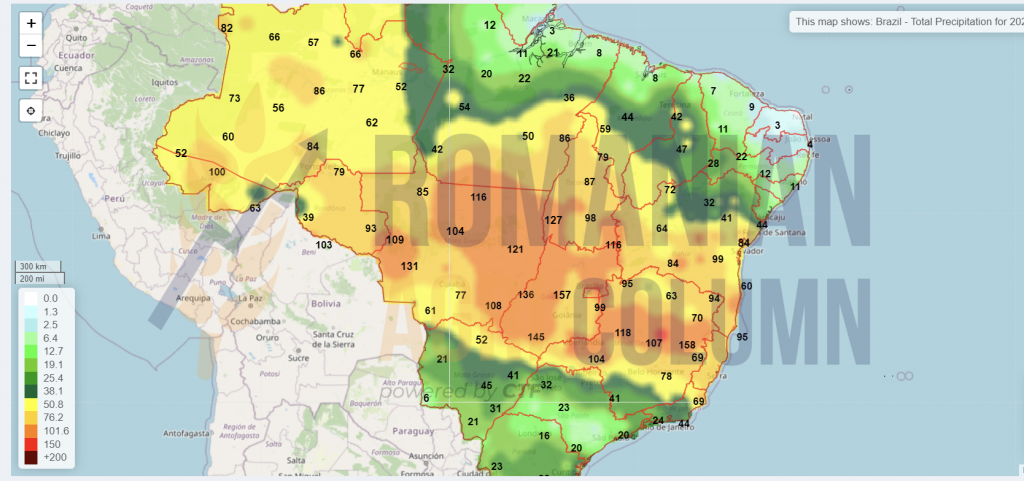
In South America, things are going very well in terms of planting and Brazil’s forecast of 140 million tons compared to 136 million last year seems, in turn, achievable.
The United States is on the decline in sales compared to last year. The level of exports to China is dragging on and failing to keep pace with forecasts.
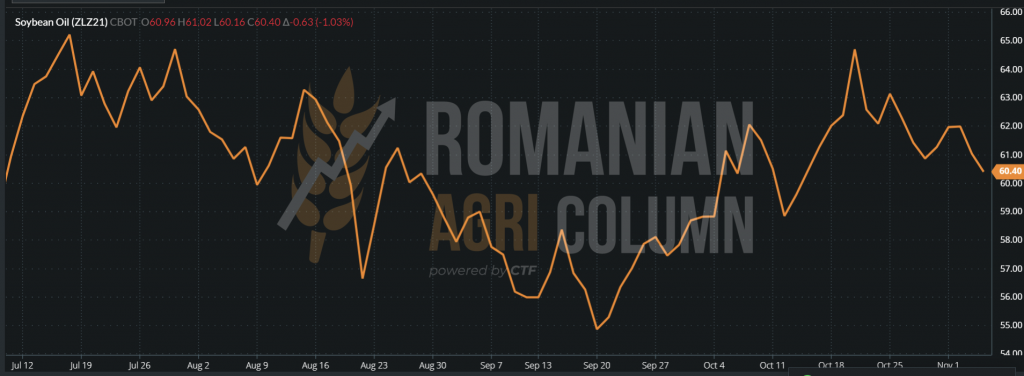
Soybean oil does not perform well during this period either, as soybean oil is a by-product of soybeans and by no means the main product. But it is part of the VEGOIL complex and receives or offers support from the complex partners: palm oil and sunflower oil.
CBOT ZLZ21 – DEC21 SOY OIL
We therefore keep the same recommendations as in the previous issue, namely for the sale of soybeans harvested in Romania. There are no factors on the horizon, at least in the short term, that could trigger a rise in soybean prices on CBOT, unless China presses on acceleration. But China has other problems today.
To close the oilseeds chapter, we insert a graph of the composition of the share of each vegetable oil in world production and trade. We thus see graphically represented the importance and the percentage assigned to each category.

FAO price index
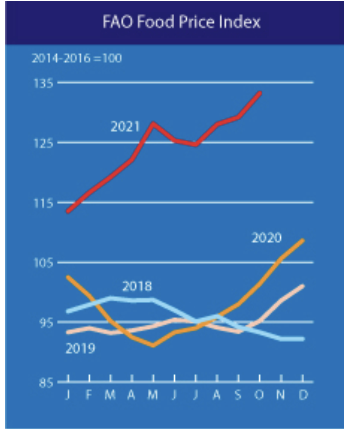
The FAO Food Price Index (FFPI) averaged 133.2 points in October 2021, up 3.9 points (3%) from September and 31.8 points (31.3%) from October 2020. After rising for three consecutive months, the FFPI in October was at its highest level since July 2011. The most recent month-on-month increase has been driven mainly by the continued strength of world prices for vegetable oils and cereals.
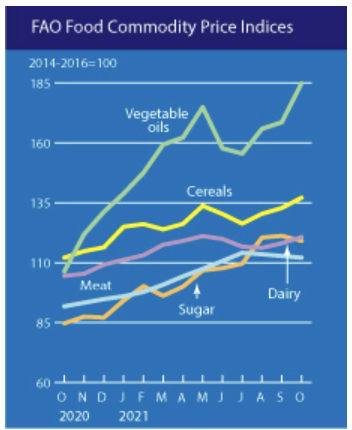
The FAO cereal price index averaged 137.1 points in October, up 4.3 points (3.2%) from September and 25.1 points (22.4%) from the current level. International prices of all major cereals have risen from month to month. World wheat prices continued to rise for the fourth consecutive month, rising by another 5% in October, reaching 38.3% year-on-year and reaching the highest level since November 2012.
The FAO index of vegetable oil prices averaged 184.8 points in October, up 16.3 points (or 9.6%) from month to month and hitting a record high. The increase was determined by the firmer quotations of palm, soybean, sunflower and rapeseed oils.
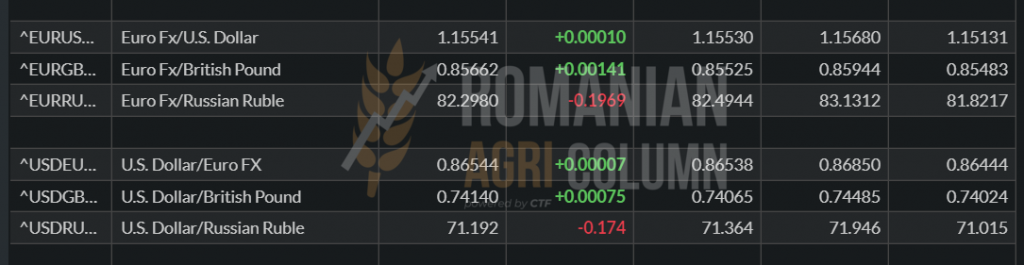
EUR-USD parity
The USD strengthens against the EUR (1: 1,1554)
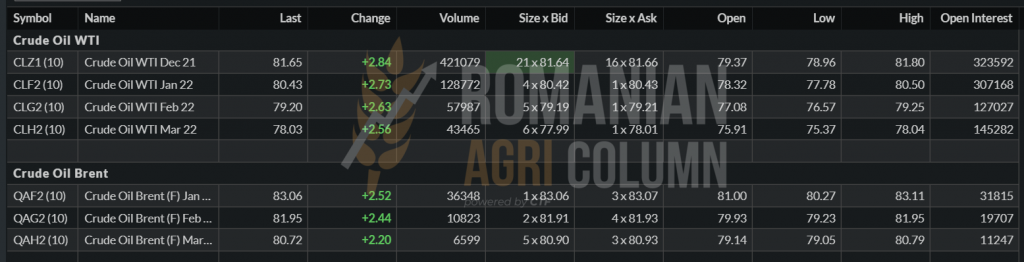
Fossil energy
WTI 81.65 USD/barrel | BRENT 83.06 USD/barrel
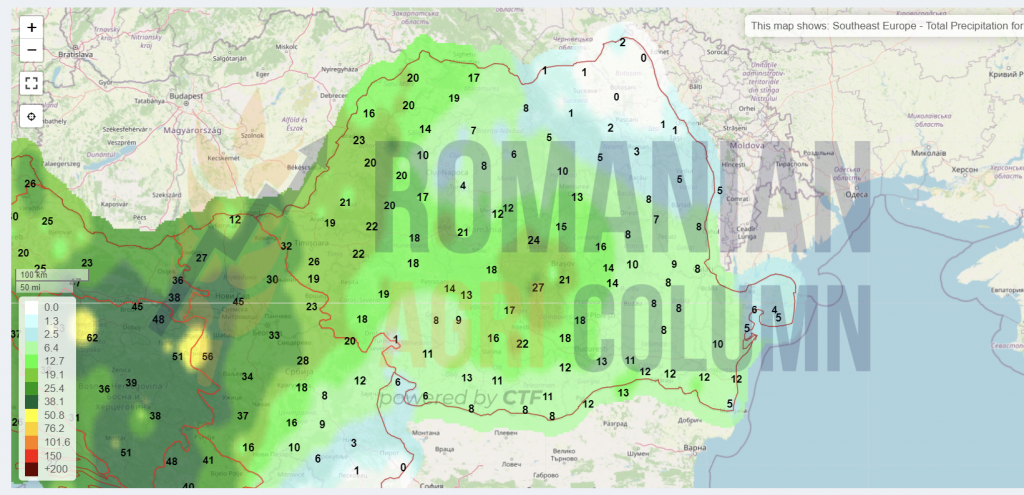
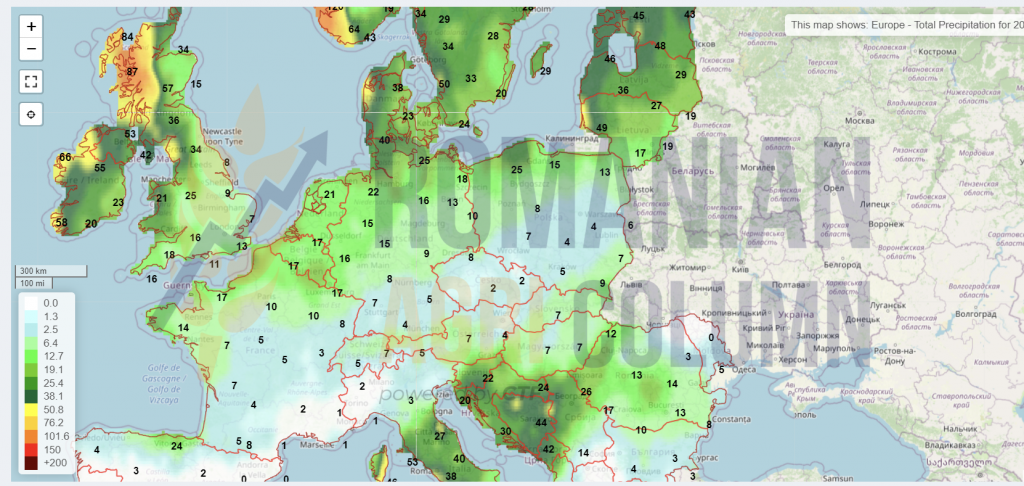
Weather forecast
5-14 November 2021
Romania
Europe
Russia
Ukraine
USA
Brazil
Argentina
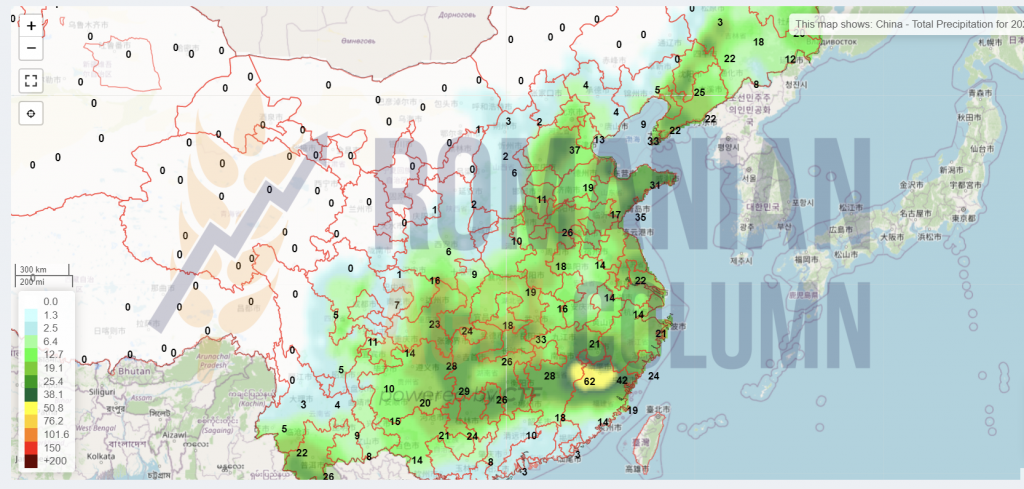
China
Australia
© Romanian AGRI Column, 2021, all rights reserved