
This week’s market report provides information on:

LOCALLY
The market is acting chaotically at the moment. Romania was left alone in terms of trade operations in the Black Sea basin. The Sea of Azov is closed, Ukrainian ports are closed. Any commercial operation is thus suspended in the Black Sea basin and the port of Constanța together with Varna remain alone on the theater of commercial operations of the Black Sea basin.
Wheat registers emotional quotations, the level of 300-305 EUR/MT CPT Constanța being present in the market. The offers come to the farmers who still have stocks and, thus, with the balance actually broken in the Black Sea basin, the price rose sharply, by about 30 EUR/MT, after the invasion.
The new wheat crop also suffered jumps immediately after the announcement of the potential invasion, but quotations declined rapidly due to the longer time to harvest and the potential for regional easing. However, compared to last week’s level of 253-256 EUR/MT CPT Constanța, today we see indications of 276-278 EUR/MT for the new crop, i.e., an increase of 20-22 EUR, generated by the demand of exporters who wanted to cover their sales.
It is useful to mention that, still, the Romanian wheat does not have a very good state of vegetation. Rainfall is still poor and we do not see an improvement in the forecast, at least for the first half of March.
REGIONALLY
All commercial operations in the Black Sea basin are suspended. The Sea of Azov is closed, and Russian ports do not operate commercially. Ukrainian ports are closed, in turn, and also do not operate commercially. Russian and Ukrainian price quotations are virtually non-existent during all this time.
The GASC tender on February 24, 2022 was canceled due to lack of participants. There was only one offer and that from outside the Black Sea basin, quoted at the level of 399 USD/MT FOB French ports. Naturally, apart from the fact that the level was somewhat out of context, there is no tender for a single bid and it is thus canceled.
The tender announced by TMO Turkey on March 2, 2022 for the purchase of 435,000 tons of wheat will most likely have the same fate as the Egyptian one. The time is very short and the Sea of Azov is closed to trade at this time. No one can assume the delivery of the goods under any conditions during this time. Merchant ships receive the effects of the war, 2 of them being hit by Russian naval forces in the Black Sea. The tanker Millennial Spirit and Supramax Namura Queen were hit and severely damaged by Russian ships.
| The Russian invasion of Ukraine is a moment that will fundamentally mark the wheat and corn market. Ukraine, Russia and Kazakhstan account for 38% of the global wheat trade. Russia has an export level of at least 35 million, at most 38 million tons. Ukraine has an export level of 25 million tons and with the difference in the Kazakh account, it totals almost 80 million tons, out of 200 million tons annual global trade level granted as a multiannual average.
In the current context, when Russia manifests its regional power, with trade implications, we will see the creation of a pole of power in the grain trade. Russia will effectively decide the pace and price in the wheat market, only by controlling a level of 40% of the goods that move globally in the market. We have to look at things in a geo-political-commercial context. And we need to look at things in a much broader spectrum, decades ahead. So let’s try to create as complete a picture as possible of what Russia means and will mean in control of the WHEAT resource at the regional level. Firstly, the world’s population must be segregated into zones. And we start from the main areas with social problems, namely the number of inhabitants and the degree of poverty, and we list: North Africa, Sub-Saharan Africa, the Middle East, Southeast Asia. Here we have an impressive number of people living on the brink of subsistence. About 80% of 1,200,000,000 souls are food insecure. Exactly these areas are most exposed to drought and soil erosion, as well as those most affected by climate change. The Black Sea basin is best positioned logistically in this context. And so, the areas described as main destinations will always generate demand in the Black Sea basin. Moreover, Russia has also developed trade relations with wheat sales with China. Feed wheat has become a much more important nutrient than soybeans in Chinese feed recipes, due to the difference in price in favor of wheat, as well as the uncertainty about the volume of soybean crops in South America. Climate change places soybeans in a very high degree of volatility, with price fluctuations impacting the final cost of feed. After all the above description, we can have a much clearer picture of what may follow in the next decade, in the scenario in which Russia will control Ukraine. With control of 40% of world wheat trade, it can effectively decide the price of this raw material globally. And as a result, Russia will decide who and how they feed. Let’s not forget the poor countries of Southeast Asia, countries like Indonesia, Bangladesh, Pakistan. Indonesia alone has a population of 270,000,000, and Pakistan has a population of 225,000,000. If we bring Bangladesh with 173,000,000 inhabitants, we are already approaching impressive figures. Going further in this context, Russia will also become the largest producer of sunflower seeds globally. Russia, together with Ukraine, generates a level of 33-34 million tons of raw materials annually, out of a global total of 56 million tons. Of this total, the EU produces 10 million tons. The global ratio that impacts the vegetable oil market is completely unbalanced. With over 60% of global production and taking into account the European cultural specificity of predominantly sunflower oil consumption, as well as India’s annual demand for sunflower oil, we can see a Russian control over the market. When you control the food, the price, you also decide who eats or not. Things are obvious and if you don’t have food, the money is worthless, it becomes just paper that can be burned. In the context of Russia controlling food, along with gas and oil, things are tilting dramatically in its favor at all levels, in terms of talks, negotiations, positions of power and taxation. In other words, if you leave 50% of the global food in the hands of a single actor, then don’t expect too much compassion from him. He behaves like a predator and will rule in blackmail to control and decide who lives and who dies. Grain exporters are looking for alternative sources of wheat and corn as a Russian invasion disrupts Ukrainian supplies, with producers in the European Union, Romania and France being used to cover some nearby cargo, traders said on Friday. Romania, a major supplier of grain that, like Ukraine, exports through the Black Sea, but outside the conflict zone, has been seen as an obvious reserve option for traders. “There was an increased demand for Romanian wheat with ports outside the war zone,” said a trader. “It was mainly from multinationals looking for a quick supply coverage, the volumes were substantial both on Thursday and Friday.” Part of the demand is believed to cover recent sales to Algeria, a destination where Ukrainians and other Black Sea natives have gained market share. Traders said that about 400,000 to 500,000 tons of Romanian wheat and 200,000 to 300,000 tons of Romanian corn have been bought since the fighting began in Ukraine, mostly for immediate shipment or loading in March and April. In addition to Romanian corn, companies have reserved at least a few small vessels of French corn to cover nearby shipments to EU destinations, such as the Iberian Peninsula and the Benelux countries, traders said. There was also talk of buying French wheat to replace Ukrainian supplies. Some traders said a few hundred thousand tons could have been set aside, although others cited lower initial volumes for immediate needs, the availability of rival sources such as Argentine wheat, reducing interest in French deliveries for longer periods. |
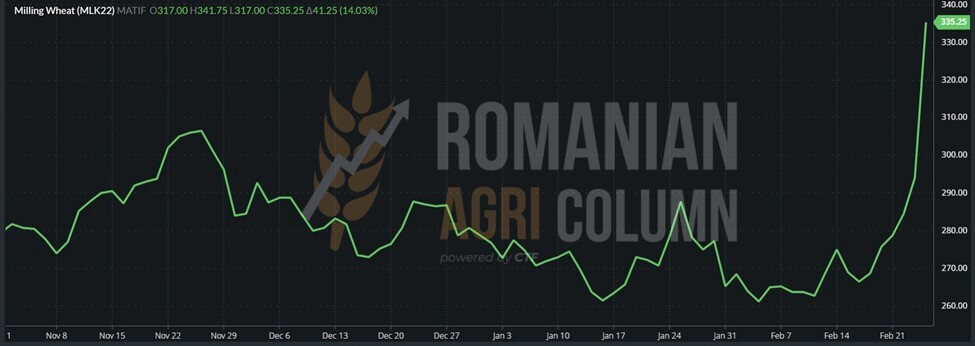
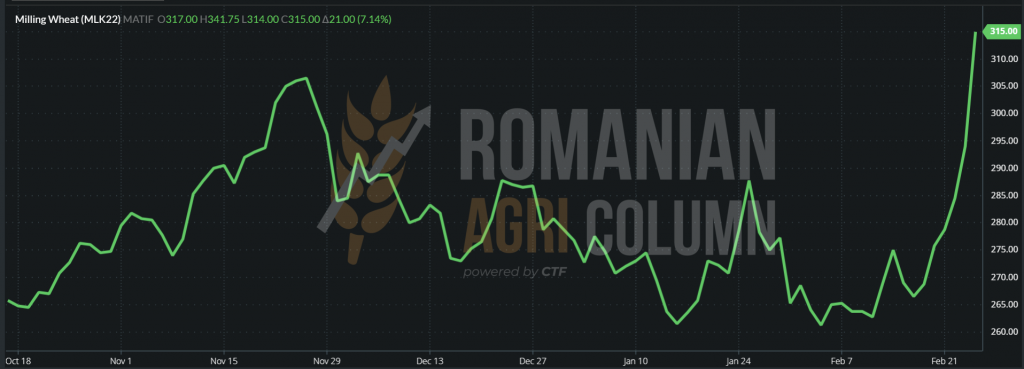
In the EURONEXT plan, the opening of 24 February 2022 actually caused an explosion. From a level of 287 EUR, the previous day’s closing level, quotes actually jumped to 341 EUR MAR22 in seconds. This was followed by a stabilization of around 335 EUR for a good period. The close of February 24th generated a level of 315 EUR for the indication MAY22, in accordance with the partial tempering of the emotion. Then came February 25, when, as we have been announcing for some time, the funds are extracting their profits. We will generate the route of these hot days through graphs and price indications. A two-day journey of the price of wheat, among bombings and bullets, an invasion and dead people, simple figures, but containing all the above.
EUR 287 -> EUR 334.5 -> EUR 315 -> EUR 289.75
EURONEXT 24 February 2022 during the trading session
GRAPH EURONEXT February 24, 2022 during the trading session
EURONEXT MLK22 MAY22 – 315 EUR on February 25, 2022, at the opening
EURONEXT MLK22 MAY22 TREND GRAPH – 315 EUR on February 25, 2022, at the opening
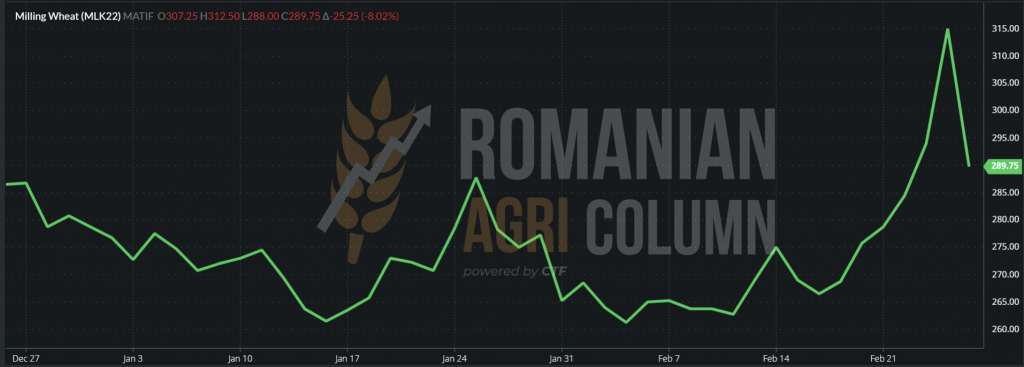
EURONEXT MLK22 MAY22 – 289.75 EUR on 25 February 2022 at the close of the trading session
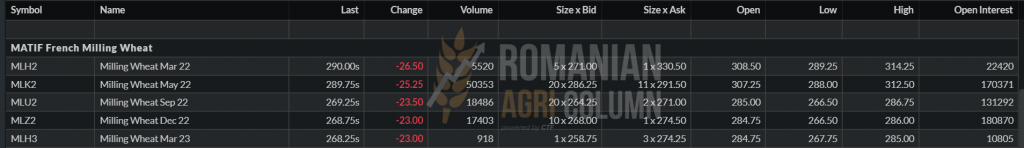
EURONEXT MLK22 MAY22 TREND GRAPHIC – 289.75 EUR at the close of February 25, 2022
GLOBALLY
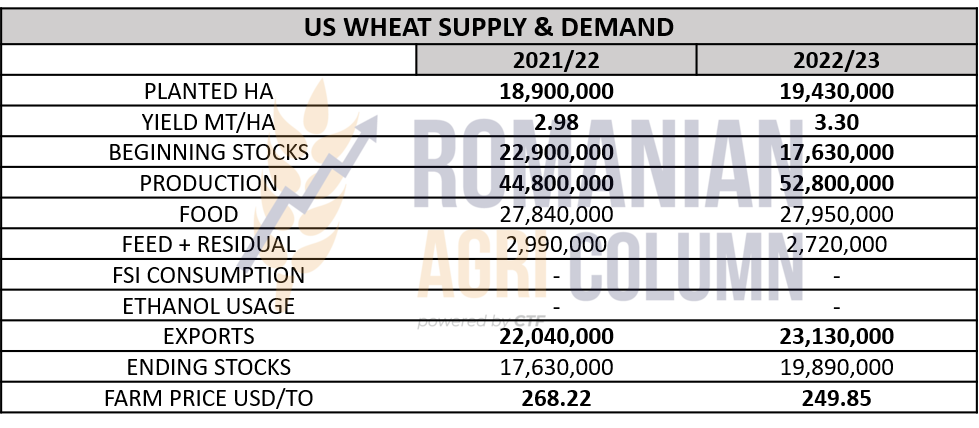
The USDA generated the wheat crop forecast for the 2022-2023 season, which indicates an increase in sown area, an increase in yield, but a lower price than in the 2021-2022 season.
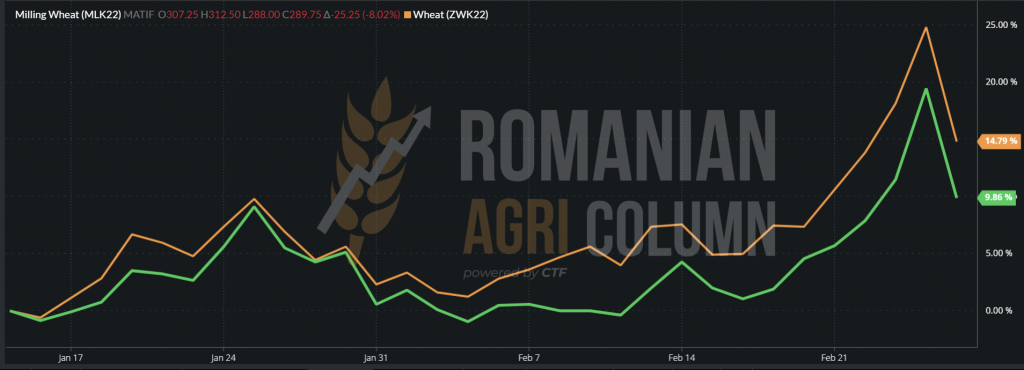
CBOT followed the same route as EURONEXT, so we will only insert the closing of February 25, 2022, as well as a comparative graph between the two references.
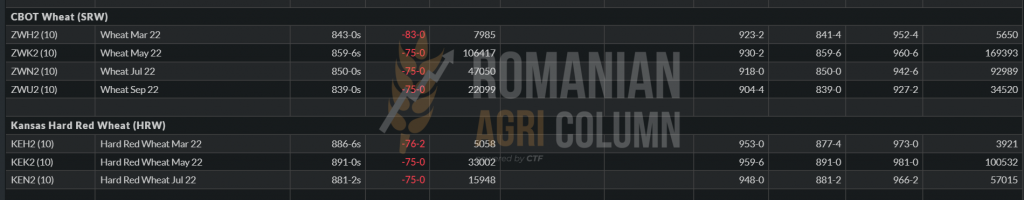
CBOT ZWK22 MAY 22 (orange) – MLK22 MAY22 EURONEXT (green) COMPARATIVE GRAPHIC
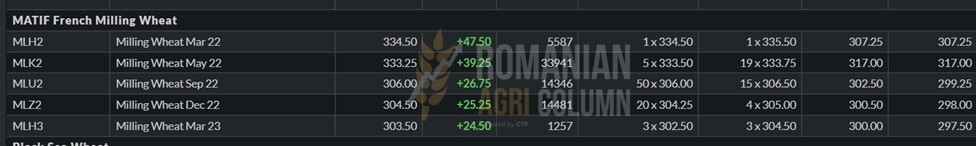
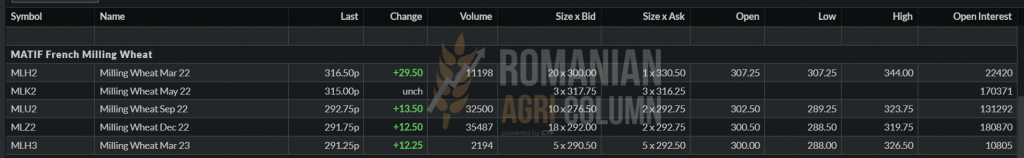
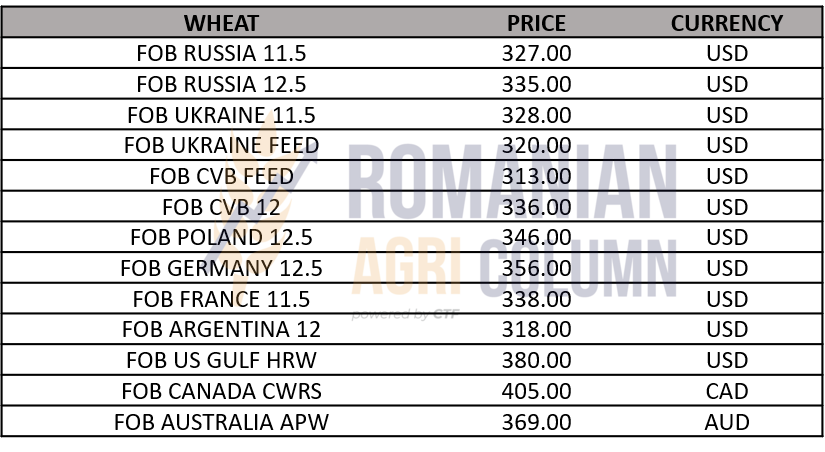
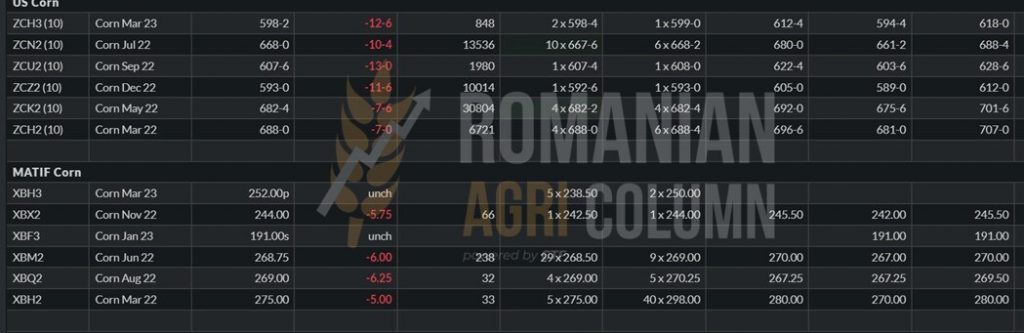
PRICE INDICATIONS IN VARIOUS ORIGINS
ANALYSIS
- Uncertainty in the basin, in the context in which Russian and Ukrainian ports are blocked by war.
- The demand is triggered by panic, after actually launching for a long time.
- Destinations are looking for supplies in Romania. Contracts can be covered in Romania, in the context in which the force majeure clause has been applied for many.
- The funds/trading algorithms remain undisturbed and are looking for profit, so the excitement is diluted by the end of February, when MAR22 expires in CBOT and EURONEXT.
- Wheat prices fall again at the resistance level of 300 EUR/MT in the parity of FOB Constanța. It remains to be seen how far this threshold will go. From March 1, we will be trading again for May, so the funds will speculate positions again.
- The war in Ukraine is the most important factor at the moment. Its duration and the operationalization of the ports in the basin are the most important factors.

LOCALLY
On the local market, the price of barley remains at the well-known level already of 250-253 EUR/MT in the CPT Constanța parity. Small batches are making their way among the huge quantities of goods leaving Romania these days and we note a volume of 83,000 tons of barley leaving Constanța these days.
The new crop remains at an average price of 220 EUR/MT these days, but the rains are delayed in Romania, so farmers do not have the desire to contract.
REGIONALLY + GLOBALLY
Jordan is suspending a bid to buy 120,000 tons of barley this week due to a lack of participants. Only two companies have submitted bids in this regard.

LOCALLY
The indications of the corn relaxed after the day of February 24, when the panic was established at very high levels and thus, we saw the same route of sudden rise, but also of the fall of the price of corn, on February 25. The port of Constanța indicated on February 25 the level of 270 EUR/MT in the CPT parity.
In the country, farmers had been planning to sell since February 23, but the temptation to wait another day or two was high enough to capture a potential that was felt in the air. And the expectation paid off on February 24th, with most of them making profitable sales. However, some of them did not speculate on the moment and missed the day of February 24th.
REGIONALLY
Regional status can be described in one word: CLOSED in the Black Sea basin. The Sea of Azov is closed, Ukraine is closed. No port operations are carried out. The owners of the terminals have suspended their activities due to the Russian invasion of Ukraine, the fights are going on for the capture of the Ukrainian export terminals, if possible intact, for their subsequent operation. Ukrainian maize vital to Asia is effectively blocked and cannot be transported. Contracts are suspended by force majeure clauses.
Buyers are now looking for goods in Romania and Bulgaria.
Romania has 1,335,000 tons of corn shipped, which indicates the pressure on the port of Constanța these days. The port of Constanța thus becomes the hub of the Black Sea, as we estimated in past issues.
Prices in the pool experienced increased volatility, a jump and a decrease, due to the war-induced panic, covered by the extraction of profits by the funds the next day, given the approach of the expiration of MAR22. However, as the pool is closed, Ukrainian quotations have no coverage due to operational and logistical impossibility.
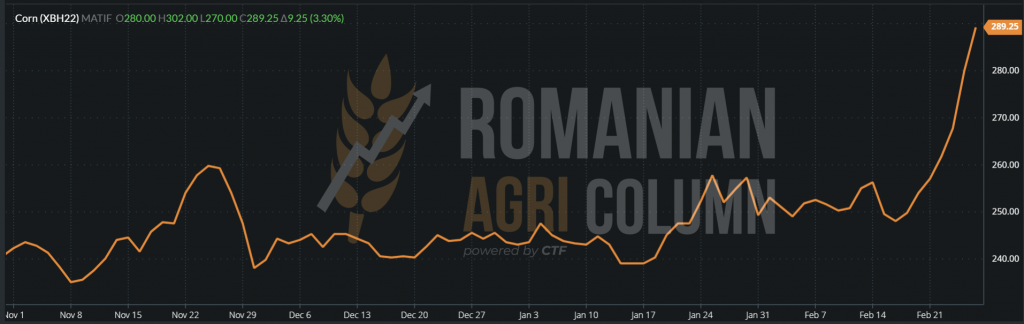
Let’s see the evolution of EURONEXT in the context of these days starting from the opening of February 24, 2022, going through the opening of February 25 and closing with the end of the trading session of the same day. The route is indigo as in the case of wheat.
CORN – opening February 24, 2022 – XBH22 MAR22 – 303 EUR
CORN GRAPHIC TREND – EURNOEXT opening on February 24, 2022 – XBH22 MAR22
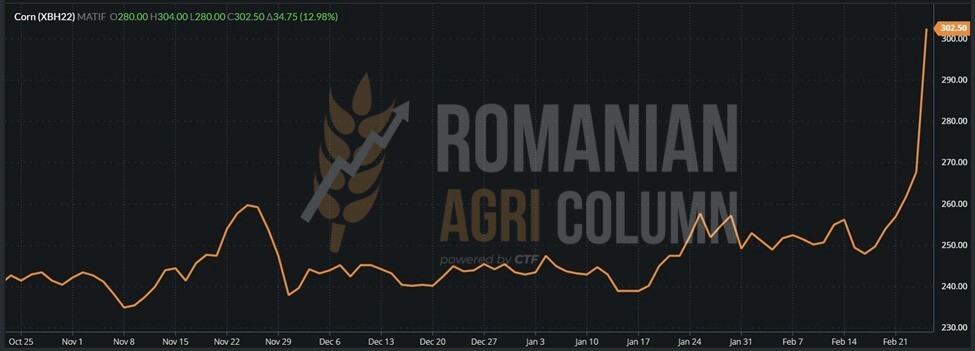
CORN – opening on February 25, 2022 – XBH22 MAR22 – 275 EUR
XBH22 CORN TREND GRAPHIC – return to 289 EUR at the close of February 25, 2022
GLOBALLY
The global corn supply is inevitably moving across the Atlantic to the Americas. American and Brazilian corn have the mission to replace the origin of the Black Sea basin, which indicates an increased logistical activity of these areas.
Brazil should be mentioned in particular, due to the planting rate of Safrinha, which reached the level of 66-68%. The rains they had lately have done good, but also bad, due to the massive floods that we have seen in the media. The Safra harvest has reached a level of 58-60%, but we already know the losses – a minus of 5 million tons. And as the harvest progresses, the losses intensify.
Argentina, in turn, has started harvesting corn and is at a level of 5% at the moment. We already know the problems related to the drought that decreased the production of Argentine corn, but the level of 51 million tons remains a relevant indicator, due to the recent rains, which managed to maintain this estimate (down from 54 million tons). Only 21% of Argentina’s corn crop is in excellent condition, while the overall rating has dropped by 4% to 51%. Areas with a problematic development or, better said, the “bad” rating increased by 2%, to the level of 28%.
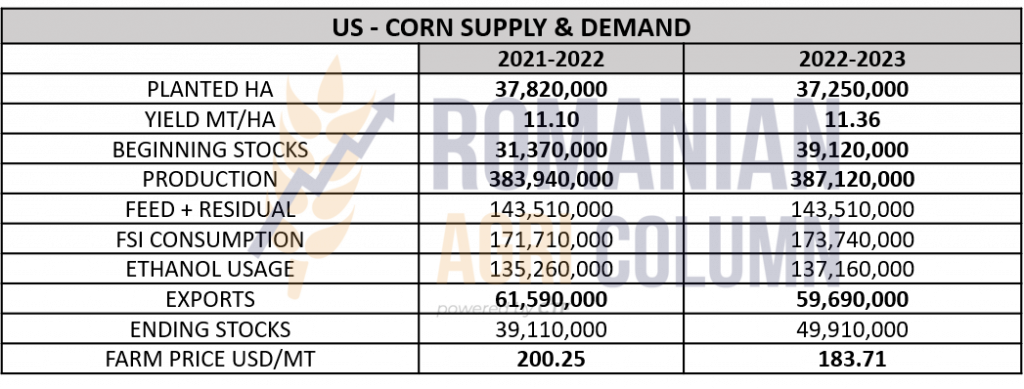
The USA show us the potential for the 2022-2023 season. And we see a decrease in the number of hectares, which was predictable, in fact, due to the increase in wheat area. We see a higher productivity per hectare and, implicitly, a higher production. Domestic consumption for feed and waste remains the same. Instead, it increases the consumption of FSI (Food, Seed, Industrial), as well as the use for ethanol. Exports are reduced by about 2 million tons, and the price indicator also drops by about 16 USD/MT.
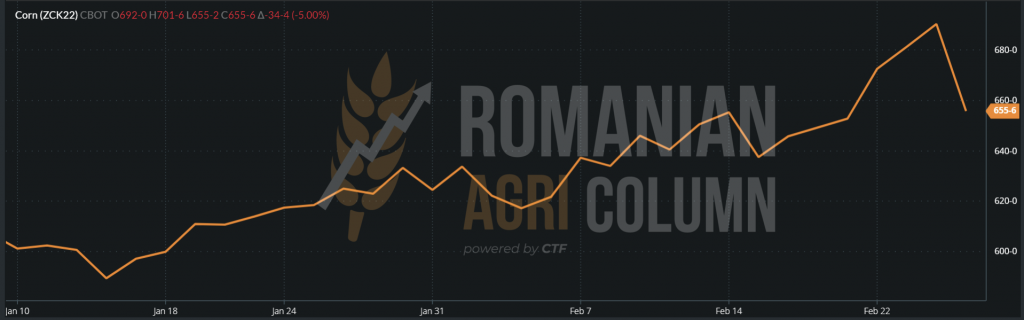
CBOT made the same leap and then returned between February 24 and 25, 2022. The reasons are the same as in the case of wheat and the European stock market – the excitement and the funds.
ZCK22 MAY22 CBOT at the close of the trading session on February 25, 2022 – 655 c/bu (-34 c/bu)
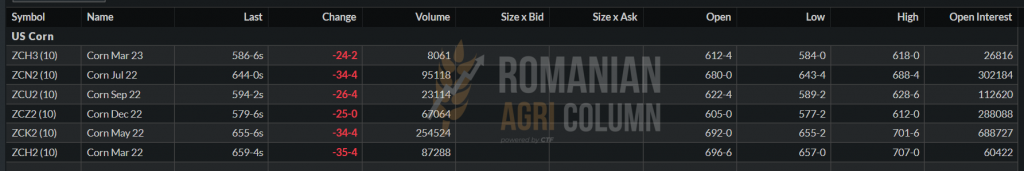
CBOT ZCK22 MAY22 – CORN TREND GRAPHIC
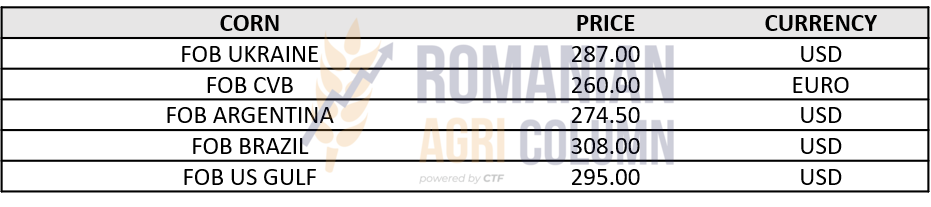
CORN INDICATIONS IN MAIN ORIGINS
ANALYSIS
- The pressure exerted by the conflict in the Black Sea basin is strengthening the port of Constanța.
- The volumes of corn leaving Romania are increasing. The replacement of the Ukrainian origin with the Romanian origin is visible.
- North and South American origins are also targeted in terms of volume growth during the conflict period in the basin.
- After March 1, we will see a further rise in the price of corn. A new period of the price life cycle takes effect.
- Brazil is planting Safrinha, which promises to make up for the negative difference created by Safra.
- Argentina remains with a forecast of 51 million tons, but corn has begun to be harvested.

LOCALLY
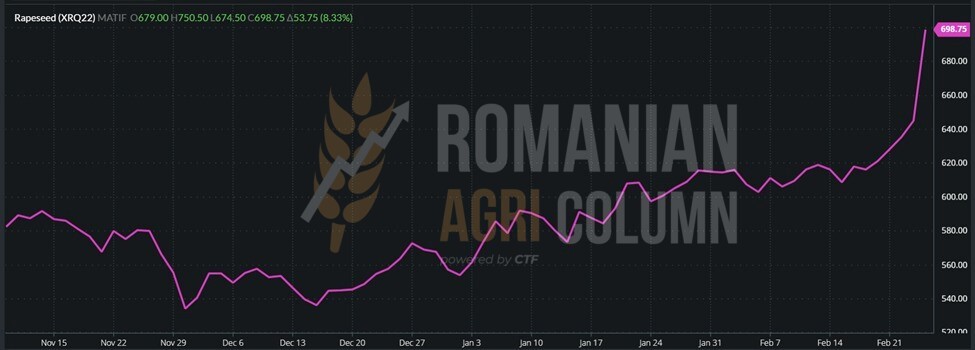
The local market was actually surprised by the level of opening on February 24, 2022 and we are referring especially to processors, who did not digest well the effect of the conflict in the Black Sea basin, associated with exceeding the threshold of 100 USD/barrel of oil price. The hesitation continued for some time, until the European market dissipated the initial emotion and began to return to somewhat normal values. Trading values have not changed, remaining at the same AUG22 -5 or -10 EUR/MT. Our price estimates were reached faster than we anticipated and today we see rapeseed at the level of 638 EUR in the AUG22 quotation.
REGIONALLY
Emotion was the element that ruled the last two or three days. We witnessed the opening of EURONEXT on February 24th, where we saw the rapeseed gain an unlikely value of 105 EUR in just a few tens of seconds.
Then things got a bit tempered, but they stayed in full tension for most of the trading day. But, as we argued in previous issues, any hiccup costs money and so we mark Ukraine and Russia with 3 million tons of rapeseed harvested in 2022. This figure is called into question until the end of the conflict. We support this because, depending on who materializes this conflict, they will decide the future of this energy resource.
Let’s not forget the fragile balance of rapeseed:
- EU – 17 million tons
- Ukraine – 3 million tons
- Russia – 3 million tons
- Canada – potentially 23-24 million tons, but planting begins in April.
At the moment, in supply & demand we have 6 million tons in question.
How do we quantify this in numbers? Simple – a much higher level for the indication AUG22 and a positive Premium level, which should be paid locally, between 5 and maybe in excess of 20 or 22 EUR, depending, of course, on the level of the Romanian crop, in this case.
To remake the film of February 24 and 25, 2022, please have a look at the story composed of images, as listed below.
EURONEXT XRQ22 AUG22 RAPESEED – 700 EUR (+55 EUR) 2 hours after opening on February 24, 2022
AUG22 XRQ22 TREND GRAPHIC of February 24, 2022, during the trading session
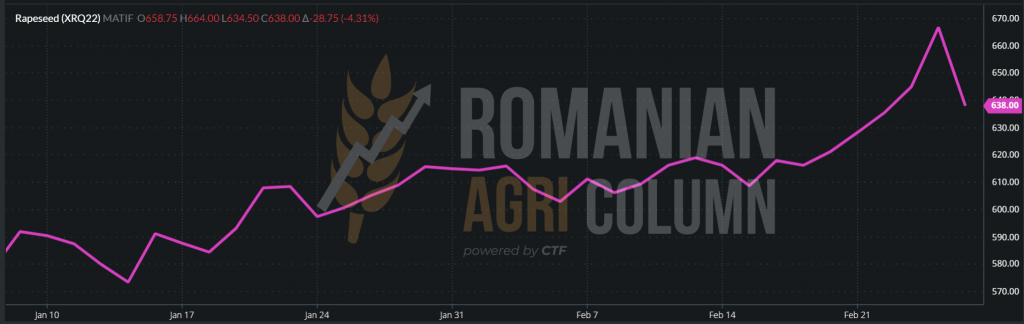
XRQ22 AUG22 RAPESEED at the closing date of February 25, 2022 – 638 EUR (-29 EUR)
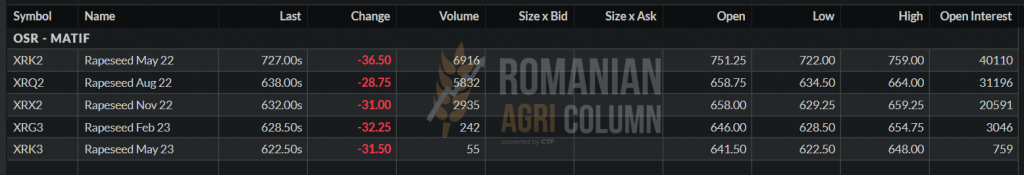
XRQ22 AUG22 RAPESEED GRAPHIC at the closing date of February 25, 2022
ANALYSIS
- Rapeseed correlates perfectly with the price of oil.
- Rapeseed has 6 million tons of supply & demand in question.
- The level of 638 EUR is not a final one, increases will certainly follow.

LOCALLY
Things get extremely complicated. The conflict in the basin generates blockages and pivots that, instead of being supported, create an inflationary spiral of commodity prices. First of all, the quotations of the raw material experienced an exponential increase with the blockage in the Black Sea.
Thus, the price of sunflower seeds experienced a sudden increase, reaching the level of 800 USD/MT CPT Constanța. As we have said many times, Romania is the only source of this raw material in the region and, at this moment, we see a level of maximum 100,000 tons of goods left in the country.
We will soon reach an issue that concerns us all – the lack of raw materials for processing. We have been repeating the same thing for months and the problem we see on the horizon is the lack of raw material in processing.
As an implicit effect, there is a lack of sunflower oil or its delivery to the retail system with a very long delay, due to the low processing rate, due to the lack of raw materials. In addition to all this, the price will, in turn, undergo positive changes, if we can call them that, in the context in which we will pay a higher level by 15-20% per liter.
And the inflationary spiral of commodity prices does not stop here. Depending on the duration of the conflict, we may see higher price levels of 5 to 10%. Converted to today’s price, this aspect can bring the price of the seeds close to 900 USD/MT.
REGIONALLY + GLOBALLY
Sunflower oil suffers from a deep blockage. The main source in the region is blocked. Ukraine has a stockpile of more than 350,000 tons of crude oil in the ports near Odessa, which can no longer be delivered. Moreover, the facilities owned by Bunge and ADM were suspended due to the conflict, on one hand, and on the other hand, due to the fact that they could no longer process and, implicitly, store and deliver the goods.
India, which buys the largest volumes of crude sunflower oil, is in serious trouble at the moment. They bought 510,000 tons of crude oil and received only 130,000 tons. The rest are stranded in Ukrainian ports and cannot be delivered.
India had just returned to sunflower oil due to the small volumes of soybean and palm oil available, and now this is creating a new pivot for rising prices. They will certainly return to the other sources, soy and palm, but they will increase the price of these two sisters of the VEGOIL complex.
The consequence is inevitable – SIX Ports or ARAG were priced at almost 2,000 USD/MT on Friday, and in the current context it would not be out of the question to see indications of 2,300-2,400 USD/MT in the short term.
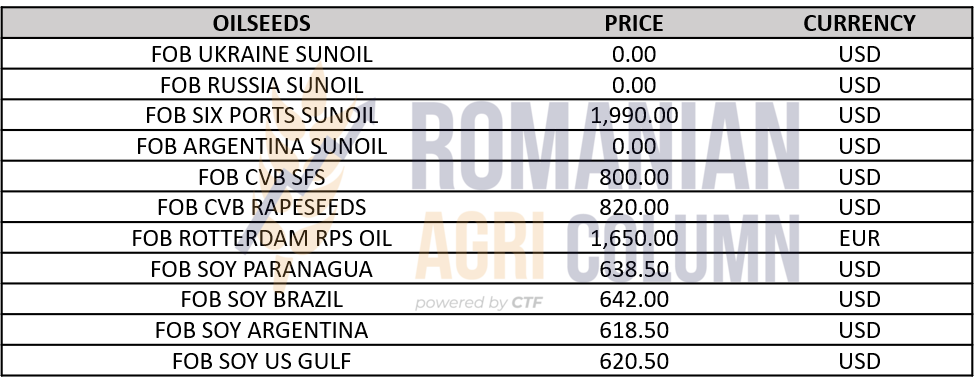
OILSEEDS INDICATIONS IN VARIOUS ORIGINS
ANALYSIS
- Volatility is high in the market for raw materials for sunflower seeds.
- Prices are constantly rising due to the blockade created by the war in Ukraine.
- The inflationary spiral is fueled by the lack of availability of soybean and palm oil volumes.
- We estimate a level of 2,300-2,400 USD/MT for crude sunflower oil.
- We said it a long time ago: Brace yourselves for impact. But we will soon feel the shock in our pockets.

LOCALLY
The local price indications for soybeans are around 660 USD/MT under DAP Processor Romania and around 615 EUR/MT for deliveries to processors in Hungary.
GLOBALLY
Last week, the United States reached a sales level of 1.23 million tons of production in 2021 and about 870 thousand tons of sales for the new crop. This level reaches the initial forecast, with China as the main buyer.
In Brazil, there are fears about the supply of fertilizers in the Black Sea basin due to the conflict, but this sentiment is quite premature. Time will tell whether or not this concern is well-founded. At the same time, we note the beginning of the soybean harvest in Brazil, in Rio Grande do Sul.
Argentina indicates through BAGE a good to excellent level of 25% in terms of soybean crop. There are still concerns for areas in the center of the country where, due to lack of rainfall, the crop continues to deteriorate. Thus, the total level of vegetative state with the qualifier “bad” increased by 5%, up to 28%. The harvest estimate is currently 42 million tons, down from an initial level of 47 million tons.
CBOT reacted under the impetus of investment funds, after the initial emotion generated by the operational shortage in the Black Sea basin, associated with the decrease in production in South America.
Let’s follow the indications of the last trading session from the night of February 25 to 26, 2022, in order to be able to see the related quotations after the profit taking action of the funds.
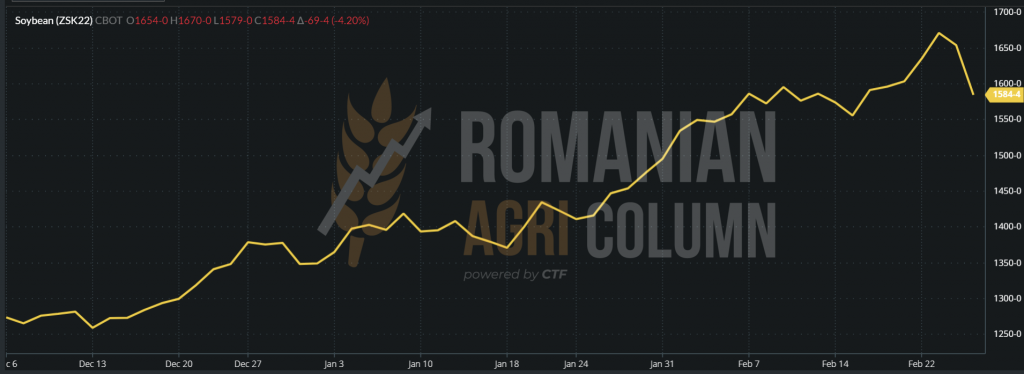
CBOT ZSK22 MAY22 – 1,584 c/bu (-69 c/bu)
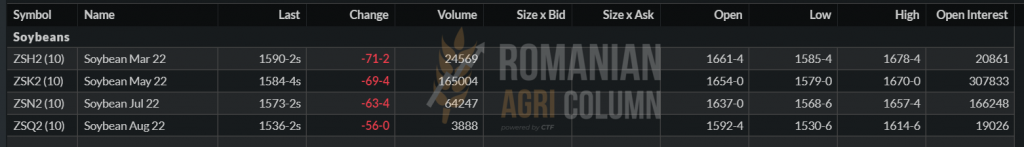
SOYBEAN CBOT GRAPHIC – ZSK22 MAY22
ANALYSIS
- Weakened crops in South America will continue to support the price, but after March 1, 2022.
- The VEGOIL complex is inflamed by sunflower oil blockages and reduced volumes of palm oil. Subsequently, soybean oil, which is reduced as a direct result of low volumes of raw material, also acts as a support pivot for this growth.
- Turning consumers back to soybean oil does nothing but implicitly boost soybean prices.
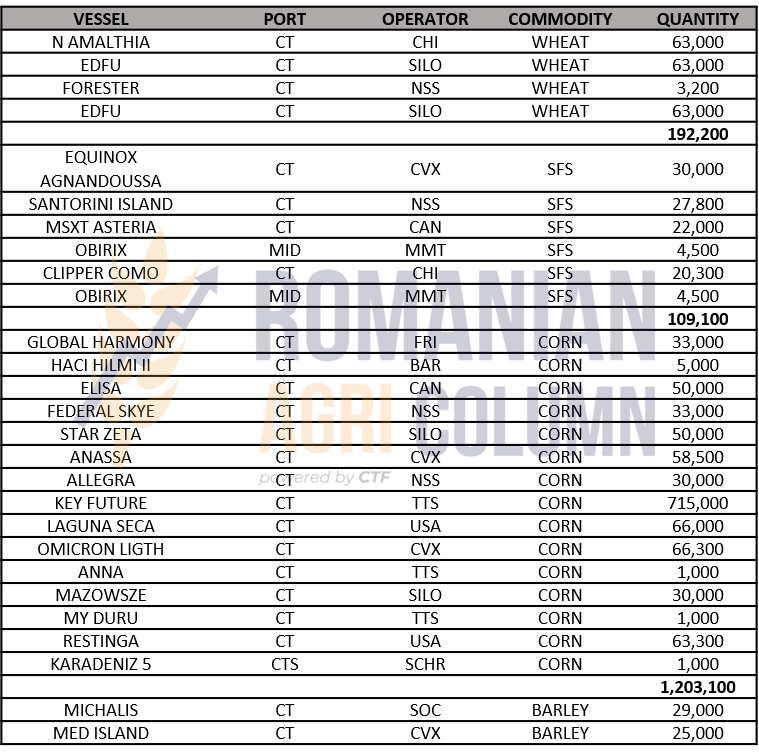
EXPORT: WHEAT 192,200 TONS | CORN 1,203,000 TONS | SFS 109,000 TONS | BARLEY 54,000 TONS

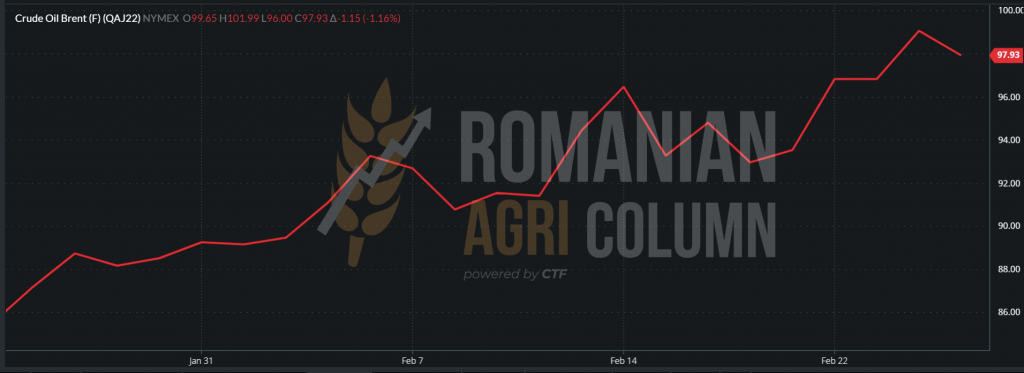
WTI and BRENT timing. The ENERGY supply from Russia did not give up and so the emotion dissipated.
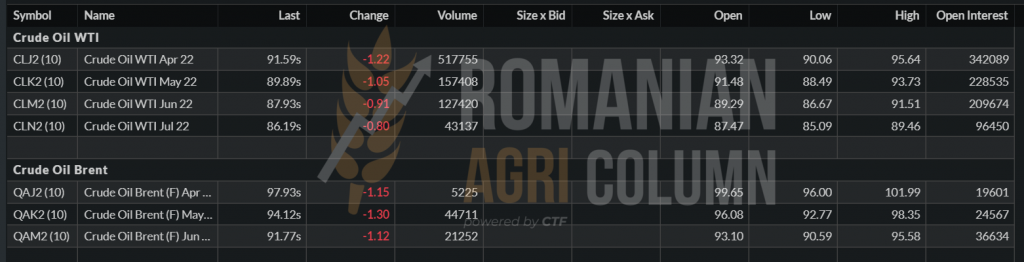
WTI CLJ22 – 91.59 USD/barrel | BRENT QAJ22 – 97.93 USD/barrel
BRENT TREND GRAPHIC – QAJ22 APR22

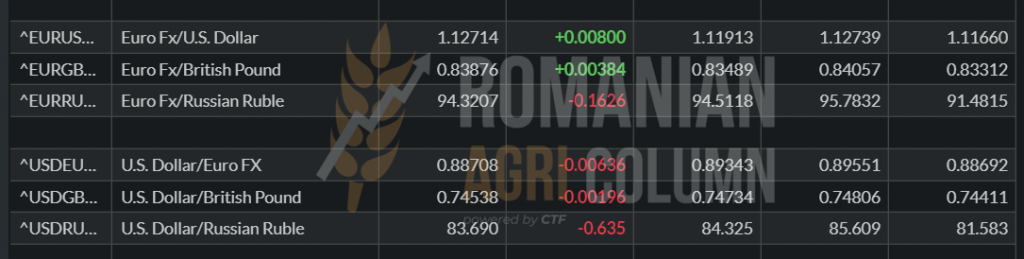
EUR/USD 1: 1,127 | Ruble in slide – 84 RUB/1 USD | MOEX closed (Moscow Exchange)

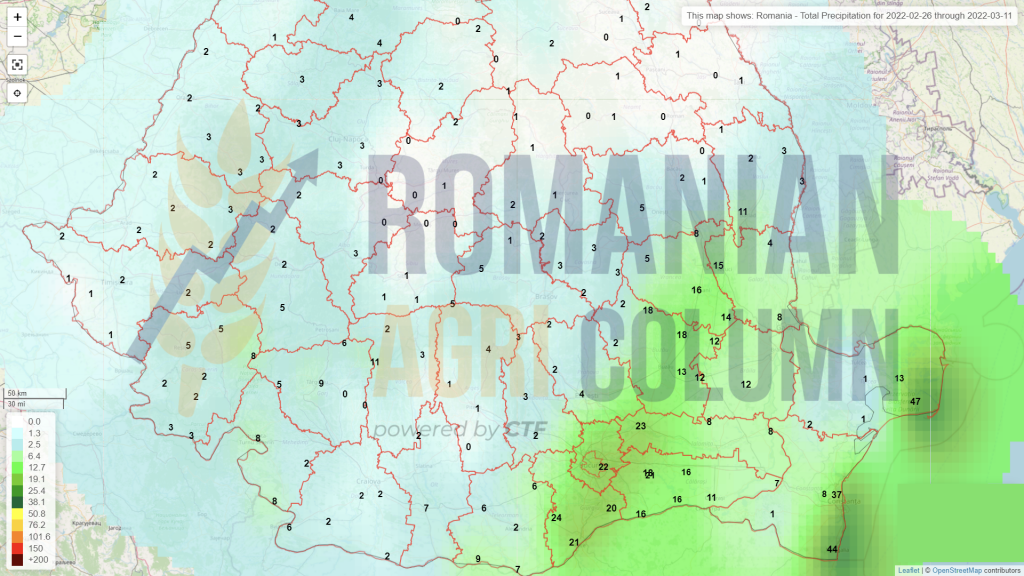
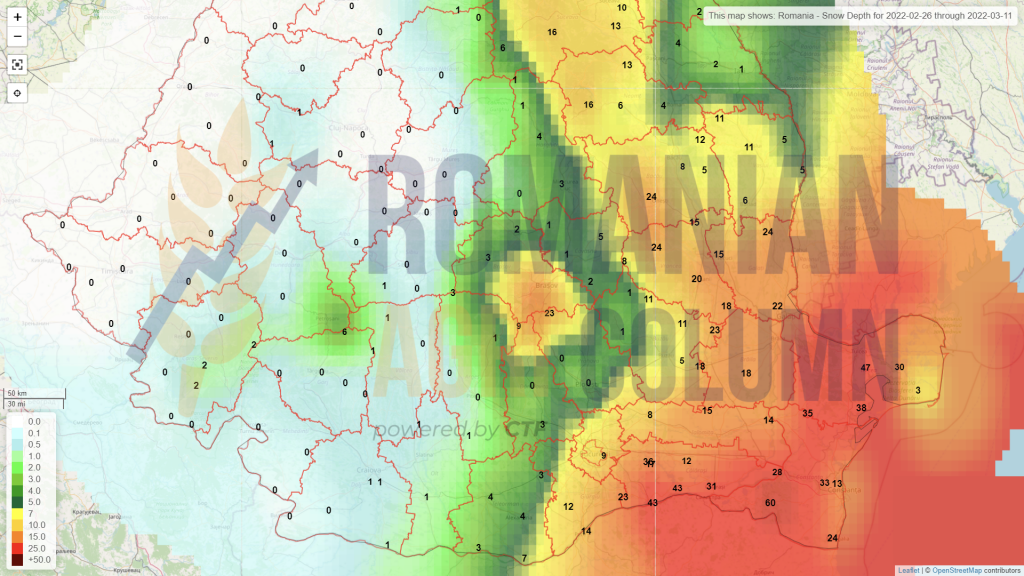
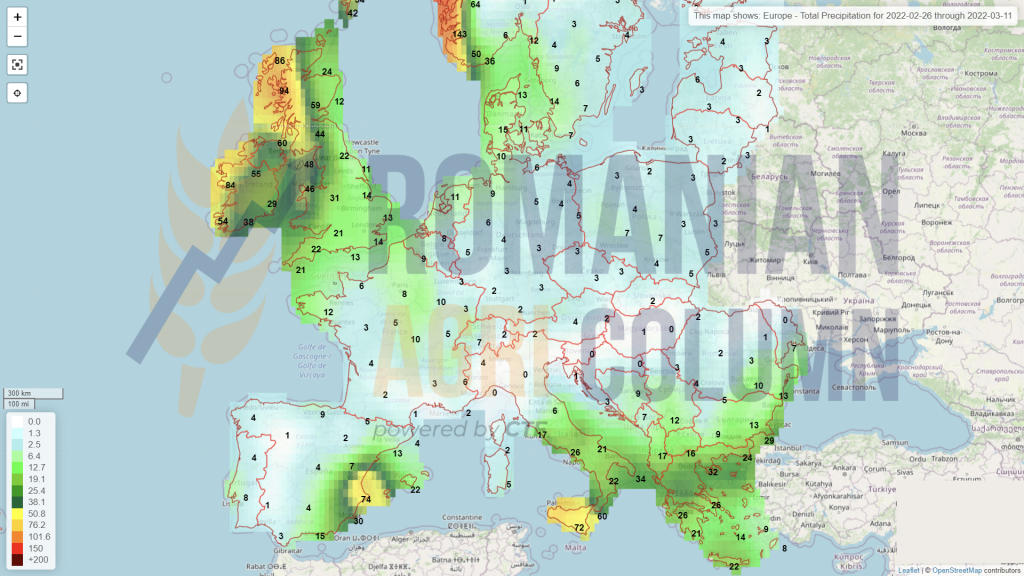
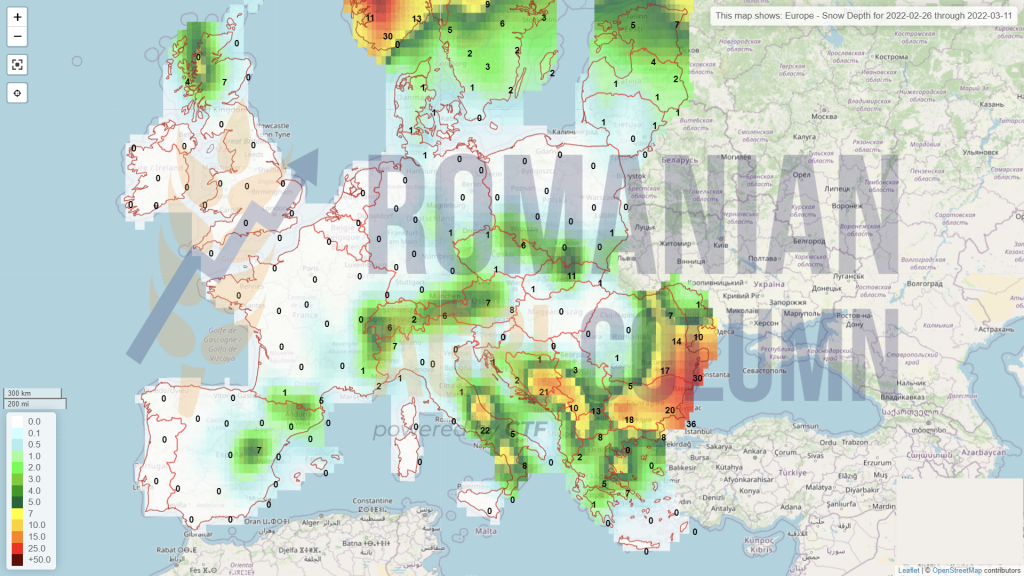
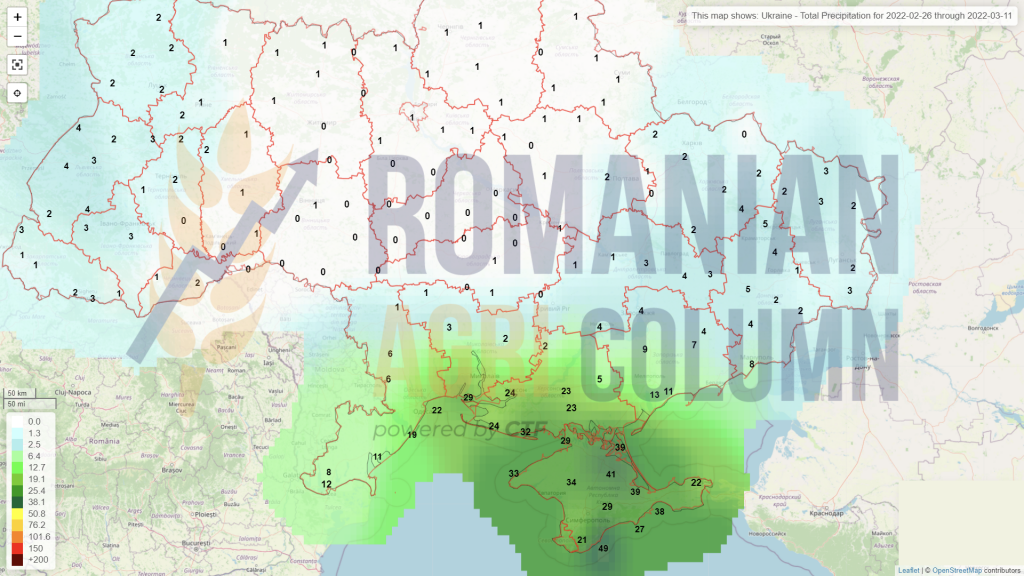
26 February – 11 March 2022
Romania (rain)
Romania (snow)
Europe (rain)
Europe (snow)
Russia

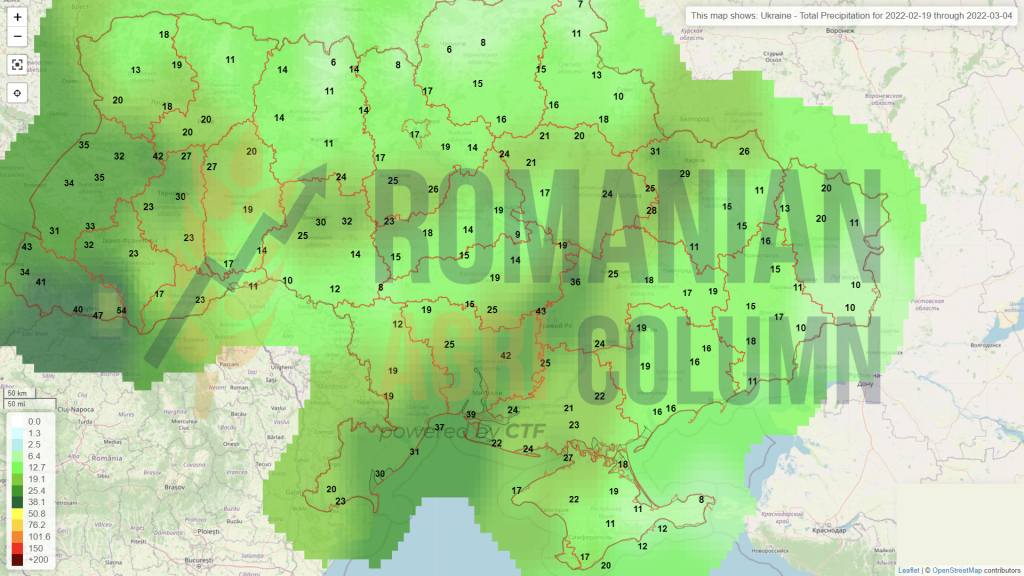
Ukraine (rain)
Ukraine (snow)
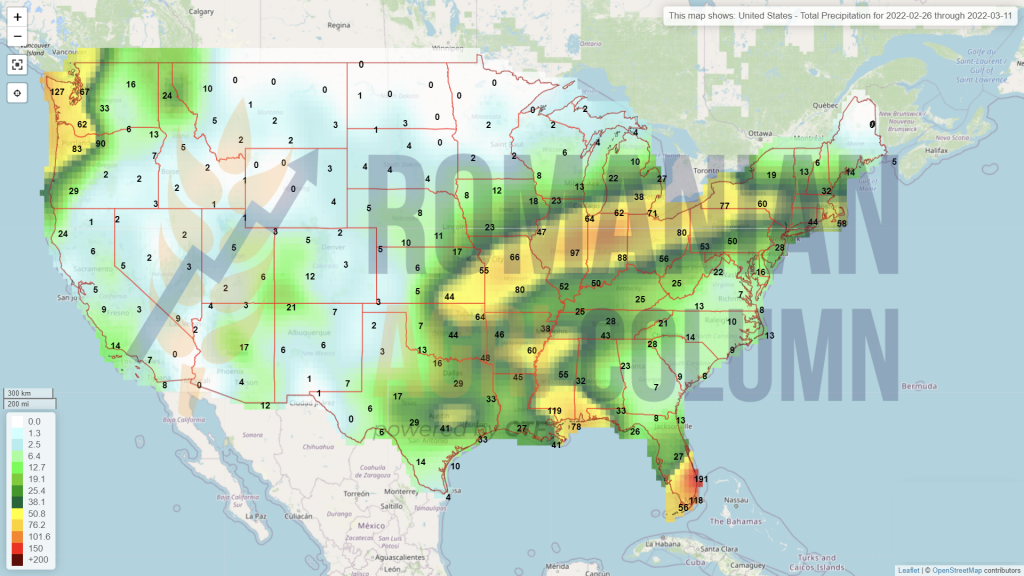
USA (rain)
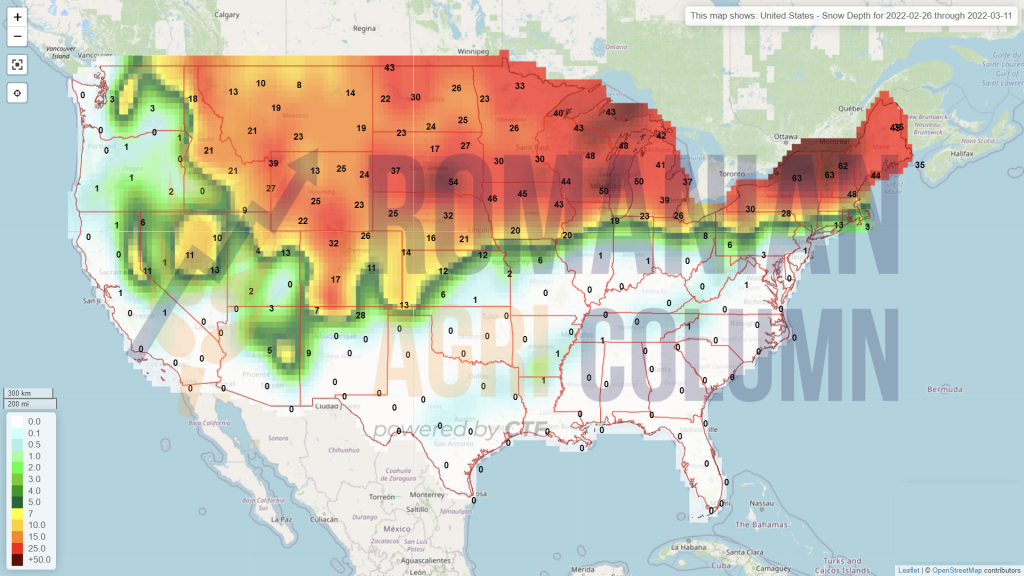
USA (snow)
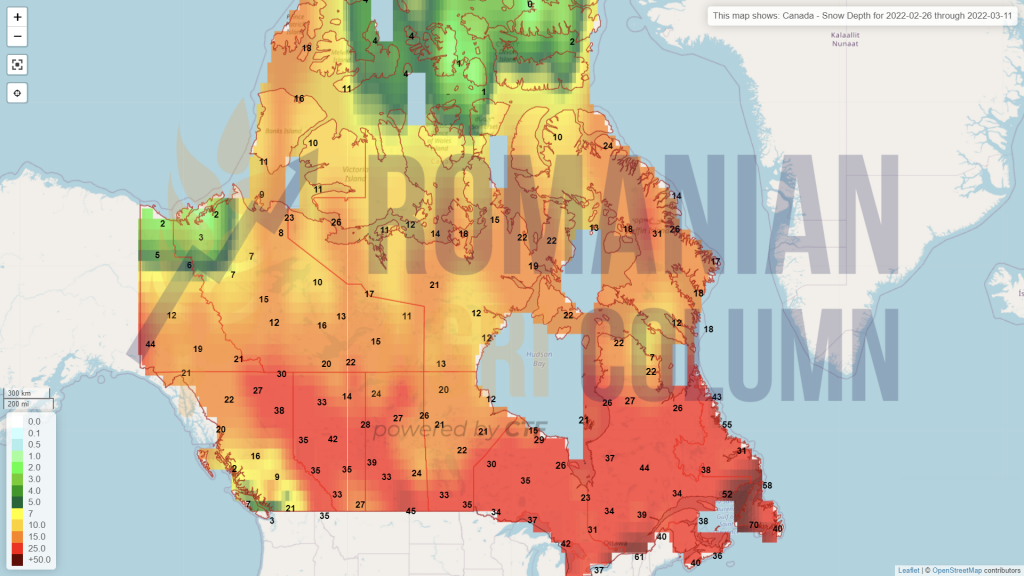
Canada (snow)
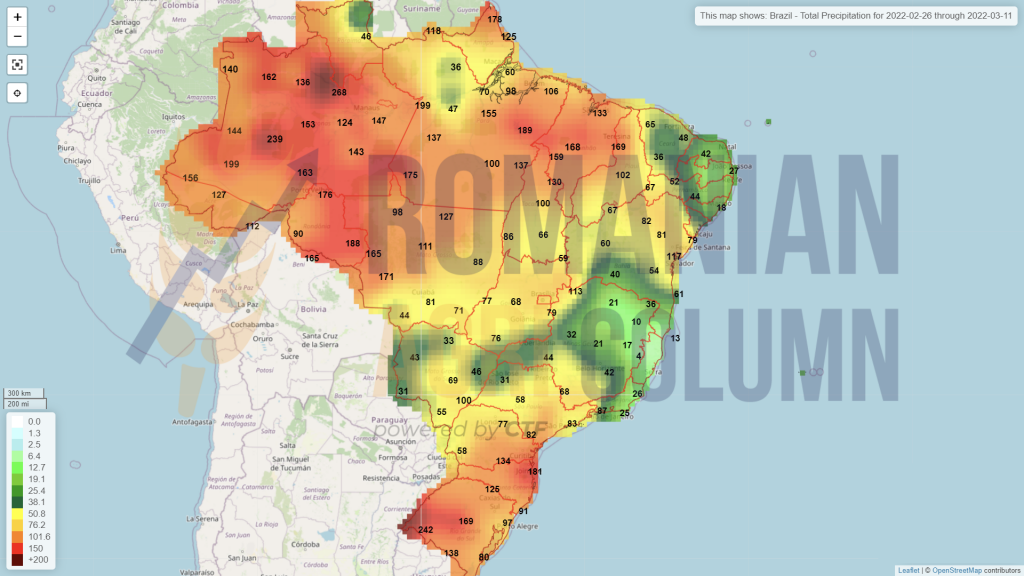
Brazil (rains)
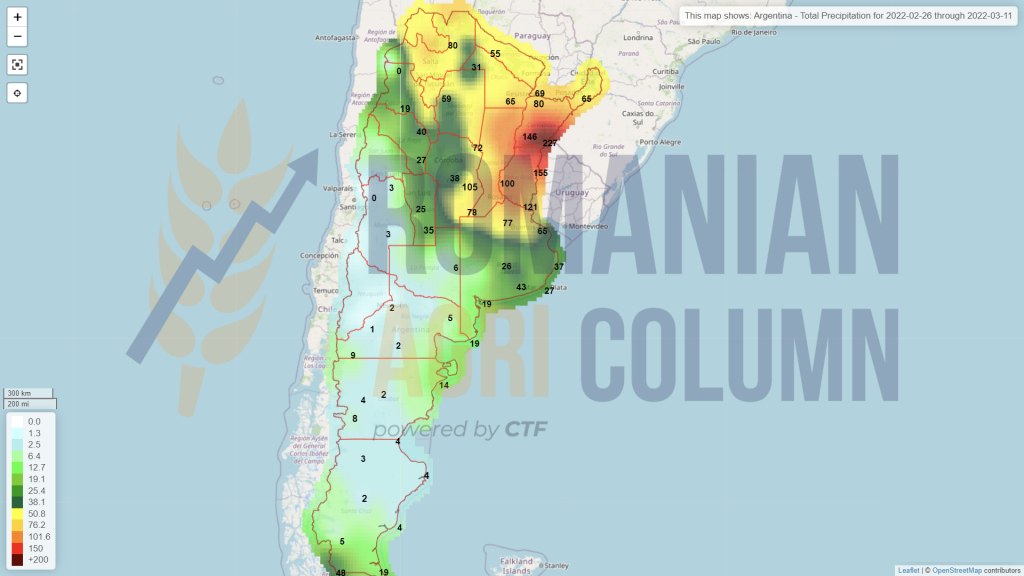
Argentina (rains)
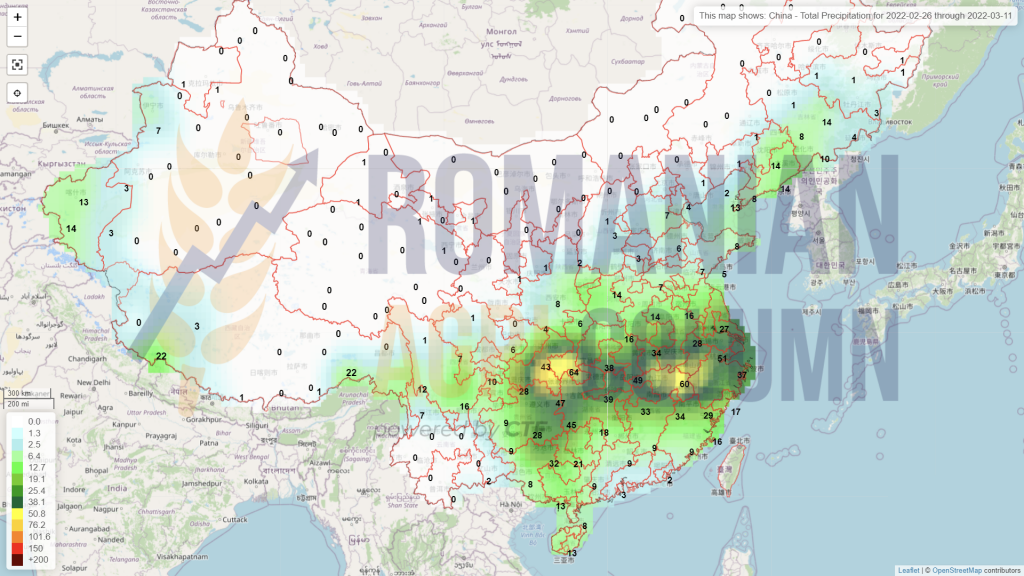
China (rains)
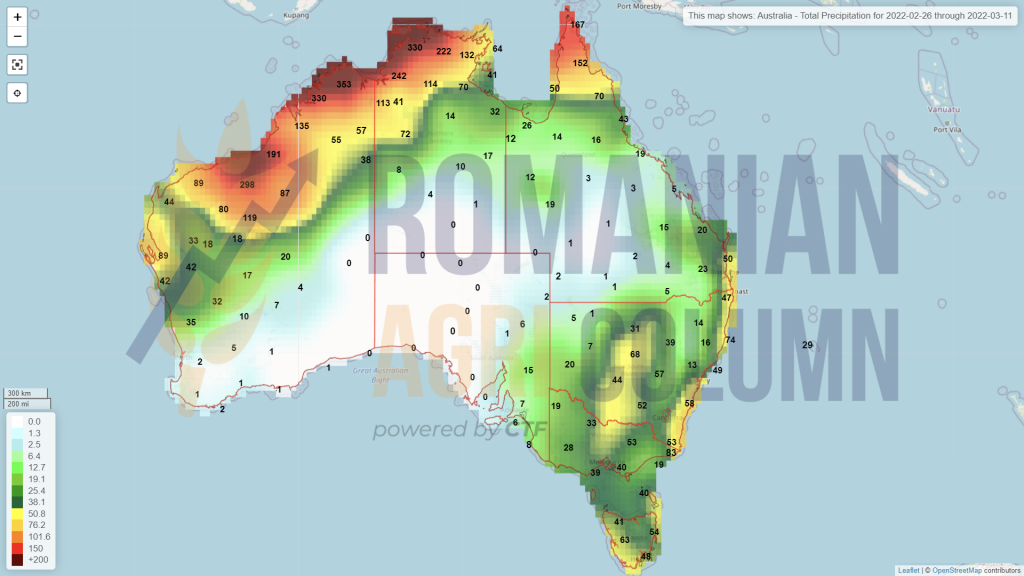
Australia (rains)