Last week was an atypical one for the cereals and oilseeds market. We have witnessed a phenomenon that we can call “The Real Black Friday” of the stock markets, with steep falls and slow returns. We will analyze them all below. This week’s market report contains information on:
- Wheat market
- Barley market
- Corn Market
- Rapeseed market
- Sunflower seed market
- The soybean market
- Line-up port Constanța
- FAO November Food and Goods Index
- EUR-USD parity
- Fossil energy
- Weather Forecast

Wheat market
The indications of the port of Constanța are at the level of 285-287 EUR/MT in the CPT parity. The deterioration of the price of wheat has nothing to do with the fundamentals of the market. This “Black Friday” phenomenon in the market started a week ago and has its roots in:
- The uncertainty generated by the lack of information on the new COVD-19 variation (Omicron). The potential danger to those already vaccinated has caused the panic to spread and thus the potential for lockdown to increase exponentially. Flights from certain African countries to Europe have been restricted as a first measure called the “emergency brake” by the European Union.
- Trading bots, the actual algorithms of stock exchanges, reacted promptly and entered RISK OFF mode, releasing long positions. This phenomenon was also aggregated with the fact that it was the end of November and the indications of wheat were changing to MAR22.
Degradation has been amplified and, if a week ago we were looking at the EURONEXT 310 EUR indication, against the background of the low demand (plus the effects of the rains in Australia), the minimum level reached this week was 285 EUR/MT. This mode of operation on the fault led to the level expressed earlier. We are talking about the damage because the buyers did not take any risk, preferring to leave the market one by one and wait for the effects.
However, after two or three days of continuous decline on all stock exchanges, on all categories of goods (including sugar, coffee, orange juice and vegetable oils), the green color began to return, slowly but steadily, according to the saying “the bull climbs the stairs and the bear jumps to the floor”, with a direct link to the Bearish and Bullish terms in commodity trading.
EURONEXT MLH22: TREND AND V FALL
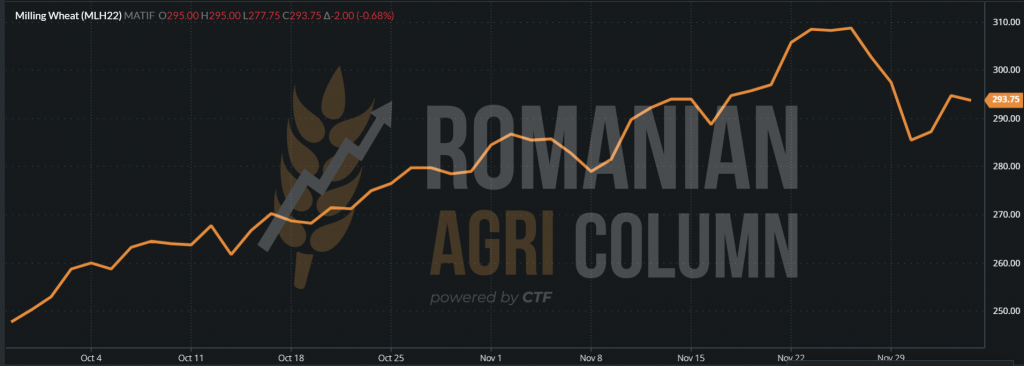
EURONEXT MLH22 at the close of December 3, 2021. A new profit taking session.
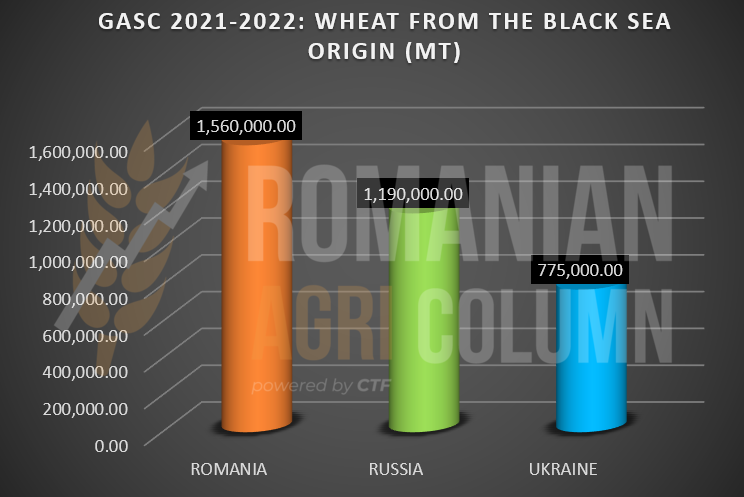
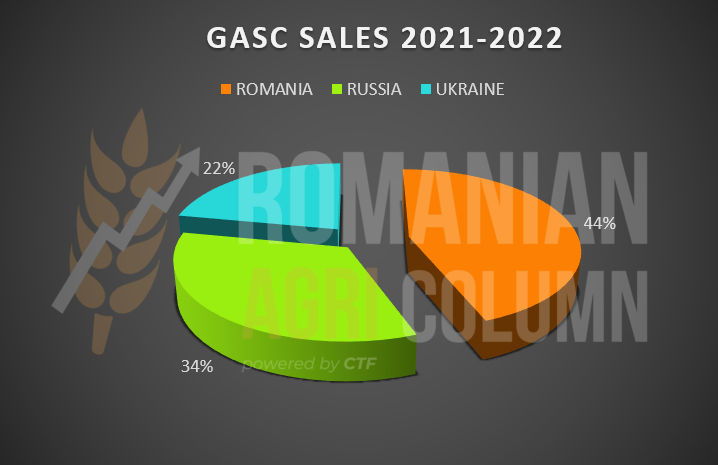
In the meantime, the world has moved and we noted the GASC tender of November 29, 2021. The forecasts were not the most optimistic in terms of volumes, but the Egyptian authority nevertheless purchased 600,000 tons of goods, as shown in the table below. It should be noted that this volume of goods purchased in a single tender by Egypt is the largest from 2008 to date.
Romanian wheat generated a volume of 240,000 tons, which consolidated Romania’s leading position in GASC wheat sales for the 2021-2022 season, with a share of 44% of the 3,525 million tons sold so far. It should be noted, however, the logistical discount generated, of about 10 USD/MT. If the penultimate GASC generated transport quotations of 35 USD/MT, they decreased to 25 USD/MT in the case of the last tender. In this way, Romania, from the underdog in the Black Sea basin, becomes the leader of the pack, the young Carpathian Wolf, and maintains its place. We mention that, traditionally, Egypt buys through GASC about 5.5-5.8 million tons from the Black Sea basin.
Remaining in the area of tenders, we have the following events:
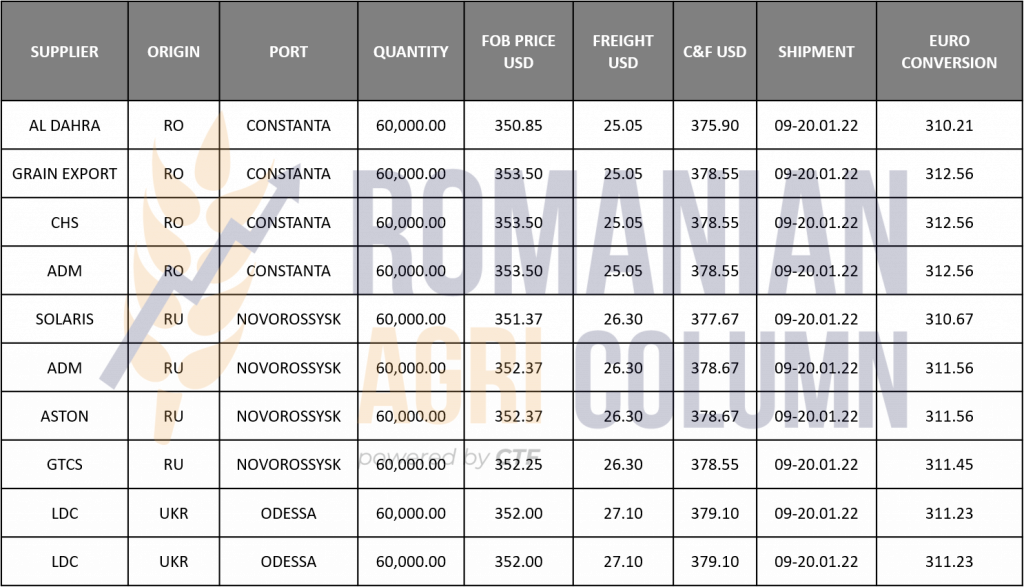
- Jordan generated a tender for the purchase of 120,000 tons of wheat, of which it purchased 60,000 tons at a price of 351.5 USD/MT CFR Aqaba. Delivery is between 15-30 June 2022, which shows the price indication for wheat crop 2022. Extrapolating the cost of transport of about 35 USD/MT, we have an indication of 316.5 USD/MT FOB Constanța, which leads to 311 USD/MT CPT, including exporter’s margin. Converting to EUR at a parity of 1:1.13 results in 275.22 EUR/MT. Taking out the exporter’s margin, we are led to the level of 270 EUR/MT, let’s say, the price for the new crop.
- Tunisia purchased 4 batches of 25,000 tons of wheat at the following prices: 382 USD/MT, 385.68 USD/MT, 387.68 USD/MT and 383.4 USD/MT, C&F parity.
- Saudi Arabia has closed a tender for the purchase of 535,000 tons of wheat, but the results will be published only on Monday, December 6, 2021. We note that the delivery will take place between May and July 2022.
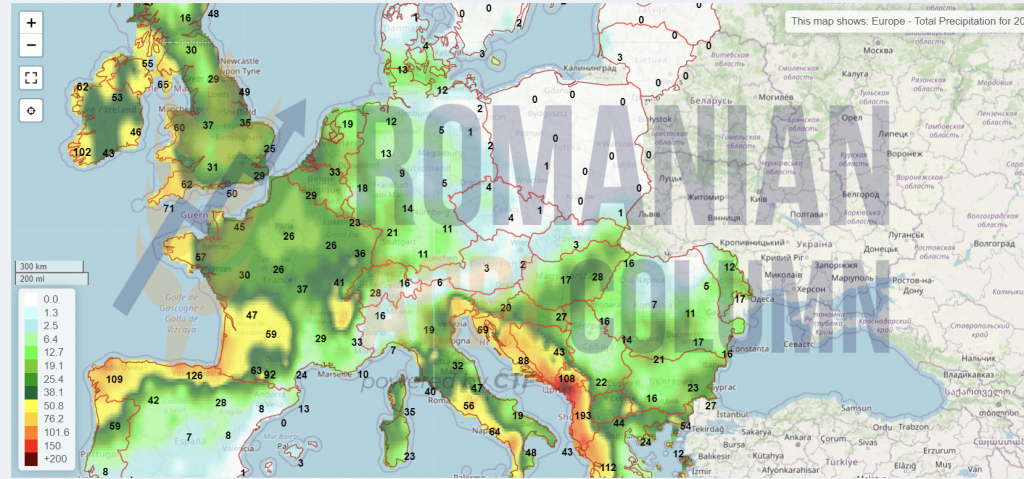
The future crop looks good in the European Union. GEOSYS indicates the green color for the EU and Romania, by default.
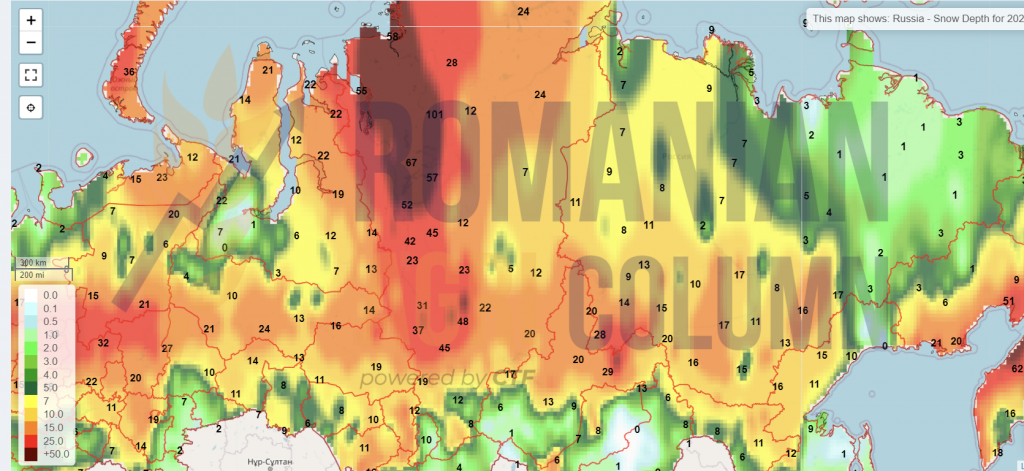
Russia and Ukraine have several areas to monitor, as water shortages have led to uneven development.
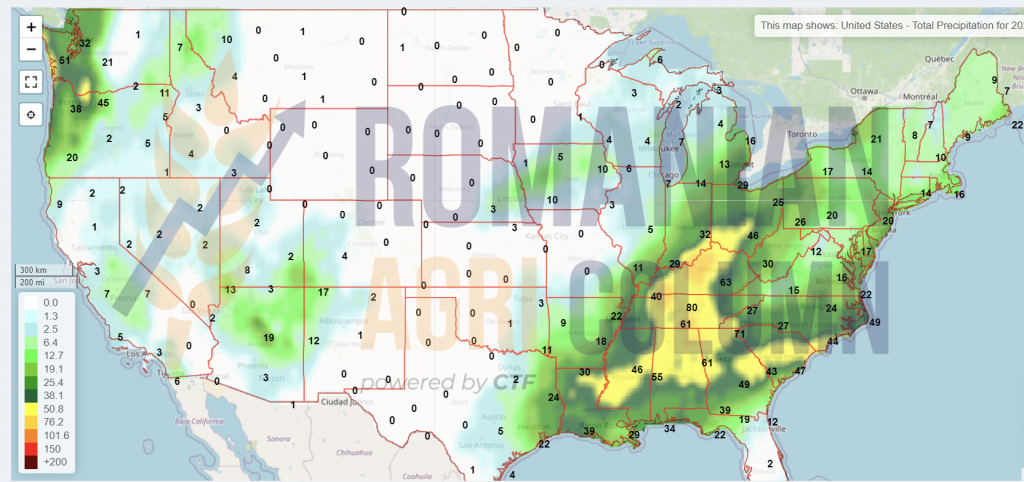
Overseas, American wheat has a 92% growth rate, with a good to very good rating of 44%. Basically, there are no major changes at this time. However, the problems in the USA are caused by the lack of precipitation in the Central Plains, as well as on the classic West Coast, which could affect the production of American winter wheat. But we are far from a verdict right now.
In Australia, rains are deteriorating wheat quality and, despite ABARES ‘highly optimistic 34.4 million tons of crop forecasts, estimates and initial reports lead to 5-10 million tons of protein below 10%. There are cases of buyers who would pay an additional 10% on the goods if they had the milling quality. We also note cases in which sellers are put in a position to replace the goods sold for export due to the very low level of the protein parameter.
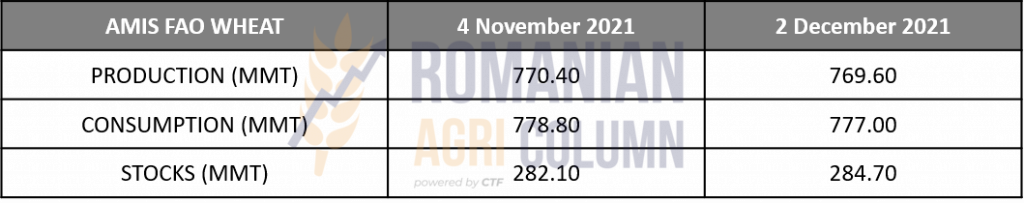
FAO AMIS DECEMBER 2 – WHEAT:
- Global production is down about 1% from last year, due to estimates from the UK and Brazil.
- Consumption is declining due to the pace of use in animal husbandry, especially in the EU, but is still 2% higher than last year.
- Stocks are growing. However, we expect a decrease of 1.7%, especially at the beginning of the harvest. We find these trends in the stocks of the largest exporters.
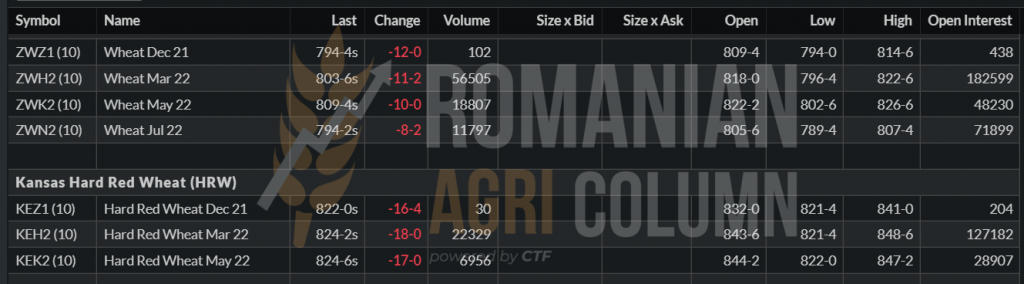
The CBOT indications show us the continuation of the profit taking effort generated by the investment funds. It’s a setback to last week’s activity. Minus 11 c/bu CBOT.
Russia is announcing unofficially, but with direct nuances through Interfax, the establishment of an export quota for wheat starting with February 15, 2022, lasting until June 2022. The quota would be set at a maximum of 9 million tons.
We are trying to dissect this announcement and see the level of Russian exports at the end of November 2021 at a level of 16.6 million tons. Russian analysts said the Russian export level was 34 million tons, compared to 36 million, according to the USDA. For a correct calculation, let’s try to take as a reference the figure of 35 million tons, from which to subtract what has been exported so far, i.e., 16.6 million tons. We have a difference of 18.4 million tons. From this figure we subtract the quota, hypothetical for the time being, of 9 million tons and we have much more clarity, i.e., the figure of 9.4 million tons. This figure must be completed by Russia between December 2021 and February 15, 2022, i.e., 2 and a half months, during which time there will be an operational gap produced by the holidays.
To achieve this volume, Russia needs to export at a rate of 4.7 million tons per month, calculating the 2-week operating gap due to the winter holidays, not to mention the potential for severe weather, which can affect Russian port circuits.
We must also discuss one of the traditional destinations in Russia, namely Egypt, which at this time has exceeded the purchase volume of 5.3 million tons, adding the 3.525 million from GASC procurement and the difference from private procurement. Traditionally, Egypt closed the year with figures of 5 million tons. So here we have a closed destination, where Russia can no longer compete.
In these circumstances, we do not believe that Russia will be able to find the resources needed to achieve the proposed figures. It will most likely end at 31 million tons, total export 2021-2022.
As a conclusion to the above, we see the media action launched by Russia only as an attempt to manipulate the market, in order to increase the price of goods, taking into account that they are late. What is left to export must be very expensive. We are considering a scenario in which they will raise the market and export as much as they can, based on two factors. The first is their internal market, which will react in panic mode. Farmers will sell en masse to export companies, most of which are controlled by the Russian state. The second factor will be the marking of profit through massive exports at high prices, after which, in February, the market will be flooded with much cheaper goods.
Our recommendation is clear – do not fall into the Russian trap in January. Try to maximize the potential until January 15-20, because all appearances lead after that date to a much larger volume from Russia, which will inevitably lead to lower prices. In February, we will have a much clearer view of the new crop.
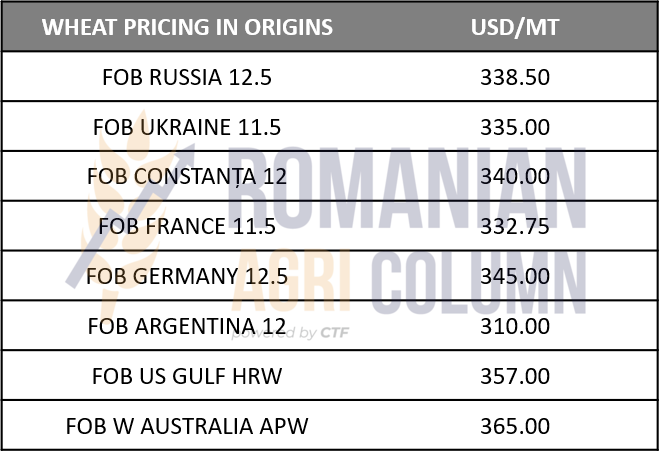
GLOBAL INDICATIVE PRICES IN ORIGINS
ANALYSIS
- The BLACK FRIDAY generated by Omicron-induced panic, aggregated with the effect of trading boxes entering RISK OFF mode, degraded the price of wheat globally, the fall being consistent.
- The return is slow, with caution resulting from the uncertainty generated by the potential effects of the new COVID-19 strain.
- Global production is low, according to AMIS FAO.
- Australian wheat, despite its volume potential, has a feed potential of 15 to 30%, due to non-stop rainfall in the agricultural areas of Queensland, New South Wales and Victoria.
- Wheat will recover and be repositioned in price, in the context of supply and demand, but until when? The Russian Federation has the answer – certainly in January. Until then, the Russian wheat export tax will increase to 84.9 USD/MT.
Barley market
The indications of feed barley in the CPT Constanța parity are reduced to around 250-252 EUR/MT. The effect of the fears related to the adversity of the new strain caused the barley to receive a rebound of 7 EUR/MT. From Monday, December 6, 2021, with the return to activity, the quotations should start to rise slightly.
Demand remains high. The global negative balance is the main indicator in this regard. Australia has a production of over 13.7 million tons, but the deficit remains.
However, Australia is penetrating the Middle East market, with its targets being Jordan and Saudi Arabia. But the Saudis have reduced the level of barley imports, so Australia needs to find sales in other destinations, given the coldness of its relations with China, Australia’s main barley buyer.

BARLEY NEW CROP: Jordan purchased 60,000 tons of barley, the new crop, with delivery June 15-30, 2022, at a price of 307 USD/MT CFR Aqaba. At this point, we have a clear indication about the start of the next campaign. From the price of 307 USD/MT CFR Aqaba, we deduct the transport cost of about 35 USD/MT. We remind you that as oil prices are low, transport prices have also fallen. So we have an indication of 272 USD/MT in the parity of FOB Constanța. We calculate the fobbing cost and we get a price of 265-266 USD/MT CPT Constanța, with the exporter’s margin included. We convert to euros at the parity of 1:1.13 and we get 235 EUR/MT, as the first indication for the new crop.
Corn market
The corn suffered from the same pressure generated by the factors described above, namely the Omicron and Risk Off effect generated by the trading algorithms. Thus, the corn is quoted these days at a level of 235 EUR/MT CPT Constanța, of course, with a variability of 1-2 EUR in a positive sense. It’s all about volume.
EURONEXT rates corn much more stable than wheat, where the correlation with the physical market has been lost and Basis minus Premium is no longer calculated.
Thus, we have the closure of 3 December 2021 set positively at a level of 245 EUR/MT, which reflects in the case of BASIS (255 EUR) – PREMIUM (10 EUR) = 245 EUR.
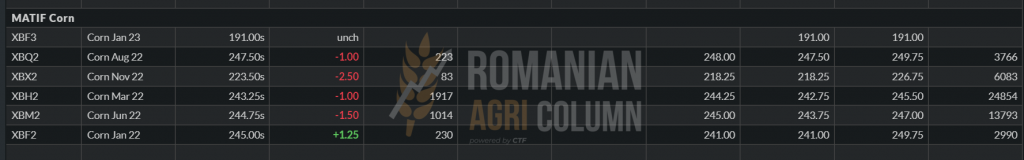
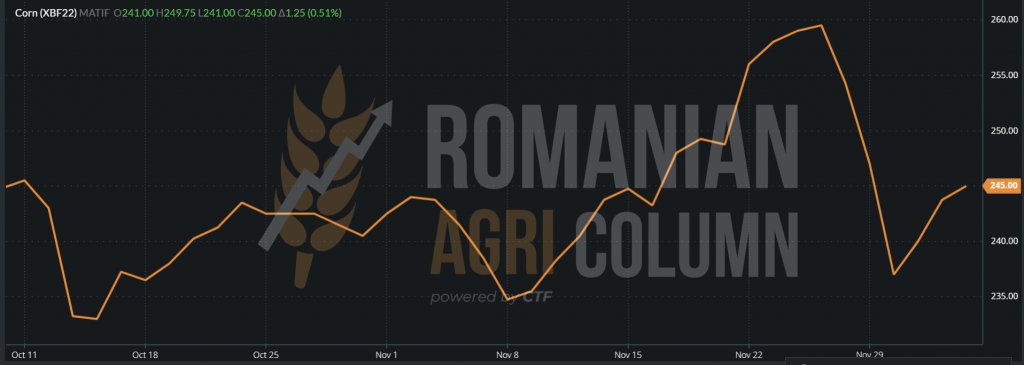
EURONEXT CORN XBF22 – TREND GENERATED BY “THE REAL BALCK FRIDAY OF GRAINS”
The volumes of corn are still being harvested in the northern areas of Romania and the humidity pressure is making its mark on the goods. Harvesting farmers have fewer and fewer drying options (here called operating facilities) and are forced to accept a much lower price, discounted by the cost of drying, which has risen to levels of 4 EUR/MT. The cost of drying is fueled by the cost of gas, which shows no signs of calming down. At European level, stocks are already much smaller than previous estimates and the tension caused by North Stream 2 is floating in the air. A single spark could start a conflict in the eastern theater between Ukraine and Russia.
Speaking of Ukraine, we notice an optimism generated by simplistic calculations on paper, namely the area multiplied by production per hectare increasing compared to the latest revisions. Everything seems clear, but two elements are not taken into account symmetrically, as in the case of Romania.
Ukraine, based on the latest measurements, indicates over 40 million tons. However, the percentage of water is excluded from this calculation, namely the 5-7 percent above the 14% standard. A simple arithmetic formula indicates that 40 million minus 7% is, in fact, 37 million. This is, in fact, the commodity that is actually paid for, not the excess water. The second element that is not taken into account when generating the level of exports, apart from domestic consumption, is subsistence.
Everything that is used in the village and communal households on the Ukrainian territory represents the volume that is not seen in the commercial circuit in any form. Farmers and peasants make a living by raising animals (pigs, cows, sheep, goats and birds). This volume used in one’s own households is not seen in the flow, as is the intra-village trade. This is how people live, this is how they provide their daily food, and this is normal. Leaving Romania, where about 4 million tons disappear in this black hole and extrapolating to the level of Ukraine as a population level, we can reach respectable figures.
However, we do not expose them, pointing out that they are not taken into account in any way by Russian analysts, who issue analyses of Ukrainian production.
In Europe, crop forecasts are at an estimated level of 67.8 million tons, with an import potential of just over 15 million tons. We clearly remember Europe because the 25% protectionist tax on American corn has been eradicated and so we can see the Iberian Peninsula flooded with American corn. Given the much more relaxed transportation costs and the cost from the US GULF to the NW Mediterranean is 18 USD/MT, there may be a shift between US and Ukrainian-generated Black Sea basins.
At the same time, Ukrainian origin remains the first option for China, at least for now. Shipping costs are much more relaxed, due to the fall in the price of crude oil below 70 USD/barrel in the BRENT quotation and we see a Black Sea – NE Asia cost of 48-49 USD/MT, compared to US GULF 68-69 USD/MT to the same destination. The Argentine origin cannot yet compete with the Black Sea due to the level of 57 USD/MT of transport. Only the Brazilian one can relate, at a cost of 51 USD/MT.
This opens up potential for American corn, which has been severely penalized in terms of export volumes due to the events caused by Hurricane IDA. But their traditional export areas have not been altered, but instead fueled by low production in Brazil. And one of the traditional customers is Mexico, which generated import volumes of American corn of 13.4 million tons in the first 10 months of 2021, compared to only 11.9 last year, calculating the same period.
The Asian operational theater is therefore in the Black Sea basin, due to logistical costs and will be fed as long as availability exists. This can be seen from the strength of the indicative price in the port of Constanța, which has deteriorated, but remains firmly at the level of 235-237 EUR/MT.
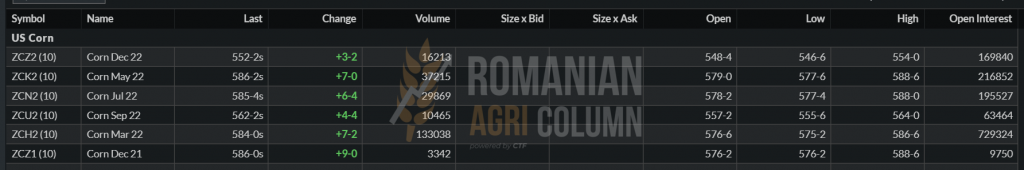
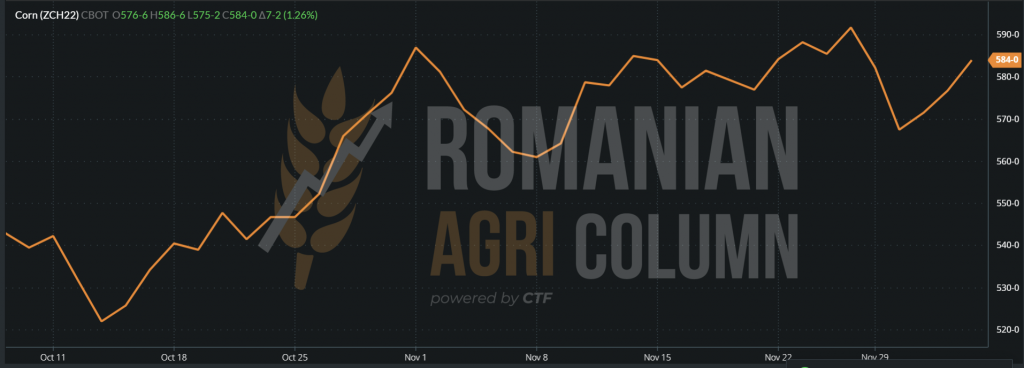
CBOT indicates a level of 584 c/bu (230 USD, up 7 c/bu), which guarantees our analysis above.
TREND CBOT ZCH22 | one can observe the V (which was not as pronounced as at European level) and the return much closer to the initial level, identical in comparison with the European indications.
FAO AMIS DECEMBER 2, 2021 – CORN
- Overall maize production is growing due to the increase in the forecast for the American and Ukrainian crops. Globally, corn production exceeded 3.6% last year.
- Consumption is increasing due to US industrial use in ethanol production. In this way, global consumption increases by 2.6% compared to last year.
- Stocks are rising due to US and Chinese recalibrations. In other words, the initial stocks have increased, and their inventory has generated this higher level.

GLOBAL PRICE INDICATIONS IN ORIGINS
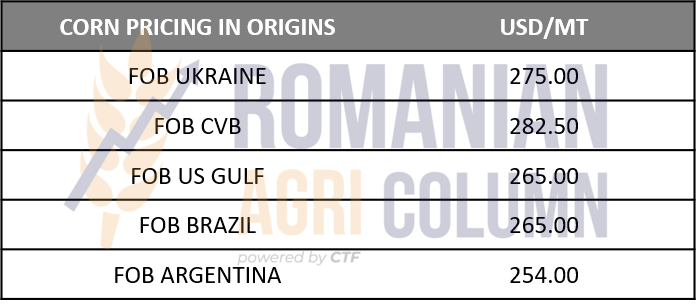
ANALYSIS
- Support for corn in the Black Sea basin comes from Asian acquisitions.
- The US will complete the European requirement by eliminating the EU import tax.
- Demand is steady and sustained. The signs of stability, even in the conditions of impact Omicron and Risk Off, are indicated by the quotations CBOT and the formula Basis minus Premium of Euronext
Rapeseed market
Rapeseed has endured the Omicron panic effect accentuated by the decrease in fossil energy indications and the effects have been seen in the quotations of this truly Black Friday. The fall was abrupt, and the side effect was frightening among farmers who planted rapeseed in the fall of 2021. They began to prospect the market in search of new crop buyers.
However, buyers are not willing to sign forwards yet. The market is constantly moving and degeneration could be a factor in addition to the uncertainty of the coming winter over Europe and the Black Sea basin. The GEOSYS forecast indicates a good state of vegetation at European level, a uniform emergence throughout Europe, the green color in general being predominant at this time.
We will retrace the route of the decrease of the rapeseed quotations on Euronext starting with the day of the announcement about the South African strain, fact aggregated with the Risk Off of the trading boxes and grafted on the decrease of the crude oil quotations. We observe the generated V, as well as the return due to the partial dissipation of the uncertainty.
EURONEXT XRG22 – V of sharp decline and return.
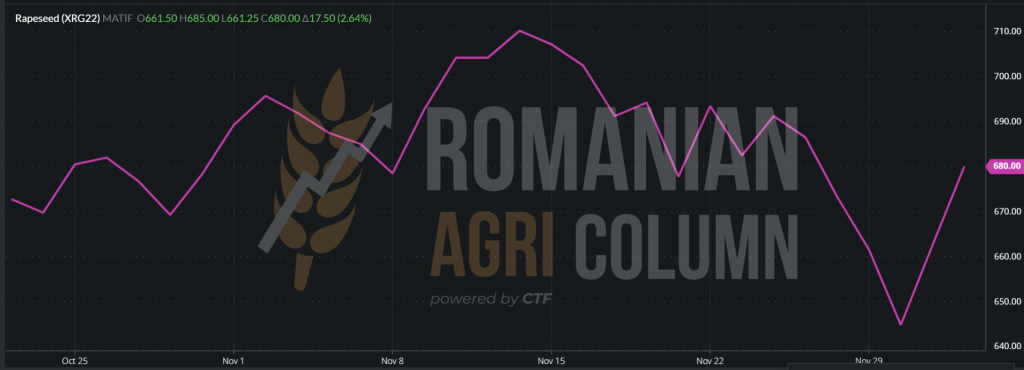
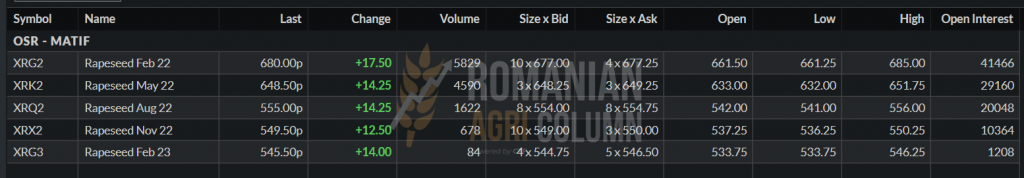
Rapeseed prices continue to consolidate. The climb was as spectacular as the descent. In the hours leading up to the Euronext trading session, we will record new increases, light and sequential, in line with crude oil.
EURONEXT | 3 December 2021 | The closing price was 682.75 EUR
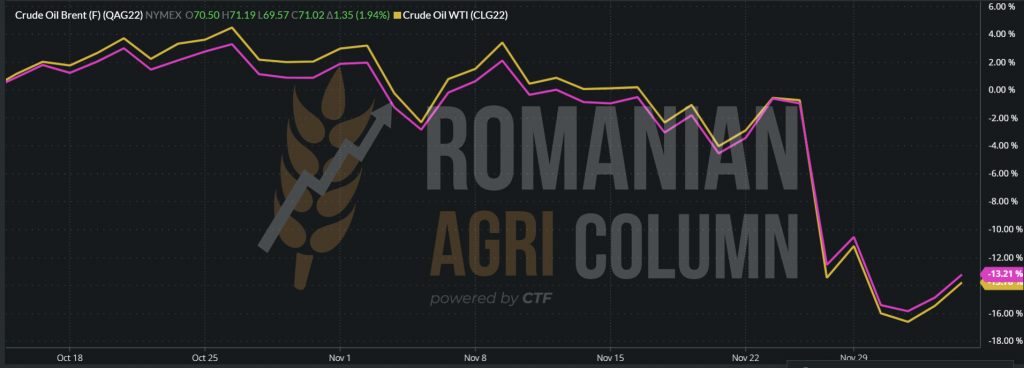
To have a complete picture, we also insert the trend of BRENT and WTI indications, both FEB22. The path is symmetrical and the steep drop is generated by the uncertainty born from the ignorance of the effects of Omicron.
QAG22 BRENT (pink) and CLG22 WTI (yellow)
Australia indicates a rapeseed crop surplus. The production forecast reaches the level of 5.73 million tons, compared to 4.8 million tons last year. The approximately 900,000 tons in excess partially offset the demand for rapeseed globally, but do not cover the deficit created by Canada due to the poor crop.
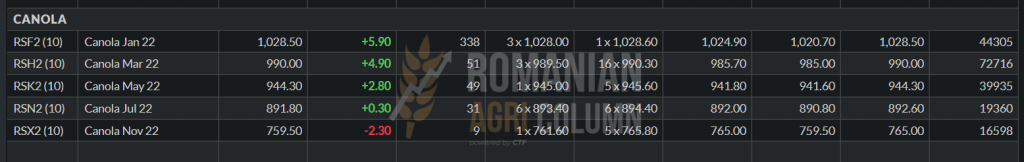
Arriving in Canada, the indications for canola (Canadian rapeseed) are also supported after the decrease. The climb is slow and transient, because the support will last a maximum of 2 months. Then we enter the perspective of the new crop.
RSF22 CANOLA: 1028.5 CAD
Sunflower seed market
The indications of sunflower seeds are at the level of 640-650 USD/MT in the parity of CPT Constanța or DAP Processors. The Black Friday story also affected the VEGOIL complex, and the declines were immediate. Fear of destination lockdowns has stifled sales potential, and buyers have disappeared from the sunflower vegetable oil market scene. The fundamental question, however, remains why a buyer does not have a vision of purchase at such times and does not consolidate his position in CSFO, as long as the fundamentals, i.e., supply and demand, remain the same and the uncertainty that generates such moments will dissipate in time.
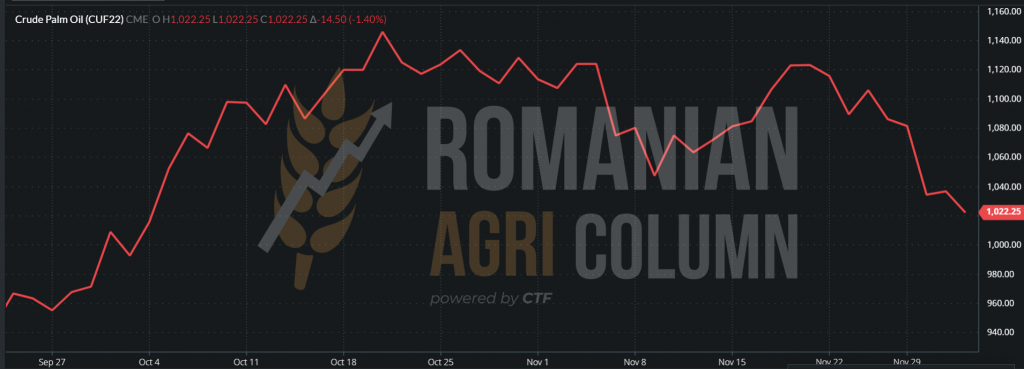
At the same time, India raises its forecast for imports of crude sunflower oil from 1.8 to 2.3 million tons, which boosts demand. A supporting factor should also be palm oil, which is declining sharply these days and the signs of recovery are not very obvious. This is due to two reasons, the first being a surplus of production and the second being its restriction on European markets.
OIL PRICES INDICATIONS: BLACK SEA – 6 PORTS – ARGENTINA

PALM OIL NYMEX JAN22 QUOTATIONS
Sunflower oil has no substitute for the European market and the Black Sea basin, including Turkey. The cultural definition is what makes it impossible to replace in the diet of the inhabitants of the areas mentioned above. Thus, we forecast the demand for raw materials at the same level. The degradation caused by the above causes will not cause long term price damage. We are already seeing the repositioning of the neighbors south of the Danube at the same level as a few days ago, i.e., at 660-670 USD/MT, in parity DAP Processor or Varna.
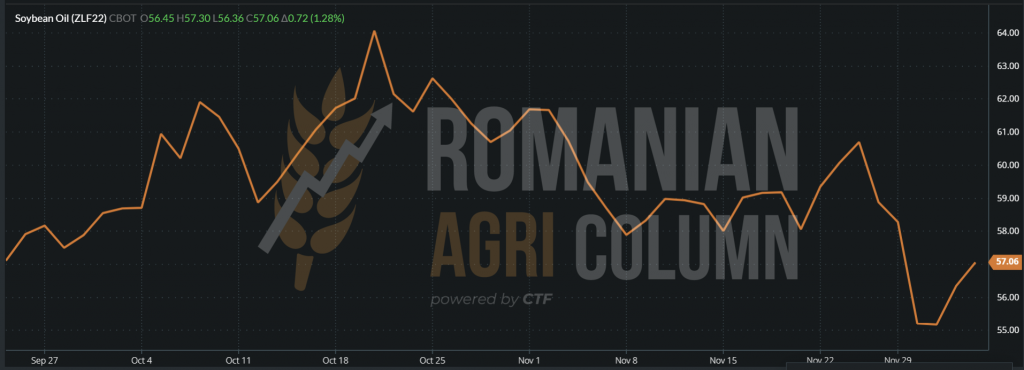
Soybean oil is another component of the VEGOIL complex, which also indicates a recovery, an important support in the VEGOIL complex.
The soybean market
At the local level, soybean transactions do not rise to high levels. The processors already have the stocks stocked and the levels of 620 USD/MT resist in the market, but the offers come from the buyers who do not have processing units and therefore the farmers cannot collect the coupled support. The forecasts of the Brazilian crop of 142 million tons, aggregated with the American crop, erode the interest due to the level of replacement in the port of Constanța. In other words, it costs less to buy grain from other sources than to buy it from the local market.
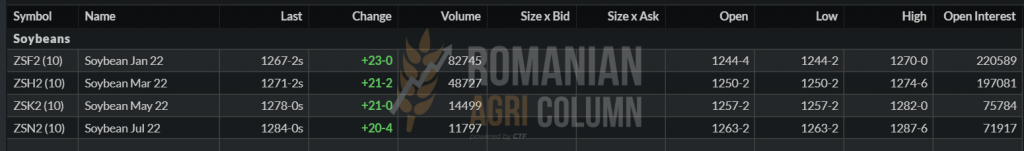
Soybeans are in line with the trend generated by the two aggregate factors, the panic created by Omicron and Risk off. Thus, we have registered significant decreases in CBOT indications in recent days. The route started on November 9 from the lowest level generated an ascending slope until the aggregation of the two factors indicated above. The effect was degrading on prices and we saw soybeans falling sharply again.
After the dissipation of the emotion and the liquidation of the positions by the trading bots, starting with December 2, the quotations started to rise in the same slow way.
CBOT SOY ZSF22 on December 3, 2021
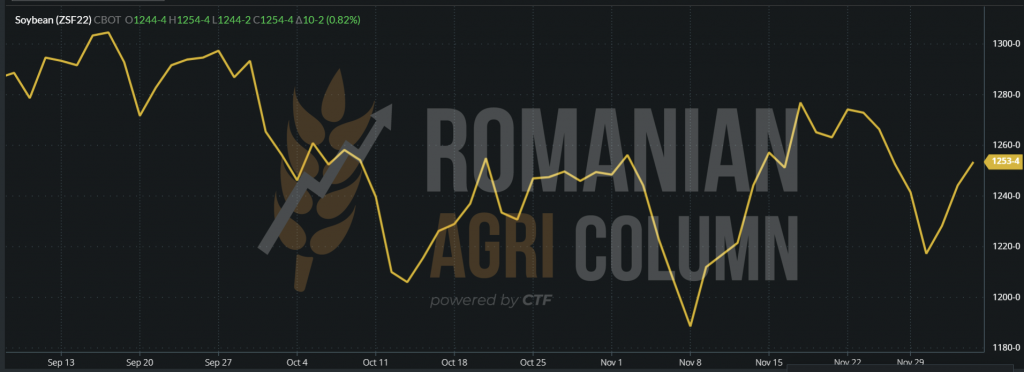
CBOT ZSF22 – soybean quotations from December 3, 2021 – increase of 23 c/bu (8.5 USD)
In the physical market, the United States announces a record 5.19 million tons of soybean processing, which is slightly above the record for October 2020. Sales on December 2 amounted to 295,000 tons, of which a volume of 165,000 have unknown destination and 130,000 have destination China.
In total, the United States brought sales of 2.15 million tons of soybeans in November, of which 1.4 million tons to China. However, the difference compared to the same time last year remains unfavorable by 23%. Encouraging to the US, however, is the origin, as maritime traffic from the US GULF to CHINA is much higher than from South America at the moment.
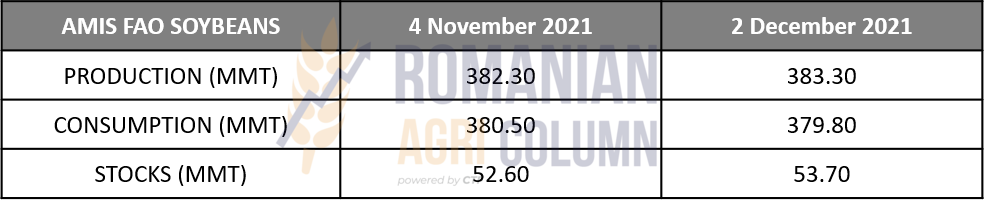
AMIS FAO has released its monthly global report on soybeans and we summarize its figures:
- Production 2021-2022 is increased by 1 million tons due to the positive revision in Brazil and India, which compensates for the lower level of production in the USA.
- Consumption is penalized by declining processing in China, given that a global consumption forecast is still in place by 3% higher than last year.
- Stocks grow subsequently, fueled by production forecasts in Brazil and the United States.
The FAIS AMIS report expressed in comparison vs. November vs. December (million tons)
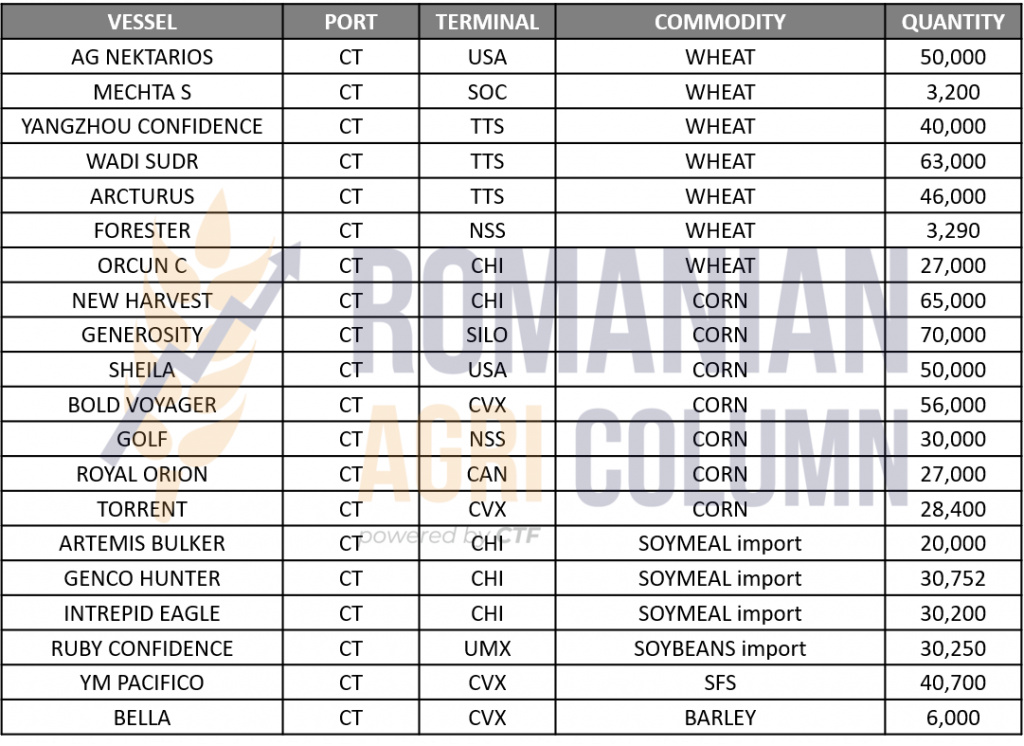
Line-up Port Constanța in the last days
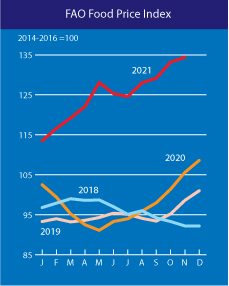
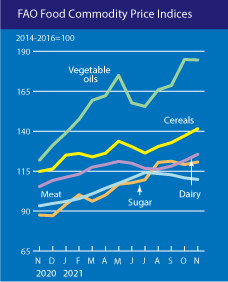
FAO November Food Price Index
The FAO Food Price Index (FFPI) averaged 134.4 points in November 2021, up 1.6 points (1.2 percent) from October and 28.8 points (27.3 percent) from November 2020. The latest increase marked the fourth consecutive monthly rise in the value of the FFPI, putting the index at its highest level since June 2011. Among the sub-indices, in November those for cereals and dairy rose most significantly, followed by sugar, while those for meat and vegetable oils were down, albeit slightly, from the previous month.
The FAO Cereal Price Index averaged 141.5 points in November, up 4.3 points (3.1 percent) from October and 26.6 points (23.2 percent) above its level one year ago. Strong demand amid tight supplies, especially of higher quality wheat among major exporters, continued to lift wheat prices for a fifth consecutive month, to their highest level since May 2011. Potentially reduced quality of the ongoing harvest in Australia, following untimely rains, and uncertainty regarding potential changes to export measures in the Russian Federation also provided support. Among coarse grains, international barley prices continued to rise on tight supplies and spillovers from wheat markets. Maize export prices rose slightly in November, receiving support from strong pace in sales from Argentina, Brazil and Ukraine, while seasonal supply pressure capped export prices from the United States of America.
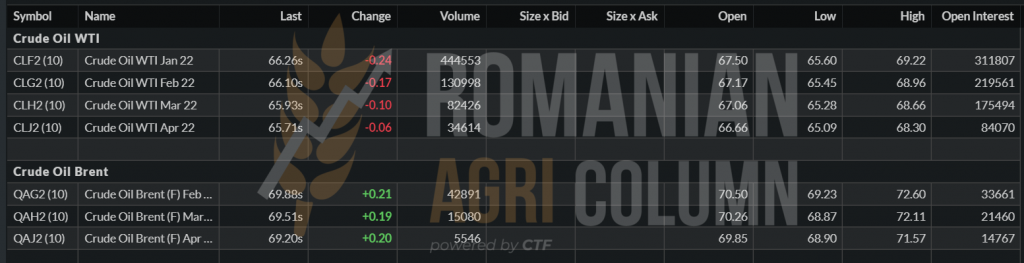
Fossil energy
BRENT under 70 USD/barrel | WTI – 66 USD/barrel
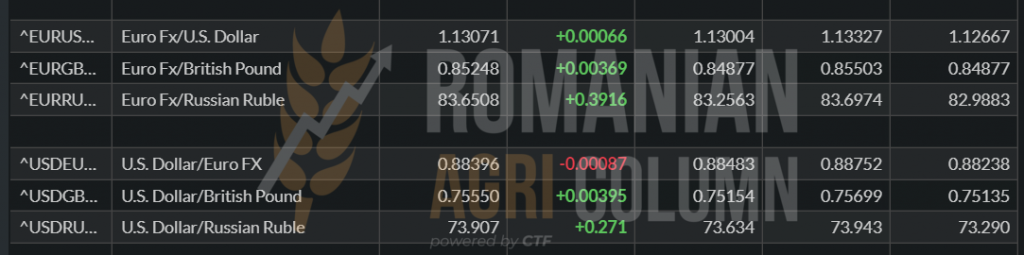
EUR-USD parity
EURO:USD = 1:1.13
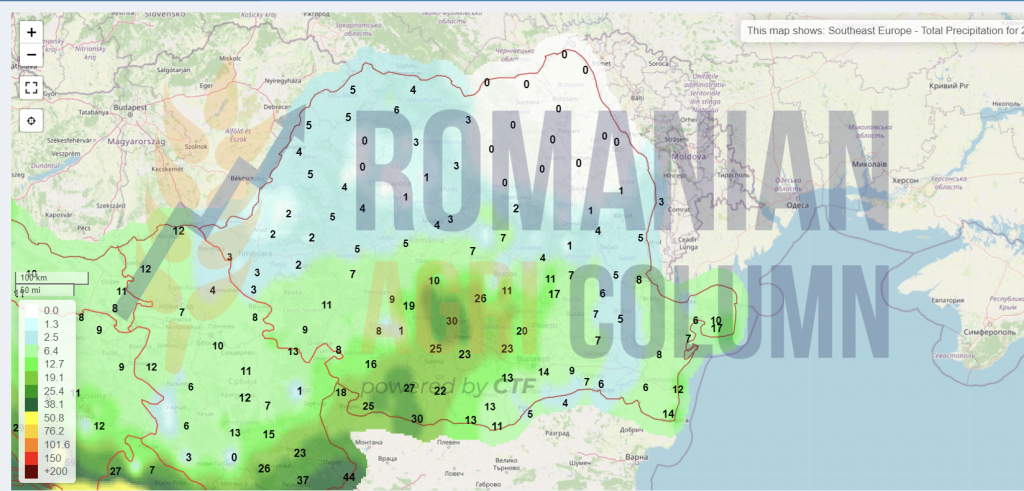
Weather forecast
4-11 December 2021
Romania
Europe
Russia (snow)
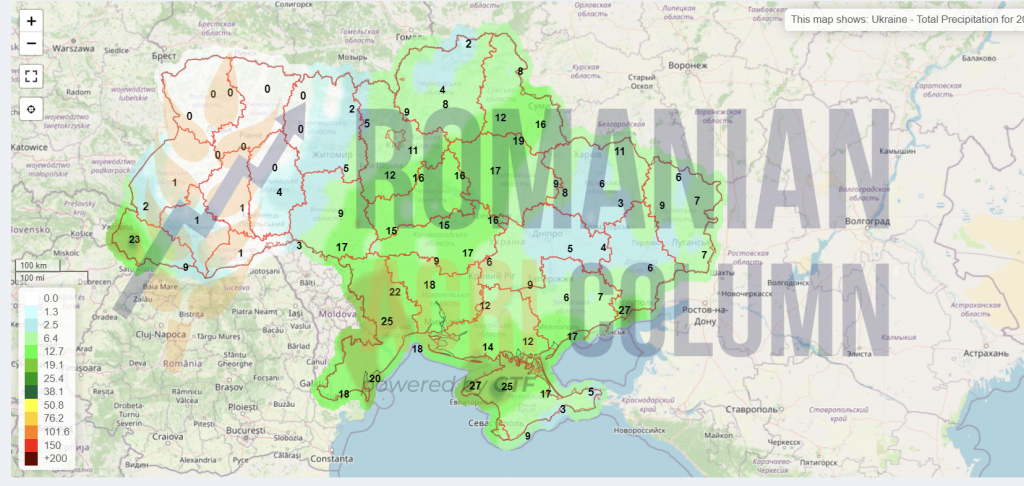
Ukraine
USA
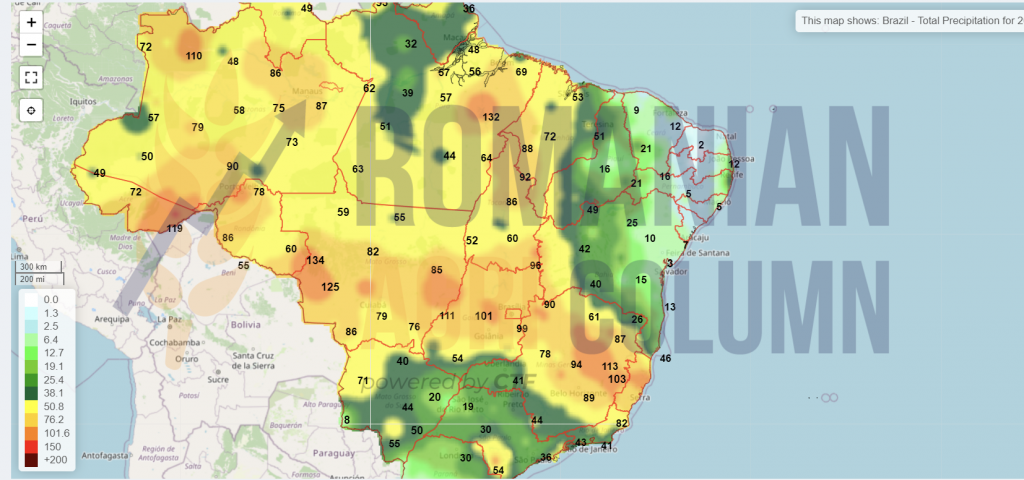
Brazil
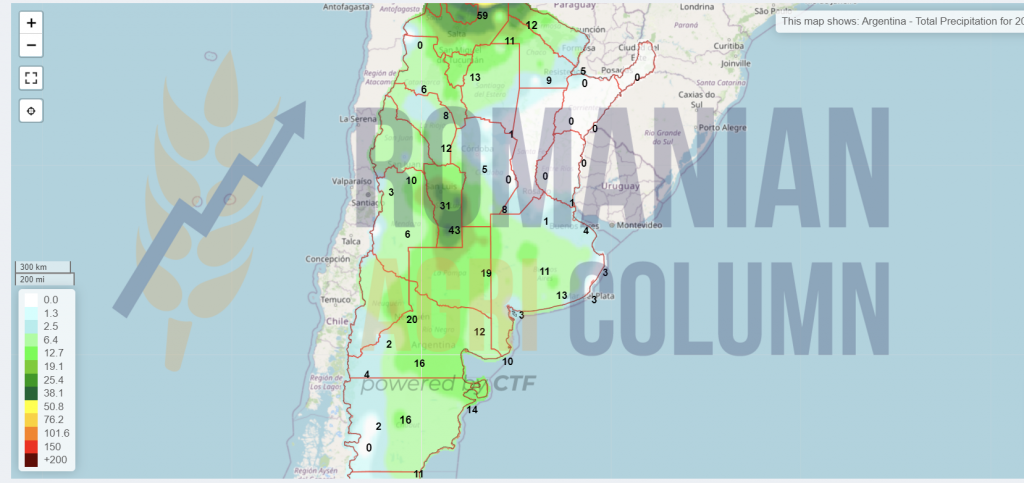
Argentina
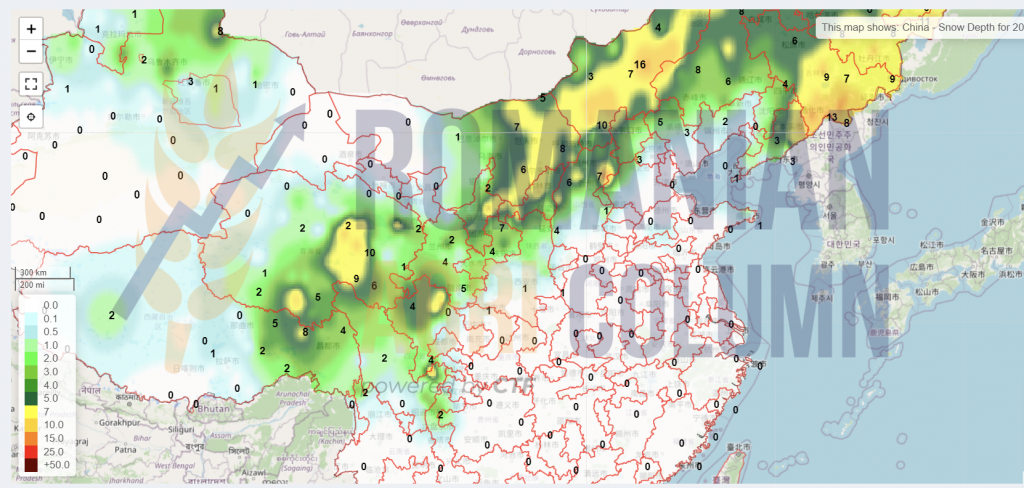
China (snow)
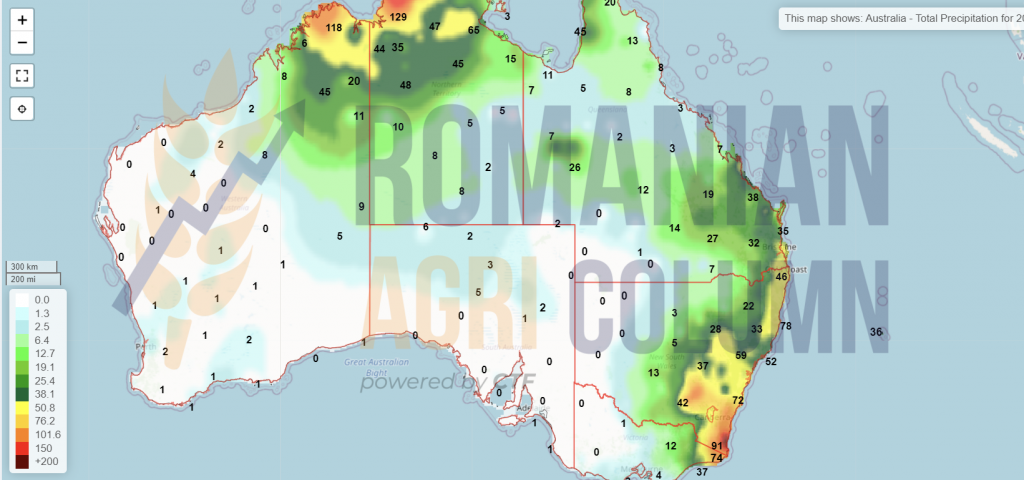
Australia
© Romanian AGRI Column, 2021, all rights reserved