This week’s market report provides information on:
FAO CEREALS
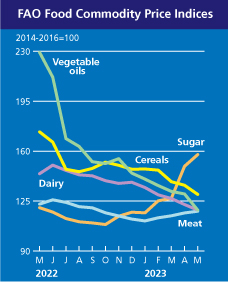
The FAO Cereal Price Index averaged 129.7 points in May, down 6.5 points (4.8%) from April and up 43.9 points (25.3%) below its record value a year ago.
International wheat prices fell 3.5% month-on-month, reflecting the outlook for ample global supply in the upcoming 2023/24 season and the extension of the Black Sea Grains Initiative.
World corn prices fell 9.8% in May. The favorable outlook for 2023/24 points to a rebound in global supply, with higher production expected in Brazil and the United States, two major exporters, weighing on prices. A sluggish pace of exports by the United States, along with canceled purchases by China, also put downward pressure on world corn prices.
Among other coarse grains, world prices of barley and sorghum also fell by 9.5% and 9.7%, respectively, influenced by declines in international prices of maize and wheat.
FAO VEGETABLE OILS
The FAO vegetable oil price index averaged 118.7 points in May, down 11.3 points (8.7%) month-on-month and up to 48.2% below the previous year’s level.
The continued decline in the index reflected lower global prices for palm, soybean, canola and sunflower oils. International palm oil prices have fallen significantly since April as weak and prolonged import purchases have coincided with expectations of increased output in major producing countries.
Meanwhile, global soybean oil prices fell for a sixth straight month, largely supported by persistent pressure from a bumper soybean crop in Brazil and higher-than-expected inventories in the United States, where supplies were tighter. large quantities of alternative feedstock have partially replaced absorption from the biodiesel industry.
For rapeseed and sunflower oils, international prices continued to fall due to ample global supplies.
FAO FOOD
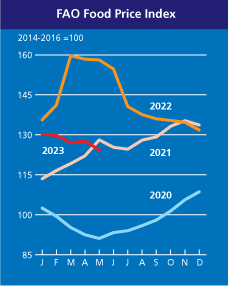
The FAO Food Price Index* (FFPI) averaged 124.3 points in May 2023, down 3.4 points (2.6%) from April and up to 35.4 points (22.1%) from the all-time high reached in March 2022. The decline in May was supported by significant declines in vegetable oil, grain and dairy price indices, which were partially offset by increases in sugar and meat indices
SOURCE: https://www.fao.org/worldfoodsituation/foodpricesindex/en/

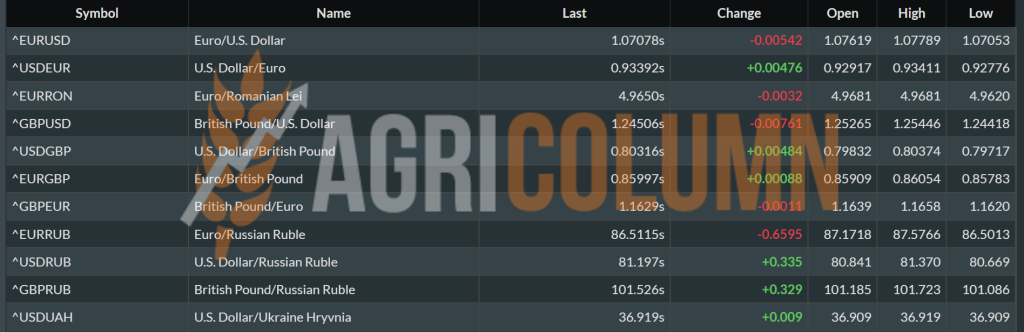
LOCAL STATUS
Wheat quotations in the CPT Constanța parity are 200 EUR/MT. Feed wheat has a difference of minus 10-12 EUR/MT within the discount period.
CAUSES AND EFFECTS
The imminence of the coming harvest, as well as the volume factors mixed with those of the weather, make the price of wheat oscillate between 195-200 EUR/MT. From what we see, however, the demand is low, the recipients understand that they have to wait a maximum of 2-3 weeks to get the new crop.
In Romania, there are expectations, especially regarding the European Commission’s decision to extend the import restriction for the 4 categories of Ukrainian goods. On June 5, 2023, the current ban expires and so we can draw some clear conclusions regarding the decision to be taken by the European Commission:
- Ukrainian goods are wanted in certain countries of the EU bloc, such as Spain, Italy, The Netherlands.
- Ukrainian goods are needed in these destinations due to their own specifics, namely a developed processing capacity.
- Ukrainian goods are not needed in countries like Romania, Poland, Bulgaria, Hungary and Slovakia.
- The European Commission thus admits the fact that the main objective is Ukrainian goods for own consumption, thus explaining with great clarity now, if it were still needed, the percentage of 44.30% of the total exports of Ukraine, which entered and remained in the European Union.
We thus see an outcome that will maintain the ban on goods imports from Ukraine to the countries named above, a natural and normal thing. From a legislative point of view, however, it does not comply with the 2017 association agreement.
But we believe that it is the job of the lawyers of the European Commission to regulate this, as they also built the association agreement, they also have to regulate these legal issues, in the context in which in 2023 the regulation 870/2022 is extended in terms of tax exemption applied to goods originating in Ukraine.
Thus, Romanian farmers will be able to reoccupy their local market, and find their traditional buyers. It is a moment that must not be missed under any circumstances.
The local processing and livestock market is in continuous demand and if we discuss compared to the previous season, a volume of at least 4 million tons of goods must find its commercial area, especially because we will have a rich crop year and the volumes generated will be much bigger than in the previous season.
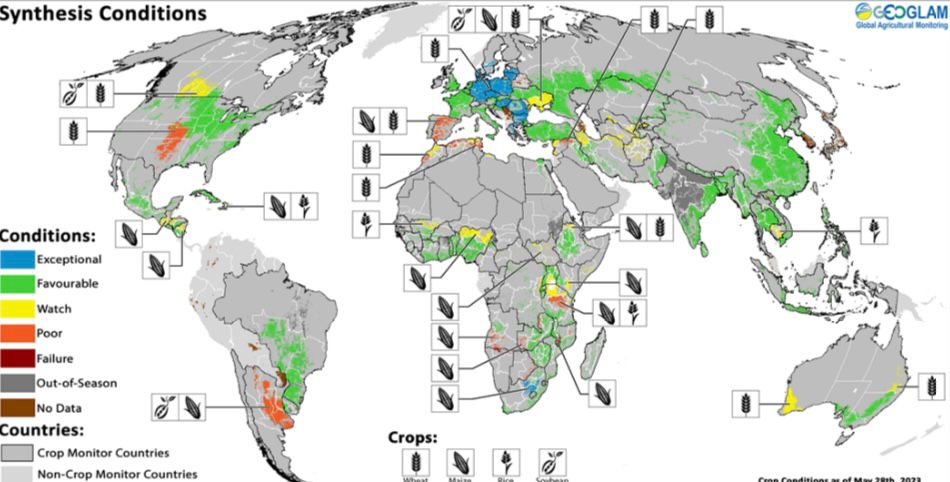
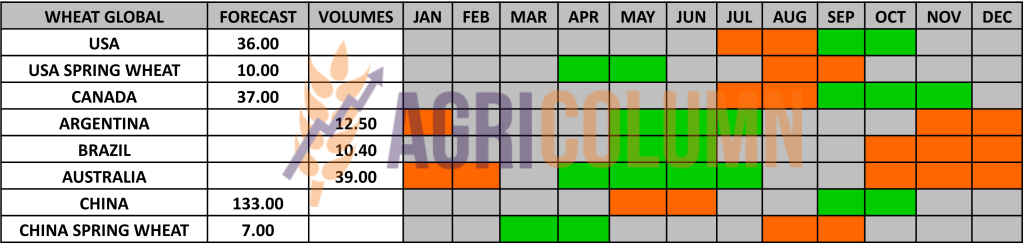
To emphasize this, we insert the vegetation stage forecast of the crops generated by Amis together with Geoglam, which positions Romania at the level of “Exceptional”, just like in 2021. This should make us happy, but also make us extremely cautious about what is to come, in terms of price trends.
REGIONAL STATUS
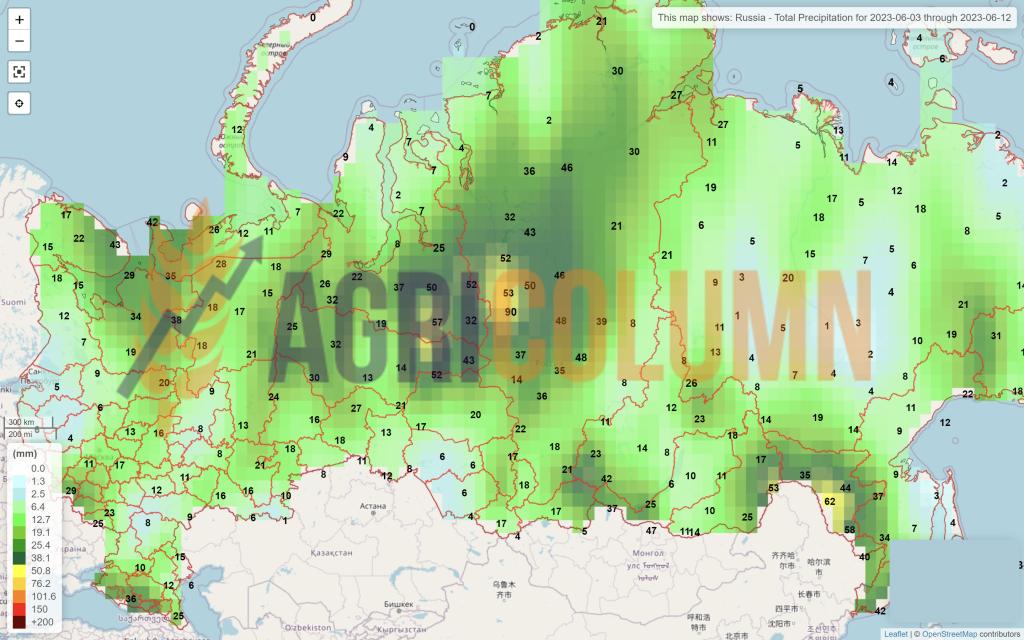
RUSSIA indicates the same vegetation status as before and no major changes are seen, apart from a report by the Ministry of Agriculture that generates some figures absolutely contrary to what reputable Russian analysts were generating. Thus, a wheat crop of 78 million tons is indicated, contrasting with the 88 indicated so far. The announcement comes on the same day that a Saudi Arabian wheat purchase tender was taking place. Maskirovka is therefore in full swing, with the attempt to increase the price.
But Saudi Arabia canceled the tender for June 6, 2023, leaving no door open to this attempt to manipulate the price. Not to mention the remaining unexported volumes with which Russia will enter the next season, estimated at 15 million tons, as well as the 6 million tons that will be extracted from the occupied territories of Ukraine.
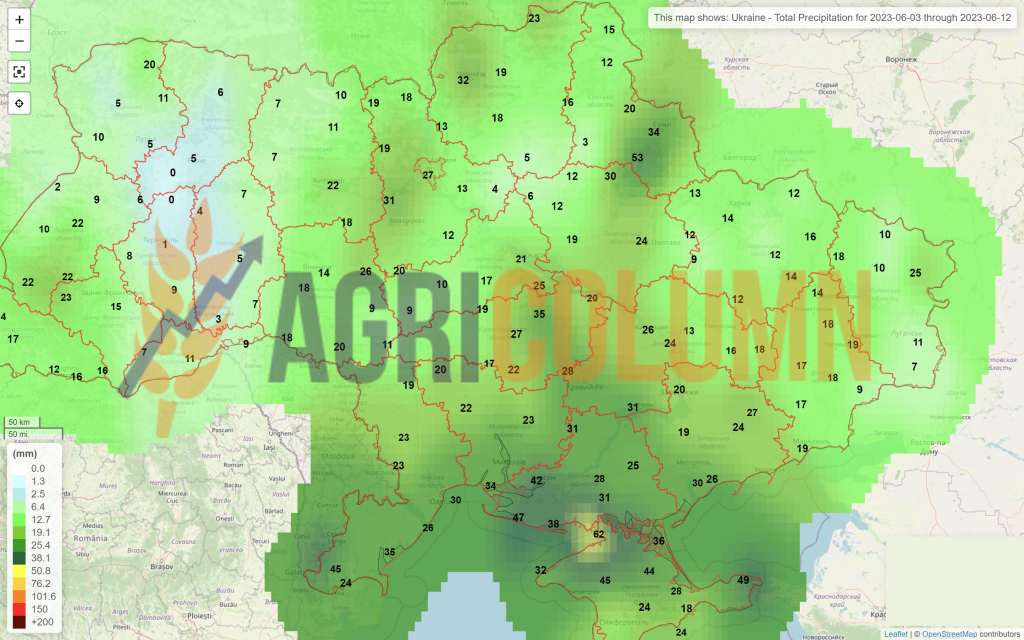
UKRAINE is still in the seeding campaign and is fast approaching the end. Spring wheat has reached a seeding level of 94%, i.e. a level of 270,000 hectares. So, a remainder to be sown of 16,200 hectares.
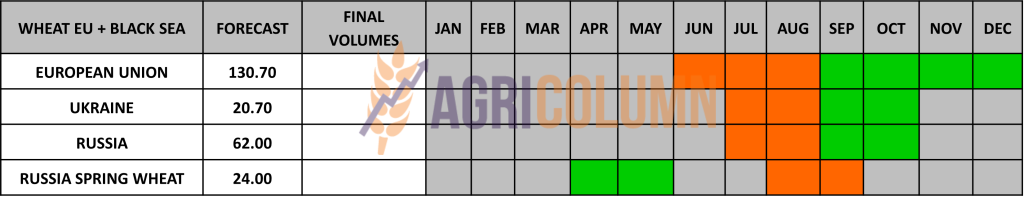
The EUROPEAN UNION remains in the volume forecast, although some areas do not benefit from precipitation these days, we nominate France, Germany, Poland, Lithuania.
The grade of G/E, i.e. good to excellent, of France reached 91%, down 2% from the previous week. But it’s nothing dramatic at this point, given a fairly high forecast of Union stocks, 10 million tons more than what the USDA forecast in the previous report.
The export level at the Union level reached the value of 28.4 million tons, with an import of 8.25 million tons of wheat. The export of flour reached the level of 0.43 million tons, while the import stands at 0.33 million tons.

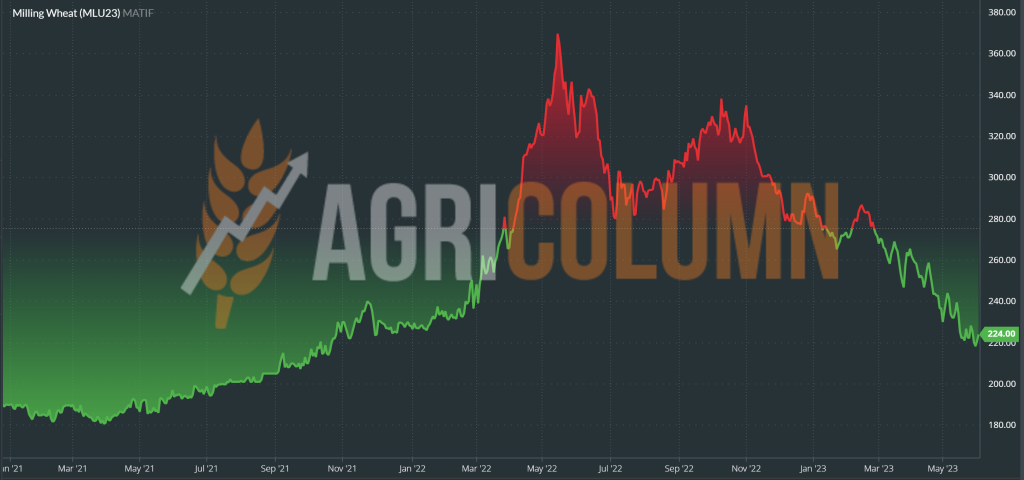
EURONEXT – MLU23 SEP23 –224 EUR (-4 EUR vs. last week)
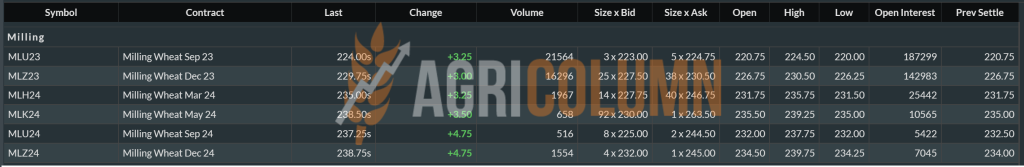
EURONEXT WHEAT TREND CHART – MLU23 SEP23
GLOBAL STATUS
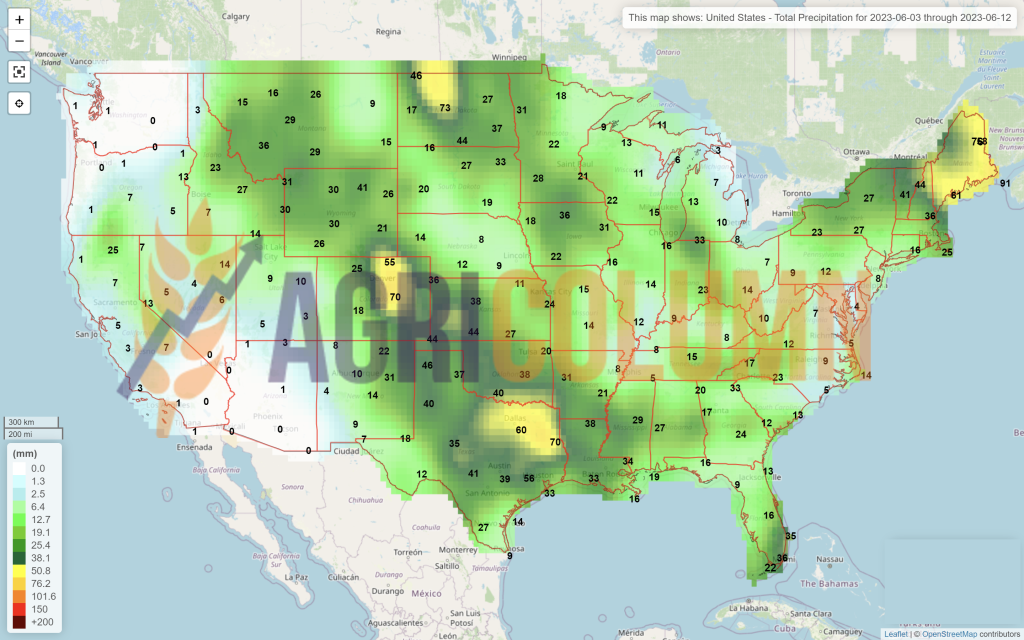
The USA started harvesting in Texas, but it was precisely in the central fields that consistent rains began, which delayed the wheat harvest. However, the first signs of productivity per hectare are not at all disappointing.
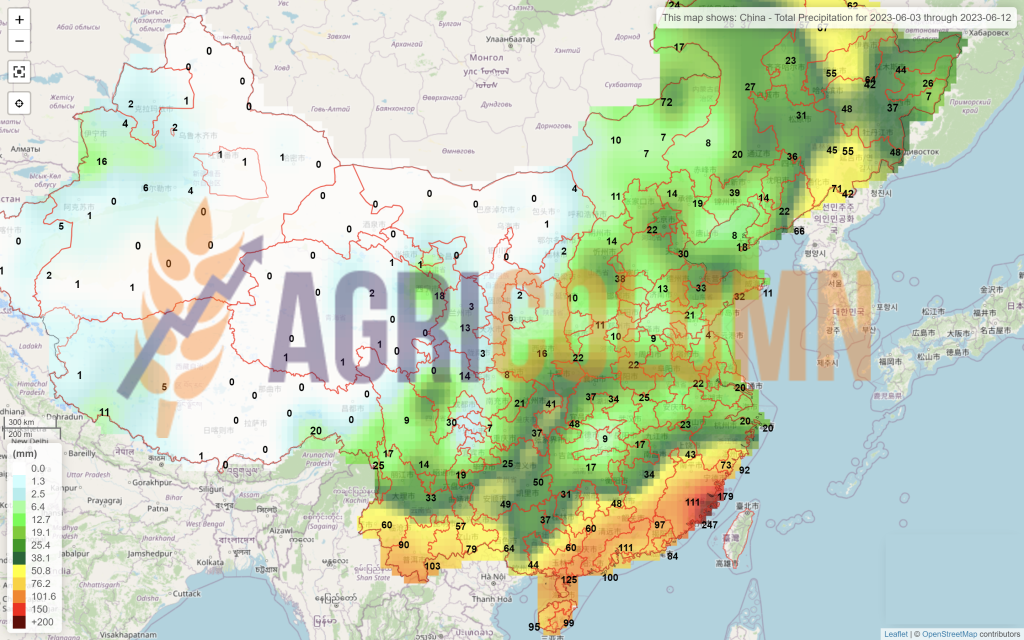
CHINA is indicating fairly consistent wheat crop problems. Initially, China was generating an extremely consistent forecast of around 140 million tons, but due to heavy rains, a large part of their crop suffered depreciation. It is not known, of course, the volume of wheat affected by sprouting in the field and mold (sprouted and moulded kernels). Some analysts estimate 10 million tons, others 20 million tons, but we believe that such figures are unfounded. The opacity of the regime in Beijing makes the reality different, probably.
But even so, overlaying the weather maps with the areas where wheat has the largest weight in China, we see a gradual decrease in precipitation, so that harvesting will be possible in the coming period. And let us not for a moment doubt China’s ability to mobilize at such times.
But two things are certain, namely: the lower quality will be used in feed, and the import of milling wheat could increase by 3-4 million tons, from a forecast of 8-9 million tons to a level of 11- 12 million tons.
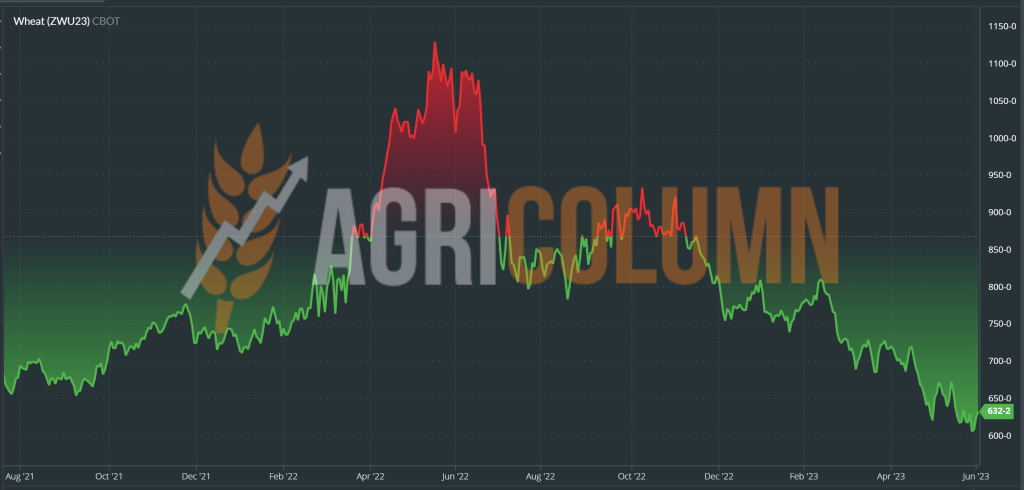
CBOT WHEAT – ZWU23 SEP23 – 632 b/bu (+3 b/bu vs. last week)
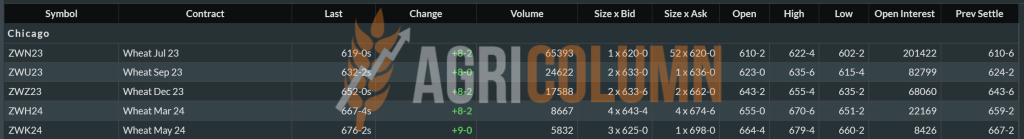
CBOT WHEAT TREND CHART – ZWU23 SEP23
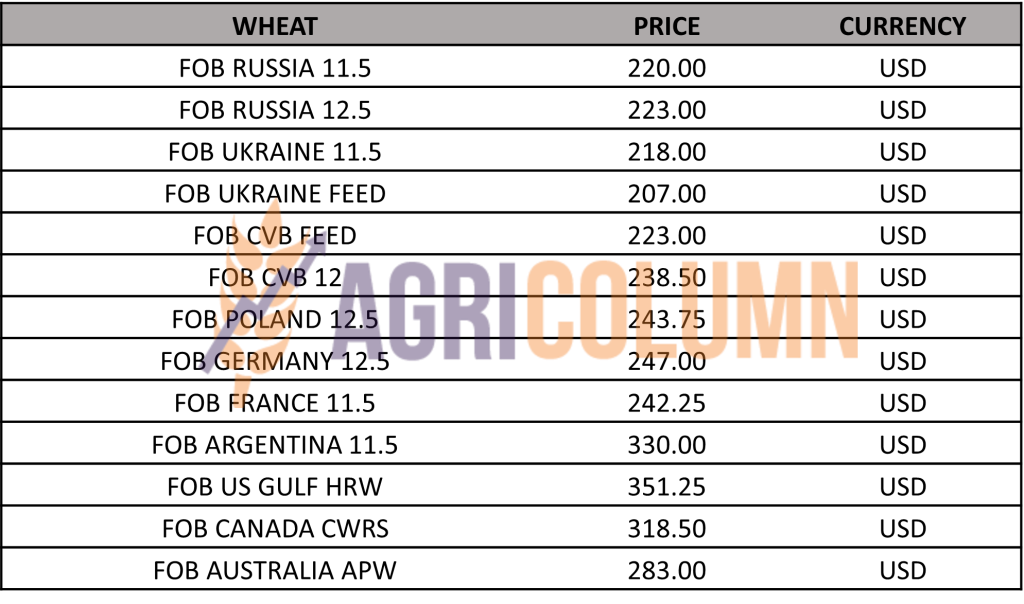
WHEAT PRICE INDICATIONS IN MAIN ORIGINS
CAUSES AND EFFECTS – THE STORY
Mixed feelings generate uncertainty factor on the stock markets. After a massive sell-off, the funds returned to the market fueled by some economic conditions we could call them.
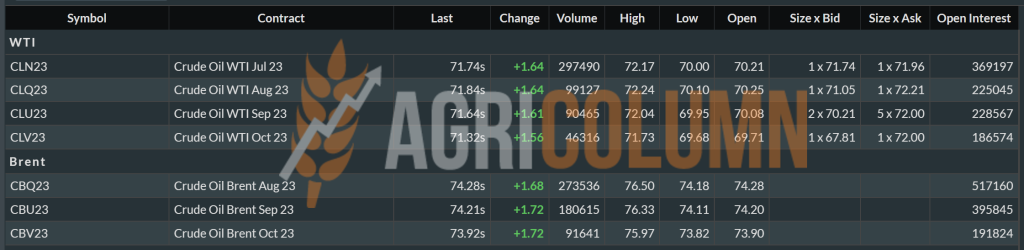
Grain prices benefited from some strong macroeconomic headwinds that also pushed a broad set of other commodities higher, including livestock, energy and more. Most wheat contracts saw double-digit gains. On Wall St., the Dow rose 699 points in trading to 33,760, following a strong jobs report and easing concerns about the debt ceiling. Energy futures also made solid gains, with crude oil up more than 2.25 % to $71 a barrel. Diesel rose nearly 2%, while petrol rose over 2.75%. The US dollar strengthened moderately.
On Thursday, commodity funds were net buyers of all major grain contracts, including corn (+6,000), soybeans (+9,500), soybean meal (+3,500), soybean oil (+5,000) and CBOT wheat (+6,000).
However, we also have the factors we are used to, that is, the geo-political ones and we nominate here the Black Sea basin which does not stop giving impulses in the global market, counting on certain things, namely that this area is responsible for 40% of the global wheat trade.
As we pointed out above, Russia is trying through the usual means, Maskirovka, to raise the market level, but the physical fundamentals indicate a depreciation of the price level in this area, up to the level of 223 USD in FOB parity.
Aggregating with the fact that by raising the level at which export taxation starts, it decreased and Russian farmers stopped selling until 1st of June 2023, when the new threshold of 17,000 rubles comes into force, we have a much clearer picture.
So, we have a series of impulses likely to push the market up at the moment and we list them:
- RUSSIA and the continued strangulation of the Ukrainian Freight Corridor.
- USA and current crop conditions
- CHINA and the problems generated by torrential rains.
- Improving the US economic outlook and generating encouraging momentum.
What is essential however we need to be aware of are the physical fundamentals at this point. Playing and swinging on the stock market are effectively fireworks that generate short-term profit, the market is relentlessly dominated by Supply nda Demand. So, there will still be spikes, their intensity will be given by the nature of the event, but what remains clear is one thing, namely the fact that in 2023-2024 we will have a high wheat crop globally.

LOCAL STATUS
The feed barley price indications remain at the value of 172 EUR/MT in the CPT Constanța parity.
REGIONAL STATUS
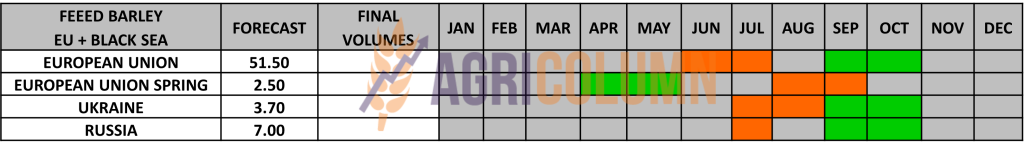
THE EUROPEAN UNION. No change, same forecast crop level as before, 50 million tons. Regarding the Union export volume, it is quoted at the value of 5.93 million tons with an import level of 1.92 million tons.
UKRAINE has reached a 75% sowing level of spring barley and this converted to hectares leads to the figure of 770,000 hectares.
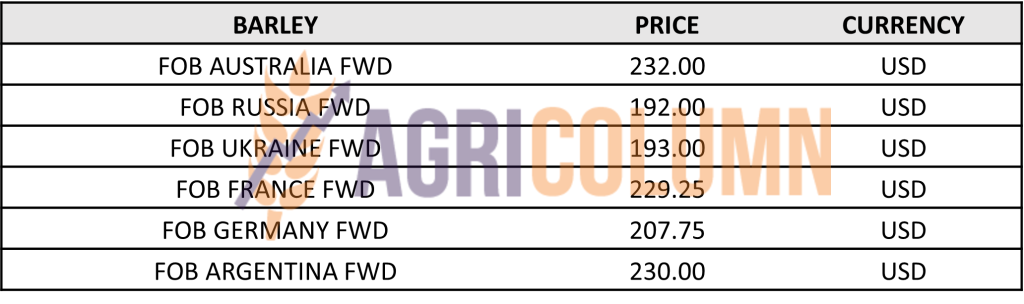
BARLEY PRICE INDICATIONS IN MAIN ORIGINS
GLOBAL STATUS
There are no fundamental developments that change the supply and demand picture. Destinations are waiting for the new barley crop purchased through previous tenders, and certainly seeing the volumes, will price-price subsequent purchases during the harvest season and beyond.
The dynamics of the barley is given by the wheat and will without a doubt orient itself after it.

LOCAL STATUS
Corn price indications are at the level of 182-183 EUR/MT for the new crop in the CPT Constanța parity.
CAUSES AND EFFECTS
Global weather uncertainty is driving corn prices on an upward trend of at least 7-8 EUR from the previous week. The weather factor thus influences the price of corn. But if the weather improves and the outlook takes a positive note, we may see commodity prices fall.
It is a very good moment to re-occupy a position in the domestic market, to generate the necessary volumes in animal husbandry and processing. The date of June 5, 2023 will bring many clarifications, even if Mr. Mykola Solsky traveled to be present at Agri-Fish, where agriculture ministers from EU countries met, as they do monthly. And there he did not hesitate to press for the removal of import bans on goods in the 5 countries.
His statements were like he got along with Romania?!?! but apart from the explanation of the problems and the opening of communication channels between the two countries, to which we add the Republic of Moldova, nothing has been set clearly and absolutely. I am also telling you this as an adviser to the Romanian Minister of Agriculture, in which capacity I participated in these contact and acquaintance meetings between the parties.
Moreover, he specified that he will complain to the WTO (World Trade Organization) and other international forums, for these restrictions applied to Ukrainian goods.
Summing up, Romanian farmers should not be too late in occupying the domestic market, it swallowed and digested a volume of over 1.5 million tons of corn originating in Ukraine last season.
REGIONAL STATUS
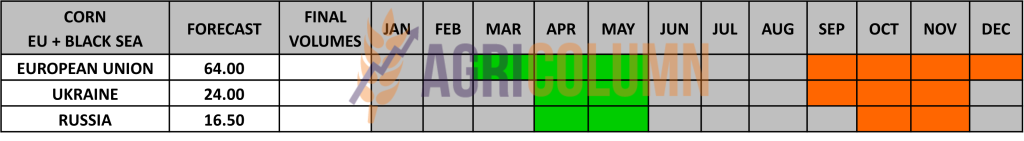
THE EUROPEAN UNION remains in the same forecast regime, 63-65 million tons, with a normal planting rate. Delays are reported, but they will recover, for sure. Regarding the level of Union import, it reached the value in tons of 24.35 million, with an exported volume of 2.99 million tons.
UKRAINE continues to plant corn and will exceed its planting schedule. Today it is at 109% of the forecast, that is 3.9 million hectares. If we have a multiplication factor of 6.7 tons per hectare, the forecast figure is over 26 million tons.
RUSSIA, for its part, will generate a volume of more than 16 million tons of corn and announces itself as a serious competitor in the destination of China. Russia’s forecasted export level of the corn product is estimated at over 6 million tons, if not they will reach 7 million tons.
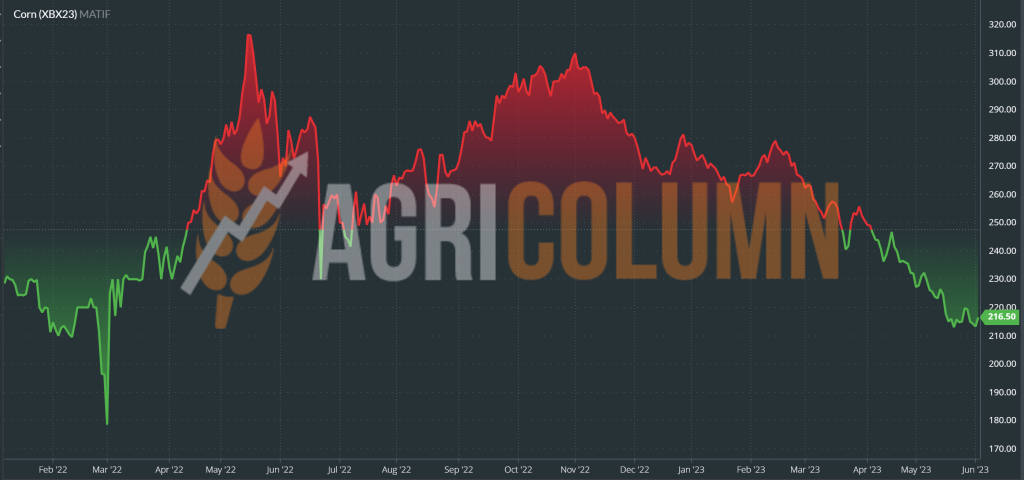
EURONEXT CORN – XBX23 NOV23 –216.5 EUR (-3.25 EUR vs. previous week)
EURONEXT CORN TREND CHART – XBX23 NOV23
GLOBAL STATUS
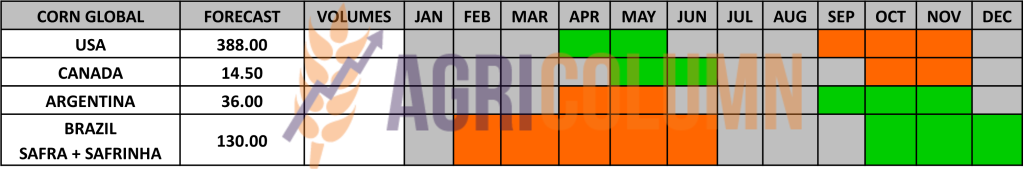
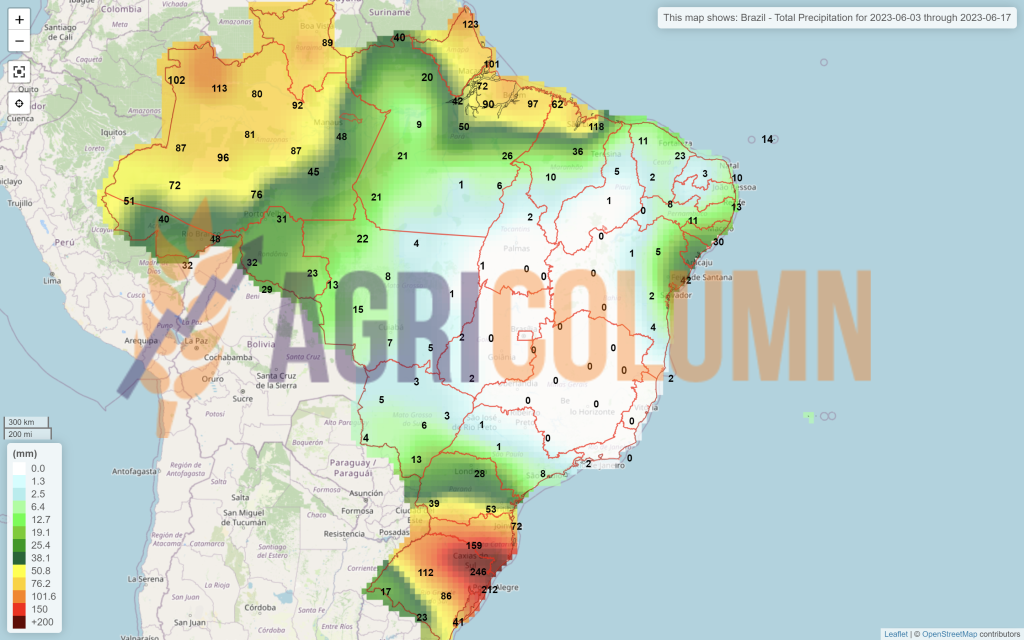
BRAZIL increases the crop forecast by 2.7 million tons and will reach a total level of 132.7 million tons, both crops combined, Safra + Safrinha.
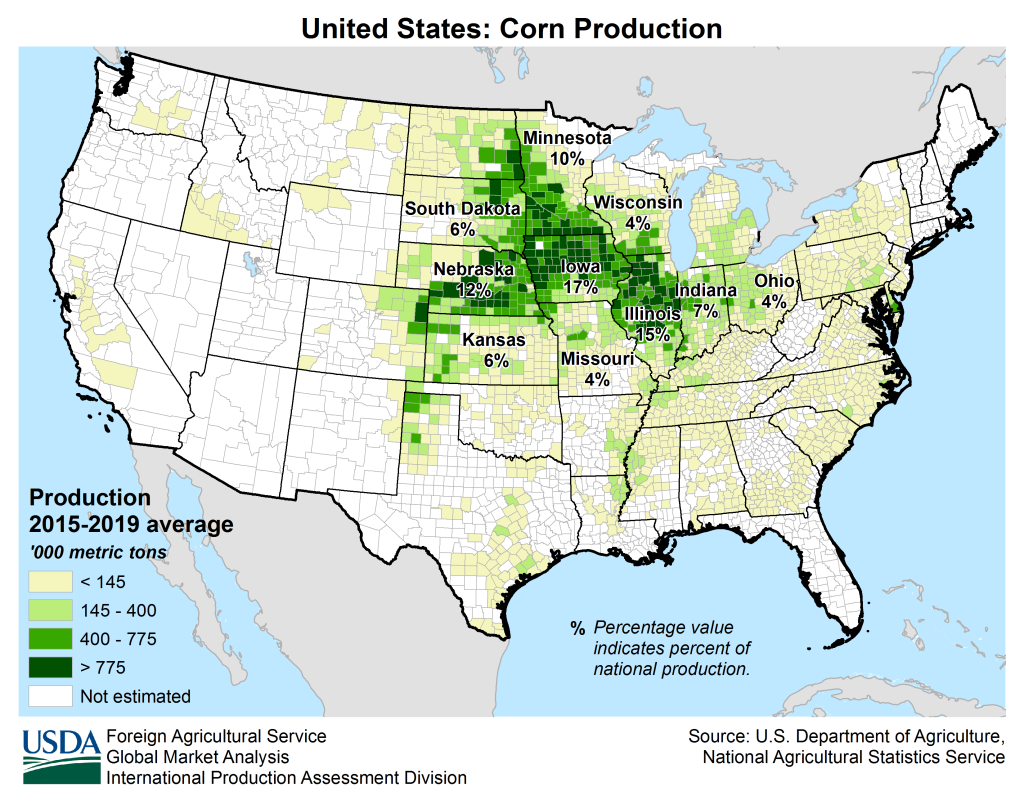
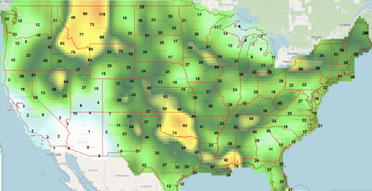
The US continues to be somewhat uncertain. Conflicting forecasts and a flurry of tweets keep the CBOT oscillating continuously. But we have to look at the reality. There are uncertainties, but there are also forecasts. These forecasts indicate rainfall will arrive after mid-June 2023 in many areas of the Corn Belt, and cool weather will also set in.
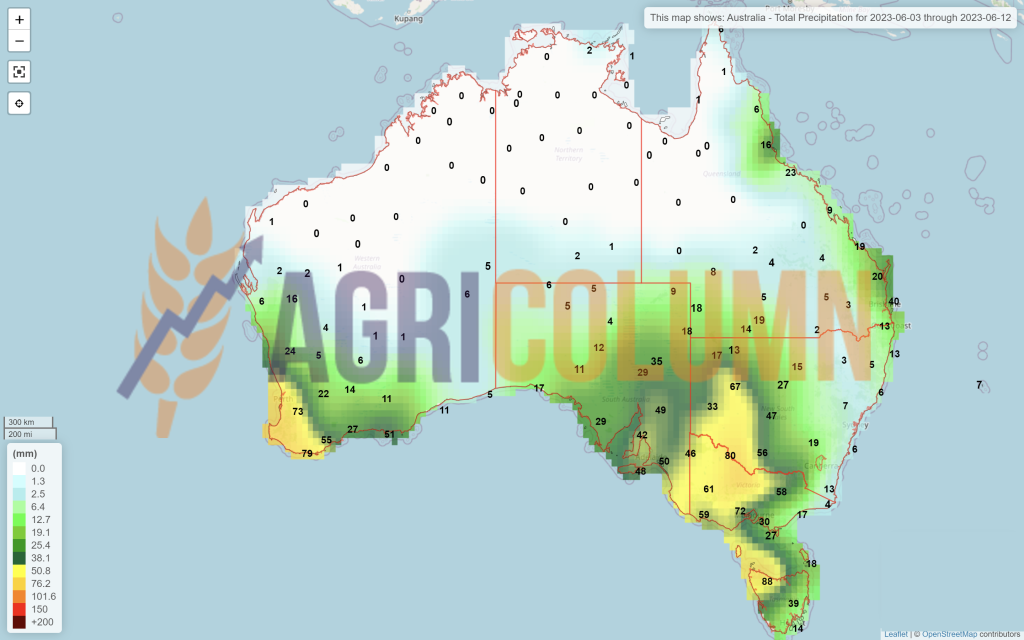
We overlay here the map and share of US corn in the main producing states and the map of precipitation through June 16, 2023.
ARGENTINA. The maize export protocol was amended to facilitate trade with China. Argentina and China agreed on a new corn export protocol, signed into effect on Tuesday, that could facilitate corn exports to China – the largest corn importer and second producer. From February 2012 to date, Argentina has exported a minimum total volume of 66,710 mt, with the last shipment recorded in 2016.
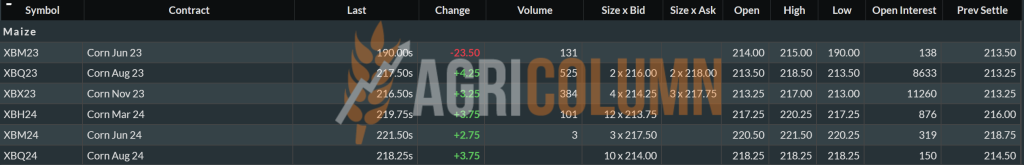
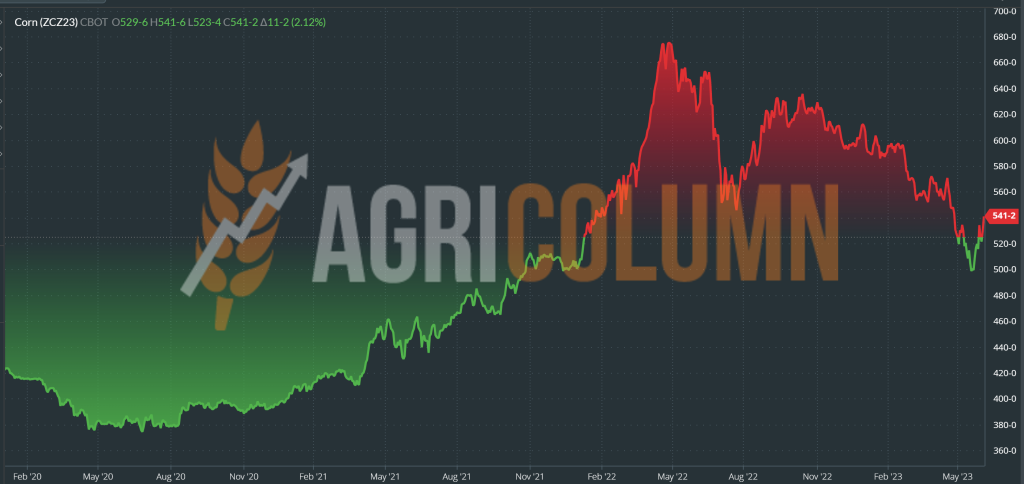
CBOT CORN ZCZ23 JUL23 – 541 c/bu (+7 c/bu = +2.75 USD/MT vs. last week)
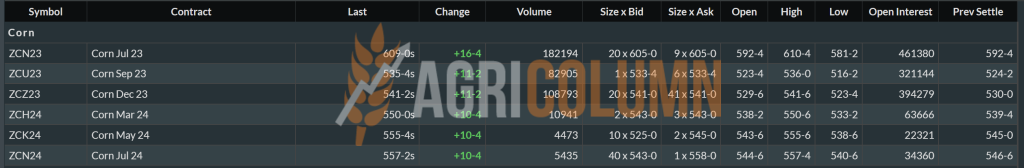
CBOT CORN TREND CHART – ZCN23 JUL23
CORN PRICE INDICATIONS IN MAIN ORIGINS

CAUSES AND EFFECTS – THE STORY
As I mentioned in the Wheat chapter, a driving factor in the corn indications was the US economy, where the excitement generated translated into the entry into play on the CBOT and the commodity corn.
The second factor that generated the growth of corn is the one related to the uncertainty created by the weather in the US.
But judging correctly, these increases in indications come after a week of sell -off, so we can practically write them off as recoveries, the 7-day difference between ZCZ23 DEC23 is only 2.75 USD.
The potential corrective factors will come from Brazil, with a surplus crop, and from Ukraine, which is currently initiating a forecasted volume of over 26 million tons. And this will weigh the growth factors over time.
It is, as I pointed out, a weather market moment, which will last until the beginning of July 2023.
Another factor is certainly the geo-political one and this deserves to be explained more for a better understanding. We know it’s a lot to read, but we assure you it’s worth it.
Ukraine claims it has another plan in case the Corridor is stopped by Russia. An alternative would be to continue exports without agreement and with substantially increased war premiums. Turkish escorts could operate in the exit route from the territorial waters, and from there they will be able to move freely to the Bosphorus. Where, surely, they will not wait for any inspection.
We don’t know the economic calculation yet, but it might be bearable conditions and insurance premiums supported by the Ukrainian state, which from June 1, 2023 has reintroduced the pre-war corporate tax system. Thus, the 2% under martial law no longer exists. And they will have enough to subsidize the war insurance for the ships.
At the same time, they will go out through Bâstroe and Reni, because they admitted that they have increased the depth of the channel and that they intend to continue up to a draft of 8.5 meters, a fact that would allow ships of 25,000 tons to transit it.
Now let’s understand why Russia absolutely wants to transfer liquid ammonia (fertilizer) through Chornomorsk Ukraine. It is extremely simple, because that way they evade the sanctions. A potential protocol would transfer the ownership of these liquid fertilizers to Tramo, an American company, and, implicitly, the owner and the sanctions regime would change.
Russian stories like Uralchem building its fertilizer factory in deep-port like Novorossiysk are without any foundation. What to do with these factories in Novo? To export? So why don’t they do it from Togliatti? Simple, because there are sanctions on Russian fertilizers.
So how will they cross the Bosphorus? Through the air? Teleporting those fertilizers? Wherever iy starts from, it has to cross the Bosphorus. And there is Sultan Erdogan, who maintains the straits and effectively creates a formidable position for Turkey globally.
Russia can close the Corridor, but they will feel the repercussions, because they also cross the Bosphorus with Crude Oil Tankers, and there the options could be narrowed. And so Russian oil reaches Saudi Arabia and replaces their oil, which transfers it to Europe and other destinations, as India does. Here is how and how easily sanctions are evaded.
So Russia doesn’t want to muddy the waters too much in the Bosphorus. Because the door will be partially closed by Sultan Erdogan, who wants influence and benefits of any kind for Turkey. Not to mention the joint business of the two, Putin and Erdogan.
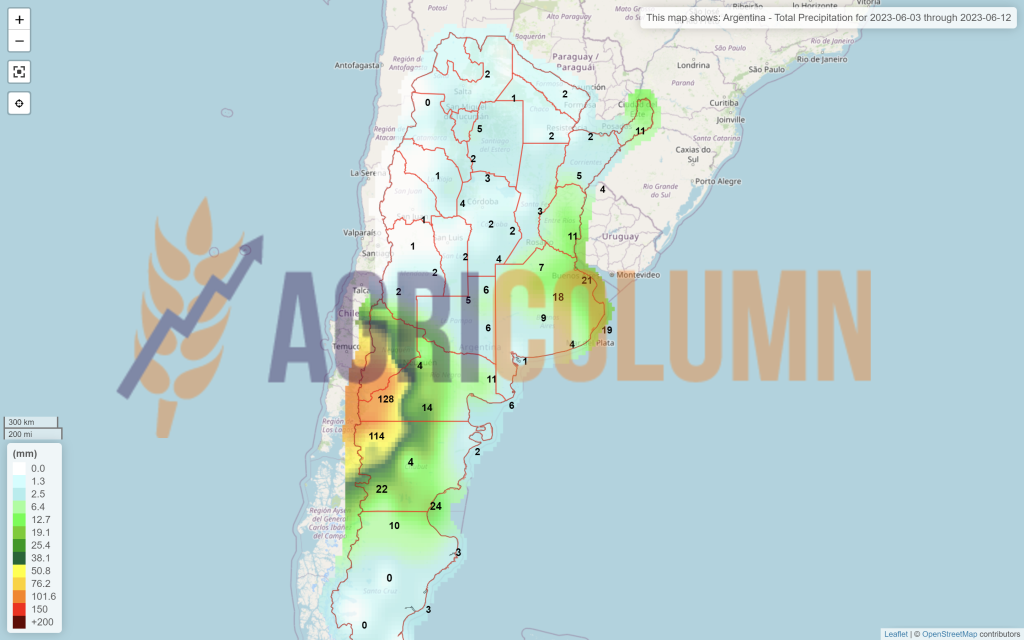
Returning to this complex playing field, we believe that Ukrainian goods will represent an important weight this season, joining in the complex the North American goods and the future potential of the two South American countries that did not tango this season due to drought in Argentina. But Atlantic hurricane and storm season has begun, Dora and the rest will arrive, El Nino is in full swing, the only question mark is the high Atlantic temperature.
So we remain in the Weather Market for now and today’s support could erode due to the commodity driver, which is Wheat, associating it all with low corn demand at the moment.


LOCAL STATUS
Indications are starting to change the basis in the direction of narrowing and we see indications of AUG23 minus 30 EUR/MT in CPT Constanța parity. However, the domestic market remains at the same level as AUG23 minus 50 EUR/MT, in anticipation of the logistical congestion in the Port of Constanța.
CAUSES AND EFFECTS
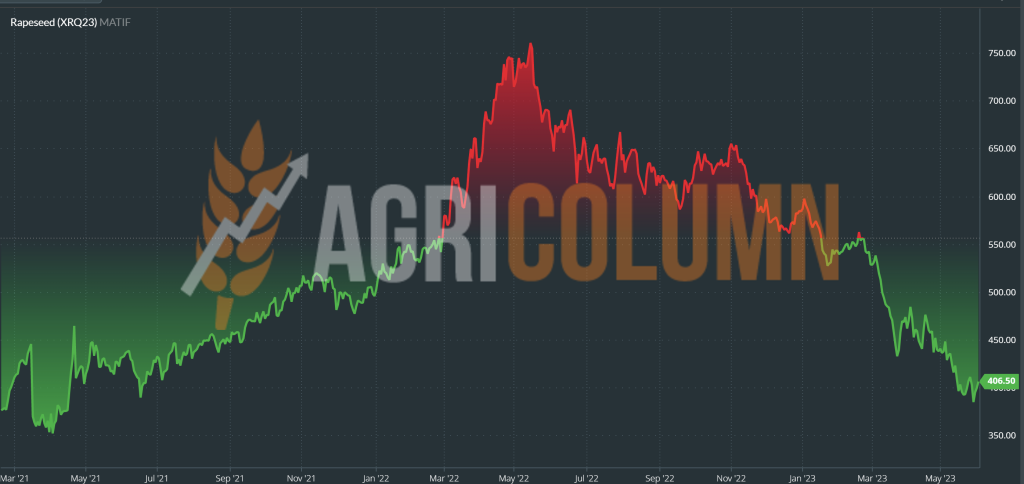
A week with liquidation of positions and a YO-YO effect that took rapeseed to 385 EUR, and the return was made from the collaterals called Petrol and Palm Oil. The impetus was generated on Friday, and we are recording AUG23 at EUR 406.5. The question is how long this plateau will last. Like last week? On the face of it, EUR 400 seems to be the threshold of support, but for how long?
Harvesting will give the answer, for sure, and this is only one, large volumes of cargo that will begin to be harvested within 2-3 weeks from now. However, we must not be fooled by the port indications, there it is definitely a Short, that is, sales made at much higher levels, so the narrowing of the base is a purely technical one, generated by the need for coverage.
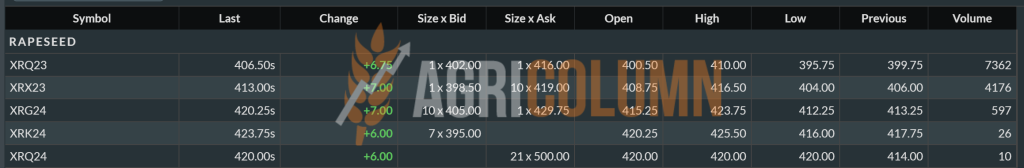
EURONEXT RAPESEED – XRQ23 AUG23 – 406.5 EUR (-4.5 EUR vs. previous week)
EURONEXT RAPESEED TREND CHART – XRQ23 AUG23
REGIONAL STATUS
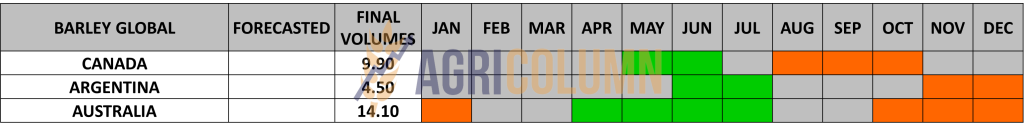
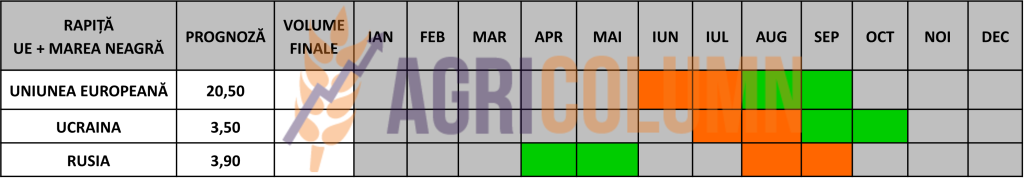
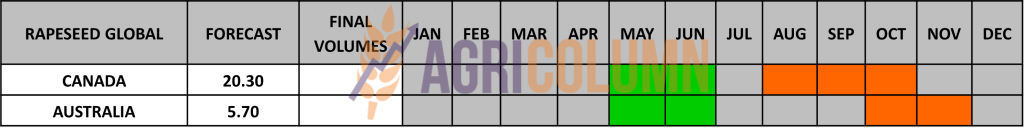
The EUROPEAN UNION indicates the same volume of more than 20.5 million tons. The EU import of rapeseed is over 7 million tons, 40% higher than in the previous season. Instead, there are changes in the top exporters in the EU. Australia comes in first with 3.4 million tons, while Ukraine drops to second place with 3 million tons.
RUSSIA remains at the forecast level of 3.8 million tons.
UKRAINE will generate a volume of 3.3-3.4 million tons, but things could change in a positive direction, towards the figure of 3.5 million tons.
GLOBAL STATUS
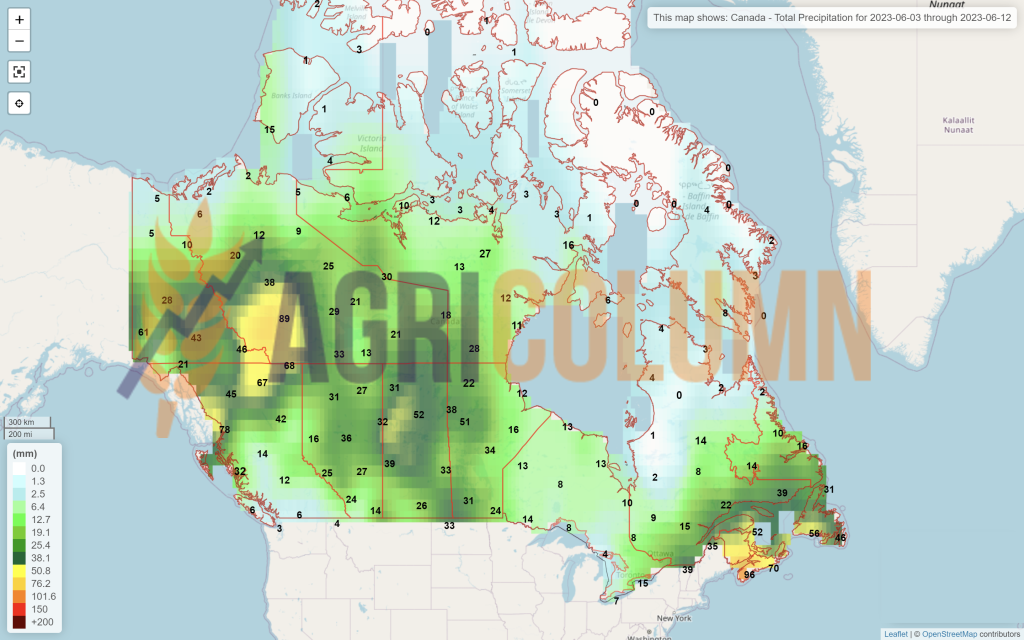
CANADA, according to Stats Can, indicates 18.5 million tons harvest forecast.
AUSTRALIA. Identical, it is in the forecast, 5.7 million tons.
CHINA generates 15.4 million tons, but the entire amount is intended for domestic consumption.
INDIA generates 11.7 million tons, also destined for domestic consumption.
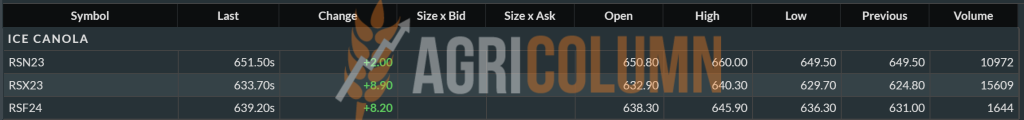
ICE CANOLA RSX23 NOV23 –633.7 CAD (-21 CAD vs. previous week)
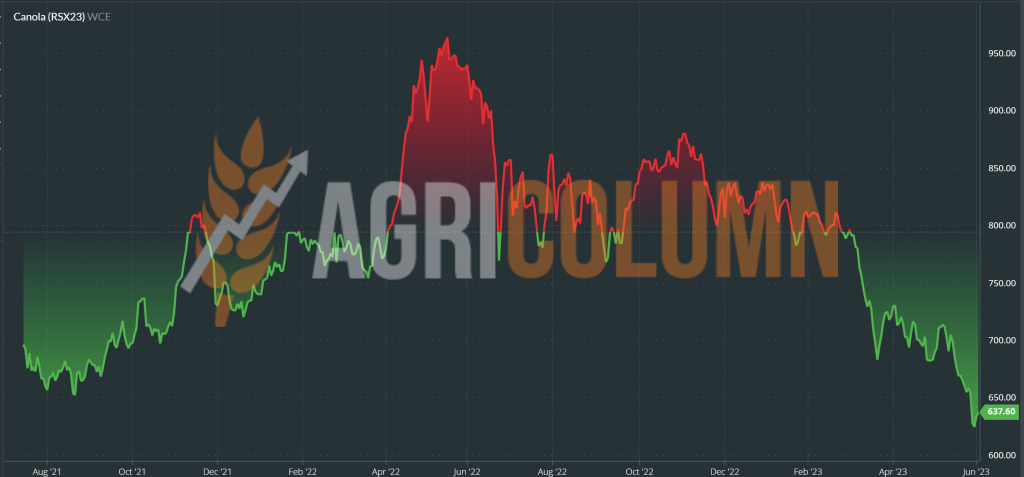
ICE CANOLA TREND CHART – RSX23 NOV23
CAUSES AND EFFECTS – THE STORY
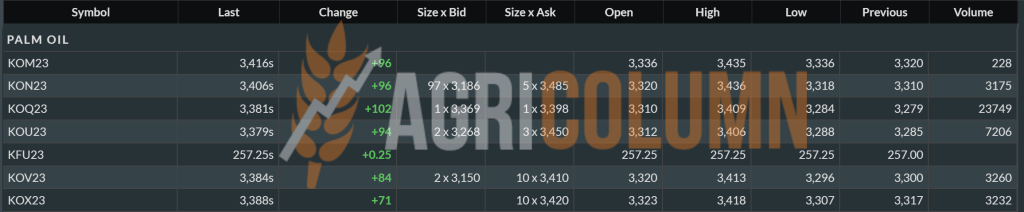
The correlation of the Palm Oil and Petroleum factors caused rapeseed to have the violent swing of 25 EUR in the Euronext indication. The return to 406.5 EUR was again influenced by oil and palm oil. The latter went up after 4 days in a downtrend, but the fundamentals remain the same as before. Below we insert the indications of palm oil to understand much better the correlation between the two.
The increase of 96 MYR is equivalent to 21 USD, which is 19 EUR. There is likely to be another rally before another negative swing.
The European rapeseed oil market FOB DM Rotterdam rose on Friday.
At the same time, sellers’ ideas for June-July delivery rapeseed oil averaged Thursday’s level of 795 EUR/MT FOB Rotterdam, while buyers rose an average of 20 EUR/MT and were heard quotations at the level of 770 EUR/MT until the end of the day in parity FOB Rotterdam.

LOCAL STATUS
Port Constanța is quoting old crop sunflower seeds at 385 USD/MT.
The quotation level of the new crop is set at 360-370 USD/MT in CPT Constanța parity, which leads to a level of 355 USD/MT for the goods delivered to the processing units.
CAUSES AND EFFECTS
The sunflower crop is looking very good at the moment and the harvest conditions are extremely positive. The intention of the European Commission regarding the extension of the import restriction on the 4 goods of Ukrainian origin will generate an auspicious moment for Farmers. And we implicitly refer to Romania and Bulgaria, which were practically enveloped by the Ukrainian flows of sunflower seeds.
It is a moment not to be missed under any circumstances. Imports of sunflower seeds in Romania were in the previous season at the level of 860,000-880,000 tons. Enormously much, compared to Romania’s even poor production.
Restoring the position of Romanian farmers is normal, it is a moral duty in this case where the competition was unfair. If the European Union needs raw material from Ukraine, it is free to purchase it, and we are referring to Spain, France, The Netherlands, partly Germany, but the restriction in Romania and Bulgaria must be maintained.
But the European Union should not forget when Ukraine had an export tax on seeds and did not reimburse VAT on export.
REGIONAL STATUS
UKRAINE planted 89% of the sunflower area, i.e. 5 million hectares. In total, there will therefore be at least 5.65 million hectares, a maximum of 6 million tons. At a yield of 2.5 tons/ha, it means 14 million tons. At 2.7 tons/ha it means 15.25 million tons. What this means? The original forecast was 12.5 million tons. We will have a surplus in the market of a minimum of 1.5 million tons, a maximum of 2.75 million tons.
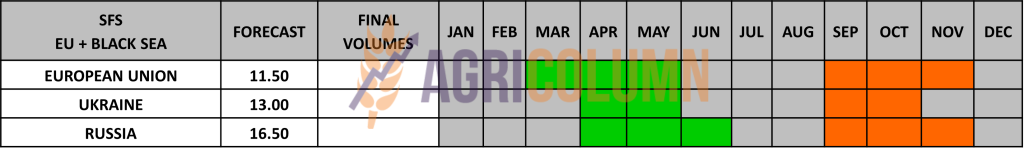
RUSSIA also remains stable in the forecast at the level of 16.5-17 million tons.
EUROPEAN UNION remains stable at a volume forecast of 11.5 million tons. Vegetation status is satisfactory to good at this time and no problems are indicated in the near term.
GLOBAL STATUS
Out of season.
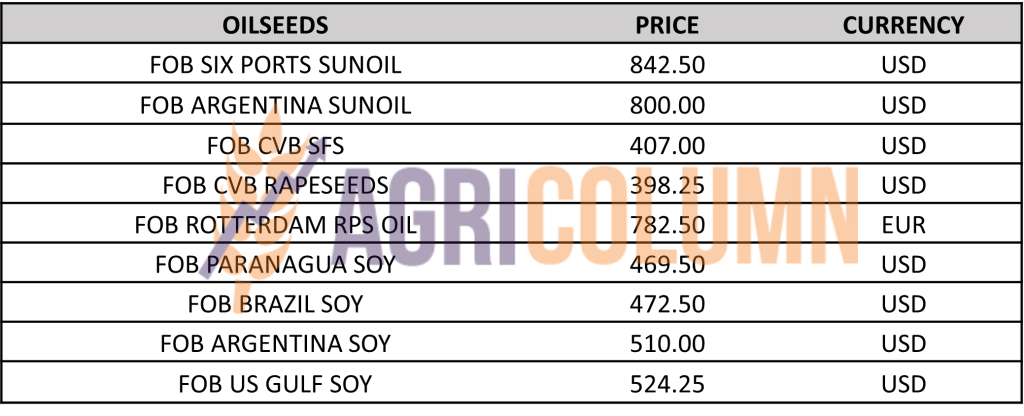
PRICE INDICATIONS FOR OILSEEDS AND CSFO IN MAIN ORIGINS
CAUSES AND EFFECTS – THE STORY
Offers for sunflower oil in FOB Six Ports rose 20 USD/MT from Thursday to 855 USD/MT FOB for July-September loading, while there was a dearth of buyers by the end of the day. The Ukrainian sunflower oil market was fairly quiet on Friday due to limited sales and a continued lack of buyers.
Ukrainian sunflower oil offers were quoted at 780 USD/MT CIF Marmara, against buyers’ expectations of 750 USD/MT CIF Marmara.
As I said, the abolition of the export tax in Russia and the introduction of the import tax in Turkey created obvious discomfort in the price of sunflower seeds. The impact is not yet evident despite low demand, a sign of supply. When factories resume supply, however, the effect of these two measures aggregated with harvest volumes and deeply associated with logistics costs will be seen.
Thus, in the period to come, the price of sunflower seeds will stagnate at this level. But if we refer to the last months, we can count the decrease in double digits. And this is so obvious, as some memories with seed price at the level of $275/MT.
As for high oleic seeds, there is a problem. They are effectively no buyers. No one wants to buy and attach a bonus of more than $10-15/MT for 80% oleic acid content.
Why this? Because during last year’s shortage, users who produce chips at European level, having no choice, switched to rapeseed oil. Their obvious fear was that the taste of the finished product would be altered, with bitter undertones. But the experiment passed and the final buyers did not complain about the change in taste. So that today rapeseed oil is successfully used in this industry which generates a lot of demand for HIGH OLEIC. Therefore, local processors have no appetite today for the purchase of HIGH OLEIC seed.

LOCAL STATUS
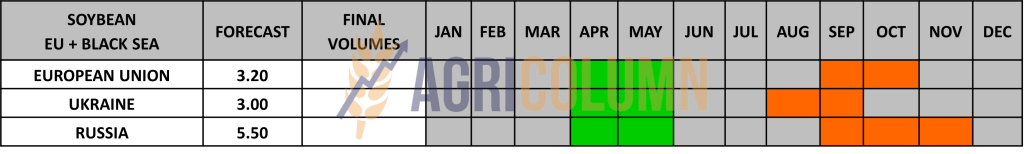
In Romania, the price indications for soybeans are at the level of 480 USD/MT, DAP processing units for non-GMO soybeans.
REGIONAL STATUS
THE EUROPEAN UNION. Total imports of soybeans in this trading season reached 11,650,000 tons, and soybean meal exceeded the level of 14.20 million tons.
GLOBAL STATUS
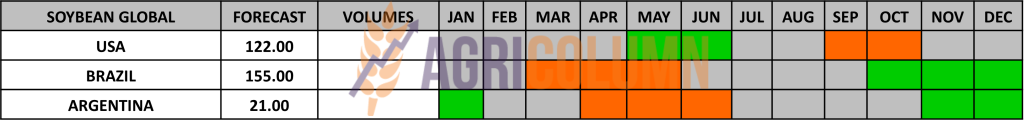
ARGENTINA is already a closed case, 22 million tons is the end of an extremely sad season for Argentine farmers.
BRAZIL remains indicative at 155 million tons and we are already looking towards the new season as their projection is 163 million tons.
The US has a volume forecast of 122.7 million tons which it is maintaining at this time. But weather uncertainty is driving gains on the CBOT.
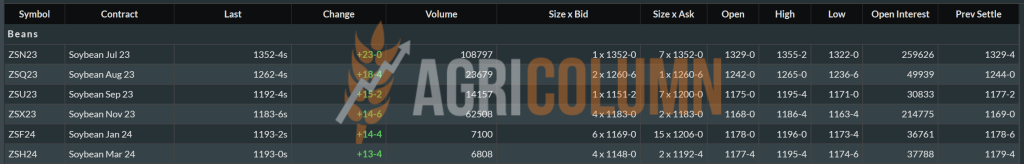
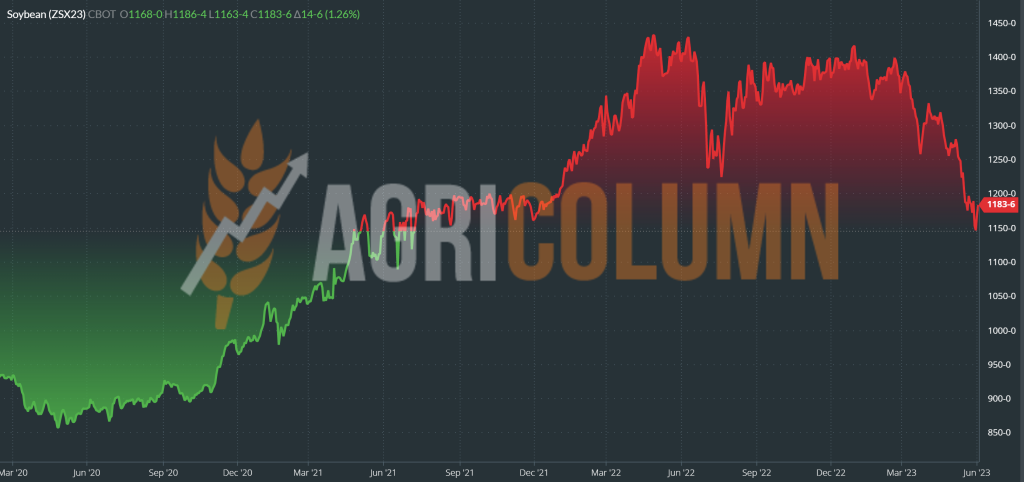
CBOT SOIA ZS X23 NOV23 – 1,183 c/bu
SOYBEAN CHART TREND – ZSU23 SEP23
CAUSES AND EFFECTS – THE STORY
Soy creates uncertainty from time to time. After a massive sell -off generated the previous week, the weather is positively correcting the CBOT indications.
In the US, soybean oil was supported by firmer Malaysian palm oil, while soybean meal declined. So even though soybean oil is increasing, the meal has decreased and this is somewhat of a paradox, because in soybeans the main product is the meal, not the oil (18% oil content in soybeans).
But even this somewhat paradoxical aspect can be explained by the principle of communicating vessels in VEGOIL, i.e. the palm oil supported the soybean oil.
The weather remains the main factor of uncertainty at the moment and then Demand certainly follows, as the main foundation remains the forecast level of 410 million tons for the 2023-2024 season.


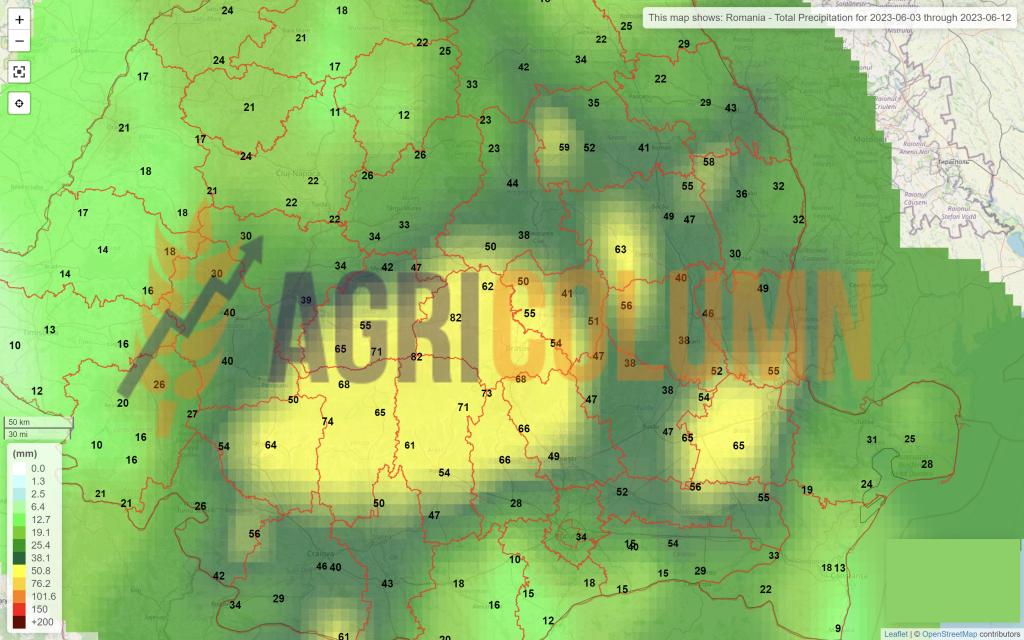
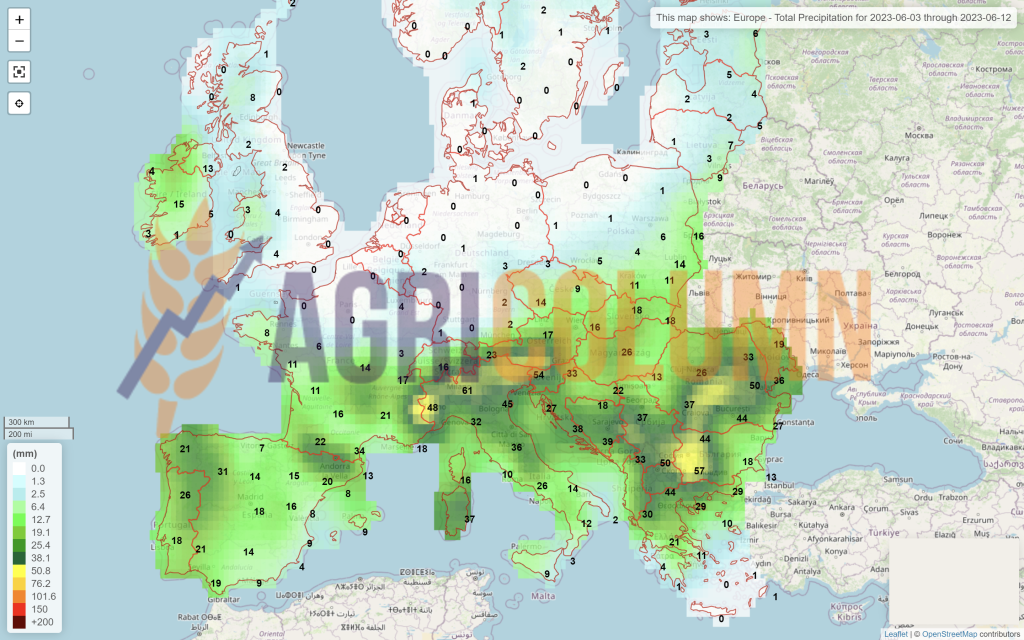
3-12 June 2023
Romania
Europe
Ukraine
Russia
Canada
USA
Brazil
Argentina
China
Australia