This week’s market report contains information on:
- Wheat market
- Barley market
- Corn Market
- Rapeseed market
- Sunflower seed market
- The soybean market
- The fertilizers market
- EUR-USD parity
- Fossil energy
- Weather Forecast

Wheat market
The WASDE report unexpectedly led to a decline in wheat indications in the Black Sea basin. Thus, on December 10, 2022, it generated an indication level in the port of Constanța of 273-275 EUR/MT for milling wheat, with a discount of 10 EUR for feed quality. It is a time of actual confusion in the market, when buyers, with a month ahead of December that will record few transactions, do not know what direction the market will take in the next period.
EURONEXT is shyly showing signs of recovery, with indications for MAR22 being positive, but not enough to start narrowing the gap from the 15-17 EUR/MT produced gradually and sharply with the USDA ratio.
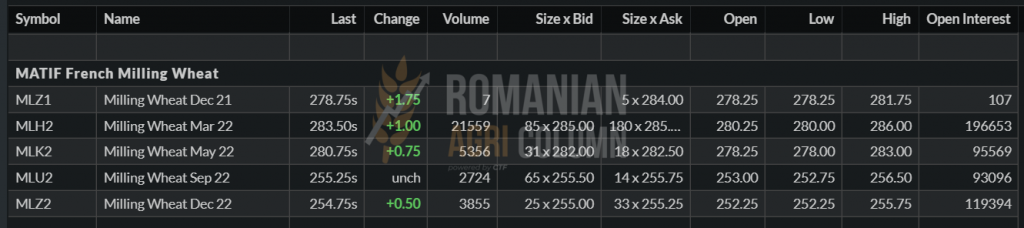
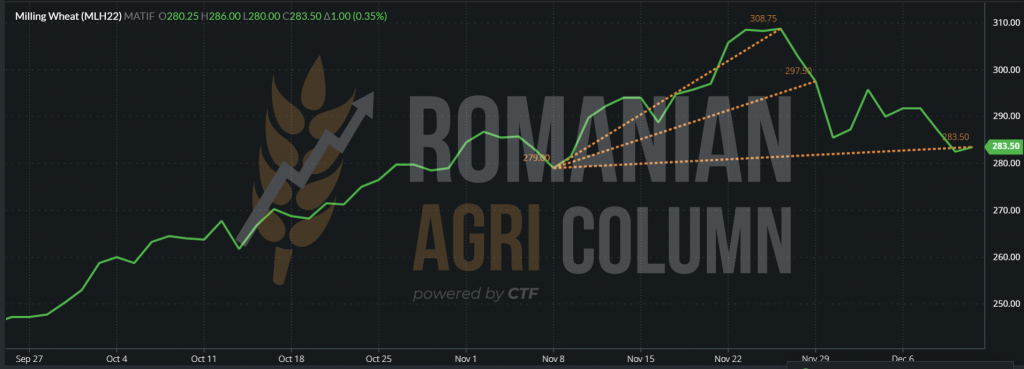
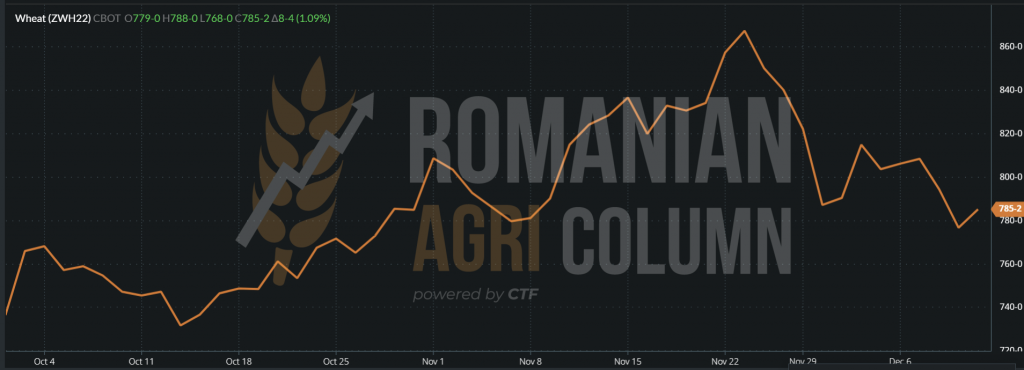
EURONEXT MLH22 – WHEAT MARCH 2022 – 283.50 EUR (+1)
EURONEXT MLH22 TREND – WHEAT MAR22
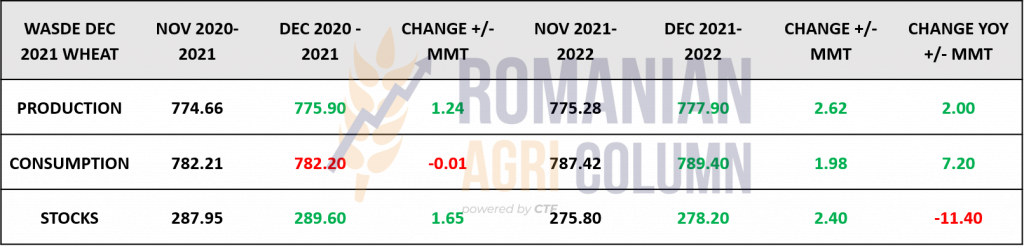
The report generated by WASDE caused a stagnation and a decrease in the price of wheat. The effect was already negative before the report, caused by the panic induced by Omicron, the new strain of COVID-19 virus. The report came and, by simply adding some positive factors of production in Russia (+1 million tons) and Australia (+2.5 million tons), lowered the quotations. The interest was suddenly tempered due to the above factors, the buyers being able relax regarding the availability of the goods. But the calculation between Production, Consumption, Stocks and Trade does not indicate any relaxation. In other words, the fundamentals of the physical wheat market remain in the same position.
| PRODUCTION + 2.62 million tons | CONSUMPTION +1.98 million tons | STOCKS +2.4 million tons | TRADE 205 million tons.
777.9 (PRODUCTION) – 789.4 (CONSUMPTION) + 2.4 (POSITIVE DIFFERENCE FROM MONTH-TO-MONTH STOCK) = -9.1 million tons |
This calculation shows us the fragility of the foundation system. And at the same time, it indicates that production is lower than consumption, in the context in which stocks experienced an increase generated only by Australia, USA and Canada – Australia, of course, due to an improved crop, USA due to a recalculation of the crop and Canada identical, against a background of a crop re-evaluation.
So we are only talking about inventory figures, not about productions coming out of the fields and entering the warehouses.
And as usual, we will cross the ocean first, to note what is happening in North America, where the stock exchanges, in the trading of December 10-11, 2021, are starting to accumulate on all fronts. CBOT, KANSAS are the beginning example of the funds’ interest, which after liquidating positions through RISK OFF through trading bots driven by the panic created by the Omicron strain, are now starting to regroup and start accumulating NET LONG.
Thus, we have ZWH22 MAR22 CBOT +8 c/bu (2.93 USD) to 785 c/bu (288.43 USD). We would like to mention that there were levels of 768-779 c/bu during the trading session. KANSAS is also rising to 805 c/bu ($ 295.78), up 9 c/bu ($ 3.30).
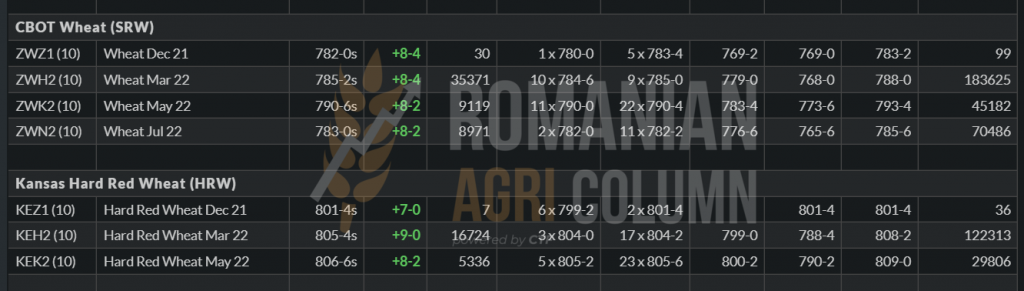
CBOT ZWH22 10-11 December 2021 – 785 c/bu (+8 c/bu)
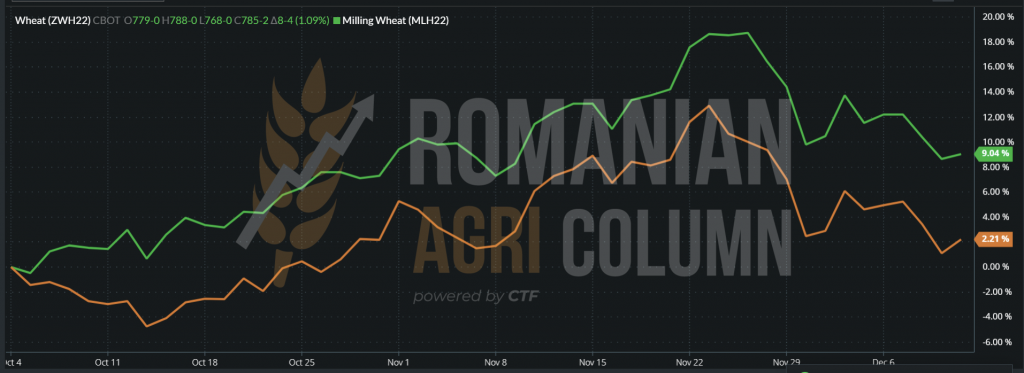
Comparison of wheat route EURONEXT MLH22-MAR22 and CBOT ZWH22 – MAR22
We return to Europe to resume the course of last week and the auctions that took place, taking a brief look at Argentina, where we see in a report generated by BAGE an increase in wheat production estimates by about 700,000 tons, from 20.3 million to 21 million tons, so not 22 million tons, as estimated by other area analysts.
Recent transactions:
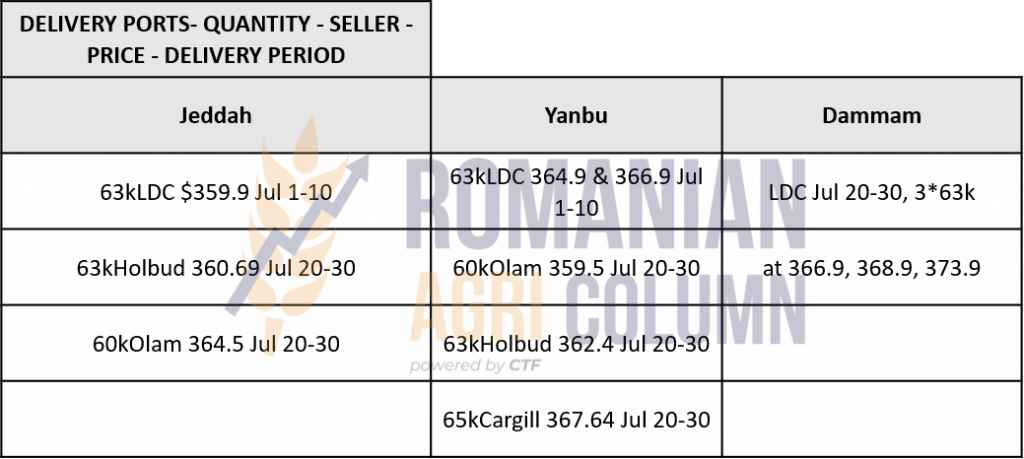
- SAUDI ARABIA purchased approximately 689,000 tons of new crop wheat at an average price of 365.14 USD/MT C&F. From here you can perform 1:1.13 parity calculations and logistics costs between 36-max 39 USD/MT.
- FRANCE recorded transactions of about 600,000 tons of feed wheat for CHINA.
- JORDAN – 60,000 tons at a price of 341 USD/MT CFR AQABA. The origin is Romanian, because the winner, The Andersons, an American company, was not reported as a participant in the auction, but of those who bid, only one did not disclose the price. The assumption is that it will supply the goods through The Andersons in Jordan. The traditional trading houses, CHS (359.9 USD/MT), Cargill (389.85 USD/MT) and the outsider Agro Chirnogi (351 USD/MT) also participated in the auction.
There is a latency in the Black Sea basin, where buyers are somewhat confused by the fact that it is not known what will happen next and are reluctant to buy, generating a lack of offers, which is felt in Russia, Ukraine and Romania. The basic indication remains 335 USD/MT FOB CVB or Russia, but the potential purchase ideas are at the level of 331-332 USD/MT. However, the difference of 4 USD remains a clear obstacle at this moment. Calculating 335 USD/MT FOB Constanța, it results in a level of 296.2 EUR/MT FOB, which reflects 290 EUR/MT CPT, without the exporter’s margin included. However, between 273 and 290 is a very long distance, about 17 EUR. It’s called an opportunity price and it’s legit.
There is nothing left of the Russian attempt to raise the price by launching a hypothetical export quota. What we see now is just a much higher export tax, at the level of 91 USD/MT and deposits of Russian farmers heavily loaded with wheat. This is actually like a time bomb in February and March 2022. We have three scenarios here to consider:
- The commodity stagnates only due to the higher price expectation of Russian farmers, against the background of the small supply in the global market and guaranteed by the global trade estimated at 205 million tons. They believe that the tariff barrier of 91 USD/MT will act as a factor of pressure on the global market after the holidays. However, the Russian ruble is weakening against the USD, from a level of 70:1, to a level of 73:1 (RUB-USD).
- Russian goods will flood the Black Sea basin in February-March, in an attempt to get rid of stocks, because the new crop is very well defined on the horizon at that time.
- Wheat is kept under pressure in Russia due to the need for local supplies in the event of Russia’s armed conflict over Ukraine.Economic sanctions will exist if Russia decides to invade Ukraine and the population must be fed. Thus, this pressure generated by export taxes, hypothetical quotas, is only congruent with another very well-defined goal and to cover the internal needs of a population of over 147 million souls.
From any scenario, a wheat price route is subsequently born. In the first two, the price of wheat in the basin will stagnate, but Romania has a play interval where it will not be disturbed by anyone, namely the period after January 1, 2021 and January 10, 2021. Then in Russia and Ukraine Christmas is celebrated according to the old orthodox rite, more precisely on January 7, 2021.
However, in the case of the third scenario, if it happens, the price of wheat will rise sharply. The two fighting countries will no longer export goods and thus the main supply line will be effectively cut. We do not want a regional conflict. This would certainly impact Romania as well, but if the third scenario is not taken into account, we have a question: What if they are wrong and we are right?
ANALYSIS
- The foundations of the wheat remain unchanged. Demand is higher than supply. Minus 9.5 million tons is the difference, and the 2 million recovered caused the price to fall in the Black Sea basin. Buyers are confused by the end users who are still waiting.
- A potential conflict in the basin area would effectively cut off any supply and cause the price of wheat to rise rapidly.
- French feed wheat is in demand in China, with 600,000 tons recently purchased
- Australian production does not qualify in some destinations because it cannot meet the percentage parameter x% maximum sprouted grain.
Barley market
The indications of the feed barley in the CPT Constanța parity suffered a degradation due to the negative traction generated by the wheat. The indications are at the level of 245 EUR/MT. Romania has exceeded 1.54 million tons of exported feed barley reported by December 1, 2021.
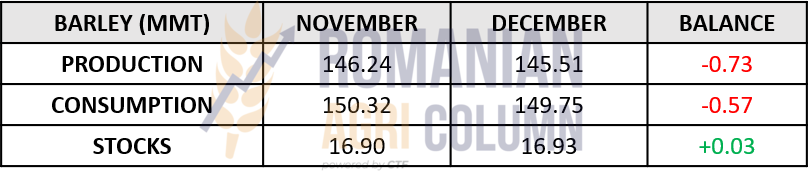
Despite all this degradation caused by the negative traction of wheat, globally, barley is not in a happy situation in terms of production, stocks and consumption. Production decreases by 0.73 million tons, consumption decreases by 0.57 million tons and stocks remain unchanged, at around 16.9 million tons.
Production increased for Australia by 1 million tons to 13 million tons, but decreased in the EU by 1.15 million tons to 52.75 million tons, and Iran also it was reduced by 0.4 million tons to 2.7 million tons.
Australian exports are seen rising by 0.5 million tons, but for now, their access to the Middle East is being logistically penalized, with higher costs than those in the Black Sea basin.
We also note a transaction for the new barley crop of Romanian origin. Jordan purchased 60,000 tons of new crop barley with delivery July 1-15, 2022 at a price of 303.7 USD/MT C&F Aqaba. The seller is Agro Chirnogi. Our estimates indicate a level of 225-227 EUR/MT CPT Constanța. So we have a first indication for the new barley crop. Other indications will come soon, as the season is just beginning.
Corn market
The price indications for maize in the CPT Constanța parity were not amended by the WASDE report. They remained constant at 235 EUR/MT in the report’s scenario, which indicates increases in production in the European Union by 2.5 million tons and in Ukraine by 2 million tons. In the European Union, Romania is again among the volume generators, so that the extra 2.5 million tons are generated by Romania, France and Poland.
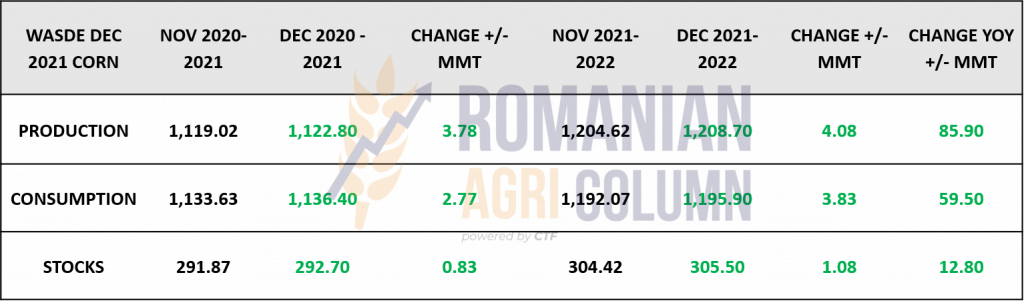
Summarizing Production, Consumption and Stocks we have the NEUTRAL image. PRODUCTION +4 | CONSUMPTION +3.83 | STOCKS +1. The first two are offset, and stocks have not yet risen to make an overall impact.
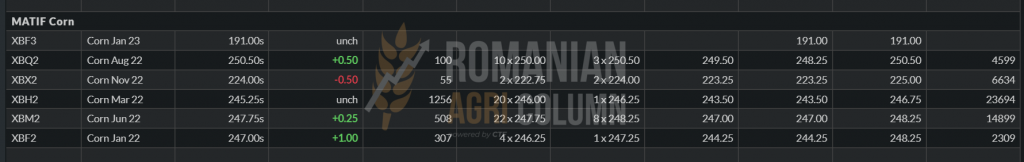
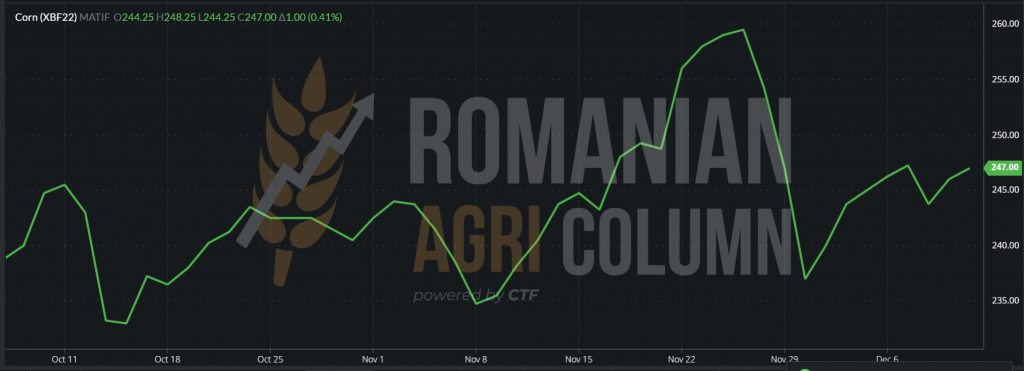
EURONEXT maintained the corn indication line at 245-247 EUR. The basis minus Premium 10 EUR correctly reflects the indications of the Port of Constanța.
EURONEXT XBF22 corn JAN22 – 247 EUR at the close of 10 December 2021
Euronext XBF22 trend pre and post WASDE. The right side of December 9 also shows the “hiccups” generated by the report, then we see the return to the trend at the level of 245-247 EUR.
The report also generated a crop surplus in Ukraine of 40 million tons. However, our estimates with the information generated by the Ministry of Agriculture of Ukraine indicate 35 million tons of crop and a harvest level of 87.5%. Thus, a total of 39.5 million tons were generated.
However, we assume that the production per hectare is higher and reaches the level of 40 million tons harvested. But the moisture base of the corn is omitted from any calculation. And so we estimate a percentage of at least 4-5% excess moisture above the standard level of 14%, which would naturally lead to a level of 38 million tons, standard cargo, as they say. Because corn cannot be kept moist because it gets hot, moldy and the aflatoxin level rises, so the goods are not suitable for human or feed consumption.
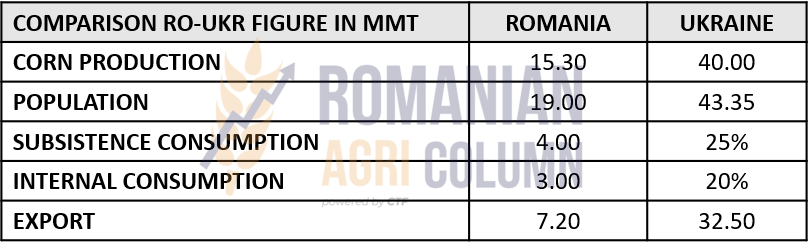
At the same time, the drying costs are conglomerate somewhere and someone pays for them, but we’ve talked about that before. However, nothing is said about subsistence consumption, which is also related to Romania. The tradition of the countries bordering the Black Sea and not only consists in raising for their own of birds and poultry. They eat corn harvested from cocoons and stored behind people’s backyards. If we draw a parallel between Romania and Ukraine, we see the figures below:
- At a production of 15.3 million tons in Romania, subsistence swallows 4 million and domestic consumption about 3, with an export of 7.2 million tons, all related to a population of 19 million people spread over an area of 238,397 square kilometers.
- Ukraine, with a population of 43.35 million, spread over an area of 603,628 square kilometers generates a production of 40 million tons and an export of 32.5 million tons. If we extrapolate domestic and subsistence consumption at the level of Ukraine formulating as a percentage as in Romania, the figures exceed the level of the crop.
The pace of Ukrainian exports remains very strong and we record information about 400,000 tons purchased by China in recent days, at the level of 270-274 USD/MT FOB, which says a lot about the logistical support in the Black Sea basin and also raises the signs question regarding the Chinese rush in supply. One of the reasons is, of course, the potential smoldering conflict between Russia and Ukraine. The Russian strategy also includes taking over the south with access to the Black Sea. Chornomorsk, Odessa and Mykolaiv are effectively Ukraine’s main export arteries. If access to exports is cut off, Ukraine will be left without exports to the Black Sea.
But for now, let’s put aside the worst possible scenario and expose another factor supporting the price of corn in the basin – the weather, which logistically constrains the supply chain of corn from the fields to the delivery ports in Ukraine. Wet maize causes delays in harvesting, increasing costs and time for the simple reason that the goods must enter and exit the locations that have dryers. So, if things go well, in March-April we may see a surplus of goods on the market in the Ukrainian area. This would put pressure on the price of corn naturally, causing it to fall.
Logistics costs between the Black Sea and NE Asia are at a low level of about 6 USD/MT (38 USD/MT), compared to US GULF – NE Asia, where they increased by 3 USD, up to 71 USD/MT. So we have a 33 USD logistical difference in favor of the Black Sea Basin. This explains why China is predominantly sourced from this area.
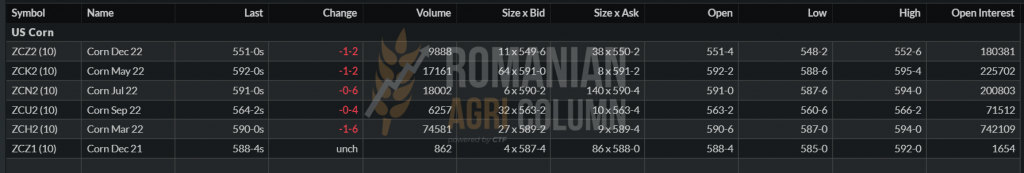
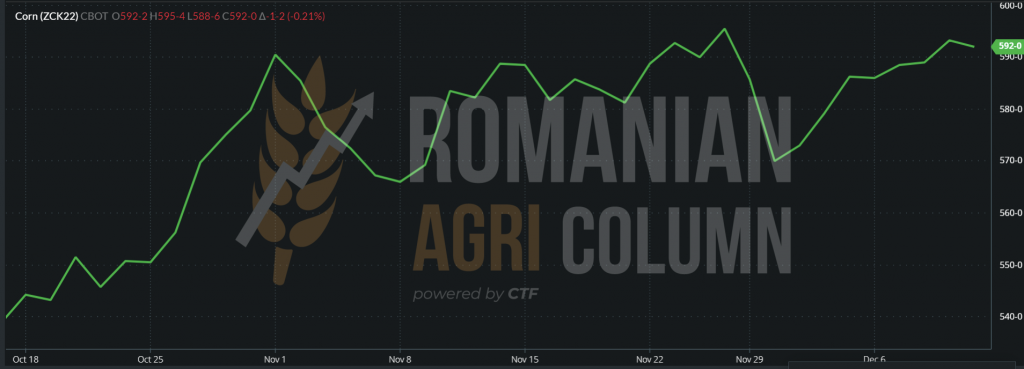
From the evocation of North American logistics costs, we move to the North American market, where we see CBOT on corn at the end of the trading session on December 10 at the level of 592 c/bu (233 USD).
CBOT ZCK22 MAY 2022:
CBOT ZCK22 MAY 2022 TREND – WASDE report did not disturb the trend of American corn.
The United States is on its way and is generating corn sales. On December 8, 2021, in a single transaction, they sold 1.85 million tons to Mexico. We all remember the summer when we reported the extreme drought in Mexico and no one else did. Mexico is now the main US customer for corn.
NASS will effectively report any changes in US production in January. Until then, they remain at 15,062 billion bushels or 382,595,000 tons.
But due to South America’s better corn export logistics, phase 1 of TRADE DEAL with CHINA will not be completed. This is a cumulative level of 80 billion USD between 2020 and 2021.
In South America, things are moving steadily towards the forecast figures. In Brazil, CONAB still estimates a production of 120 million tons of corn. These figures remain strong even if we see alarms of all kinds coming from the Rio Grande del Sul region, where drought is forcing some farmers to give up planted and dried corn and plant soybeans. To clarify this, we must mention that Rio Grande del Sul accounts for 4-5% of the 120 million tons forecast, so very little. And not all farmers switch between dried corn and soybeans to save the season. Brazilian corn is harvested in two stages, the first crop in February-April and the second crop in June-July, Safra and Safrinha, as they are also called.
The Argentine forecast remains at 54 million tons, problems are not on the horizon for Argentine corn. The period March-April will be the one in which the corn from Argentina will be harvested.
ANALYSIS
- China is betting on the Black Sea Basin for logistical costs
- WASDE has not damaged corn indications globally
- US maintains sales pace, whether it’s exports to Mexico or industrial use for ethanol
- Brazil is on track for a very good crop
- PRODUCTION, CONSUMPTION and STOCKS keep pace with corn prices
- In the spring, we could face additional pressure from two places: Ukraine with a higher level of goods and the South American crop.
Rapeseed market
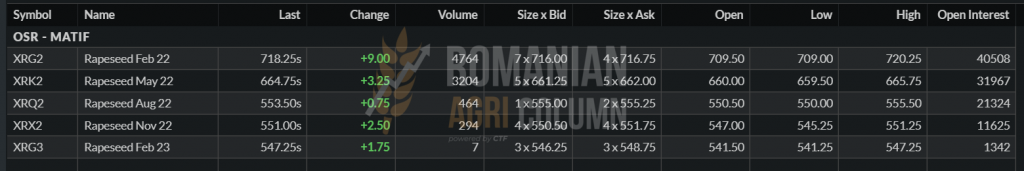
The old rapeseed crop acquires the long-awaited consistency. The traction generated by the lack of raw materials, aggregated with an increase in the price of fossil energy led to a price level in CPT Constanța of 698-700 EUR/MT.
In other words, we see this spot as an opportunity to liquidate the positions of the old rapeseed crop, referring to the physical goods. The subsequent indication for the new crop, MAY22, also applicable to the old crop, has a negative difference of 53.5 EUR, a sign that at that time the demand is moving rapidly towards the new crop.
Our firm recommendation is to liquidate stocks. It is the moment that we have been estimating since September and that we have always supported. There’s demand, it’s time.
EURONEXT XRG22 FEB22 – 718.25 EUR
As for the new crop, we still have a long way to go and many surprises can come our way in the winter, which can sometimes be unpleasant.
The current indication of 553.5 EUR is one with historical potential and we will analyze together what December has generated over time.
XRQ22: February 20, 2020 – December 10, 2021
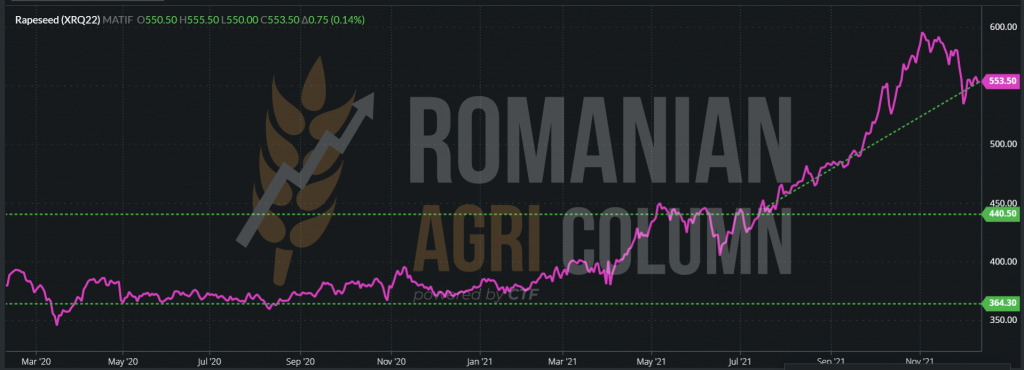
So we have a price range that moved between 364 and 440 EUR/MT, a long range, which started a steep rise when the signs from Canada began to appear, more precisely in August 2021. What we note now about the new crop is 7% larger in the European Union, up to 5.6 million hectares, an area of 1.6 million hectares in Russia, 1 million hectares in Ukraine. At the same time, Australia generates a crop of 5.7 million tons, up from 4.8 million tons forecast, China 14 million tons, India 8.75 million tons and, of course, Canada, in the loss of at 21 million tons forecast at 12.7 million tons.
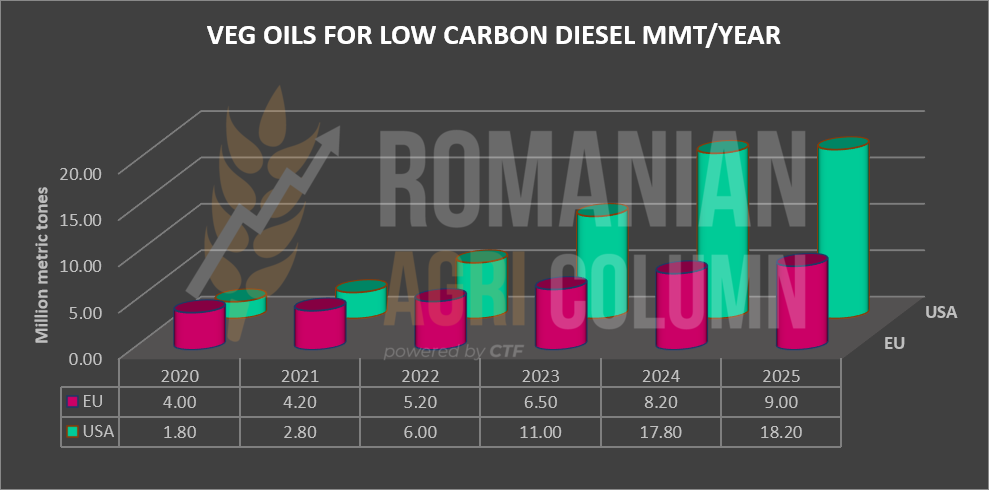
Global demand exists, the price potential is in place for the new crop, the use of rapeseed remains a profitable activity for processors and the demand for rapeseed oil is also sustained, as we can see in the chart below. The composition of vegetable oil and rapeseed, especially in diesel fuel, will increase exponentially in the US and Europe to reduce the carbon footprint.
Sunflower seed market
The indications of sunflower seeds in the port of Constanța are at the level of 660 USD/MT, while the processors indicate 650 USD/MT. We record a batch of 16,000 tons traded in Romania at a level of 660 USD/MT FCA, with a transport quotation to the processor of at least 15-18 USD/MT, a sign that some processors want to be secure in terms of volumes freight.
But it is this signal that indicates a potential future price, aggregated with the way we analyze the Ukrainian, Russian and Turkish import data.
According to the USDA, the Ukrainian sunflower crop will generate 17.5 million tons, which is in contradiction with the data generated by the Ministry of Agriculture in the same country. The last estimate was quoted at 16.2 million tons for 99.5% harvested area. But even from here must be extracted a surplus of about 3% consisting of foreign bodies and excess moisture over 9%.
Russian production is also up 0.5 million tons to 15.5 million tons. The same factor of extraction of the surplus of foreign bodies and humidity we indicate in this case as well.
Turkey is credited with an increasing level of sunflower seed imports from 1.32 million tons to 1.35 million tons, indicating a growing domestic consumption.
EU production was left at the same level of 10.15 as Argentina’s production at 3.4 million tons.
In conclusion, according to the USDA, global production of sunflower seeds increased by 1 million tons (UK + UKR) to 57 million tons. Consumption increased by 0.6 million tons, to the level of 56.4 million tons, and stocks by default by 0.5 million tons, to the level of 2.28 million tons.
The indication of crude oil in FOB Ukraine is 1,360-1,380 USD/MT, and the Rotterdam quotation is 1,420 USD/MT. Platts indications for sunflower oil in January are 1,388 USD/MT in FOB Ukraine. Sunflower seeds are quoted in FOB CVB at USD 676/MT, equivalent to USD 664-666/MT CPT, with the exporter’s margin included.
What awaits us next? A mix between demand and supply arbitrated by the VEGOIL complex composed of palm oil and soybean oil. January and February will provide answers, hopefully positive, in terms of price. Looking at the revised forecast of raw material imports from Turkey, which is growing, calculating with great responsibility the harvests in Ukraine, Russia, Romania and the rest of the European Union, extracting, of course, an amount of 2-3% composed of foreign bodies and excess moisture, we were trying to see positively the path of sunflower seeds in Q1 of 2022.
The soybean market
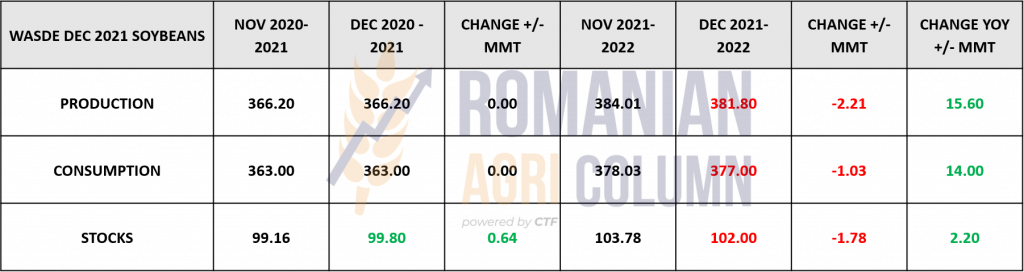
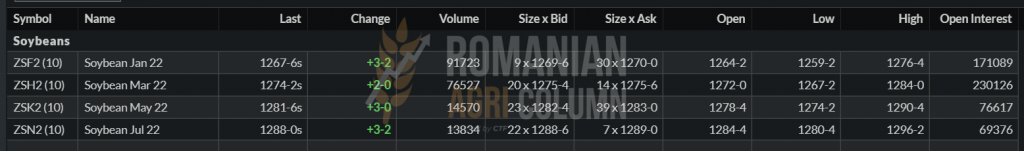
Soybeans show an upward trend after the WASDE report. As China’s output was revalued by a decrease of 2.6 million tons, it generated an overall decrease of about 2.2 million tons globally, through offsets.
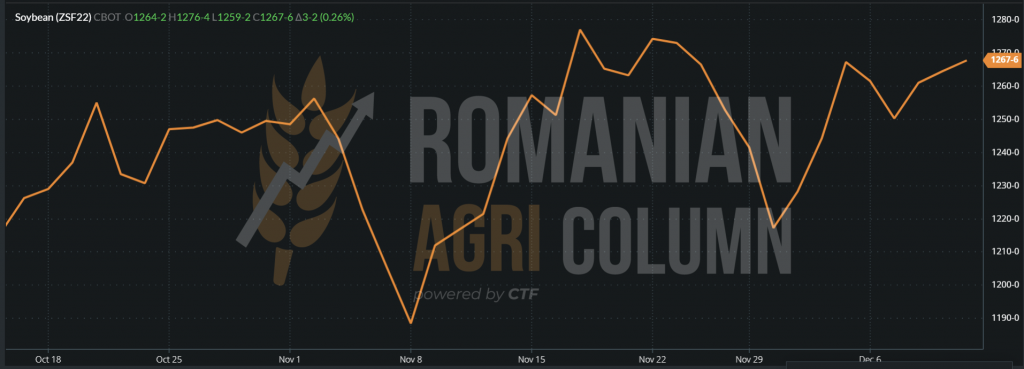
CBOT reacted as a consequence and we see the closing of December 10, 2021 at the level of 1,267 c/bu (465.54 USD), with an increase of only 3 c/bu.
CBOT ZSF22 – 1,267 c/bu – IAN22:
However, if we follow the soybean price path, we notice the recovery it has made since the decrease generated by the previous report in November 2021. From 1,190 c/bu to 1,267 c/bu, i.e., more precisely, 77 c/bu = 28,3 USD.
Locally, the indications remain at the level of 620 USD/MT, but the processors do not show a special interest in this period in which the concern is to process the 2021 rapeseed.
Fertilizer market
| Through this chapter we try to initiate a flow of information that will keep you up to date with this particularly important segment of agribusiness and that actually keeps the headline through its impact on future crops. |
And we start by informing you that Australia will have special problems due to the fact that urea is generated from imports, and this import comes 80% from China. Apart from the consequences of not having a very good relationship with China during this period, China has suspended the export of fertilizers in an attempt to protect its domestic market. Urea lumps imported from China are rolling and there are other problems on the horizon in Australia, namely transport. We all know that the Australian transport infrastructure in Outback is based on lorries, and an ADBlue crisis is just weeks away. In this way, the transport of goods of any kind will be paralyzed. Effectively, they will be pulled on the side for lack of ADBlue. And things don’t stop there. They will generate in the absence of supply of any kind and will culminate in agribusiness, where the machines will also be pulled over. Who’s next? It looks like South America, which uses the same inland transportation system.
Fertilizer price forecasts based on supply and demand face a basic dilemma. Not only is the industry notoriously untransparent, but unlike most other commodities, trade policies continue to affect markets that suffer from supply chain disruptions.
There was some good news for growers last week: Urea prices fell by 35 USD/MT in the Gulf and also broke from the Middle East to South America. The UAN price remained constant due to the completion of the investigation into unfair competition from Russia and Trinidad and Tobago by the USA. So. During the investigation, the supply went normally, without any delays or blockages. These countries have unfairly subsidized exports to the USA. When the Commerce Department investigation is completed in early 2022, these goods will be charged retroactively.
The US and its allies have also added sanctions against Belarus and its potassium-exporting industry, although the order gives US companies 120 days to enter into agreements with the big fertilizer supplier, which could ease the movement’s impact on spring planting needs. However, potassium is far from a free market, with several large exporting countries controlling supply.
Russia, another major exporter of potassium, has meanwhile announced export limits for nitrogen products. While the list would reduce UAN shipments, urea and ammonium nitrate quotas were set at normal levels. This could reduce the impact of the restrictions, as the industry is waiting for news of India’s biggest auction, which could take place this week. Chinese restrictions on urea and phosphates also remain in place, with other countries also pursuing quotas to ensure that their farmers have access to supplies.
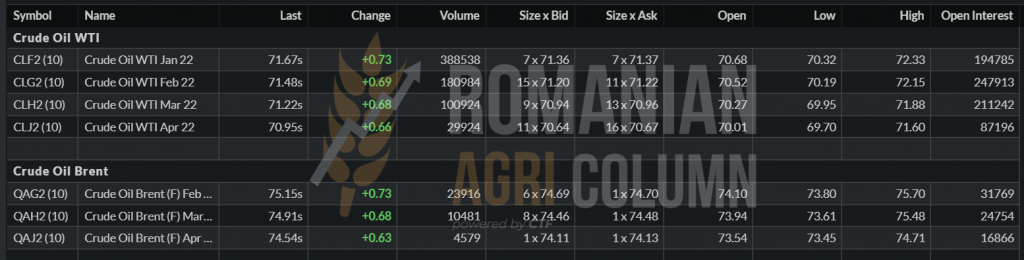
Fossil energy
BRENT 75.15 USD/barrel | WTI 71.67 USD/barrel
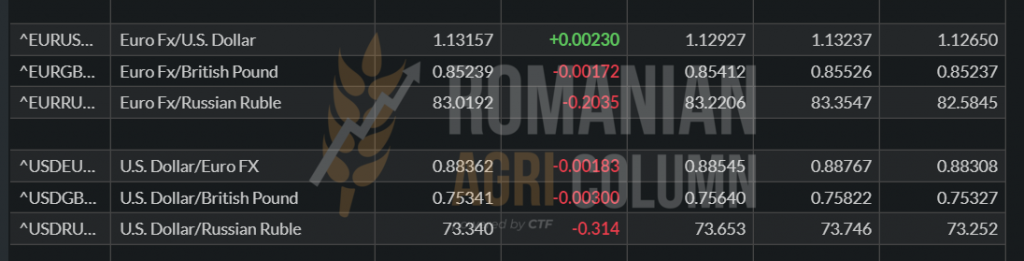
EUR-USD parity
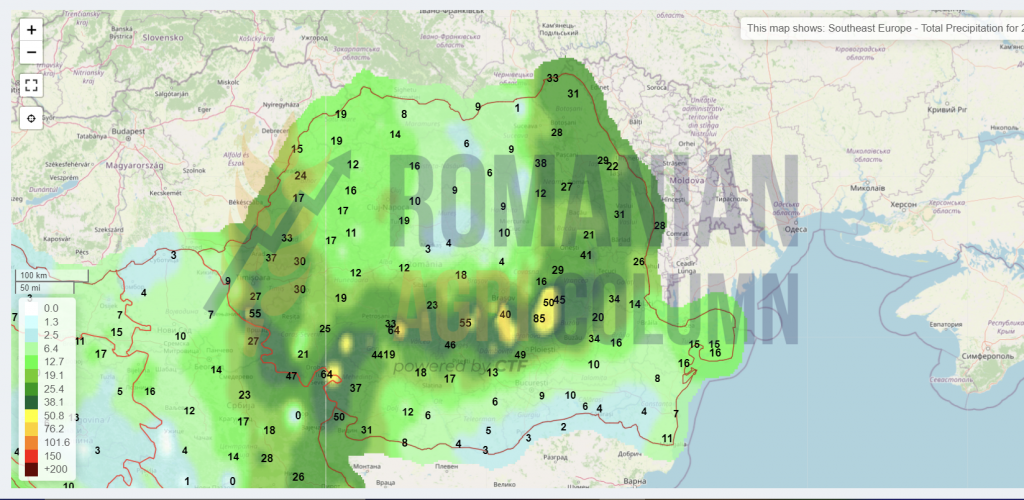
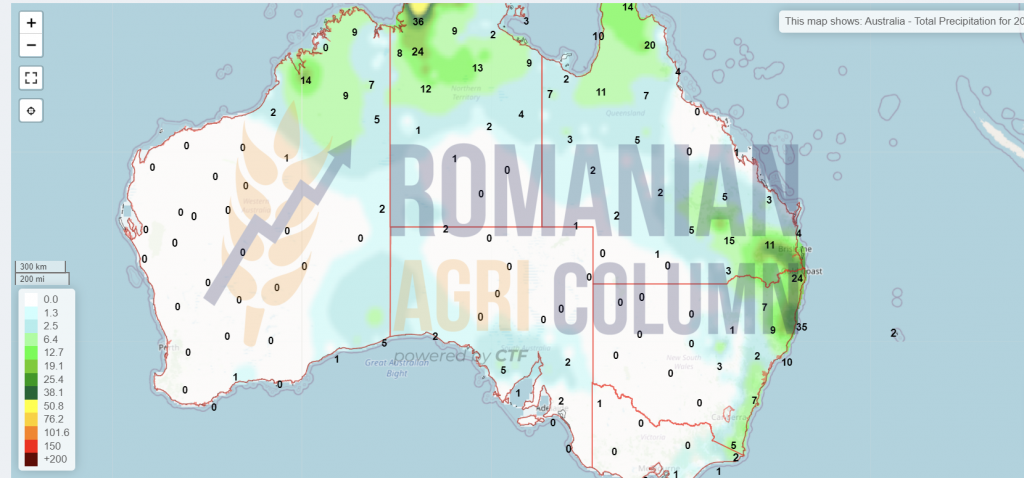
Weather forecast
11-18 December 2021
Romania (rain)
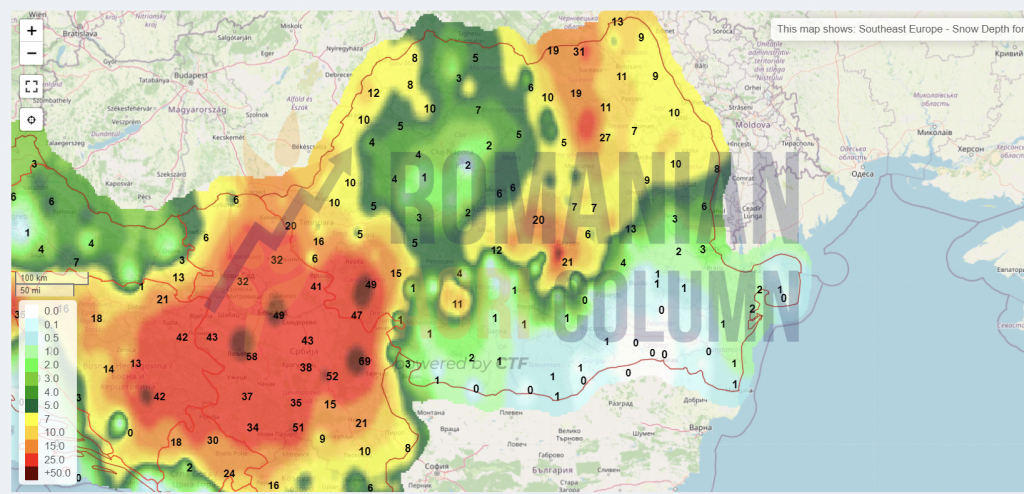
Romania (snow)
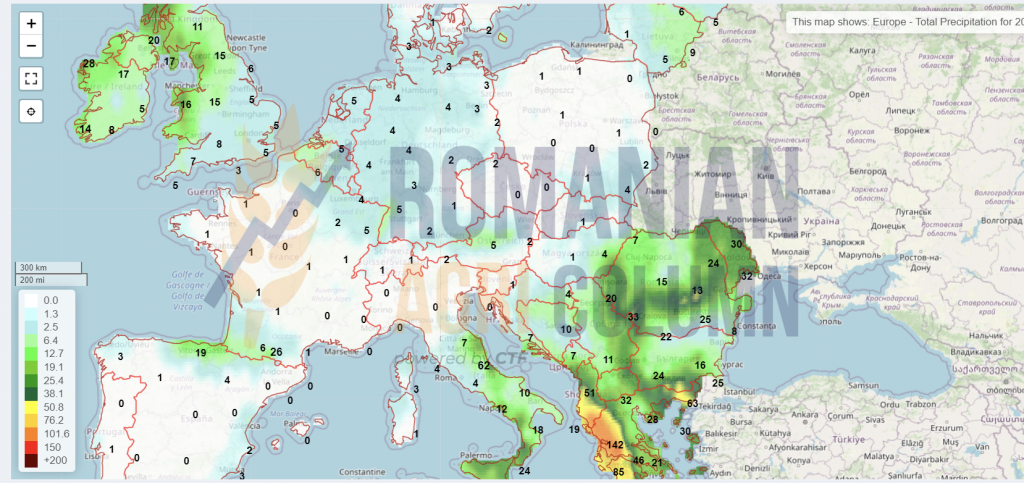
Europe (rain)
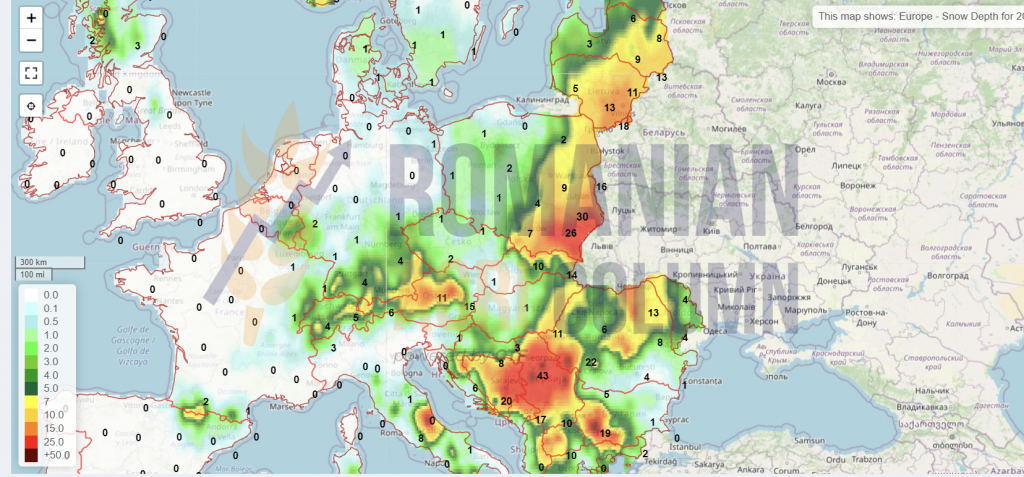
Europe (snow)
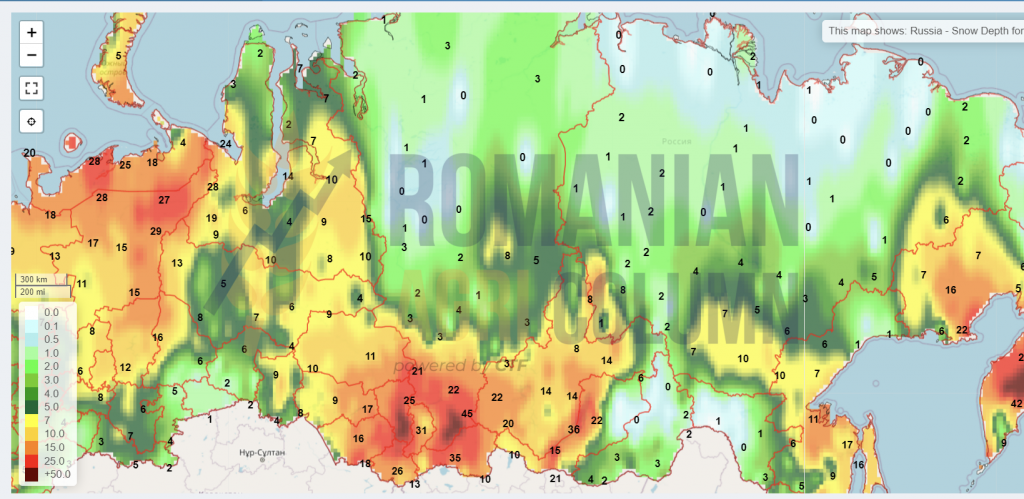
Russia (snow)
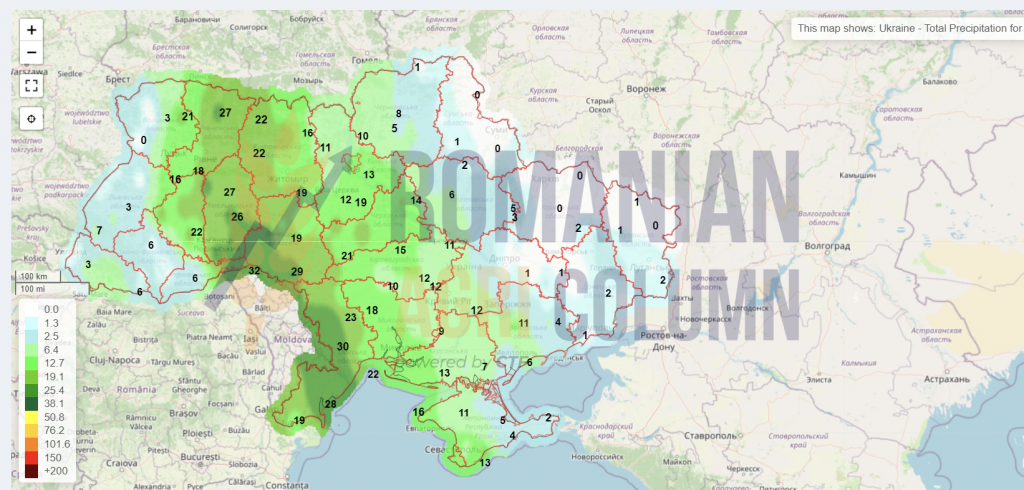
Ukraine (rain)
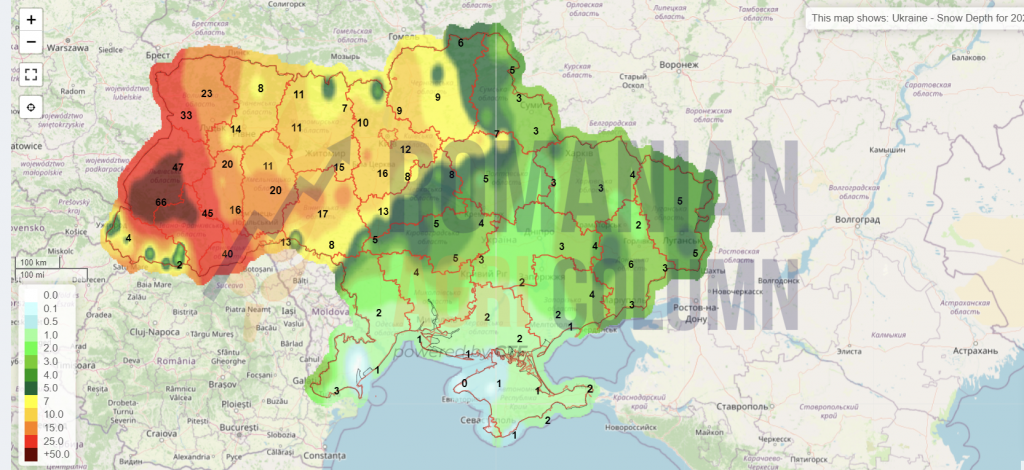
Ukraine (snow)
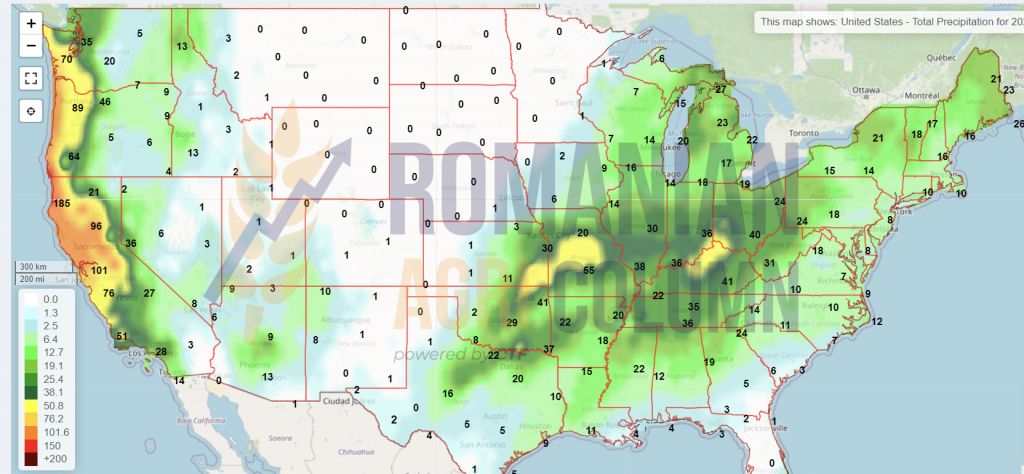
USA (rain)
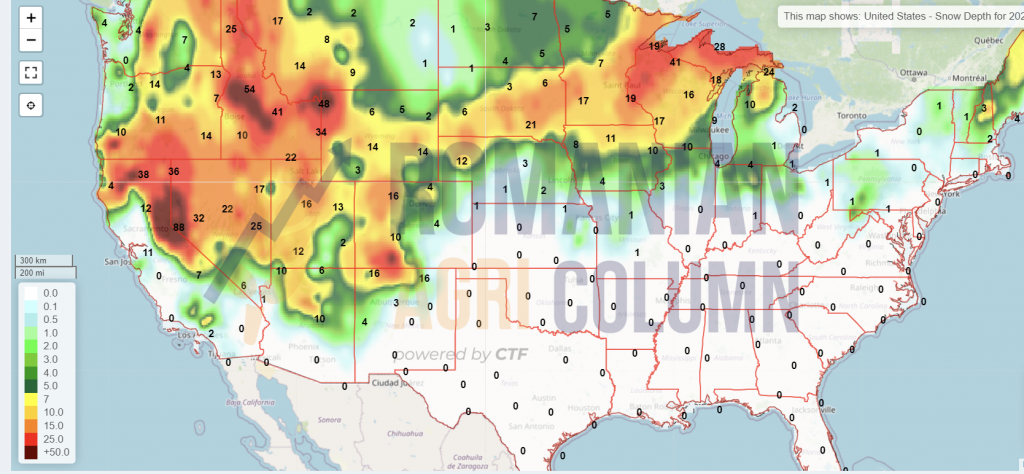
USA (snow)
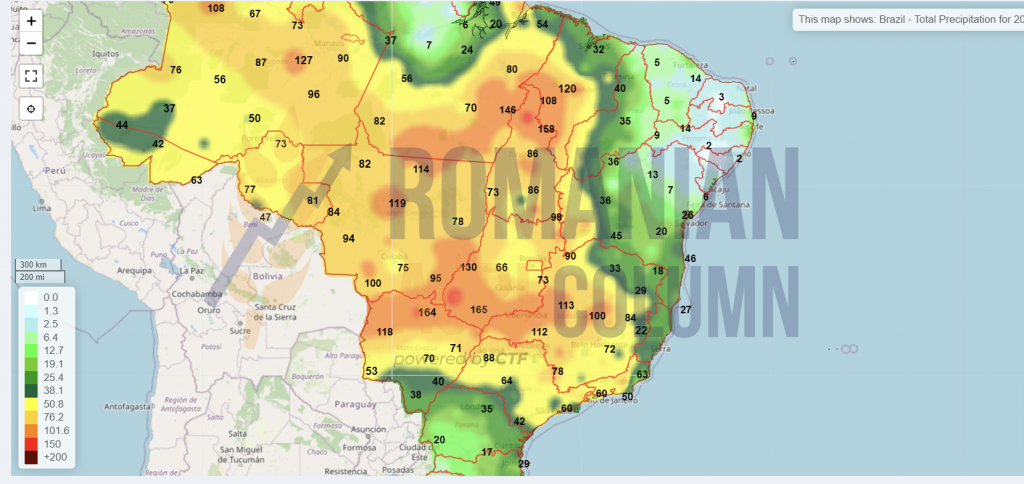
Brazil
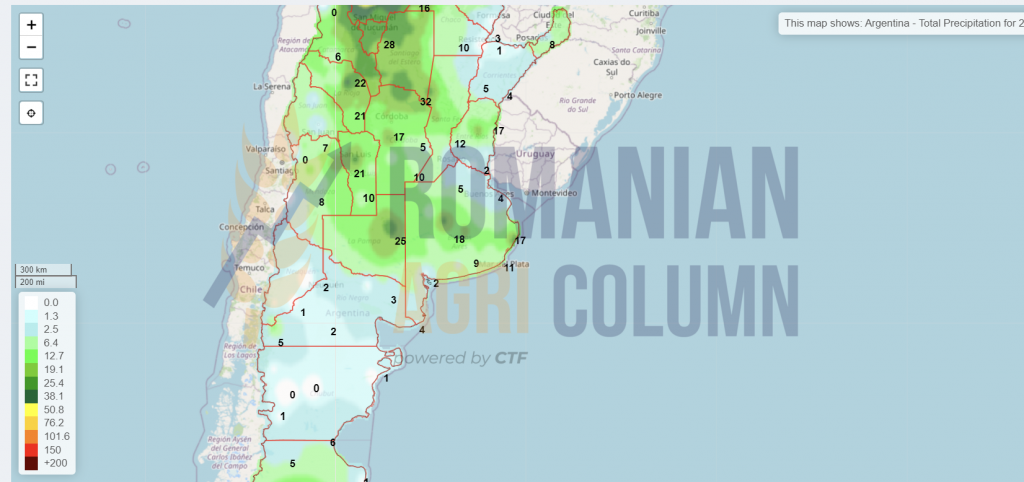
Argentina
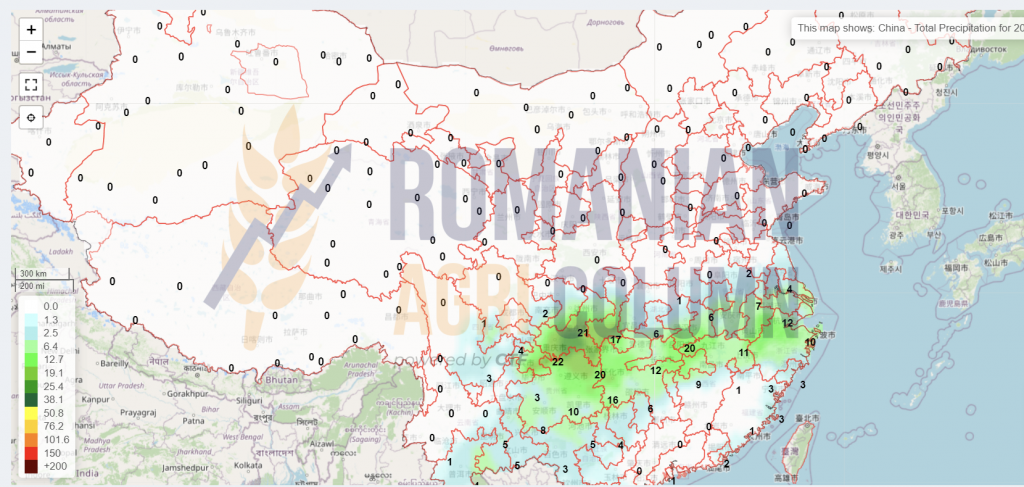
China
Australia – the rains stop
© Romanian AGRI Column, 2021, all rights reserved