This week’s market report provides information on:
Farmers from the 5 countries belonging to the European Union are experiencing a moment of respite these days. More precisely, until June 5, 2023, when a decision will be made regarding the maintenance or lifting of import restrictions in the 5 countries near Ukraine.
But this respite is only a moment of calm in the eye of the storm that is about to begin. Mr. Zelensky was extremely impetuous in his statements regarding the import restriction assumed by the European Commission through the safeguard measure adopted under the pressure of Poland, Hungary, Slovakia, Bulgaria and, of course, Romania.
A Romania which, it should be mentioned, did not take the unilateral restriction measure like the other countries, but completely respected Regulation 870/2022, originating from the Association Agreement of 2017. It was a gesture of extreme knowledge of European regulations, a gesture of moral and legal health of Romania, this having a maximum score in the future assessment of our country in terms of predictability and legal and commercial health.
Returning to the context, we must dissect the words of Mr. Zelensky, who was automatically warned by Mrs. Ursula von der Leyen, who at the press conference in Kiev was exactly on the same note, namely, the fact that the import should not be restricted in the 5 nominated countries, and the transit will be accelerated through the lines of solidarity.
It is certain that this calm before the storm was bought with the funds intended for the 5 countries, which could no longer endure the onslaught of cheap goods from Ukraine, but what will follow after June 5, 2023 will effectively be a tipping of cargo volumes from the Origin Ukraine towards the European Union through the lines of solidarity.
And Romania will feel the biggest impact. Why do we say this? Because the route through the port of Constanța is the cheapest and safest in terms of logistics costs. The Cereal Corridor with JCC inspection in Istanbul is good, it is a pressure release valve for volumes to European, Turkish, Asian destinations including China as well as Africa. But the logistics costs through the Corridor, which has 3 ports, Odessa, Pivny and the Chornomorsk satellite, are extremely high compared to the logistics cost through Constanța.
That being said, we link Mr. Zelensky’s statements with Ms. von der Leyen’s of a single parameter, the commercial-financial one. Because Ukraine needs to sell goods, agricultural and processed raw materials, and the European Union needs cheap agricultural and processed raw materials. Everything has a beginning and an end. Everything has an interest at each end of the supply chain.
Ukraine needs to sell, and the EU processing needs cheap freight to generate as consistent a profit as possible. And Ukraine will need a crossing through Romania, Constanța port, with or without restricted import of at least 25,000,000 tons in 2023, because once again, it is the cheapest logistic route.
So let’s not be under the illusion that the Ukrainian flows of goods will stop someday. They have no way and no reason to do it. These goods are simply a partial payment for the war and humanitarian aid given to Ukraine. Nothing in this world is free.
In the season July 1, 2022, to May 14, 2023, a volume of 28,227,220 tons of agricultural raw materials, oils and oilseeds arrived in the European Union, more precisely 44.2% of the total export of Ukraine through solidarity lanes and through the JCC Corridor.
During all this time, everything that amounted to import into Ukraine of genetic material (seeds), crop protection products and fertilizers was subject to taxation by the Ukrainian state, generating revenues of USD 2.72 billion to the country’s budget.
Let’s think of everything as a business. Those who export crop establishment products to Ukraine have no problem being taxed, because these taxes are paid up the chain by the distributors and then by the farmers in Ukraine. It is a colossal business of agricultural input companies.
Ukrainian exports are exempt from taxes in the European Union. Why? Simple, because otherwise, the goods would arrive at a higher price level, which would not suit processors and producers in the livestock and meat production industry.
The 2017 Association Agreement provided duty-free quotas, and let’s take just corn and wheat as an example. For corn, Ukraine had the right to export tax-free as follows: 2 million tons to Spain, 0.65 million tons to Portugal and 0.5 million tons to the rest of the European Union without the two aforementioned countries. For wheat, Ukraine had the right to export only 1 million tons to the European Union duty-free. We don’t even mention the other quotas for oilseeds and oils, as well as for flours.
Everything is therefore a huge business of the European Union, in this case, of the production and commercial sectors.
Therefore, we must not be under the illusion that these flows will ever stop flowing to the Union.
Coming back to a possible accession of Ukraine to the Union area, does anyone think that this will happen overnight? No way.
Aacquis must be implemented in terms of rules and procedures regarding the use, standardization and regularization of all products that generate agricultural raw materials. That is, seeds, crop protection products (insecticides, pesticides, growth regulators, foliar products, phyto-technical products, etc.), fertilizers and dosages and many others. As well as the implementation of Law 178/2002, Food-Feed Safety law, called the Mother Law of Food and Nutrition, with HACCP norms, GTP norms, GMP, etc.
And what does this mean broadly for Ukraine? Time: 7-9 years for what follows, i.e. de-bureaucratization and creation of supervisory and control bodies, as well as reporting systems, implementation of communication and standard-setting bodies of European legislation, as well as their transposition into Ukrainian legislation.
But everything has a cost, and for these things Ukraine will have to pay. Just to have sustainability certification and to have traceability, a farm will have to pay a minimum of several thousand euros, not to mention the annual audit, which brings other costs.
And then in 9 years, Ukrainian raw materials will have an extremely high cost, and their farmers will no longer have the appetite for cheap sales through commercial companies. Or maybe they’ll have to sell them cheap because the bill for helping support the war of aggression is huge. And thus, Ukraine will become a union territory, a zone of cheap Origin, standardized and regimented in the European financial-commercial complex.
As for the winner of Turkey’s elections, things are starting to shape up in Erdogan ‘s favor. The potential danger in the deterioration of the relationship with Putin, the opponent Kiricdaroglu, received a blow that seems to be decisive at this time.
Namely, Ogan, the candidate in the 3rd place, the one with about 5% of the votes, declared that he supports Erdogan. This can also be seen as a behind-the-scenes, strategic move by Russia. For everyone’s understanding, Ogan lost. And a consistent offer of financial capital coming from Russia via Turkish intermediaries, would have put him in a position to accept the transfer of votes to Erdogan. Because when you lose, anything is better than nothing. And we suspect that he overbid pecuniarily in order to secure the alliance between Putin and Erdogan going forward. Because their friendship is much deeper than what we see expressed in the media.
For Romania, as a potential in agriculture, it is a good thing. Why do we say this? Because Erdogan will not allow the closure of the Corridor, he is being a direct beneficiary of cheap goods from Ukraine and Russia, and the fact that he manages this Corridor directly with Putin, gives him power of representation at the global level.
Let’s be serious, does anyone think Putin cares about the Corridor? No way. Just because he can strangle him as he pleases by delaying ship inspections in Istanbul, he gains two things:
- Moves its goods much faster than Ukraine (Ukraine spends an average of 30-40 days per ship on inspection)
- It increases the cost of Ukrainian goods due to stagnation and the war premium, thus effectively making them uncompetitive in other destinations.
The value of the total sale of Russian wheat is effectively covered by 3-5 days of sales of Russian oil. Thus, the ultimate Russian interest is to move its oil through the Bosphorus at a rapid pace. The wheat? Yes, it is important, but not for its value, but to keep Russian farmers in the production cycle and maintain a level of strength globally through exported volume. Otherwise, oil is much more important than wheat.
APPENDIX
And let’s recap European Union imports from Ukraine starting from July 1, 2022 until today, leaving out of the calculation, although there are significant quantities there, from March 1 to June 30, 2022.
CEREALS: wheat 5,000,000 tons | corn 13,100,000 tons | barley 791,000 tons | wheat flour 83,120 tons | malt 11,000 tons
OILS: sunflower seeds 1,805,000 tons | rapeseed 3,262,000 tons | sunflower oil 1,287,000 tons | soya beans 1,220,000 tons | sunflower meal 1,066,000 tons | soybean oil 198,000 tons | rapeseed meal 59,100 tons | soybean meal 345,500 tons
In total, 28,227,220 tons of Ukraine’s total export of 63,737,200 tons, i.e. neither more nor less than 44.2% of the total exported by Ukraine, was destined for the European Union.

LOCAL STATUS
Wheat quotations in the Constanța CPT parity reached a level of 205-207 EUR/MT. Feed wheat has a difference of minus 7 EUR/MT within the discount term.
The new crop is valued at 197-200 EUR/MT and the feed quality discount is 10 EUR/MT.
CAUSES AND EFFECTS
With each day that we get closer to the harvest, we understand its size in our area and we observe how very large batches of Romanian wheat leave for export in an attempt to limit the damage produced from the year 2022. Thus, we can mention an export level of Romanian wheat for the period July 1, 2022 – May 16, 2023 in a volume of 4 million tons.
With whatever effort will be made, Romania will remain with a volume of at least 1 million tons unsold from the crop of 2022, which, aggregated with a harvest volume of at least 10.5 million tons that can be seen in the near horizon, will lead to a volume of 11.5 million tons. And under these conditions, Romania will have to export at least 7-7.5 million tons in the 2023-2024 season.
This will only be possible with the understanding of the context in which we find ourselves, namely that the commodity exists in the Black Sea basin and at the EU level. The European Union extended for another year the tax exemption for Ukrainian goods, so that, with or without the extension of import restrictions in Romania, the competition will remain fierce. The routes will all lead to Constanța and we see nothing but a logistical competition – who will manage to reach and deliver the goods to Constanța first. As we know and observe, the port had and has a maximum intensity in operation, and in these moments of supposed calm it operates at maximum capacity.
USDA’s estimated global wheat volume is at a 6-year high, so these commodities must find a destination. Romanian farmers need liquidity, if and when the amounts of money promised by the European Commission will come is another topic, because they have no way to cover the effects of the distortion created in 2022 and which will continue at the maximum level in 2023.
REGIONAL STATUS
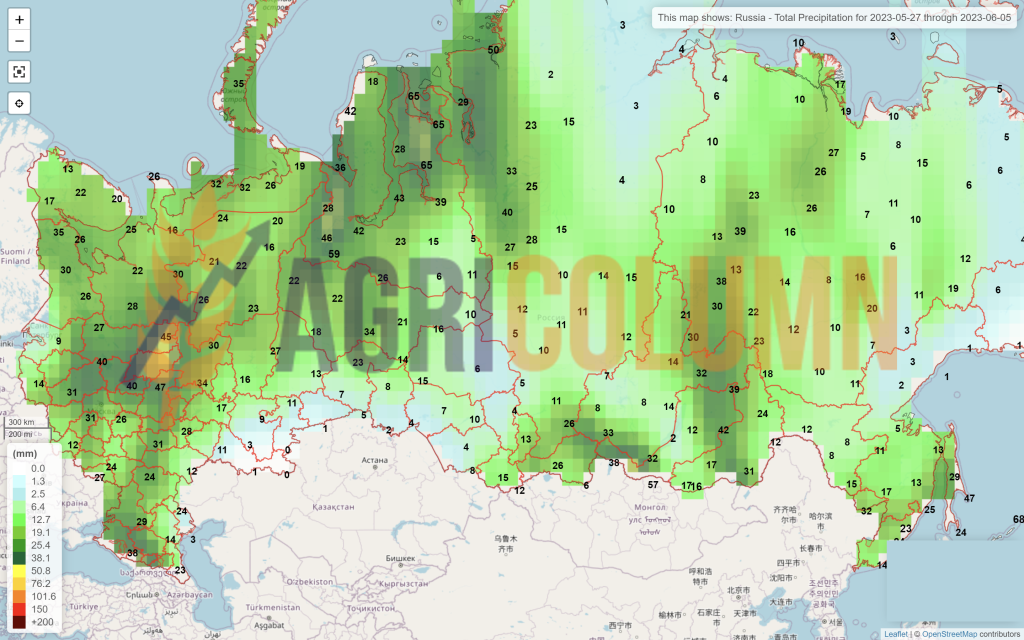
RUSSIA raises its 2023 harvest volume estimate by 1.6 million tons to 88 million tons. The USDA, as we know, has downgraded Russian volume by 10.5 million tons, but this is only an artifice to calm potential price declines. Between the USDA’s estimated 80.5 million and the Russian analysts’ estimated 88 million tons, what could we choose? History has taught us that Russian analysts were correct in 75% of internal analyses.
UKRAINE is still in the seeding campaign. Of course, they will be nearing the end, but the 16.5 million ton figure will be easily surpassed and we will certainly see a volume of 18 million tons at least.
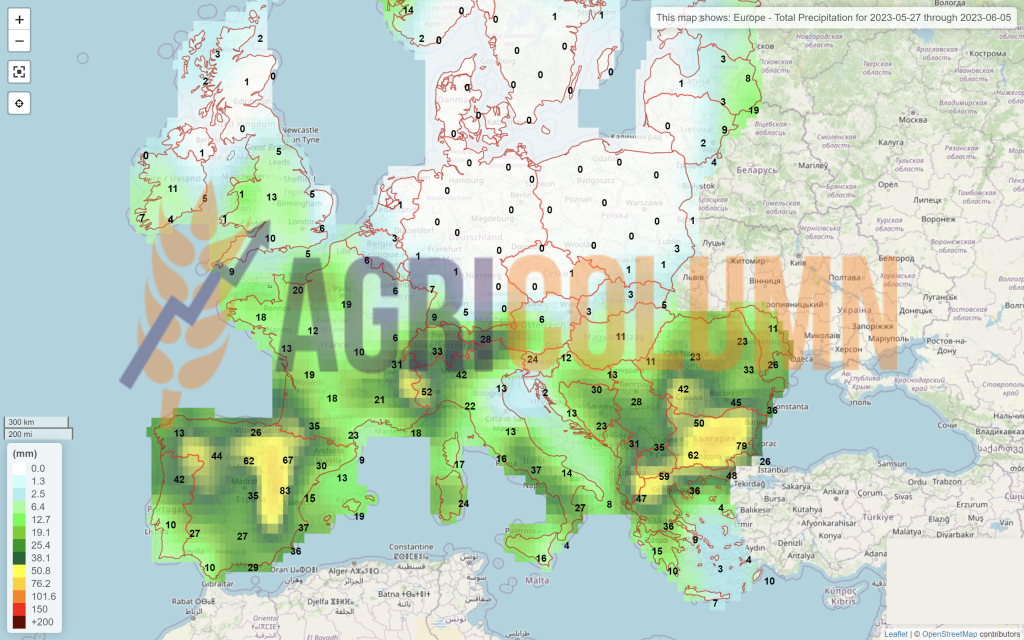
The EUROPEAN UNION continues to perform very well. Rainfall forecasts are positive until June 7, 2023, so no surprises could occur until the wheat harvest. EU exports reached 28 million tons of milling wheat alone, while imports reached 8 million tons of milling wheat and 1.7 million tons of durum wheat.

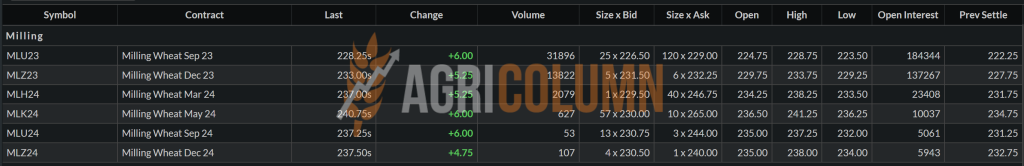
EURONEXT – MLU23 SEP23 – 228.25 EUR (+6 EUR vs. last week)
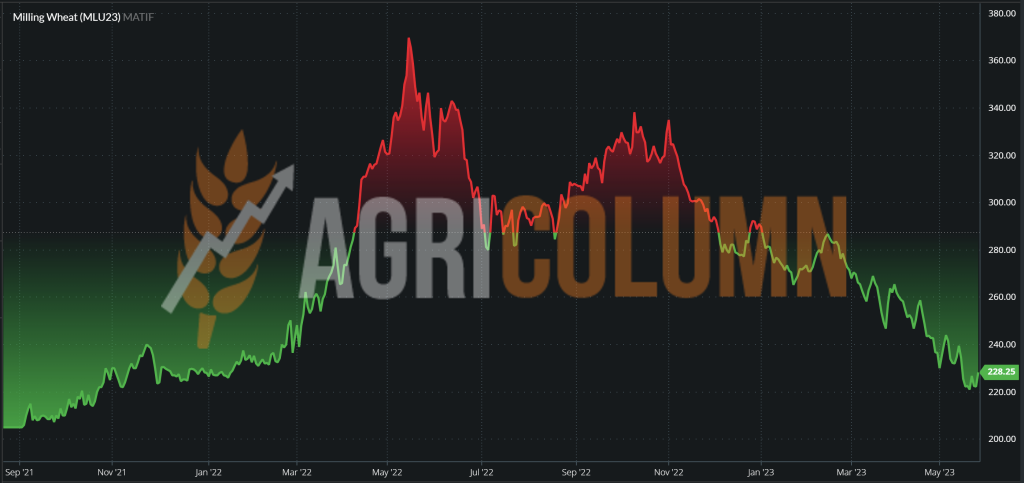
EURONEXT WHEAT TREND CHART – MLU23 SEP23
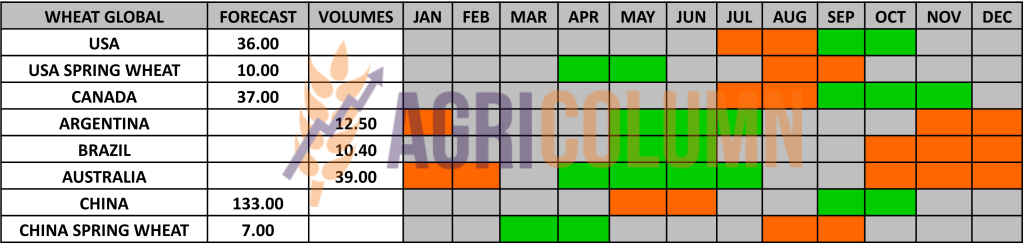
GLOBAL STATUS
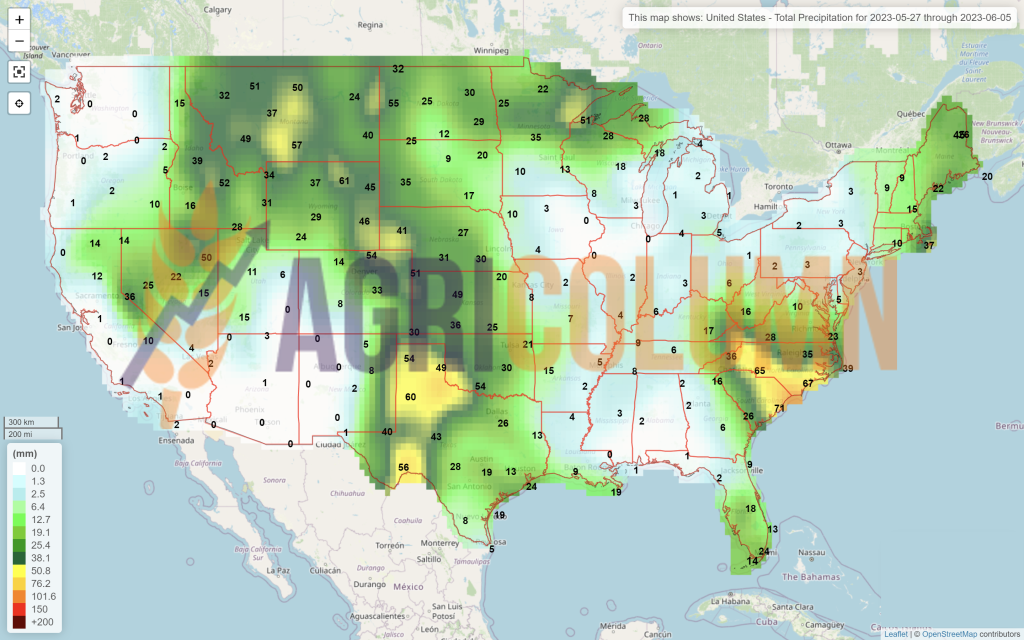
The US remains a marker in terms of question marks about the volume of winter wheat that will be harvested. One by one, USDA scouts generate forecasts. Some are pessimistic, some a bit optimistic, which feeds the trading algorithms on the CBOT. Indeed, Kansas does not look good at all, and there is a game of contradictions between various scouting associations and the USDA, both sources of which have been picked up by the press.
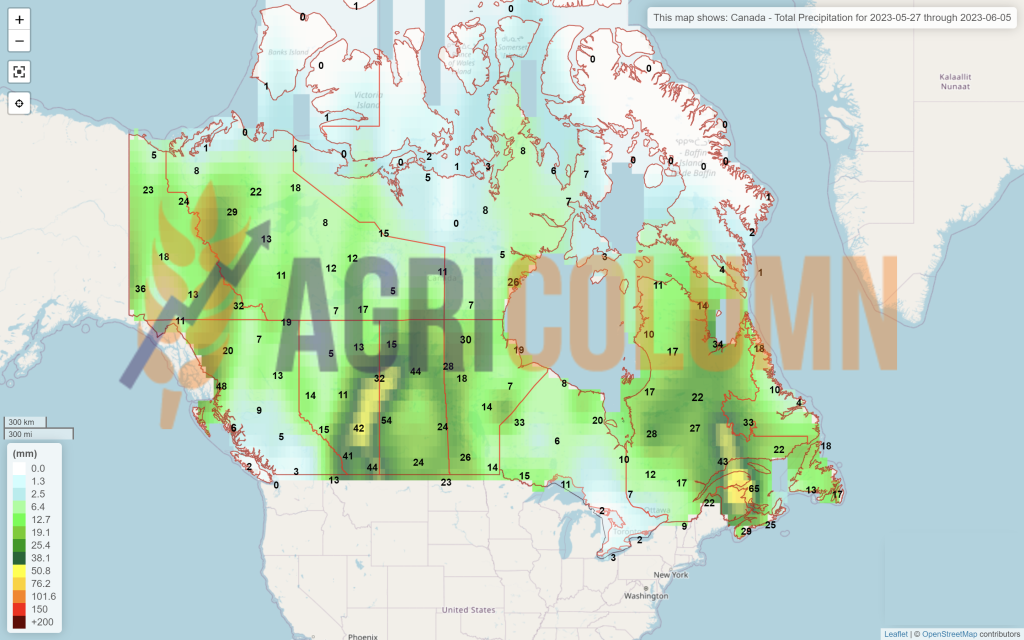
CANADA indicates precipitation in Alberta and thus the beginning of the end of the wildfires, with more than 110,000 hectares affected, but it is not at all clear whether it is only forested areas or also wheat fields. So far, Canada is not disproving the forecast generated by StateCan of 36-37 million tons.
INDIA indicates an increase in potential to 112 million tons and implicitly announces a lifting of the export ban on Indian wheat. A factor to consider.
EGYPT indicates an increasing harvest compared to the previous season by 5% compared to the average of the last 5 years. Thus, they will have a harvest of 9 million tons compared to 8.6 million the previous season. The area remains the same at 1.34 million hectares, but the productivity per hectare increases to 6.73 tons.
ALGERIA will have a 45% loss of wheat harvest and will have a volume of only 1.78 million tons caused by the reduction of the sown area from 1.8 million hectares to 1.39 in 2023.
MOROCCO, TUNISIA and LIBYA will, in turn, record decreases in wheat volumes, by 25, 28 and 14%, respectively, in the 2023-2024 season.
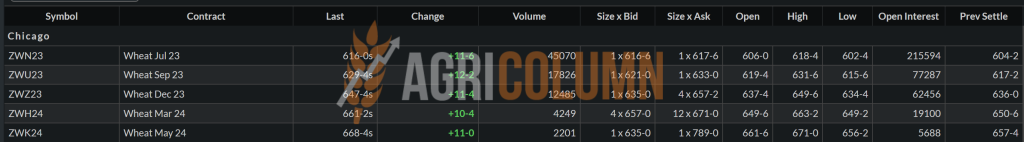
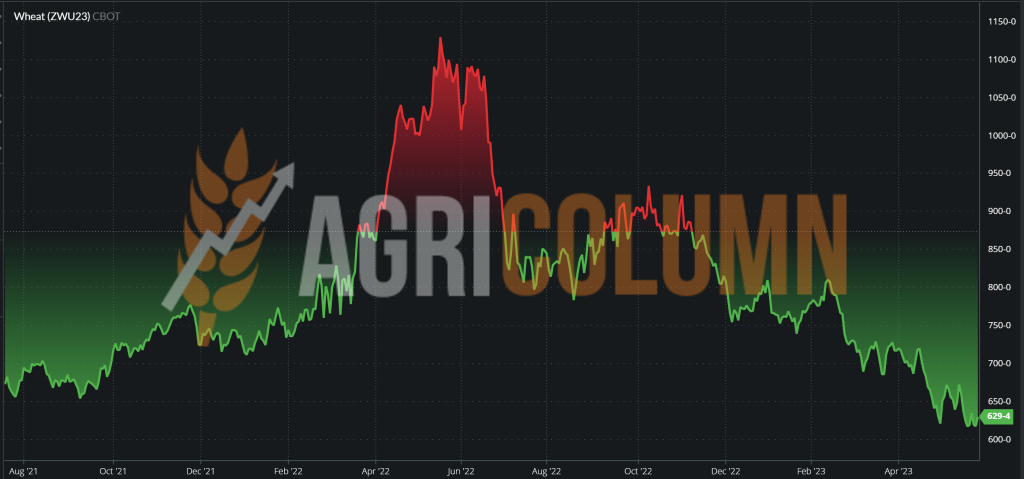
CBOT WHEAT – ZWU23 SEP23 – 629 c/bu (+11 c/bu = +4 USD/t vs. last week)
CBOT WHEAT TREND CHART – ZWU23 SEP23
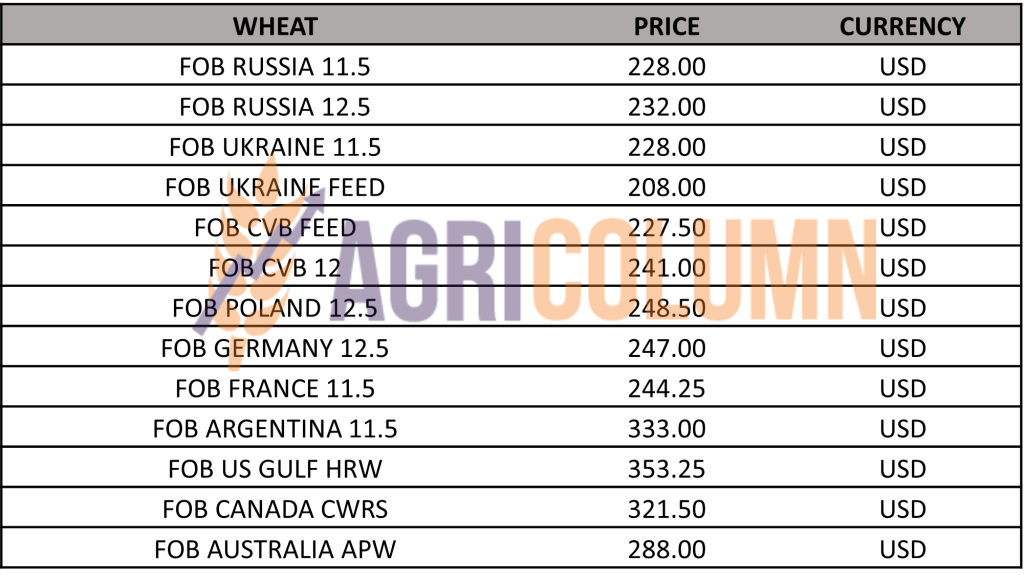
WHEAT PRICE INDICATIONS IN MAIN ORIGINS
CAUSES AND EFFECTS – THE STORY
Wheat had a firm push of about 18 cents/bushel stemming from US concerns over the size of the winter wheat crop. This generated a YO-YO effect. The return to around 620 cents/bushel was made fairly quickly. In other words, it was fed for the algorithms and the funds took advantage of this good bone to grind.
In the Black Sea basin, the tension dissipates along the lines of solidarity. Ukraine understands that that Corridor is only a curtain of Russia’s image and does not bet extremely much on it. Ukraine accuses delays in inspections, but Russia is doing its job according to the Agreement, about 6 ships a day and nothing more. This creates waiting congestion of 50-60 ships.
Russia will generate a much higher crop than the USDA estimate and the 7.5 million tons will soon be seen. Russia has extremely lowered that threshold it was announcing with so much emphasis, namely 250 USD/MT FOB Novorossiysk. Today, Russian wheat is at 237.5 USD/MT FOB Novorossiysk and is old crop. It is a simple image that shows us the physical fundamentals of wheat.
So we have the following fundamental factors at the moment:
- High volume in the Northern Hemisphere, EU, Russia, Ukraine, Canada and potentially lower in the US.
- Volume remaining unexported in Russia and Eastern European countries, Romania and Bulgaria.
- The weather condition in the USA generates the equilibrium trends at the global level through the activity of the CBOT which is transmitted to Euronext.
- The Cereal Corridor, which is, as I correctly estimated, strangled by Russia through slowness in performing inspection work.
- The request that is latent. The big buyers understand the harvest pressure that will arrive and are reserved, they are effectively in hand to mode mouth.
- Russia understands the slowness and challenges the current state by coming out with the same public statements that they will close the corridor after the expiration of 60 days. It is a clear signal that Russia wants a higher wheat price, as the current trading level is not satisfying at all.
- And let’s not forget that from July 1, 2023, in case we all forgot, many multinational companies will cease to operate in Russia.
- This statement does nothing but feed the trading algorithms, any headline is speculated to generate reasons for growth and then, naturally, positions liquidations or classic sell -offs will take place.
- Weather has also entered the stock market game, fueling projections and predictions on the CBOT as it has on Euronext.
- It remains to be seen whether the Buyers remain on the lookout or accept the high prices, I think they will wait for a tempering, because the volumes are there, the old stocks are there and the harvest pressure will undoubtedly arrive.
CONCLUSIONS
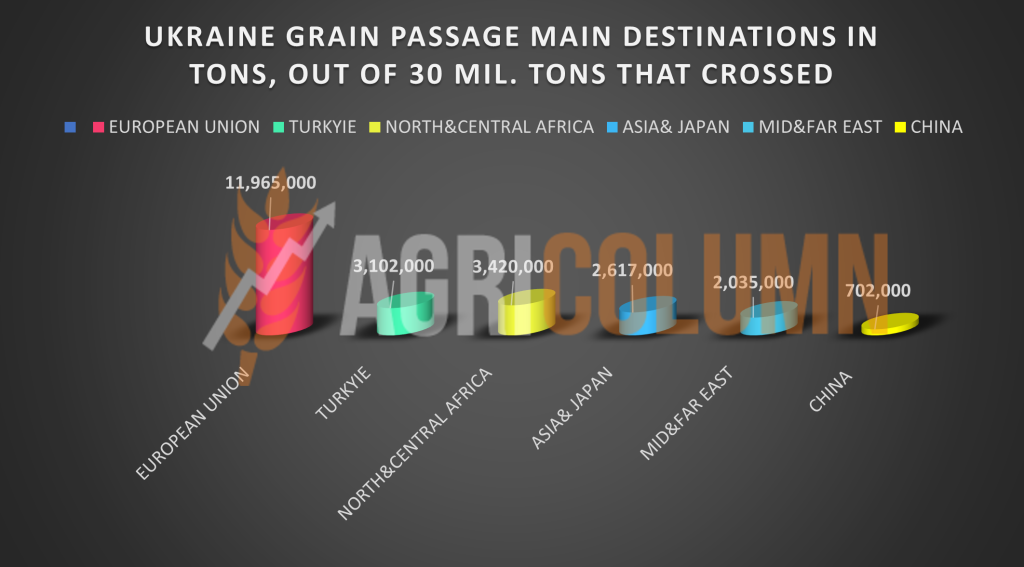
To illustrate the fact that this Grain Corridor is only a pressure relief valve for Ukrainian cargo volumes, a very good and beneficial thing, otherwise, but not enough, we insert a graph of the destinations of the goods that came out of this area.
By seeing the numbers, we can make much better judgments, we can visualize how the commercial interests align. The main beneficiaries of this Corridor are the European Union and Turkey, with respectable volumes. The European Union had and has a special commercial interest, generated by a cheap and tax-free raw material, which increases the income of traders, processors and all players in the industry along the chain, because the final price for the consumer has remained the same, increasing in many cases.
And then we can ask ourselves an essential question: why so much hypocrisy and theater when in fact the interest is a financial one, Ukraine having an extremely substantial bill for the war aid granted?
We are a few weeks away from the harvest, which will be delayed by the cold May weather throughout the Northern Hemisphere. And this will fuel the harvest pressure as at that time the Origins of the Northern Hemisphere will go into harvest in concert.
It is a sign of a shrinking market fueled by Ukraine’s lack of logistics, which will cross through every possible and impossible place with goods to the European Union and the port of Constanta in finding destinations.
What is keeping the wheat price level around the EUR223 area today, EURONEXT SEP23, is only the US Weather factor. But events are approaching again that do not enter into the daily analysis mixer, namely the US debt crisis, the increase in interest rates by certain banks globally, as well as the level of unemployment in the US, which will cause another FED intervention.
Today’s scenario is one that we have been standing on in stages over time, more precisely in the last 8-9 months, namely a false platform of stability, which after getting used to its level, will descend again at the usual rate, 10-20 EUR/MT.
The message is extremely simple, the world needs food and the costs of production are still high, so the price of the raw material must come down to alleviate these costs.

LOCAL STATUS
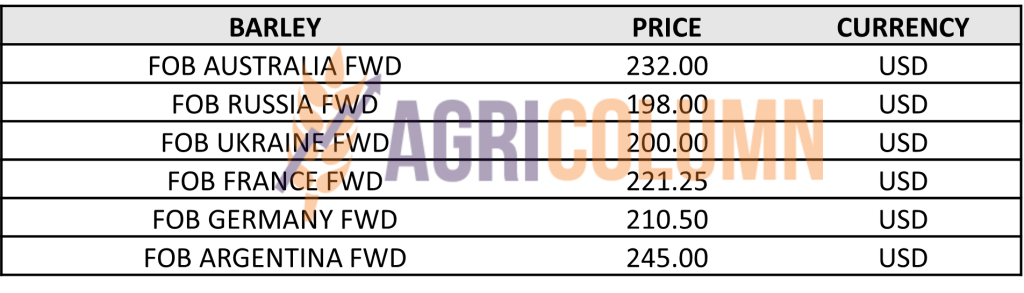
The price indications of feed barley decrease to the value of 172 EUR/MT in CPT Constanța parity.
REGIONAL STATUS
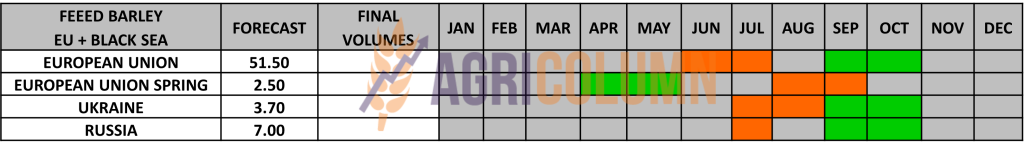
THE EUROPEAN UNION. No change, same forecast harvest level as before, 50 million tons. Regarding the Union export volume, it is quoted at the value of 5.82 million tons with an import level of 1.88 million tons.
UKRAINE continues its seeding program at the same sustained pace, minefields are a delaying factor in this phase, demining is a process in itself.
RUSSIA at the same pace as before, fueled by permissive weather.
BARLEY PRICE INDICATIONS IN MAIN ORIGINS
GLOBAL STATUS
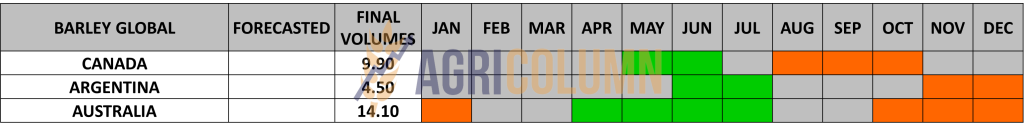
There are no fundamental changes or changes that change the supply and demand picture. Destinations are waiting for the new barley crop purchased through previous auctions, and certainly seeing the volumes, will price-price subsequent purchases during the harvest season and beyond.
The dynamics of the barley is given by the wheat and will without a doubt orient itself after it.

LOCAL STATUS
Corn price indications remain at the level of 195 EUR/MT for the old harvest in CPT Constanța parity.
The price of the new harvest drops to the value of 172 EUR/MT in the CPT Constanța parity.
CAUSES AND EFFECTS
The price of corn remains anchored at the level of 172-175 EUR/MT, referring to the new harvest. And we recorded these swings in the previous days due to forecasted volume reasons as well as wheat price swings.
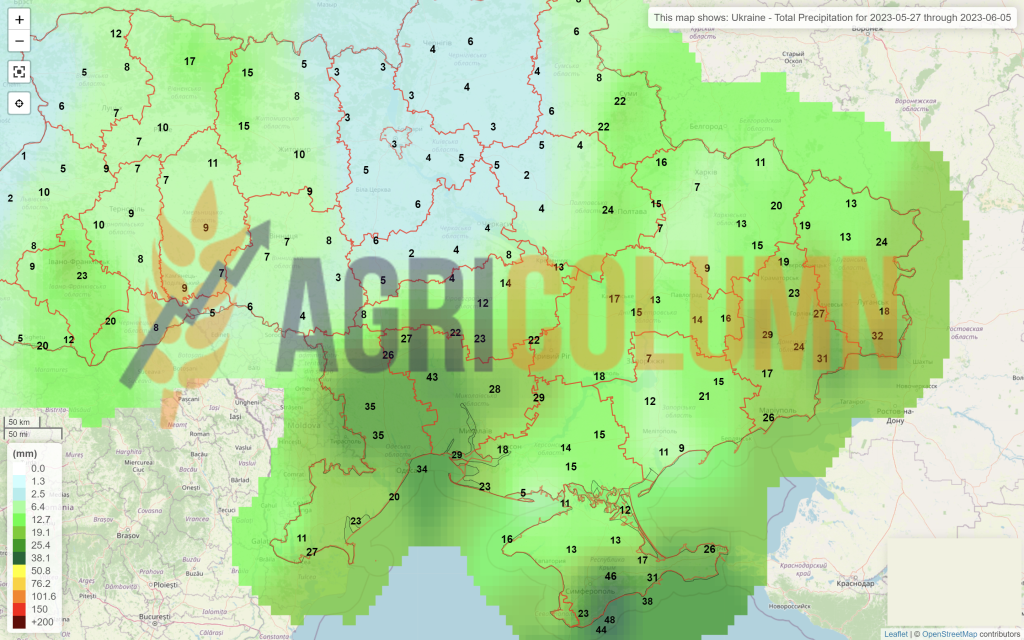
The latter drives the price and we must not forget this for a moment. The sell indication is certain at these moments when the precipitation is furrowing Romania and the indications of rains are maintained until June 8, 2023.
REGIONAL STATUS
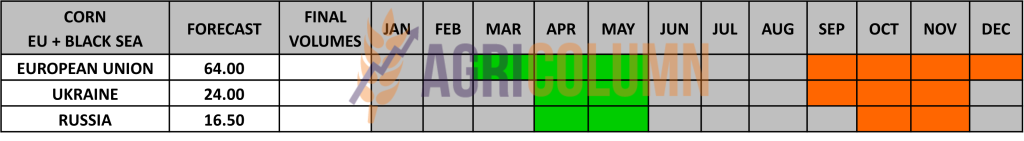
THE EUROPEAN UNION remains in the same forecast regime, 63-65 million tons, with a normal planting rate. Delays are reported, but they will recover, for sure. As for the level of Union import, it reached the value in tons of 24 million, with an exported volume of 2.87 million tons. Indisputably, the primary origin of imports at EU level is Ukraine, with a volume of 13.4 million tons, followed by Brazil with 8 million and Canada with 1.35 million tons.
UKRAINE continues to plant corn and will meet its schedule. Rains are also forecast throughout the territory, which is extremely beneficial for emerging crops.
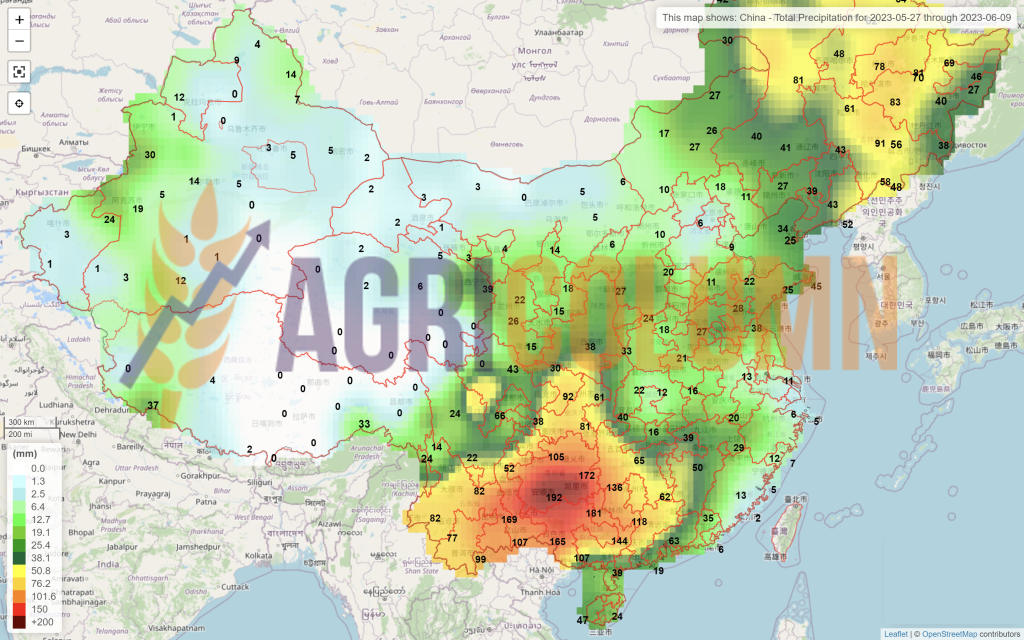
RUSSIA, for its part, will generate a volume of more than 16 million tons of corn and announces itself as a serious competitor in the destination of China. Russia’s forecasted export level of the corn product is estimated at over 6 million tons, if not they will reach 7 million tons.
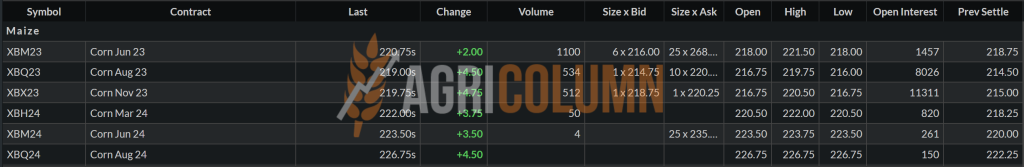
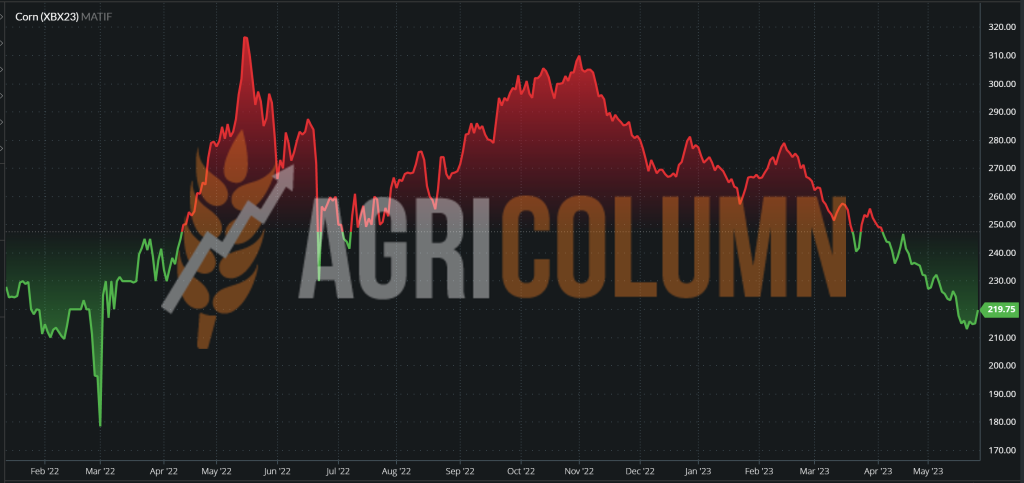
EURONEXT CORN – XBX23 NOV23 – 219.75 EUR (+3.75 EUR vs. previous week)
EURONEXT CORN TREND CHART – XBX23 NOV23
GLOBAL STATUS
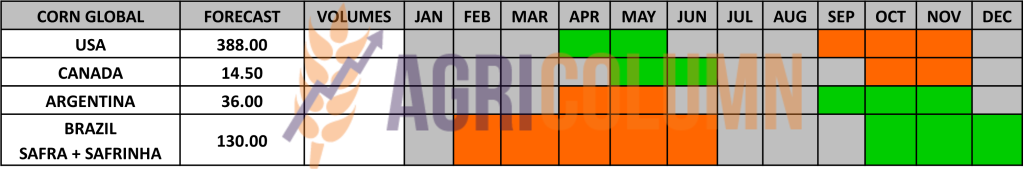
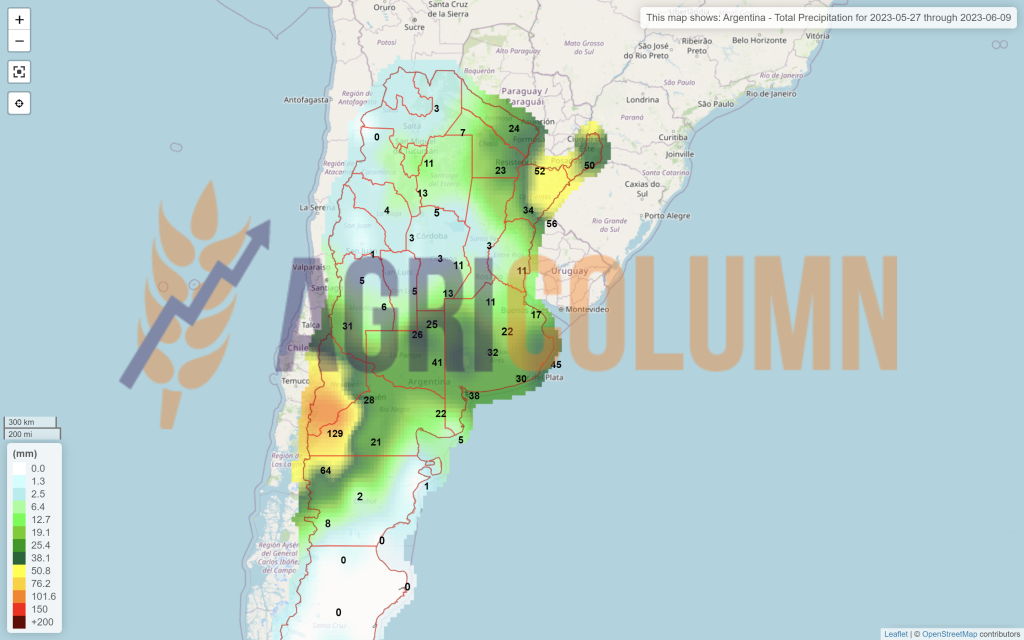
ARGENTINA remains in the area of 35-36 million tons harvest level.
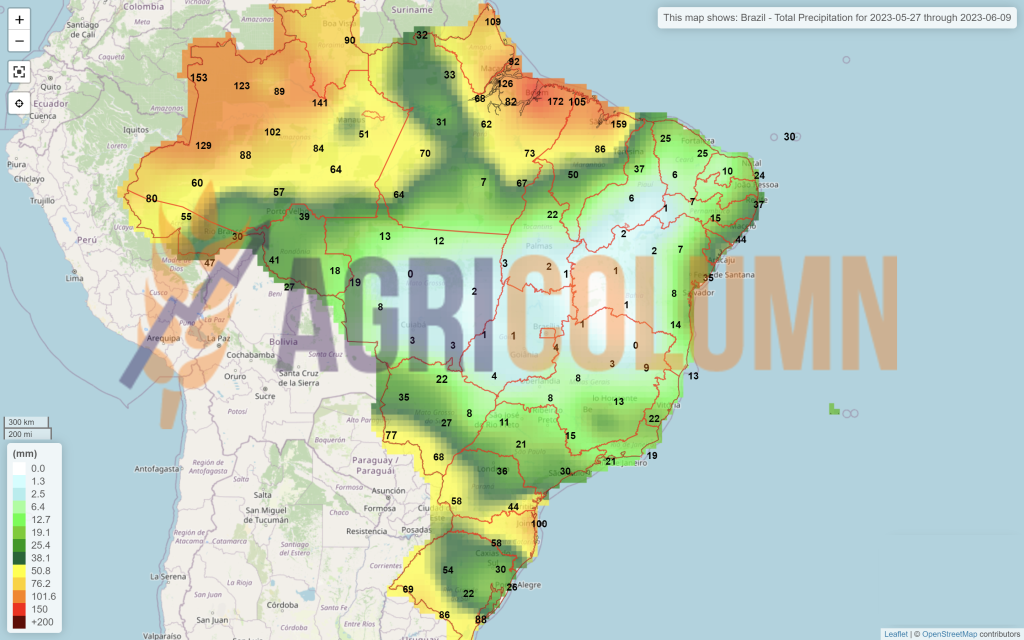
BRAZIL remains unchanged at this time, 130 million tons, aggregate volume Safra + Safrinha.
The US is still seeding, and the projection of 388 million tons remains unchanged. Weather issues have created confusion in the Corn Belt but farmers are taking advantage of the weather to plant corn. How the weather will play out is still an unknown, but precipitation has calmed CBOT quotes. Indiana, Illinois and Iowa received reduced rainfall. Missouri is struggling, but soil moisture is still satisfactory.
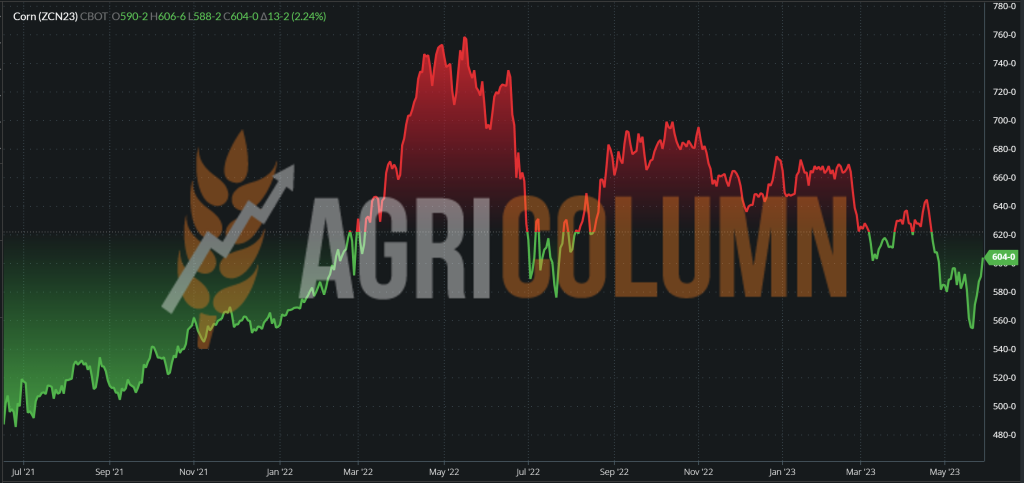
CBOT CORN ZCN23 JUL23 – 604 c/bu (+50 c/bu = +19.7 USD/t vs. last week)
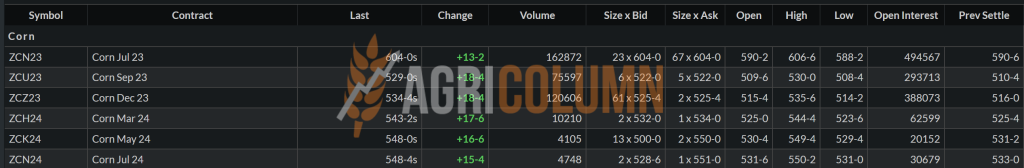
CBOT CORN TREND CHART – ZCN23 JUL23
CORN PRICE INDICATIONS IN MAIN ORIGINS

CAUSES AND EFFECTS – THE STORY
A potential problem in the way of corn could arise from China, which will have a surplus of wheat. And thus, this volume will be able to replace part of the corn import.
Another potential problem will also be from China, which has a choice and its eyes will turn to the cheap Origins, in this case Russia and Ukraine. Signs of agreements at the level of phytosanitary agreements with Russia are evident, so China’s options remain open.
All of China, through the voice of President Xi, indicates a change in the economic approach, which, instead of being oriented towards services, cheap labor (lohn) and real estate, is moving towards an economy generating agricultural raw materials, towards ensuring independence food. And programs for relocating employees from urban to rural environments to serve food production are beginning to be outlined. It is a new orientation, but full of normality. It is food independence that creates the premises for other approaches to the global market.
The USA is and will be from this moment on the main marker. The volumes expected from the US are extremely high and the weather is playing its way like every summer, like every season.
CONCLUSIONS
We have entered the Weather market, which will generate uncertainty over the 50-60 day term, but hopes for moderate weather in terms of temperatures in the Northern Hemisphere, as well as precipitation, remain. The main indicator we will rally to will certainly be the USA, followed by the European Union and the Ukraine-Russia zone.
CBOT is powered by weather and weather alone. Forecasts come and spur trading algorithms, reputable analysts indicate what will happen. It’s a whole gig that makes the corn way uncertain right now.
Brazil has already fueled the global stockpile by 130 million tons, and Argentina can do nothing but hope for another favorable season.
But if we look at this game, we realize two clear and extremely clear things. Both the US and RUSSIA are doing nothing but “praising their wares” literally, the US with pessimistic precipitation forecasts and Russia threatening left and right. It is effectively an attempt to prop up the price of corn and wheat. But we have a debt crisis, we have banks raising interest rates, we have extremely big problems at the global level, and what the two countries are doing is part of the regular concert every year.
And also to generate a correct and impactful image, we insert 3 digits. These figures do nothing more than indicate once again, if it were still the case, the share of the Union import in the total export of Ukraine. Naturally, when you have an Association agreement and a Regulation 870/2022 that has just been extended, it would be totally inappropriate not to buy cheap goods.
But the price paid is not seen today, it will be seen much later, because the Union will systematically destroy agriculture in neighboring countries, as well as processing in the near future. The destruction of Agriculture and Processing in these countries is carried out with the motivation to turn Ukraine into a union dominion that will serve as a reservoir of cheap raw materials and easy processed goods.
Coming back, the first figure is the total export volume of Ukraine of 63.74 million tons, the second is the Union import level of 28.23 million tons, and the third figure is the percentage share of 44.30% of total Ukrainian export. Impressive, right?
Ukraine today does not understand any of these things, it is driven only by the desire to extract the goods in order to benefit from money from them, to be able to continue its production cycle.
But the future (5-10 years) will demonstrate what we are advocating today, namely that it will become a production and processing dominion aligned with the interests of global giants and, implicitly, it will become a large market for technological products.


LOCAL STATUS
The indications are maintained on the same calculation formula for the goods delivered in CPT Constanța parity, namely AUG23 minus 40 EUR/MT. Processors guidance remains at the level of AUG23 minus 50 EUR/MT, DAP processing units.
CAUSES AND EFFECTS
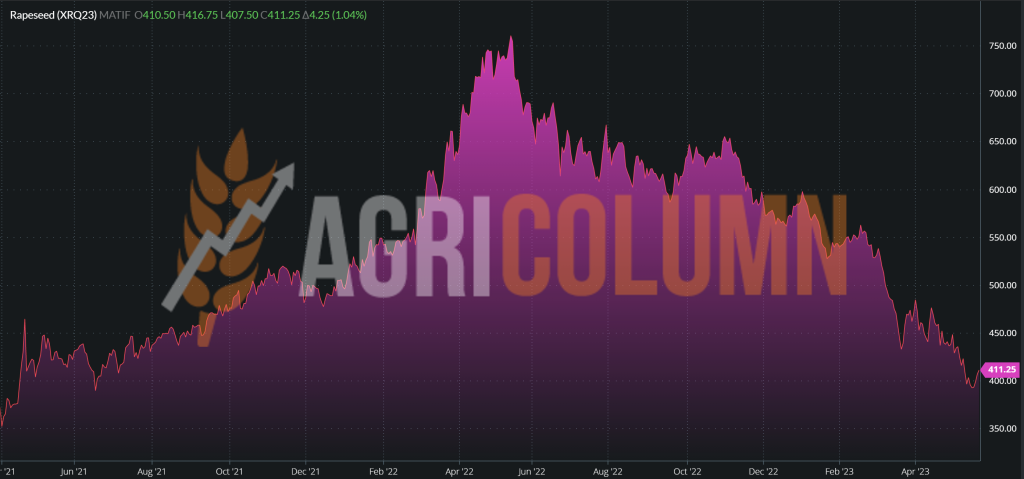
Rapeseed quotes we have seen returning to levels above 410 EUR AUG23 EURONEXT, are only tangential effects of oil quotes and marginals of complex peers Vegoil.
Nothing else has changed in the yield equation and Romania has the potential to break the 2 million ton barrier, if not the 2.2 million ton potential.
However, if one still has the potential to sell the new crop, one should not hesitate, as this level does not guarantee a specific time period, but only a window of opportunity.
EURONEXT RAPESEED – XRQ23 AUG23 – 411 EUR (+16 EUR vs. previous week)
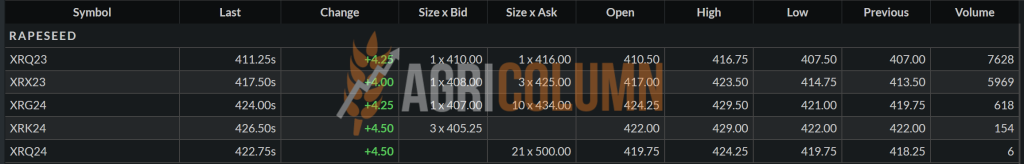
EURONEXT RAPESEED TREND CHART – XRQ23 AUG23
REGIONAL STATUS
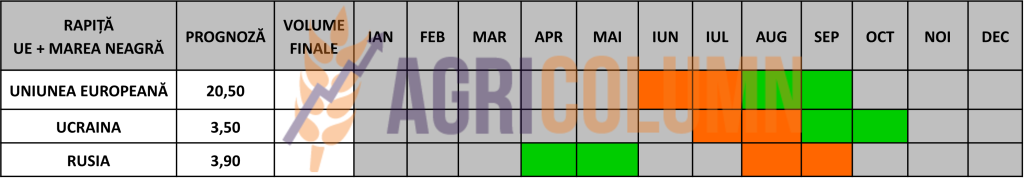
The EUROPEAN UNION indicates the same volume of more than 20.5 million tons.
RUSSIA remains at the forecast level of 3.8 million tons.
UKRAINE will generate a volume of 3.3-3.4 million tons, but things could change in a positive direction, towards the figure of 3.5 million tons.
GLOBAL STATUS
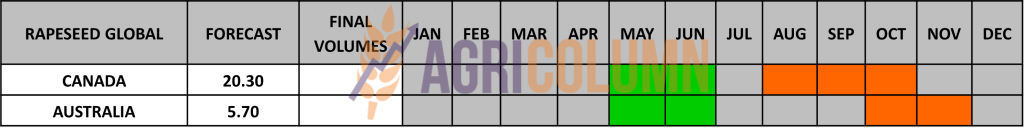
CANADA, according to Stats Can, indicates 18.5 million tons harvest forecast.
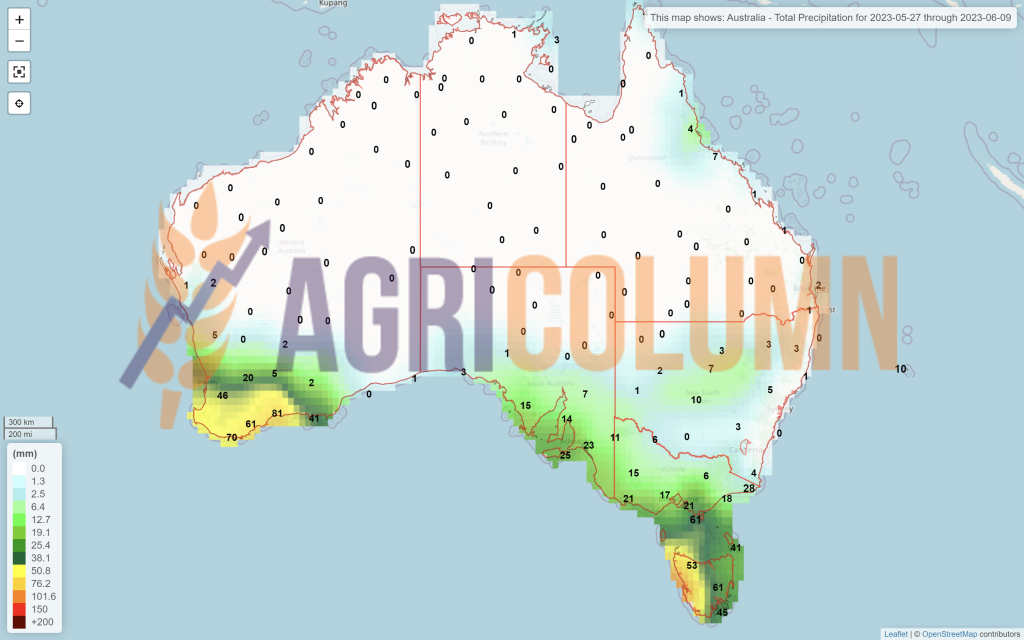
AUSTRALIA. Identical, it is in the forecast, 5.7 million tons.
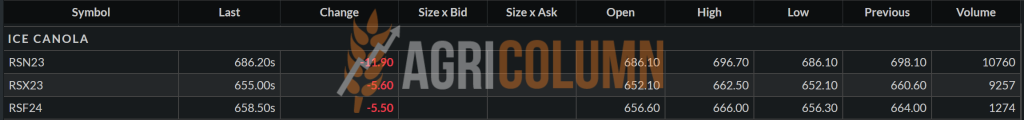
ICE CANOLA RSX23 NOV23 – 655 CAD (-21 CAD vs. previous week)
ICE CANOLA TREND CHART – RSX23 NOV23
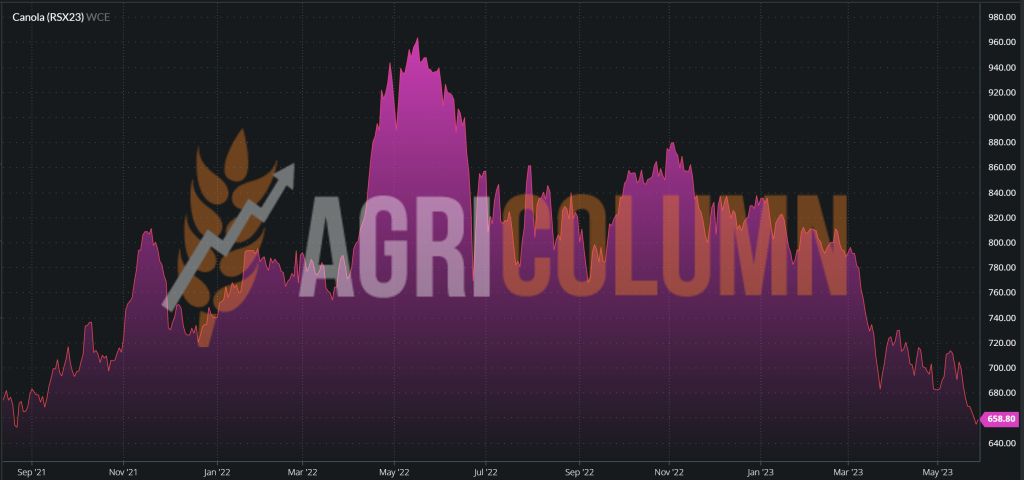
CAUSES AND EFFECTS – THE STORY
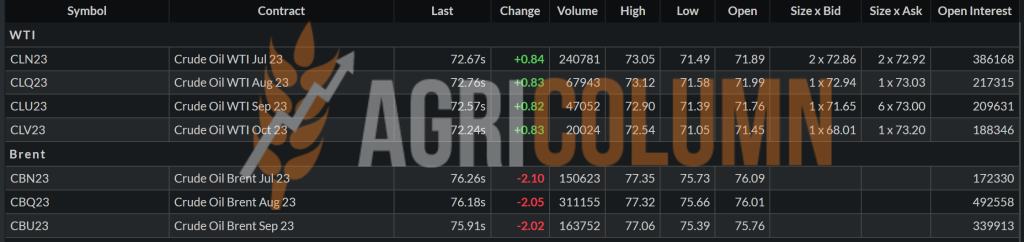
Petrol has been a factor in the increase in canola levels in recent days. Prince Salman’s statements warning against speculators on the oil market fueled Brent prices to $78/barrel.
StasCan’s re-evaluation of the Canadian canola crop, which is brought back to 18.5 million tons. But things tend to calm down in Canada as well, with farmers recovering extremely quickly and finishing their planting programs.
Palm oil is also a support factor in all the momentum taken by rapeseed, more precisely from a level of EUR 388 to EUR 411, that is EUR 19 indication EURONEXT AUG23.
We will continue to see such causes and effects in rapeseed. But the certainty is extremely clear, the support threshold of 400 EURO AUG23 is effectively hardened and cannot move much higher, being hampered by the European volumes.

LOCAL STATUS
The port of Constanța is quoting old harvest sunflower seeds at the level of 400 USD/MT. Local processors indicate 400 USD/MT.
The new crop quotation level is set at 375-380 USD/MT in the CPT Constanța parity, which leads to a level of 365 USD/MT for the goods delivered to the processing units.
CAUSES AND EFFECTS
The price of sunflower seeds has degraded in the week just past, according to our estimates. Good seeding forecasts as well as permissive weather have boosted hopes for volumes nationally and regionally. Adding to this premise and the fact that the stock of goods is and does exist, we still have no doubts about the price regime for this raw material.
forward fixing of 1 ton per hectare, maybe 1.5 tons, to create a cushion for income depreciation in farms, since here too the pressure of the harvest chained with the logistic one will intervene.
Romania will generate a volume of over 3 million tons of sunflower seeds. If the weather plays in favor of the farmers, it will be possible to reach 3.3 million tons.
REGIONAL STATUS
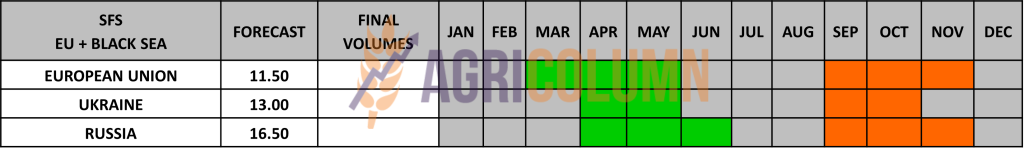
UKRAINE remains stable in volume forecasts and we remain with the estimate at a minimum of 13 million tons of sunflower seeds.
RUSSIA also remains stable in the forecast at 16.5-17 million tons.
EUROPEAN UNION remains stable at a volume forecast of 11.5 million tons. In terms of imports, Ukraine was by far the best origin. out of a total Union import volume of 2.14 million tons, Origin Ukraine generated 1.81 million tons. Of this amount, 0.77 million tons were received by Romania, counting in our calculations the period March 2022 – May 2023. Sunflower seeds had an imported volume level of 2.42 million tons, of which Ukraine generated 1.1 million tons.
GLOBAL STATUS
Out of season.
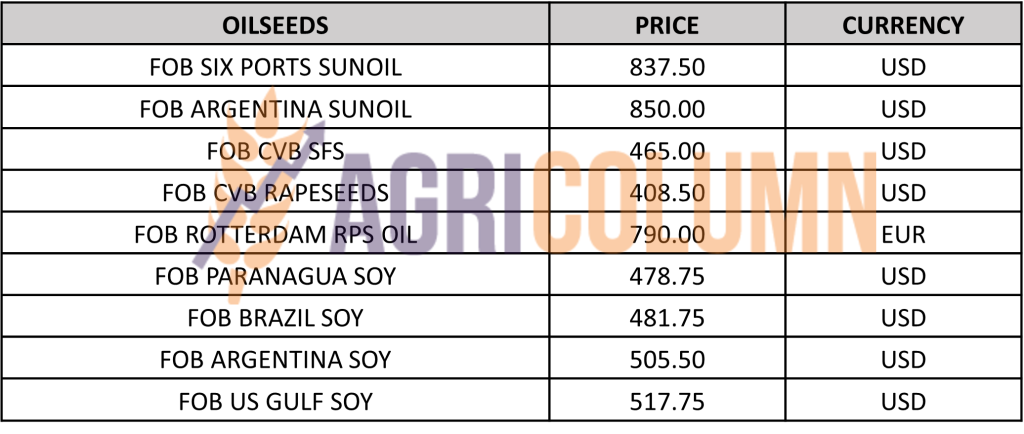
PRICE INDICATIONS FOR OILSEEDS AND CSFO IN MAIN ORIGINS
CAUSES AND EFFECTS – THE STORY
The indications of sunflower oil are further penalized by the latent and lackluster demand. SIX Ports is losing ground in price territory every day.
Desperate for the cause, as oil sales are extremely low, Russia has abolished the export tax from June 1, 2023, in the hope that it will boost demand.
India has made a shift in demand from palm and soybean oil to sunflower oil, as the price of the latter becomes extremely tempting.
What follows will not be different from what has gone on so far. A downward trajectory driven by inventories, volume forecasts and competition between origins.
Recalling the history, we like to remember times when the price level was also at 275 USD/MT for this raw material, so the 1,150 USD/MT level generated by the Russian invasion will remain as a benchmark and nothing more. Today, Constanța is at the level of 375-380 USD/MT. SIX Ports indicates $840/t with a minus $20/t posted day-to-day.

LOCAL STATUS
In Romania, the price indications for soybeans are at the level of 490 USD/MT, DAP processing units for non-GMO soybeans.
REGIONAL STATUS
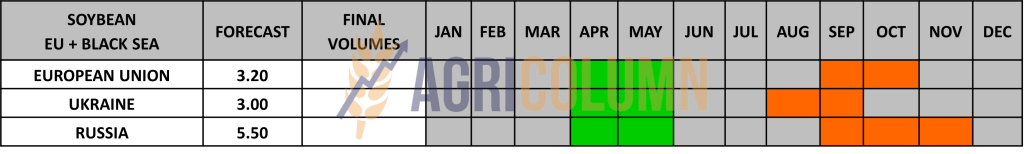
THE EUROPEAN UNION. Total imports of soybeans this trading season reached 11,360,000 tons, and soybean meal exceeded 14 million tons.
GLOBAL STATUS
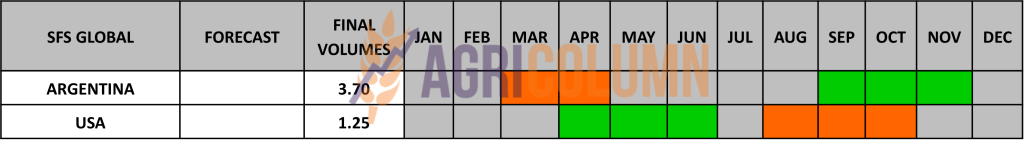
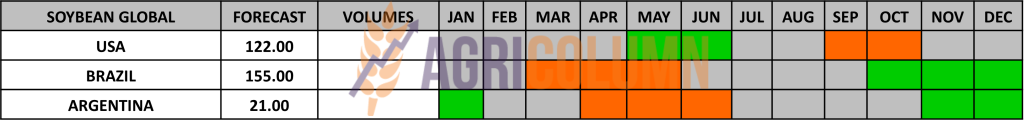
ARGENTINA is already a closed case, 22 million tons is the end of an extremely sad season for Argentine farmers.
BRAZIL remains indicative at 155 million tons.
The US has a volume forecast of 122.7 million tons which it is maintaining at this time. But the market is under the specter of weather, which has naturally fueled stock trading algorithms. The weather is uncertain right now in the US and this is simply debatable.
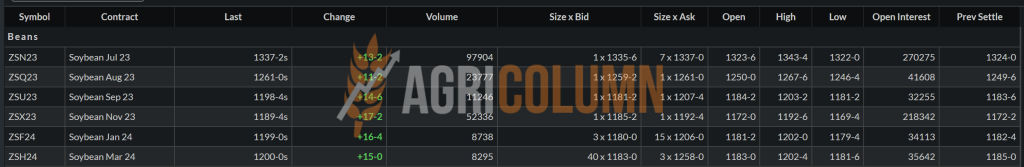
CBOT SOYBEAN ZSU23 SEP23 – 1,198 c/bu (+12 c/bu = $4.4/t vs. last week)
SOYBEAN CHART TREND – ZSU23 SEP23
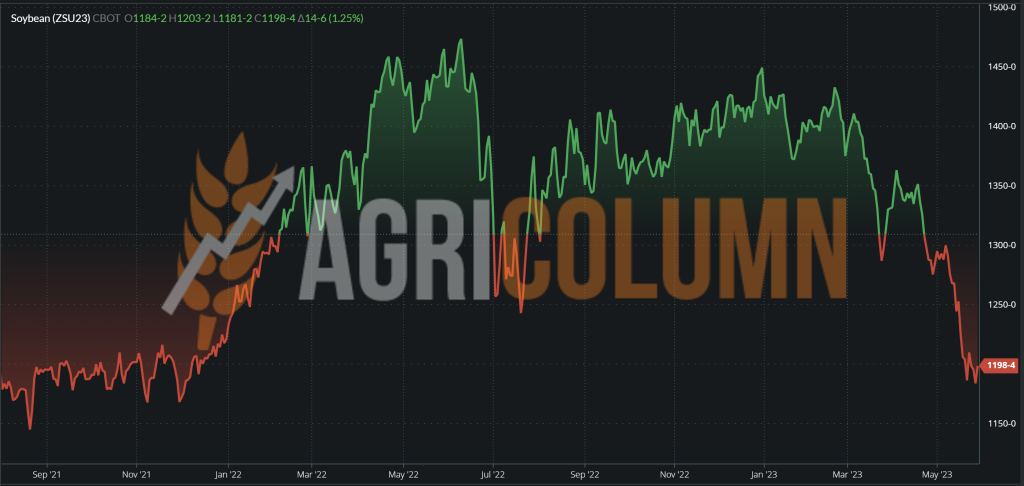
CAUSES AND EFFECTS – THE STORY
The swings on the CBOT are just the reflections of the Weather factor influencing the trading algorithms. Looking at the CBOT price chart we can only see the correctness of our estimates regarding the path of soybeans.
The latter will, in turn, rally to the Vegoil complex, and the price will continue to be a downward one, fueled only by spikes created by the Weather factor. Just like this week, a $4.4 increase, but let’s not forget the $21 drop from the previous week.


May 28 – June 5, 2023
Romania

Europe
Ukraine
Russia
Canada
USA
Brazil
Argentina
China
Australia