This week’s market report provides information on:

LOCAL STATUS
Wheat quotes in the Constanța CPT parity reached a level of 217 EUR/MT, in the CPT parity. Feed wheat has a difference of minus 7 EUR/MT within the discount term.
The new crop is valued at 207- 208 EUR/MT and the feed quality discount is 10 EUR/MT.
CAUSES AND EFFECTS
The regional status is one that does not put on hold at this time. We have to go through an important decision round for the current state of Romanian farmers. And we would put a lot of emphasis on the political factor at the moment, which does not indicate a clear direction for the future of farmers. We explicitly refer to the next challenge that the European Commission has to manage, namely the extension of the import ban for Ukrainian goods in the 5 countries of the proximity bloc.
Because this is an extremely important factor in the economy and welfare of farmers. In the scenario in which the import ban is extended until December 31, 2023, Romanian farmers will be able to access the Romanian domestic market under normal conditions, we could say. Thus, they will be able to sell the goods and, implicitly, the grain under conditions of normal competitiveness, in a fair market, governed by supply and demand.
But from a price point of view, the Weather dictates the market right now and as we saw in the WASDE report published earlier today, we have generated changes in the US winter wheat volume forecasts.
However, the quality of the wheat and a late harvest should make Romanian farmers think, because the rains that have fallen and those that will come during the next week have not been able to make things go normally.
We are referring, first of all, to a delayed harvest, to a higher volume of wheat, estimated today at over 10.5 million tons, and to a deterioration in the quality of wheat generated by precipitation. This should indicate further easing of the price level in conditions of plenty.
In the same regime, a decision to stop the import ban would generate extreme pressure on Romanian production, for two reasons. On the one hand, a volume from Ukraine will be much easier to sell in Romania, so with a much-reduced logistical effort. Also, due to the transit of Ukrainian goods, a much higher logistics cost will be generated going forward, as well as a lack of availability on this extremely important level, namely the movement of goods.
REGIONAL STATUS
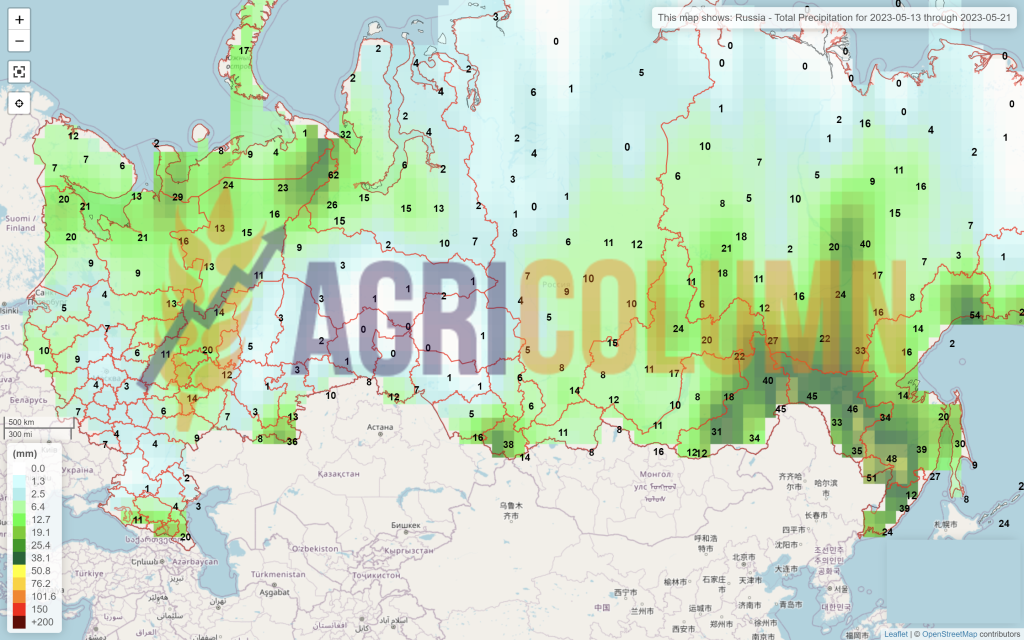
RUSSIA. Next season’s Russian crop is degraded in terms of volume to the level of 81.5-82 million tons. We do not find that a degradation of future potential will impact Russia’s position. The ending stock that will remain after the end of this selling season (15.5 million tons) will matter a lot in the global trade economy, especially since the views of local Russian analysts are somewhat different from those of the USDA.
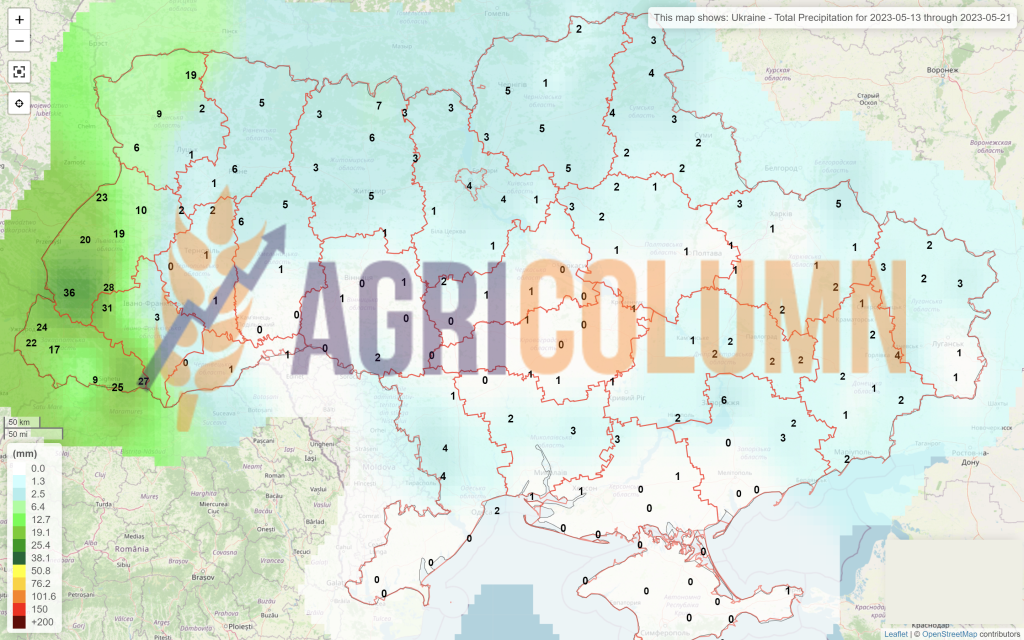
UKRAINE, identical to Russia, has a vision with degradations of future harvest volumes, up to around 16.5-17 million tons. But here we can have positive adjustments, as time will pass, because the final volumes will be known only after the harvest. And, naturally, there are the volumes from the areas of Russia, which will find a destination. Will they feed Russia? 100% yes, this season, as the situation on the field indicates this.
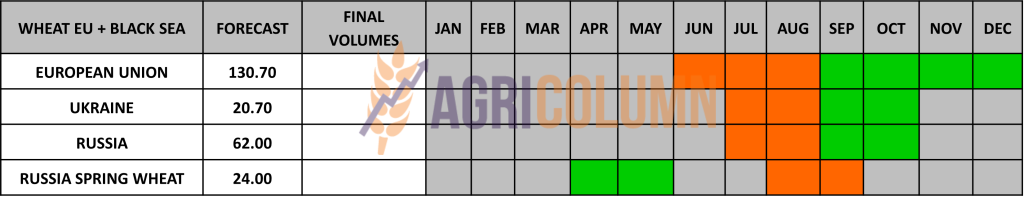
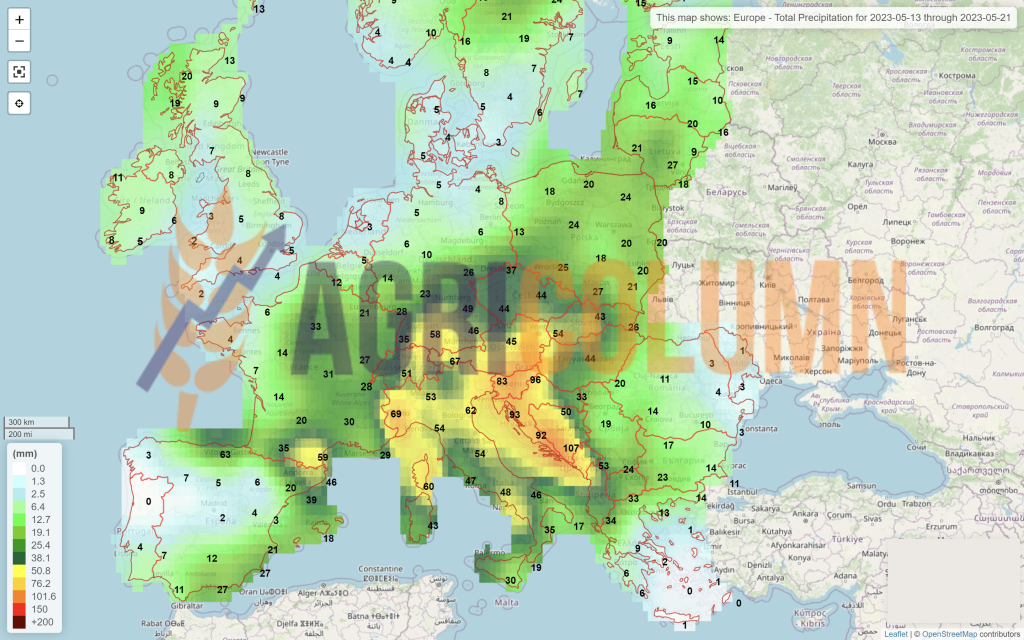
THE EUROPEAN UNION receives a crop forecast that raises the total level, milling wheat and durum, to the level of 139 million tons, which is an increase of 4.7 million tons. Here we have to separate the values in the wheat class and quantify the milling wheat class at the level of 130-130.5 million tons. But because of the Weather factor, we also have concerns here about the level of wheat volume with milling quality in relation to feed. Germany in particular is very concerned about the share of feed grain in the total amount of the crop. Heavy rainfall reduces the quality of grain and the much lower share of milling grain compared to feed grain could lead to loss of export markets for Germany.

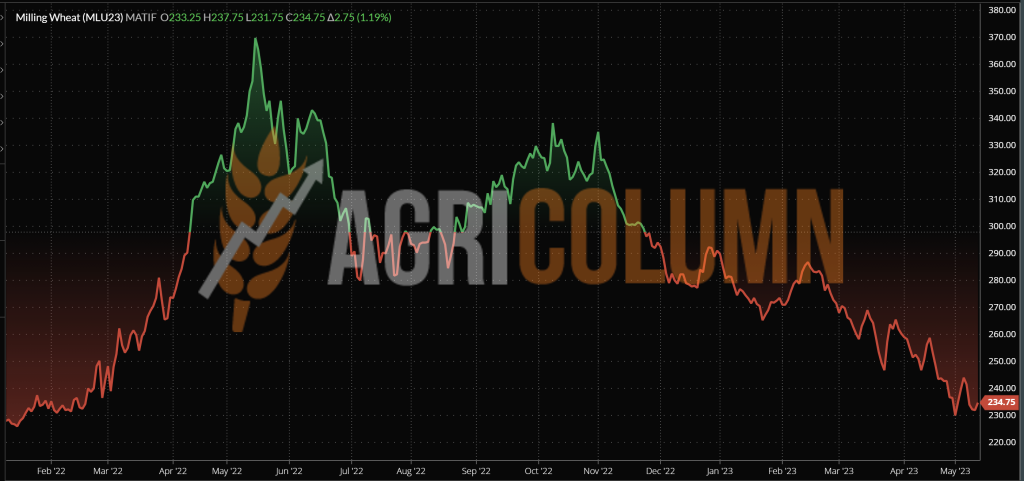
EURONEXT – MLU23 SEP23 – 234.75 EUR (-9.25 EUR vs. last week)
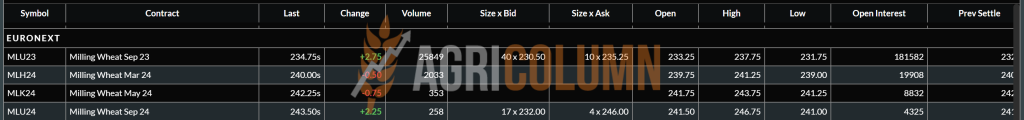
EURONEXT WHEAT TREND CHART – MLU23 SEP23
GLOBAL STATUS
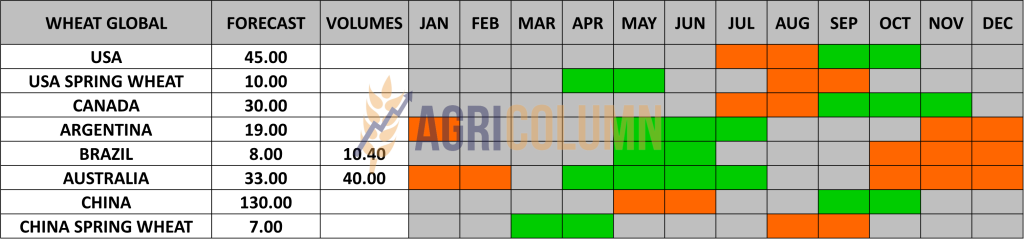
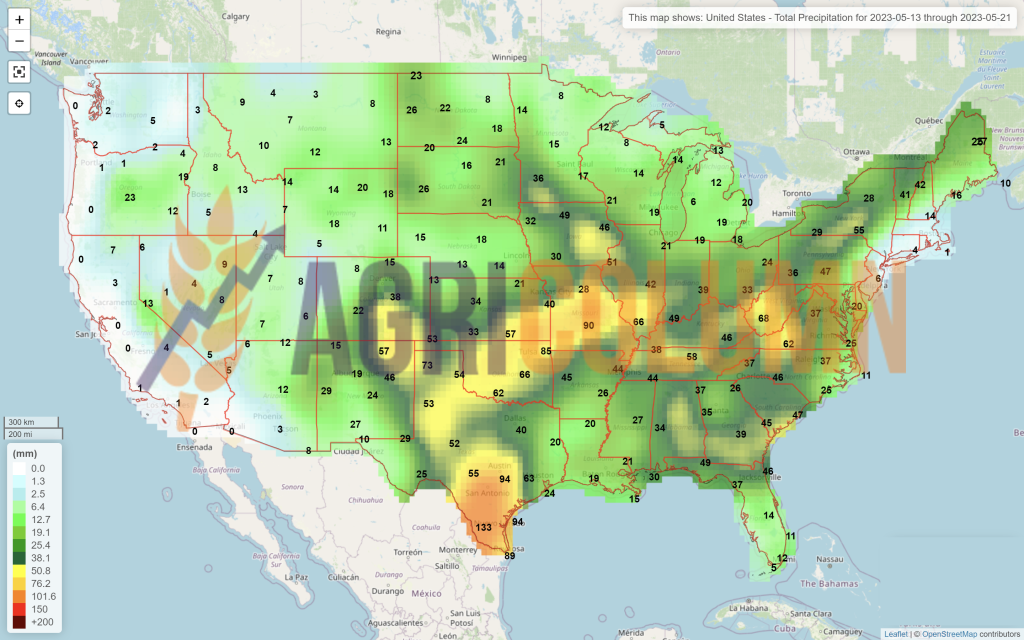
The USA, through the WASDE report, lowers the winter wheat crop forecast. And it’s doing so in a steep way, generating a cumulative winter and spring wheat crop of just 45 million tons, up from the previous season, but not by much. Thus, we are effectively going back about 4.5 million tons in negative weight on the US Central Plains.
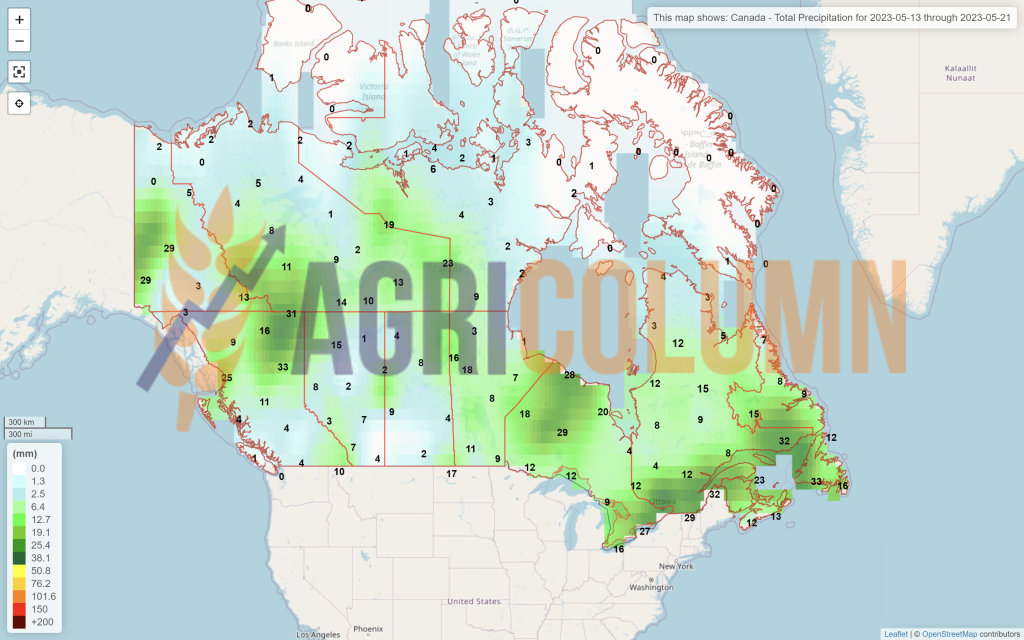
CANADA, on the other hand, gets a volume forecast of 3.2 million tons, bringing it up to 37 million tons in volume. In this way, Canada partially offsets the US crop loss.
INDIA gets a positive outlook, taking it to 110 million tons, up from 104-105 million tons.
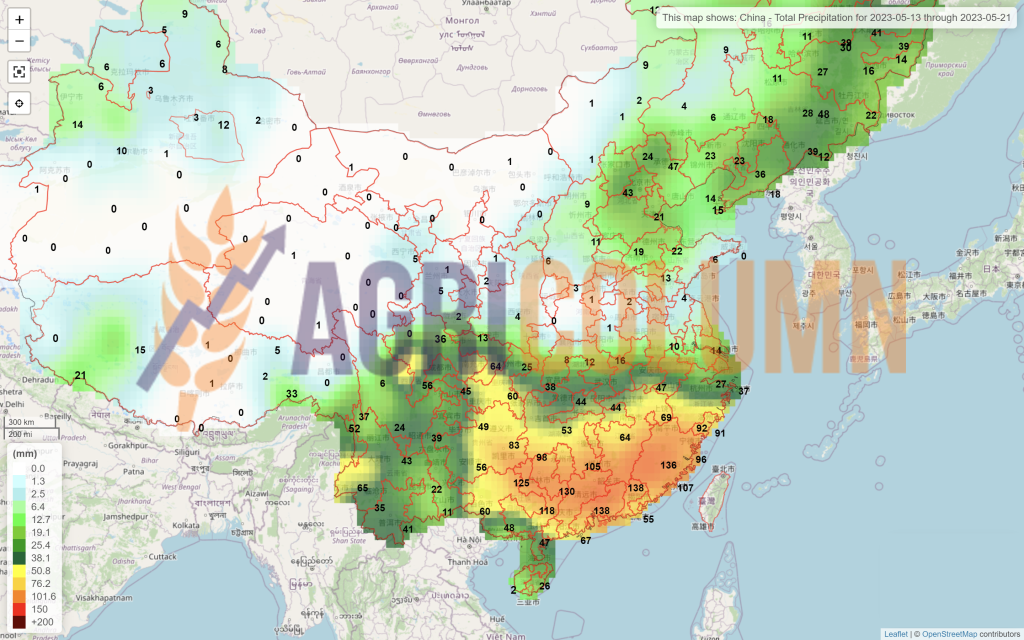
CHINA is confirmed by the 140 million tons, so the increase of 4 million tons is a support in the WASDE report.
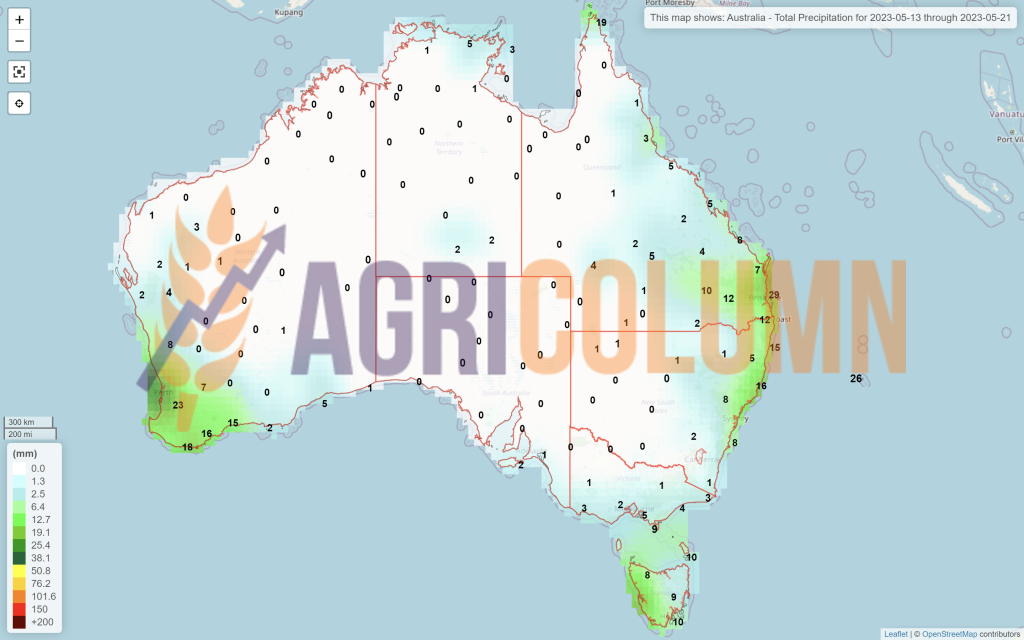
AUSTRALIA, on the other hand, degraded in the crop plan that will follow from these changes between La Niña and El Niño and the value of 29 million tons is quoted.
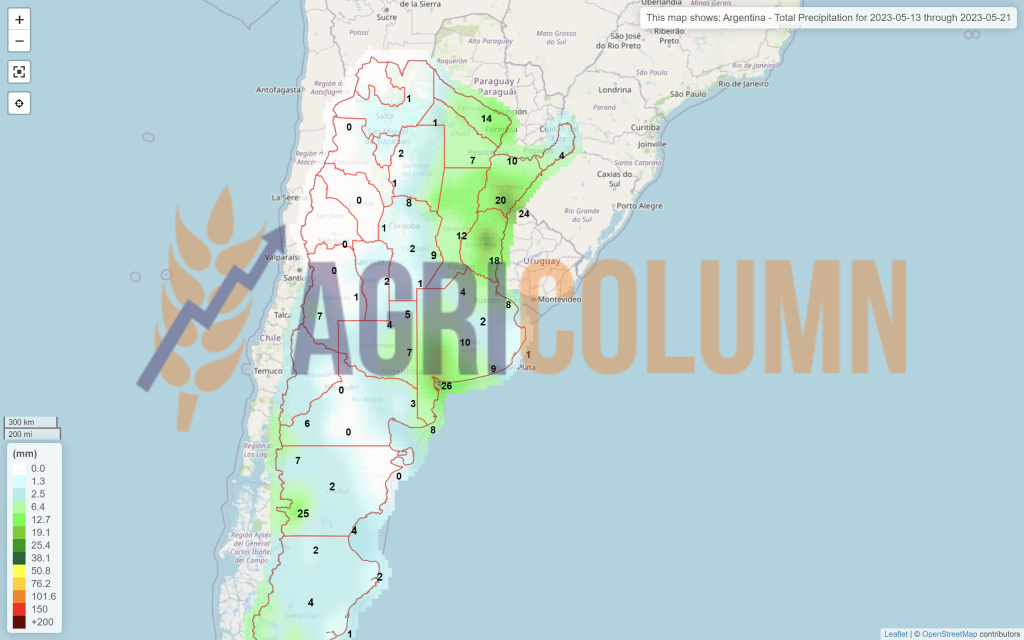
ARGENTINA has a future indication of 19.5 million tons, in line with their production in a normal year in terms of weather. But it is premature here to talk, because the sowing season is starting, and the rainfall is still lacking, so the question mark on the new season, which has not started and is already experiencing obvious difficulties.
INDIA remains unchanged at 107-108 million tons.
CHINA similarly indicates about 140 million tons, 4 million tons more than the previous season, which will reduce import levels with the crop surplus.
We will modify the global forecast table accordingly when certainty replaces the forecast, towards increased data accuracy.
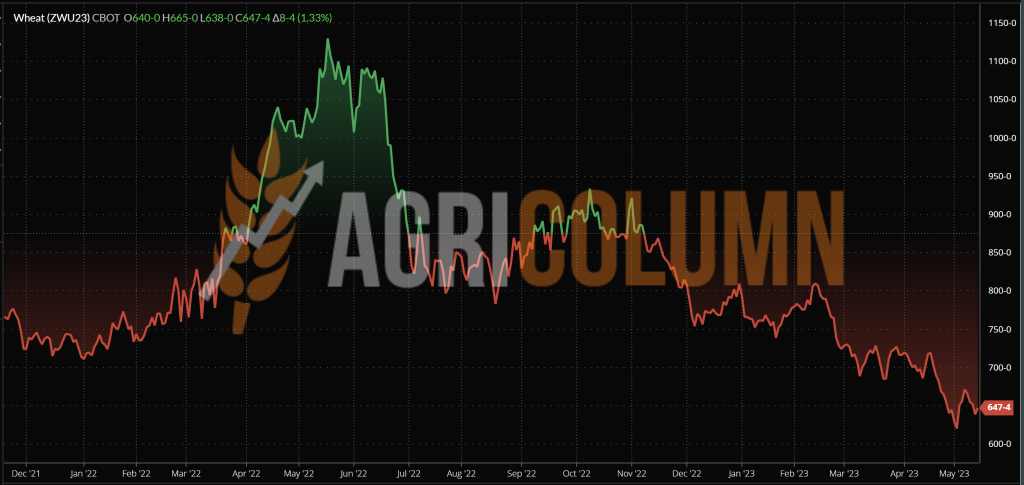
CBOT WHEAT – ZWU23 SEP23 – 646 c/bu (-25 c/bu = -9.5 USD/MT vs last week)
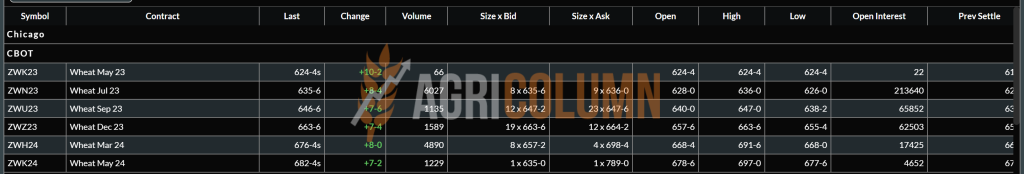
CBOT WHEAT TREND CHART – ZWU23 SEP23
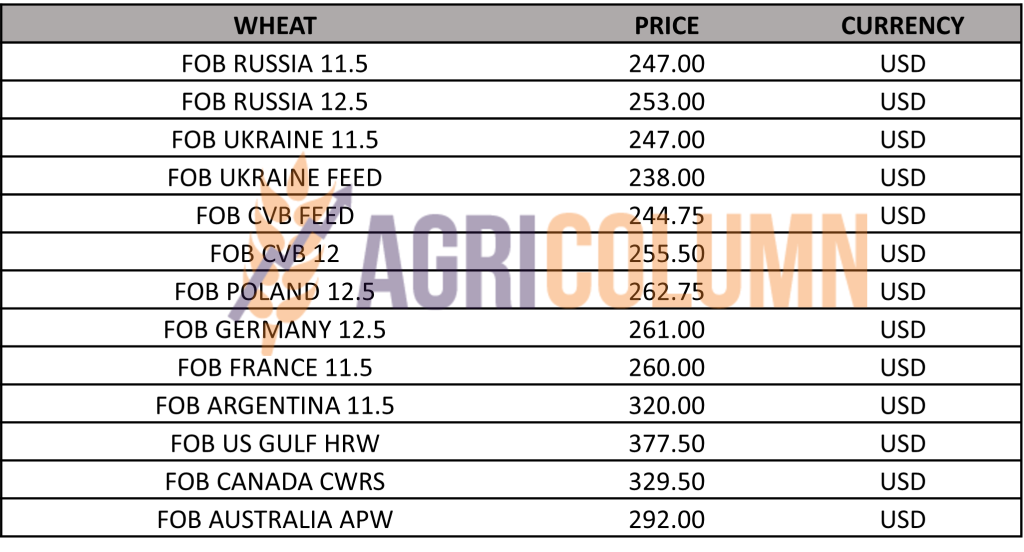
WHEAT PRICE INDICATIONS IN MAIN ORIGINS
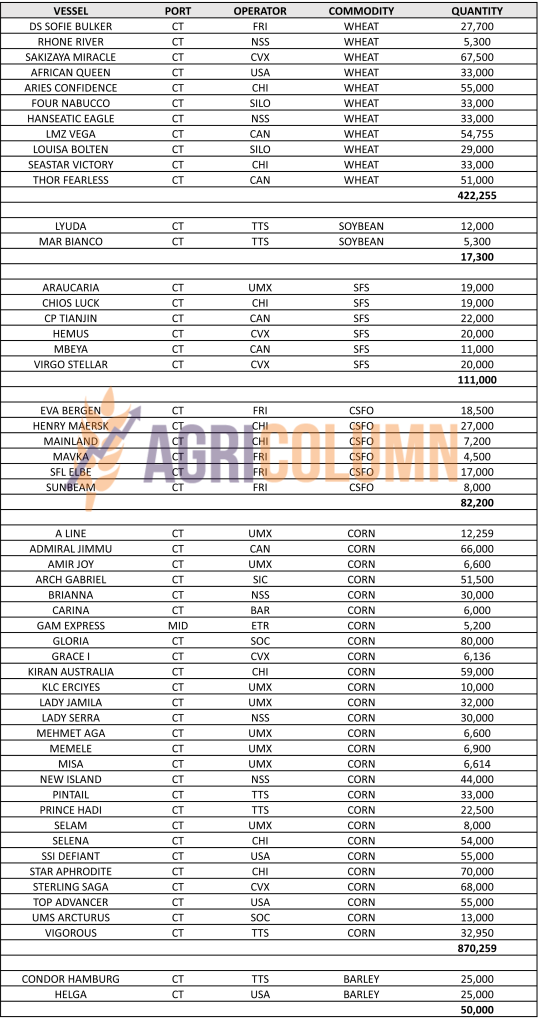
TENDERS AND TRANSACTIONS
OAIC ALGERIA priced 570,000 tons of wheat at 276 USD/MT, C&F. Ameropa 60,000 tons, Aston 60,000 tons, Dreyfus 60,000 tons, Cam 60,000 tons, Lecureur 60,000 tons, Olam 60,000 tons, Sierentz 30,000 tons and 120,000 tons are the most popular.
CAUSES AND EFFECTS – THE STORY
Commercially, following the WASDE report, wheat gets an upgrade in terms of volume factor, which is low in two important origins, Russia and the US. But globally, wheat production is up. Offsets from other origins cannot be altered by the degradations we observe in WASDE grades. And thus, we arrive at a total global figure of 790 MILLION TONS OF WHEAT. With the existing volume figure in mind, we need to nuance one more thing, namely European and North American stock market indications. Comparing the developments between 7 days, we actually note a decrease and not an increase in indications, this despite the increase indicated by the CBOT at the end of the session, more precisely after the release of the WASDE report. We thus have a negative spread of over 9 EUR in Euronext as well as one of over 9 USD in CBOT as a comparator in our observation. We are now taking into consideration the state of affairs in the European region and the Black Sea basin, and things will be weighted in the next period, because there are three factors to clarify:
- The extension of the Cereal Corridor, an aspect that is pushed by statements in the positive and negative sense alike, to increase tension and uncertainty, a fact that will feed the headlines, which, in turn, will generate activity in the trading algorithms.
- The elections in Turkey. The factor of uncertainty is the current President Erdogan, who, if he loses the elections, will leave the role he assumed as Negotiator between Russia and the UN regarding the crossing of Ukrainian goods from Odessa to the Bosphorus.
- WASDE, which already in characteristic style, put a brake on the degradation of the price of wheat by decreasing the productions in Russia and the USA. But we know the social role of the USDA, which acts as a balancing factor between Origins and Destinations. We know that in this exercise, the USDA only wanted to impress upon the market a lower rate of price degradation in light of a superb global wheat crop, and at the same time reduce Russia’s shadow over global trade by reducing them in terms of the next crop level.
CONCLUSIONS
- USDA wanted to direct the eyes of Destinations to other Origins, not only to the Russian one.
- Tempering the downward spiral in the price of wheat by degrading the Origins does nothing but provide support to Northern Hemisphere Ferries. Because the latter had very high start-up costs in the fall of 2022, and today’s price levels do not cover the financial effort, so many of them will have a negative rebound in terms of operating margin on the wheat product.
- The grain route is clear to everyone, and the uncertainty of the Corridor is only apparent. Judging by the volumes allocated for export from Ukraine, they are much lower than in the previous season, and they will certainly be redirected through the lines of European solidarity. The Corridor is no longer an alternative, the costs generated by waiting in Istanbul make logistics extremely expensive through the Corridor. For example, on an Odessa-Alexandria (Egypt) route, the transport cost is 50-52 USD/MT, compared to 13 USD/MT from Constanta and the pseudo price in Novorossisk Russia of 18-20 USD/MT.
- Russia will maintain its export course, continue to generate high volume and be highly competitive, but all at a price. We are referring to the price discount, which in the medium term will degrade the price of wheat globally, despite the Russian willingness to sell high.
- And last but not least, Turkey’s influence could shift its focus by removing Erdogan from power, an Erdogan who has used the strategic influence of the Bosphorus Strait to national financial benefit by attracting cheap goods from Ukraine as well as from follow. Russia.
We repeat, in the medium term, the price of wheat will decrease. The export potential of the Origins is obvious, taking into account the demand of the Destinations, as well as the cargo volume of the 2023-2024 season, of 790 million tons.

LOCAL STATUS
The price indications of feed barley decrease to the value of 183 EUR/MT in the CPT Constanța parity.
REGIONAL STATUS
EUROPEAN UNION. The crop potential decreases at the Union level from 51.6 million tons to the value of 49.9 million tons, a minus of 0.7 million tons.
UKRAINE, for its part, is sowing the spring barley, among the drops, we might say, because the precipitation remains on the scene for some time to come. At the moment, they have reached a level of 250,000 hectares sown with spring barley.
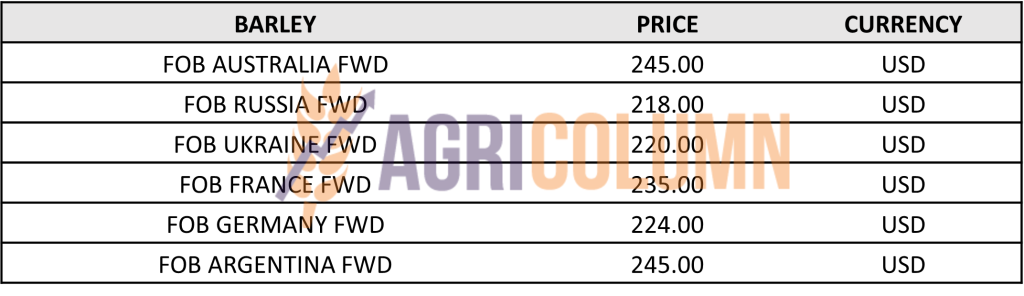
BARLEY PRICE INDICATIONS IN MAIN ORIGINS
TENDERS AND TRANSACTIONS
MIT JORDAN priced 50,000 tons of barley at 257.5 USD/MT, for delivery October 1-15, 2023 in CFR Aqaba parity, from trader AMEROPA.
GLOBAL STATUS
No essential changes.


LOCAL STATUS
Corn price indications remain at the level of 203 EUR/MT for the old crop in CPT Constanța parity.
The price of the new crop decreases to the value of 183 EUR/MT in the CPT Constanța parity.
CAUSES AND EFFECTS
The new crop is progressively falling in tandem with wheat and today we see the difference between the two set at 24-25 EUR/MT. It is a direct relationship and correlation between the two and this must generate forward selling potential from Romanian farmers. As for the old crop, our suggestion is not to delay too much in the sale process. Time passes and as the new crop is much more clearly visualized in terms of volume, its price will move towards that of the new corn crop.
REGIONAL STATUS
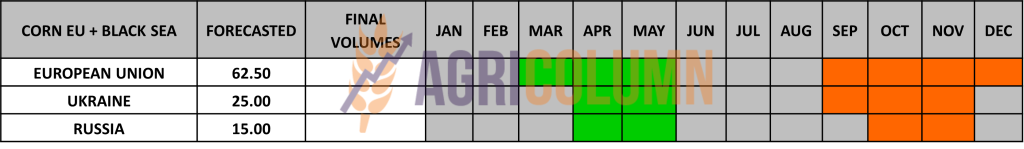
THE EUROPEAN UNION sees a degradation in terms of harvest volume. We are referring to a decrease to almost the level of 62 million tons, a fact generated by the drought in Spain and the reduction of the area allocated to corn at European level.
UKRAINE reached a seeding level of 2.7 million hectares. Production is forecast at 22 million tons, with an export potential of 16.5 million tons. Let’s not forget, however, that Ukraine still has corn left unexported, so the yield in figures at the export level could easily increase.
RUSSIA will generate a crop of 16.5 million tons and, little by little, will begin to rely on this raw material for export as well.
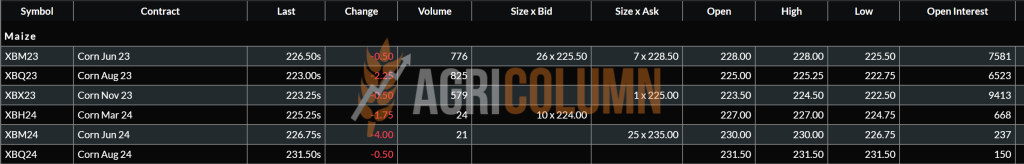
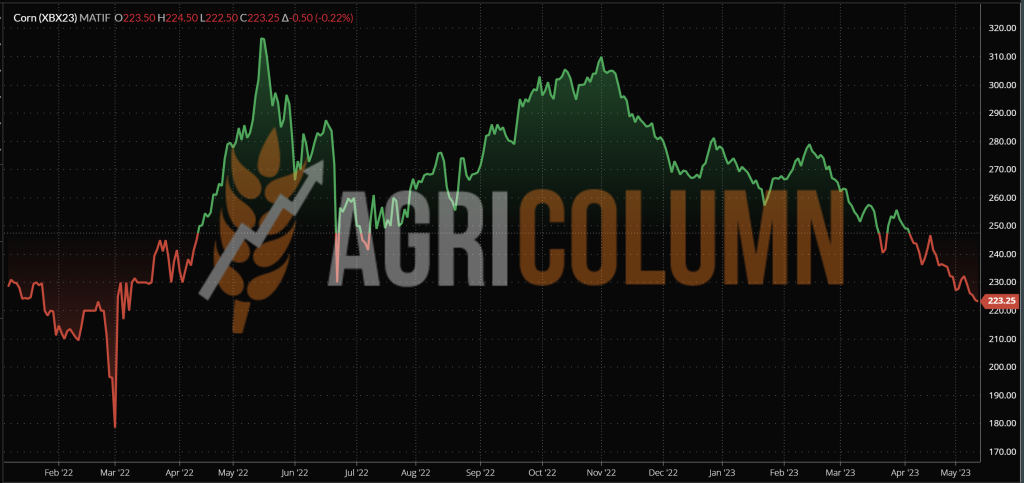
EURONEXT CORN – XBX23 NOV23 – 223.25 EUR (-9 EUR vs. previous week)
EURONEXT CORN TREND CHART – XBX23 NOV23
GLOBAL STATUS
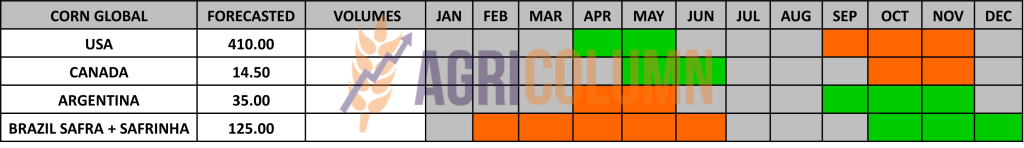
ARGENTINA is quoted by WASDE at the same level of 37 million tons, no change overall.
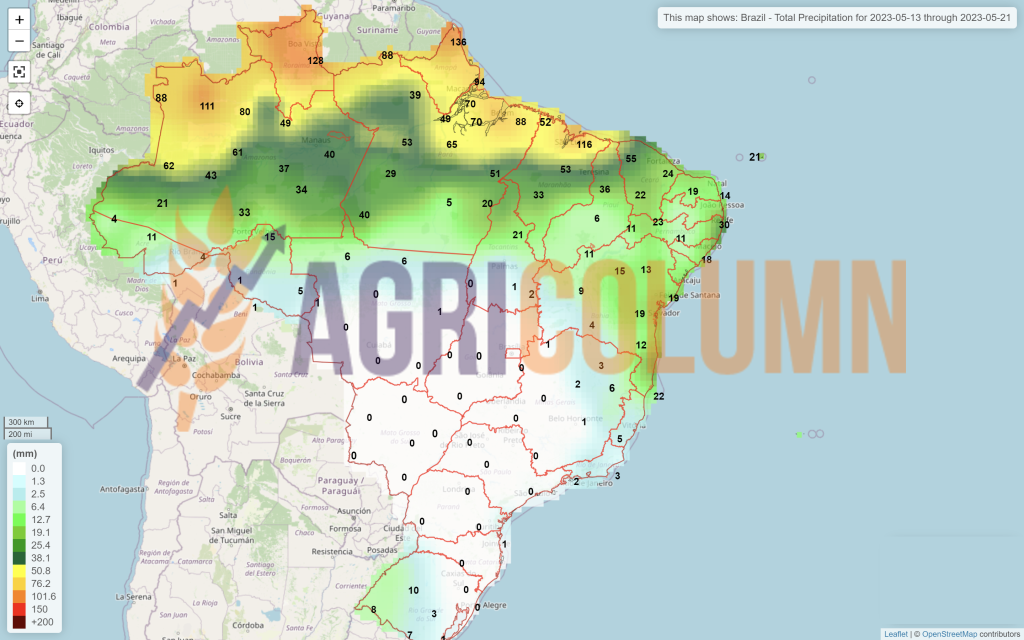
BRAZIL is lifted by WASDE at 130 million tons, up 5 million tons from WASDE April.
The US is in a position that breeds optimism. Namely, the volume projection of the future CROP is at 388 million tons, a direct result between a larger area and a much higher productivity projection per hectare of 181.3 bu/acre = 12.19 tons./hectare, but I said it’s still a long time before harvest in the US and weather can play its part.
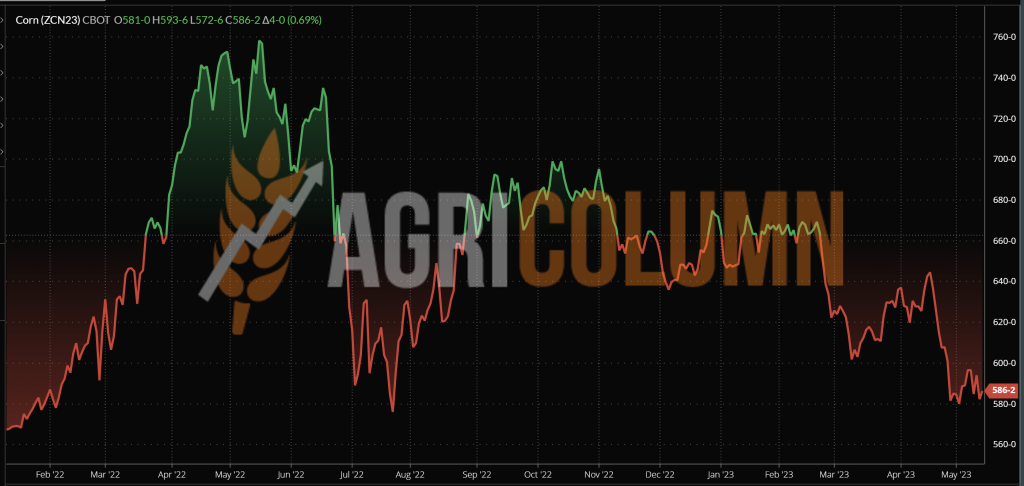
CBOT CORN ZCN23 JUL23 – 584 c/bu (-12 c/bu vs. last week)
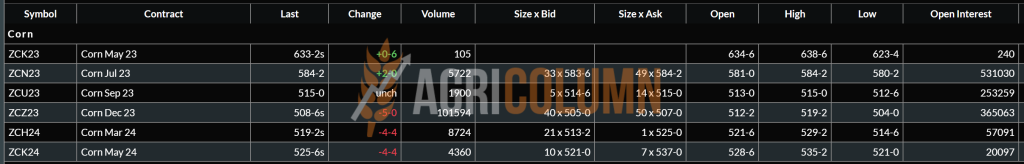
CBOT CORN TREND CHART – ZCN23 JUL23
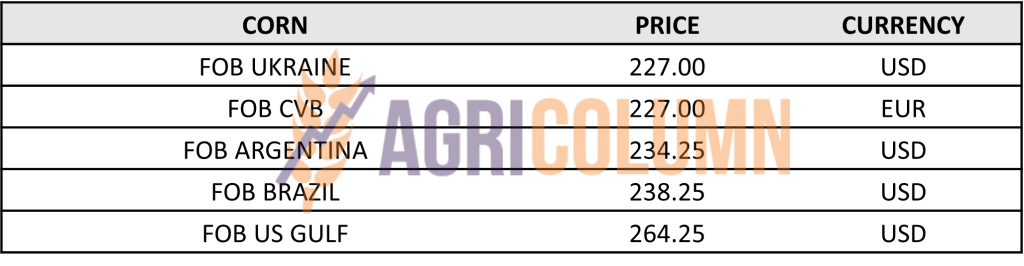
CORN PRICE INDICATIONS IN MAIN ORIGINS
CAUSES AND EFFECTS – THE STORY
Corn will have a similar price path to wheat due to two factors.
The first to be explained is the geo-political one, namely the Grain Corridor. The closure of the Corridor benefits the European Union, which has a foreseeable shortage of corn in the 2023 harvest and naturally needs this raw material.
In other words, Mrs. Ursula von der Leyen’s speech in Kyiv, which guarantees the request of Mr. Zelensky, very imperative by the way, regarding the transit and import of Ukrainian goods through the European Union, has served and will serve this interest. Ukrainian corn must and will reach the European Union.
With a difference of minus 7 million tons compared to an average of 68-69 million tons, the EU needs corn. In terms of import in normal years in terms of volume and weather, the Union had a figure of 16-18 million tons. Under this year’s conditions, demand inevitably increases by at least 7 million tons.
And we are not talking about any goods, but cheap Ukrainian goods. Moreover, the European Parliament gave the green light to the extension of REG 870/2022, which establishes the importation of Ukrainian goods into the EU without import duties.
The US volume forecast is in direct competition with Brazilian volume, Safra + Safrinha. This will generate medium-term price decline and competition for the destination market, EU (Spain) and China. We don’t even bring up Asia, Mexico, etc.
In other words, corn’s price trajectory is not positive in the medium term. Only the Weather can generate changes, but even if the North American harvest volume will decrease, say by 7%, it will still remain a higher volume level than in the previous season.
And in the European Union, the cheap goods from Ukraine will direct the price of corn, at least in the Black Sea basin (Romania) and in the neighboring countries.

LOCAL STATUS
The indications are maintained on the same calculation formula for the goods delivered in CPT Constanța parity, namely AUG23 minus 40-45 EUR/MT. Processors guidance remains at the level of AUG23 minus 50 EUR/MT, DAP processing units.
CAUZE ȘI EFECTE
As we predicted, the rapeseed trail stopped for a while. The level was effectively collapsed, under identical conditions as in the previous season. What had to be repeated was repeated as indigo shot. The month of May 2022 is repeated in 2023.
Volume forecasts from other sources determined this ebb and flow of the Euronext price level, fueled, of course, by the other factors, fossil energy and subsequently Vegoil.
The Ukrainian flow of rapeseed will also contribute to this locally, which will carry out the route through Romania. The corridor no longer uses Union interests and the Ukrainian rapeseed crop appears to be in very good parameters, so that it can find its way to processing facilities in the Union, and if the import restriction is not taken care of, it will be extended. Its first station will be Romania.
Because Romania will process the cheap goods taking into account the fact that it is not aligned with the European directives regarding the calculation of CO2 emissions, in fact an extremely simple conversion from Joules/KG to CO2/kg of dry matter. And this penalizes the sustainability of Romanian rapeseed by at least 20 EUR/MT. To this aspect we add logistics and we already have the size of losses per ton that will be suffered by Romanian farmers, in the condition where the operating margin is extremely small, if not negative.
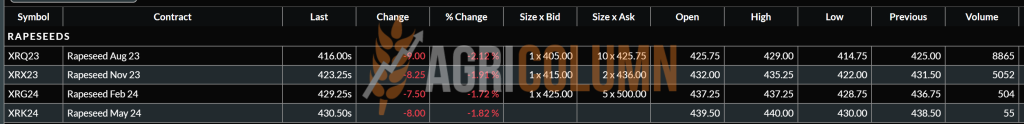
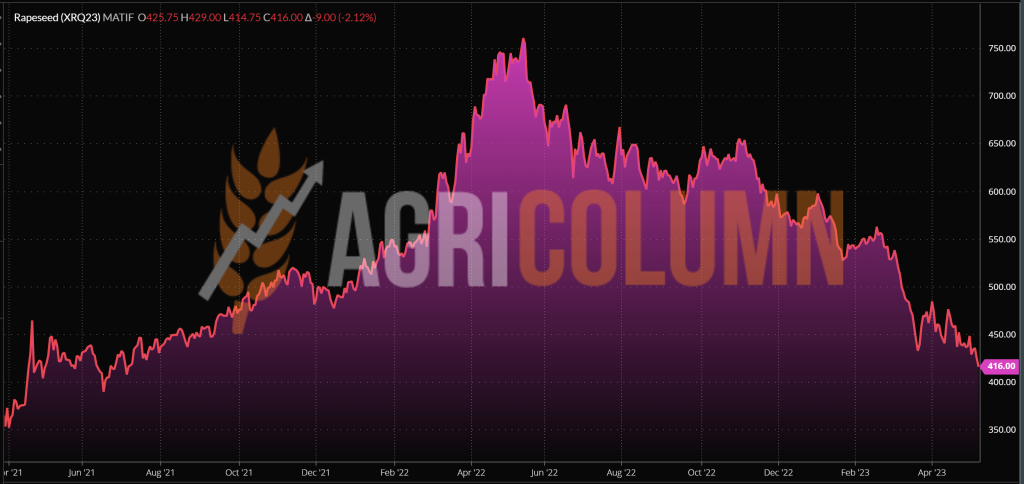
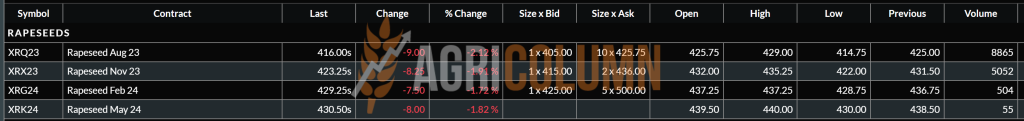
EURONEXT RAPESEED – XRQ23 AUG23 –416 EUR (-32 EUR vs. previous week)
EURONEXT RAPESEED TREND CHART – XRQ23 AUG23
REGIONAL STATUS
EUROPEAN UNION. EU rapeseed production is forecast to increase to 20.5 million tons based on higher hectare areas allocated to the 2023/24 season. Raised rapeseed stocks from unsold commodities by farmers will allow for both increased processing and stock consolidation.
RUSSIA is forecasting 3.85 million tons of next crop volume, in line with the previous season, which puts it at the Best 5 Years average.
UKRAINE forecasts a slight decline in rapeseed production, around 3.2-3.3 million tons, but these seeds will go the way of the European Union. It is clear and obvious that this corridor is no longer in the interest of the European Union.
GLOBAL STATUS
USA. Rapeseed production in 2023/24 is forecast at a new record, leading to a drop in imports. Processing is expected to increase slightly, while imports of canola meal are up modestly. Rapeseed oil production will support record consumption next season. Let’s not forget that the share of vegetable oil in California’s biofuel mix was forecast from 2019 to increase from 1.8 million tons of rapeseed oil to 18 million tons in 2025-2027.
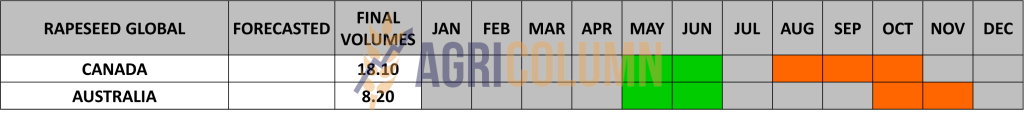
CANADA canola production is estimated to be 7% higher at 20.3 million tons. Exports are expected to increase from year-over-year levels. Stocks are expected to recover from the past 2 years of all-time lows, but remain below the 5-year average. Canola meal and canola oil exports will remain strong with rising US demand and demand from China.
AUSTRALIA. Rapeseed production is expected to drop significantly to 5.7 million tons, due to the reduction in seeded area and the El Nino effect. Exports will decrease by 29%, up to 4.5 million tons. Stocks will decline and return to multi-year average levels.
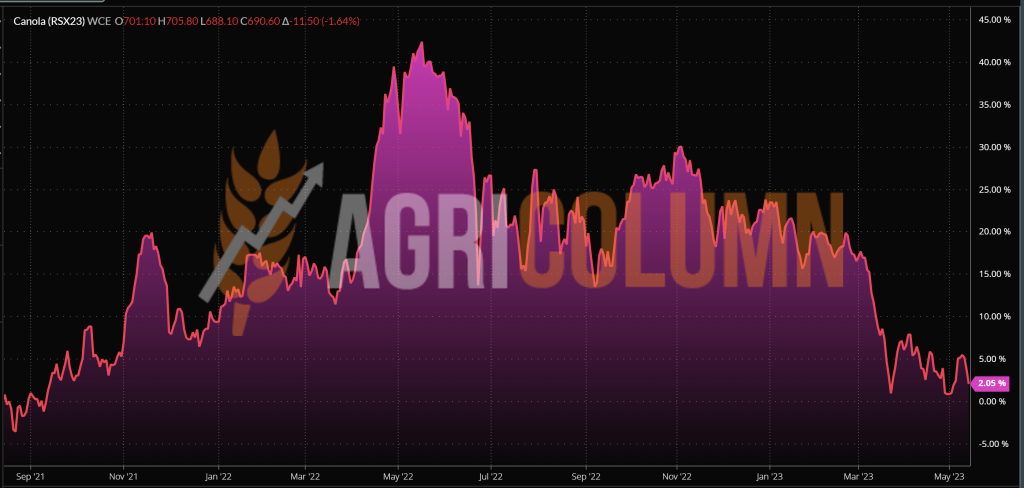
ICE CANOLA RSX23 NOV23 – 702 CAD (+5 CAD vs. previous week)
ICE CANOLA TREND CHART – RSX23 NOV23
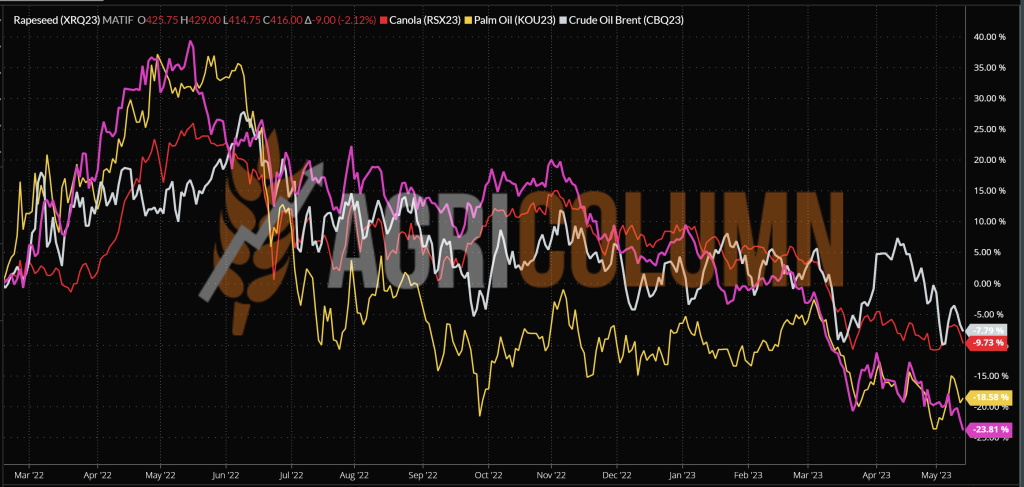
In a comparative study: MINUS-MINUS-MINUS-MINUS
- canola = magenta
- canola = red
- palm oil = yellow
- petrol = grey
CAUSES AND EFFECTS – THE STORY
Rapeseed reaches a dead end. The month of MAY is repeated as in the previous season. We’ve got a number of factors here that we’ve listed repeatedly, and at this point, they’ve lined up. We resume them and describe the following next:
- Record production in the European Union, over 20.5 million tons;
- Rapeseed production of Ukraine;
- Export record to the European Union of Ukraine;
- Australia’s EU export record,
- Production record in Canada;
- Production record in the US too;
- The price of palm oil, which falls on the increase in production in Indonesia;
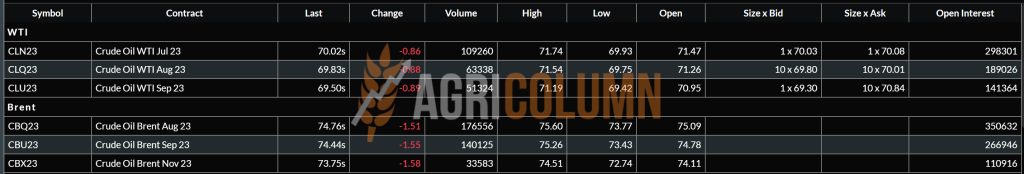
- The price of oil, which is falling below 74 USD/barrel, after climbing extremely high, at the level of 87 USD/barrel after the announcement of OPEC + (an agreement that Russia did not respect).
All the factors lined up above mean nothing but a bearish market, and things have taken a firm and well-defined account, a fact that I have long foreseen. One thing I did not estimate well, and that was the timing. Being set for May 16-18, 2023, we were 2-4 days ahead, due to the appearance of the WASDE report.
What’s next? Broadly speaking, there will be corrections related to the weather and import level. But the closure of the corridor will be a benefit for the European Union, as the raw material will naturally come to processing units and create competition with domestic goods in the countries it will cross.
Euronext indication corrections by default. Let’s compare 2018 when XRQ AUG2018 indicated 375 EUR. The 40 EUR correction VS XRQ23 AUG2023 has nothing but the share of inflation in the cost of production associated with all that that means.
If Ukraine will cross with 3 million tons to a European Union, European volumes are sufficient, Australia will no longer generate a very large export surplus and will remain in its area of affluence, Asia, China, a fact that will allow some quantities (not very many). large) of canola to enter from Canada.
But productions are high, stocks are rebuilding and we have no basis at this point that could indicate a big jump in canola prices. For sure there will still be commutes, but they won’t be lasting either. They will most likely be generated by Weather and correlation with Petrol and VegOil.

LOCAL STATUS
Constanța port quotes old crop sunflower seeds at the level of 420-430 USD/MT. Local processors are indicating 410-415 USD/MT.
The quotation level of the new crop is set at 390 USD/MT in CPT Constanța parity, which leads to a level of 380 USD/MT for the goods delivered to processing units.
CAUSES AND EFFECTS
The lull in demand and progress in sunflower seeding regionally mean that the new crop price idea no longer has the power to generate levels above 400 USD/MT for cargo delivered to processors.
Forward sell of at least 1 ton of sunflower seeds per hectare, because in the event that the import restriction of Ukrainian goods in the 5 neighboring countries is lifted, we could see further price degradation.
REGIONAL STATUS
UKRAINE has reached a seeding level of over 2.3 million hectares.
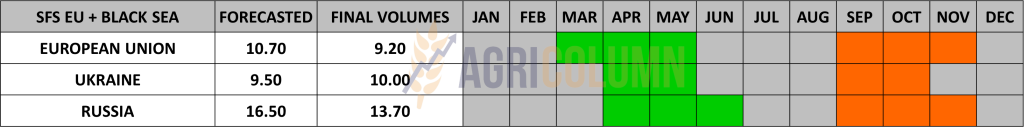
RUSSIA has no change; it is also at the time of sowing. We maintain the volume forecast at 16.5 million tons.
The EUROPEAN UNION sows, for its part, and volume forecasts will rise to levels that will reach 11.5 million tons. For comparison, in the previous season, the Union generated 9.3 million tons, but let’s not forget the drought. But in the 2020/21 season, the European Union generated 10.3 million tons, against the background of a balanced in terms of weather and production.
GLOBAL STATUS
Out of season.

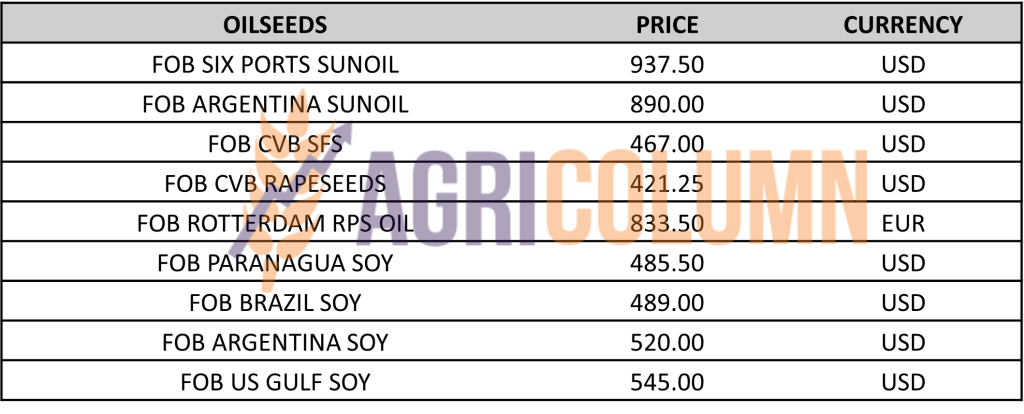
PRICE INDICATIONS FOR OILSEEDS AND CSFO IN MAIN ORIGINS
CAUSES AND EFFECTS – THE STORY
Today new indications that will guarantee the path of sunflower seeds in the next down time period. Let’s take the factors in turn and describe them, and then conclude.
OLD CROP
- Demand for oil is extremely latent, does not generate very high interest and buyers are undecided.
- The bid level in the last GASC Egypt tender was 950 USD/MT, C&F.
- The price drops in Origins and we refer to the raw material, Ukraine being an extremely good indicator in this regard. And the price drops below 400 USD/MT DAP, to values of 365-390 USD/MT, but let’s not forget that in Ukraine, the raw material is subject to VAT.
- The coverage of the processing units is almost finished and they will enter the annual revisions on the territory of the European Union.
NEW CROP
- Projection of very good harvest volume in the European Union of 11.5 million tons.
- Very good crop volume projection in Russia at 16.5 million tons.
- Volume projection that can increase in Ukraine, of 12-13.5 million tons.
- Closing the Corridor, a fact that uses the miracle of the European Union. Ukraine will no longer be able to export oil through Chornomorsk and will have to resort to European solidarity lines. This means nothing more than an automatically lower price level and more raw material towards the European Union. And this at a lower price.
- The only note of support will possibly come from the maintenance of import restrictions in the 5 neighboring countries. But at what peace did it rest, we assume that the restriction will not be extended, despite the letter signed by the 5 countries and the address to the European Commission.
So we have a season ahead where the global sunflower seed volume is at (forecast) 54.32 million tons, compared to 51.64 in the season we are still in.
2.7 million tons more means quite a lot, if we also take into account the partners of VEGOIL who will have increased production of palm oil and soybean oil, the direct consequence of a higher level of raw material, a fact guaranteed by the last WASDE report.

LOCAL STATUS
In Romania, the price indications for soybeans are at the level of 470 USD/MT, DAP processing units for non-GMO soybeans.
REGIONAL STATUS
THE EUROPEAN UNION. Total imports of soybeans this trading season reached 10,700,000 tons, and soybean meal reached 13.4 million tons.
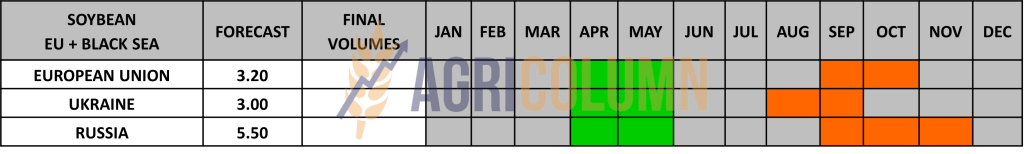
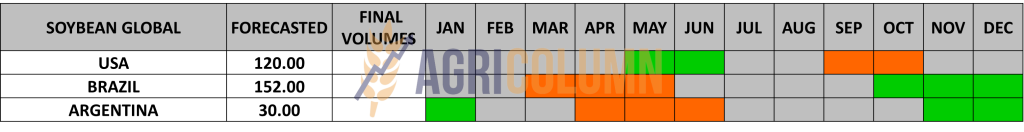
GLOBAL STATUS
ARGENTINA. WASDE keeps Argentina at 27m tons production, despite BAGE estimates of 21.5m tons.
BRAZIL is maintained at the level of 155 million tons production forecast.
The US has a volume forecast of 122.7 million tons. If we compare with the previous season, we have an increase of 6.5 million tons.
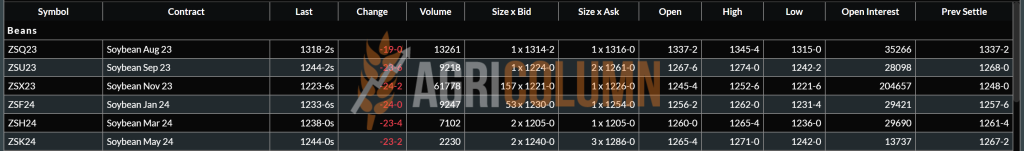
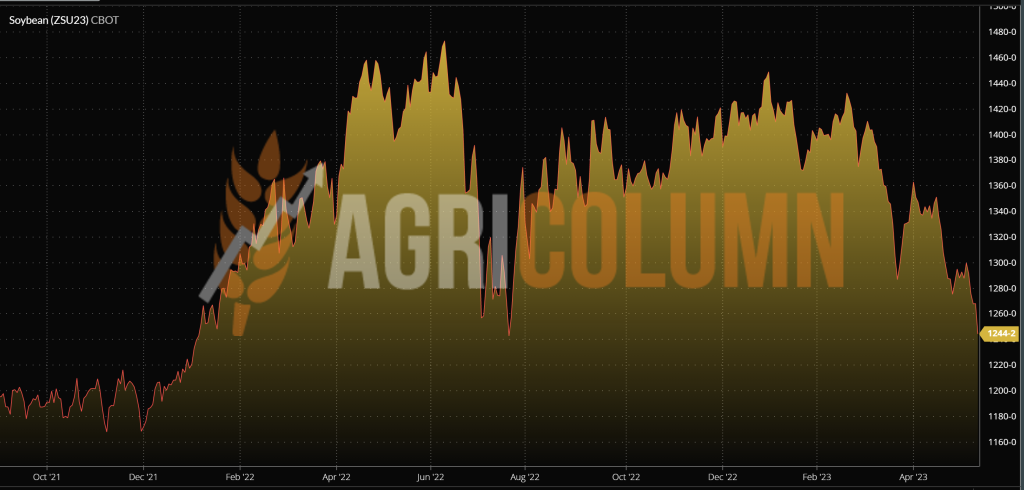
CBOT SOYBEANS ZSU23 SEP23 – 1,244 c/bu
SOYBEAN CHART TREND – ZSU23 SEP23
CAUSES AND EFFECTS – THE STORY
WASDE generated projection of the new US soybean crop. And this is 6.5 million tons higher than that of the previous season. This, aggregated with the fact that Brazil will generate more than 155 million tons, covers the shortfall in Argentina’s production.
These forecasts and crop forecasts have caused price indications for SOYBEAN to decline. But, in tracking the US crop, there is not only the Weather parameter, which will be tracked by us. Demand from China will also naturally be split between Brazil and, later, the US.
In the short and perhaps medium term, soybeans will not have an upward trend, but the weather can guarantee this in any way, be it positive or negative.
EXTRA
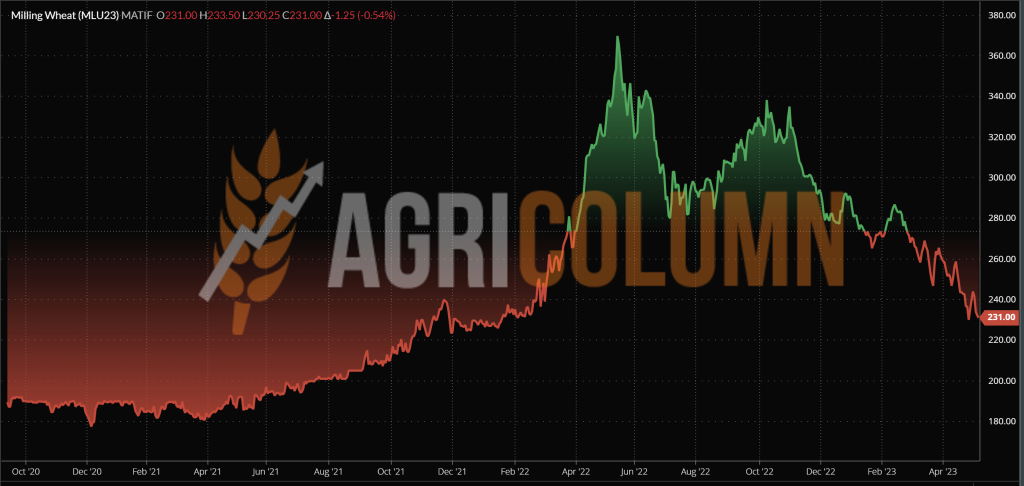
2020-2021-2022-2023 EURONEXT WHEAT CHART
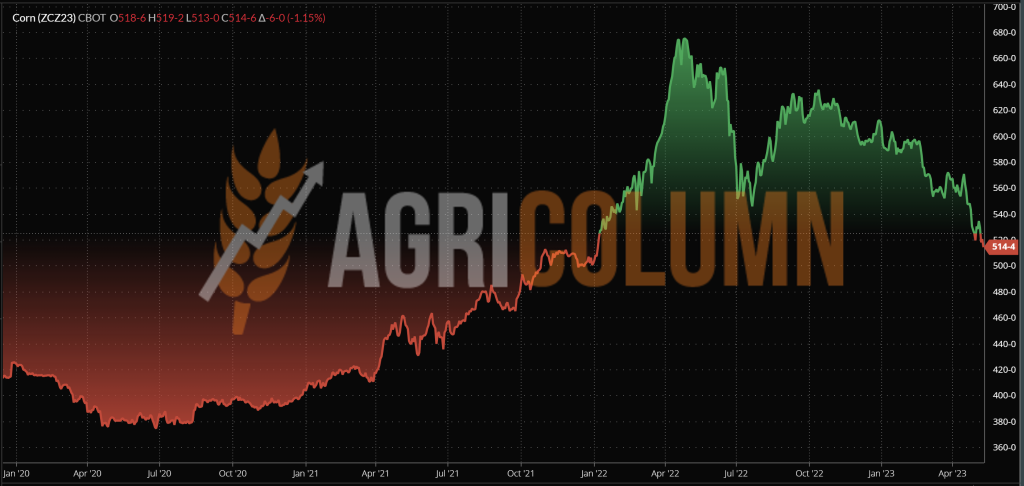
2020-2021-2022-2023 CBOT CORN CHART
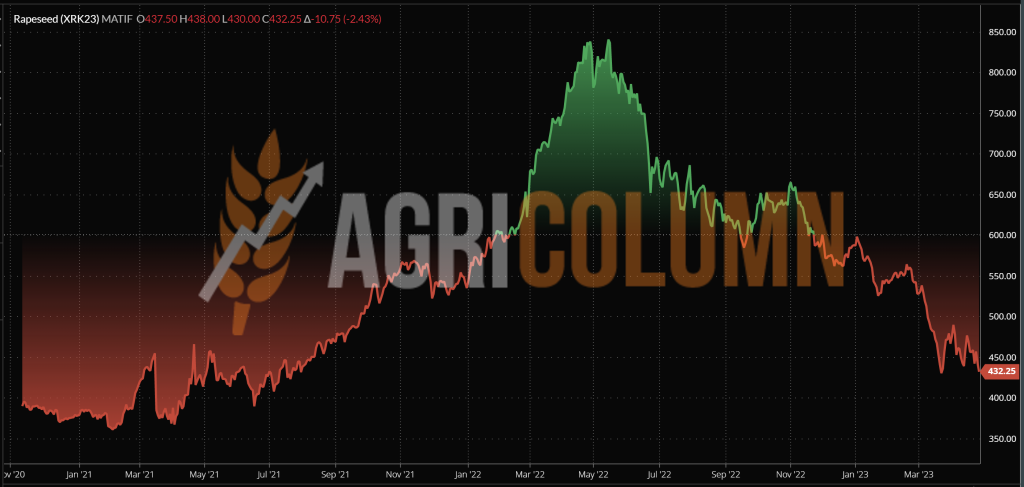
2020-2021-2022-2023 EURONEXT RAPESEED CHART
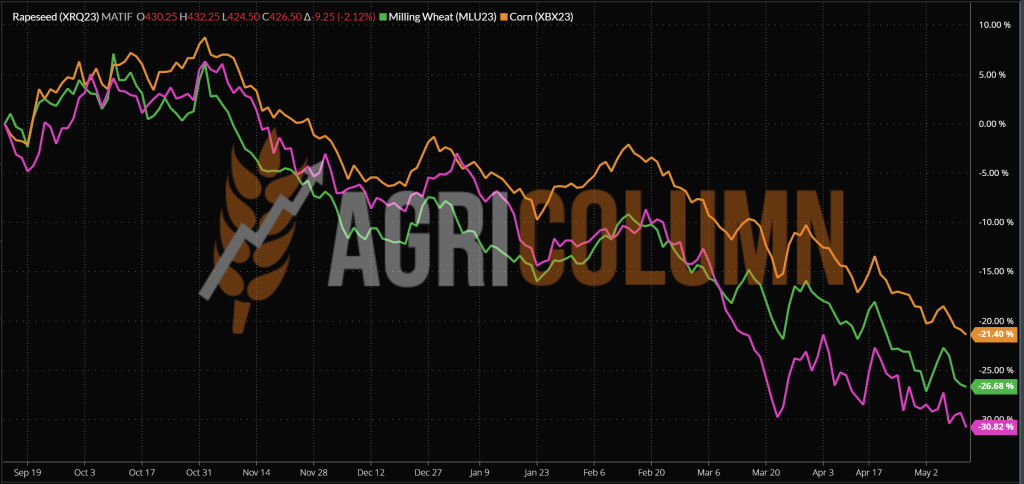
EURONEXT-CBOT-COMBINED. WHEAT-CORN-RAPESEED CHART


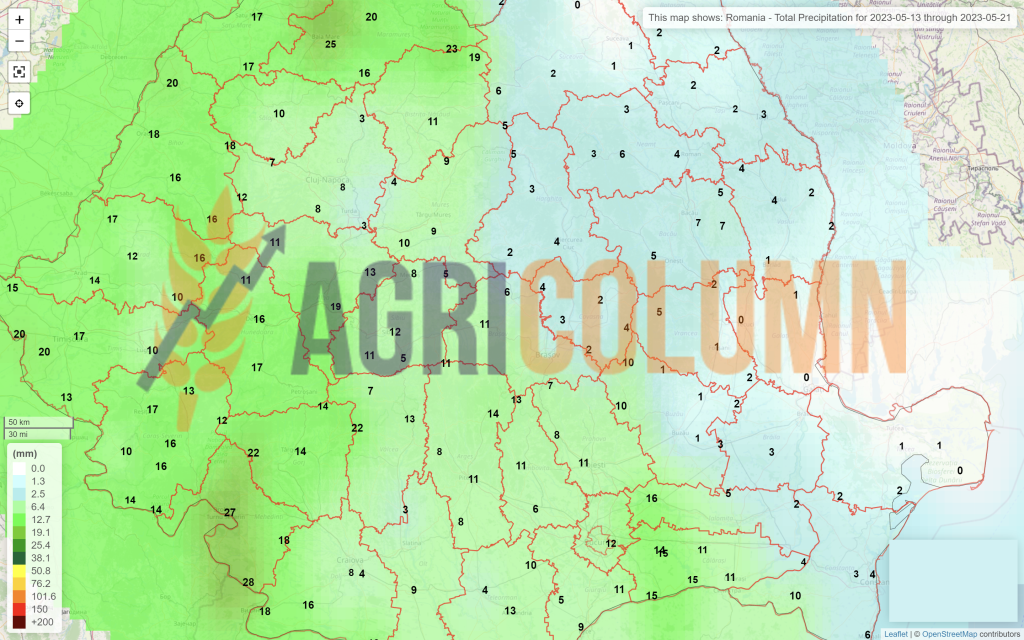
13-21 May 2023
Romania
Europe
Ukraine
Russia
Canada
USA
Brazil
Argentina
China
Australia