This week’s market report provides information on:

LOCAL STATUS
The indications of the Port of Constanța are, depending on the buyer, in a range of 220-224 EUR/MT in CPT parity. The discount for feed quality is 7 EUR/MT.
The new wheat crop is valued at 218 EUR/MT and with a discount of 6-7 EUR/MT for feed wheat, both indications having as reference the CPT Constanța parity.
CAUSES AND EFFECTS
Romania increases the rate of wheat export and reaches the level of 3.4 million tons. At the same time, on the same negative import trend, Romania reaches a volume imported from Ukraine of 900,000 tons. And if we calculate in percentages, we clearly see how from the total export of Ukraine in absolute value up to this moment of 4.7 million tons, our country accounted for more than 19% of the Ukrainian export figure.
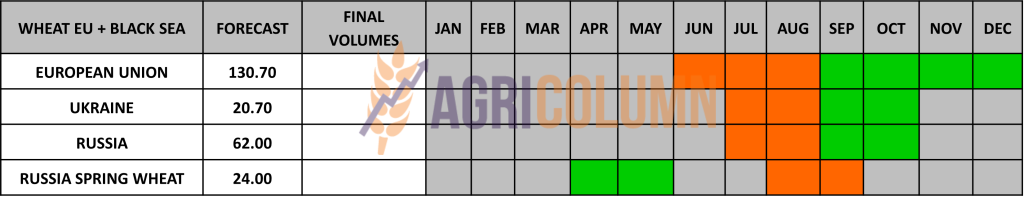
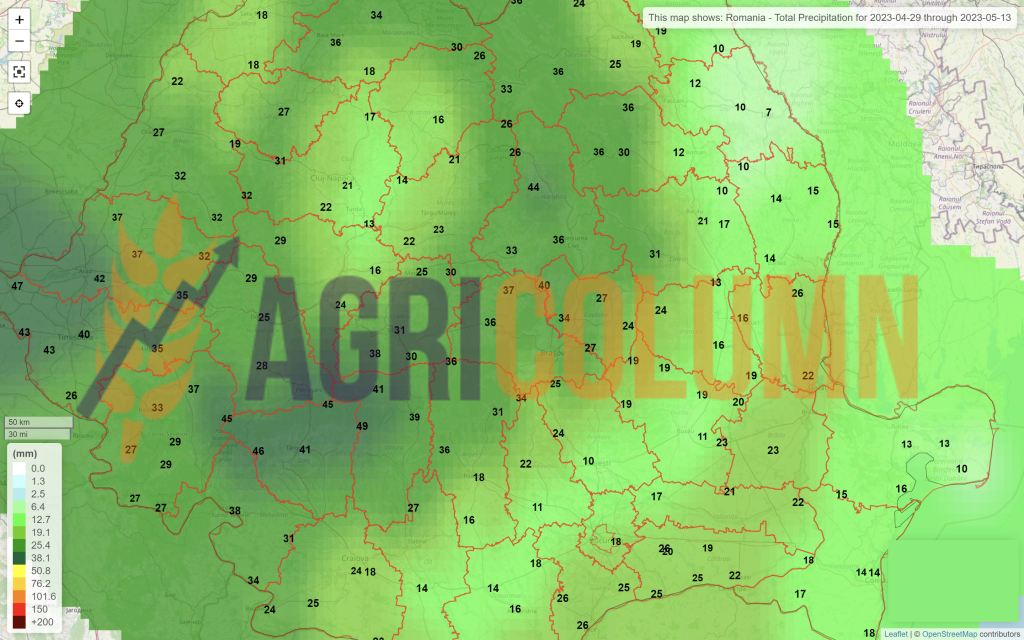
We cross hurriedly from the old crop to the new, and we have the confirmation of our predictions. Namely, the Romanian harvest volume for this season. Our figures indicated a value of over 10,000,000 tons, and the confirmation came following the analyzes of European houses specialized in the field. Romania now has a forecast of 10.35 million tons.
And if this increases in the next month due to weather conditions, we will be able to exceed 10.5 million tons. But here we have a few things to take into account, namely:
- Romania will be late in harvesting by 10-14 days. The cold weather prevented the development of autumn crops and so the gap we are exhibiting will occur.
- Romania will carry with it an unsold volume of goods that will enter the new crop much higher than usual. And here our estimates are 1.2 million tons minimum.
We therefore recommend farmers not to delay the process of selling some parts of the wheat harvest in prolonged expectations. Let’s not forget that as we started this campaign, so we will continue.
REGIONAL STATUS
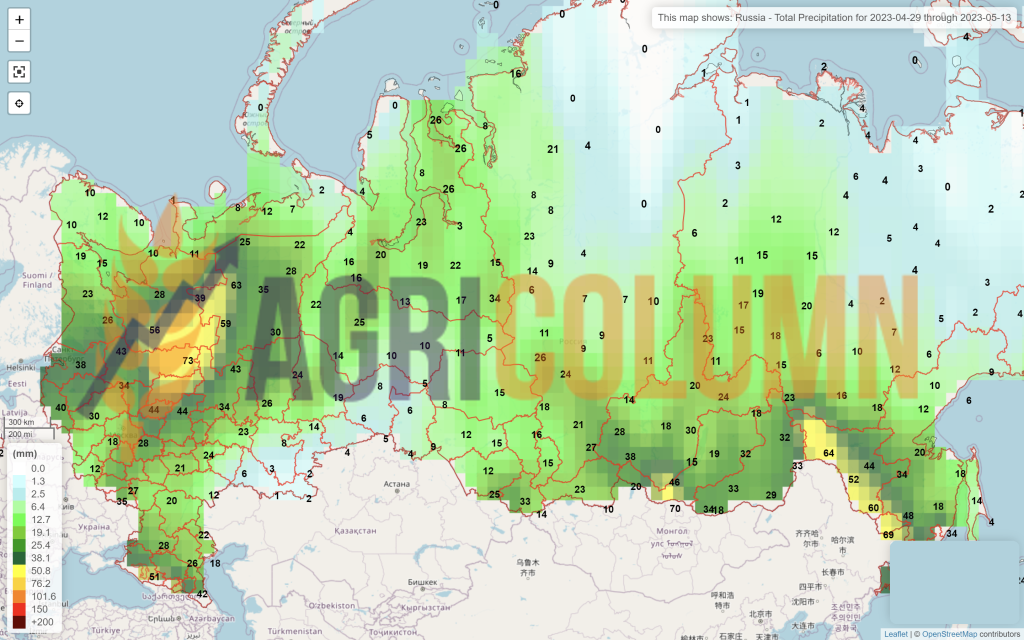
RUSSIA exceeds the forecast from the previous number and rises to a value of 87.5 million tons, with the clear amendment that they will receive another 6 million tons from the occupied areas of southern Ukraine.
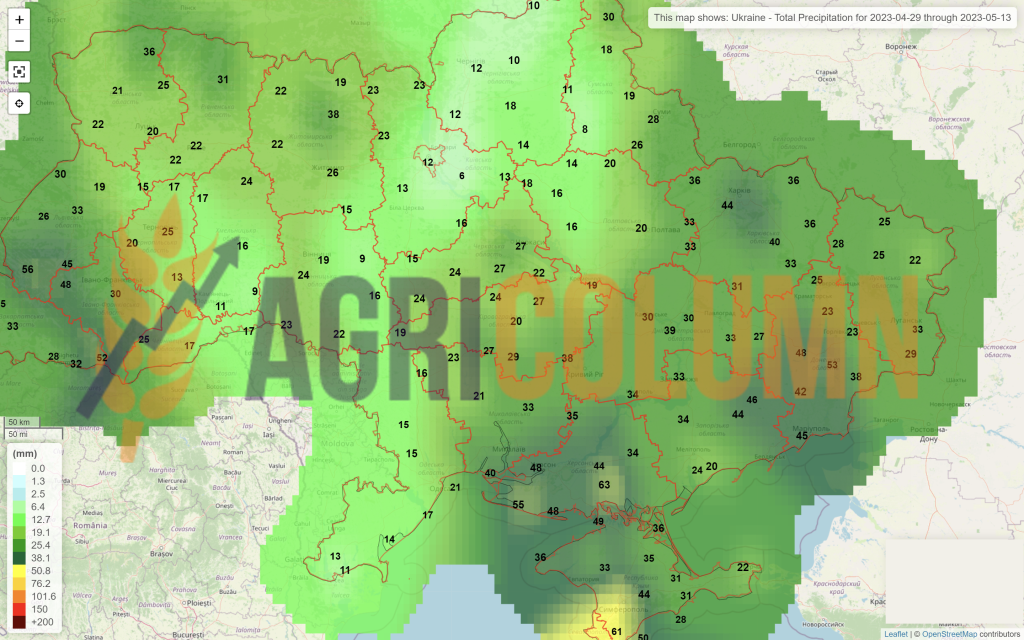
UKRAINE remains in our estimations at a level of 21 million tons, and if we also add the volume from the territories controlled by Russia, we see a classic crop of 27 million tons. But the way the weather is looking, we may see an upgrade as well as a gap in harvest.
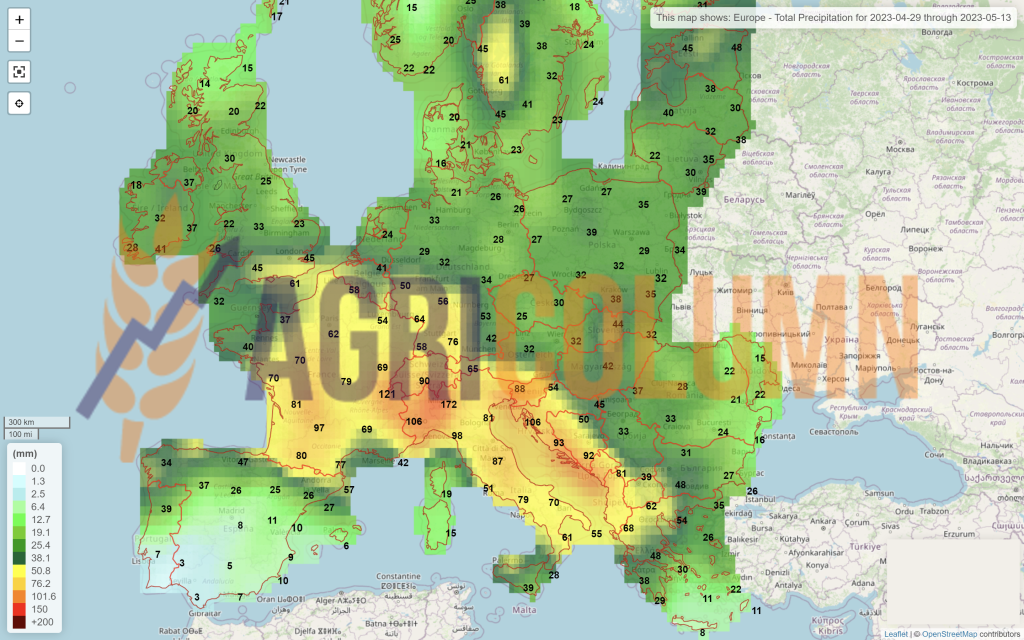
THE EUROPEAN UNION does not see negative changes at the vegetative level, except for Spain, which is responsible for 4% of the total volume of the Union, which, translated into figures, means 5-5.2 million tons. Spain is getting a downgrade of 0.8 million tons at the moment, but they will surely drop more than that. If today we see 4.3 million tons in terms of crop, our estimates lead Spain to 3 million tons.
As for EU export, it remains stationary at the total level of 25 million tons, with an imported volume of 8.7 million tons. Looking at the numbers, we can see that the level of wheat import from Ukraine has decreased considerably recently. Naturally, we are nearing the end of the cycle and all eyes are on the new crop.

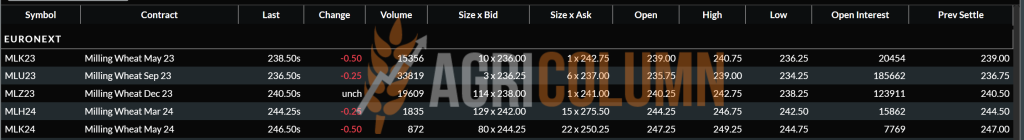
EURONEXT – MLU23 SEP23 –236.5 EUR
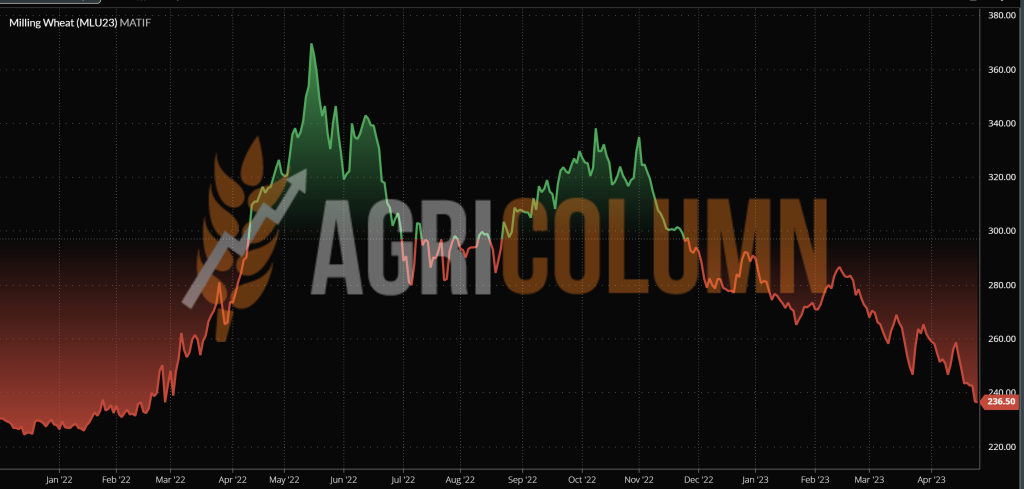
EURONEXT WHEAT TREND CHART – MLU23 SEP23
GLOBAL STATUS
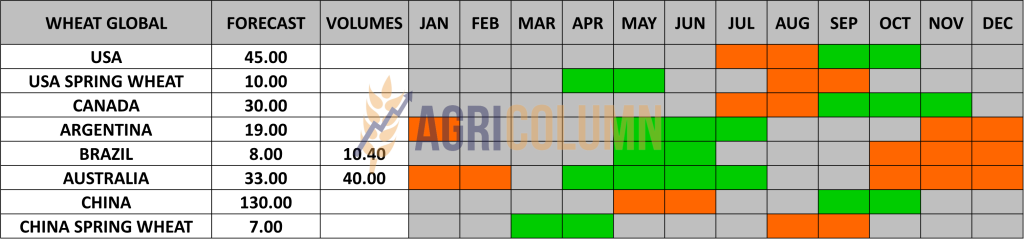
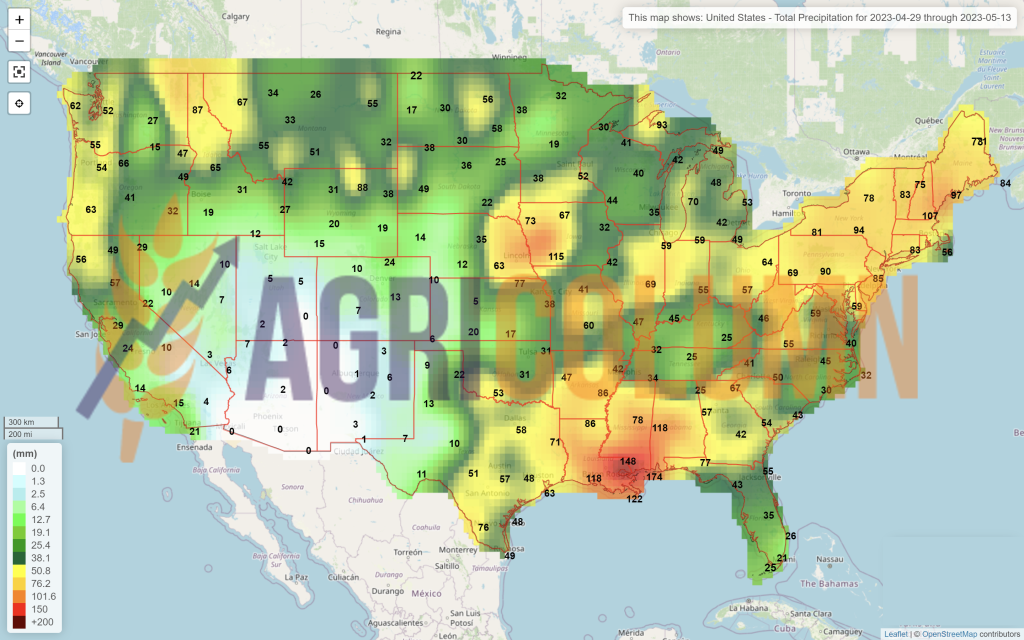
The US is in for a good time, I’d appreciate it. Why do we support this? Precipitation improves the condition of North American crops and we note the area where American wheat is at the “best of 5 years ” average, that is, at an average of 52 million tons. If we compare with last season, when they weighed 45 million tons, we clearly have a positive picture.
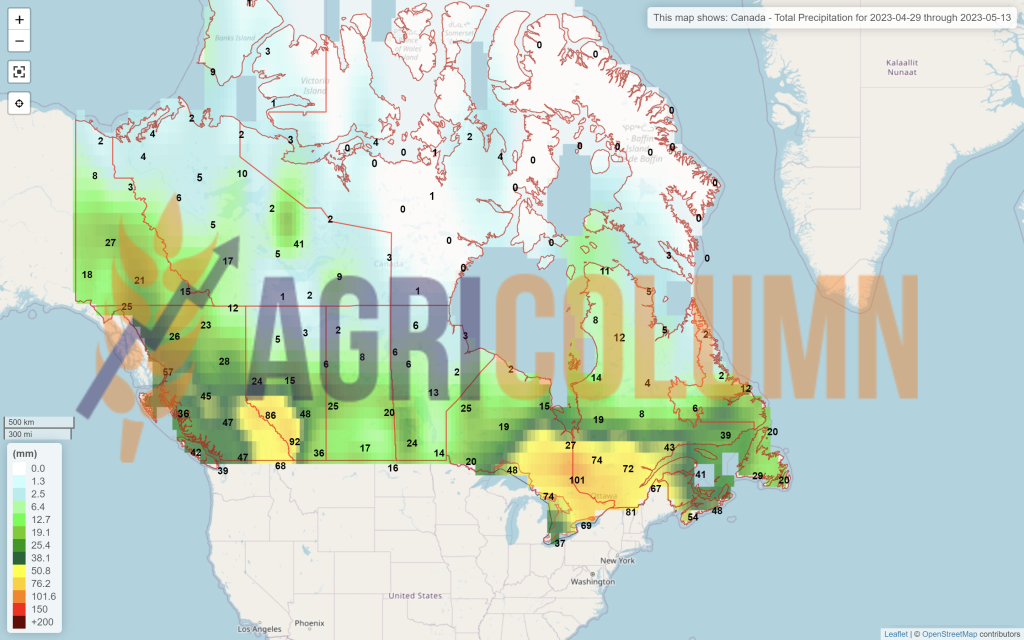
CANADA indicates in the forecast more than 33 million tons, more precisely 33.5 million tons, which leads them, in turn, to an extremely well positioned place. Enter the good average of recent years.
We will modify the global forecast table accordingly when certainty replaces the forecast, towards increased data accuracy.
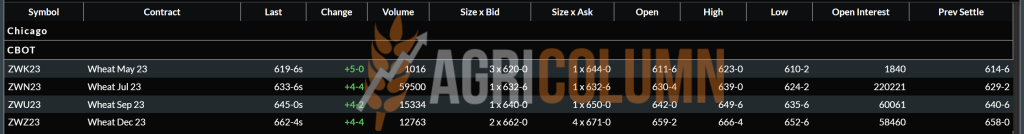
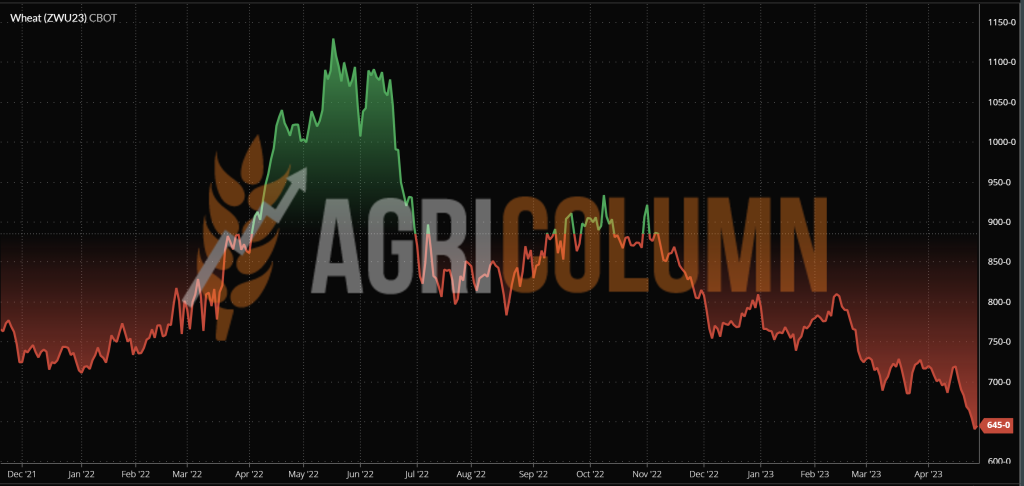
CBOT WHEAT – ZWU23 SEP23 – 645 c/bu
CBOT WHEAT TREND CHART – ZWU23 SEP23
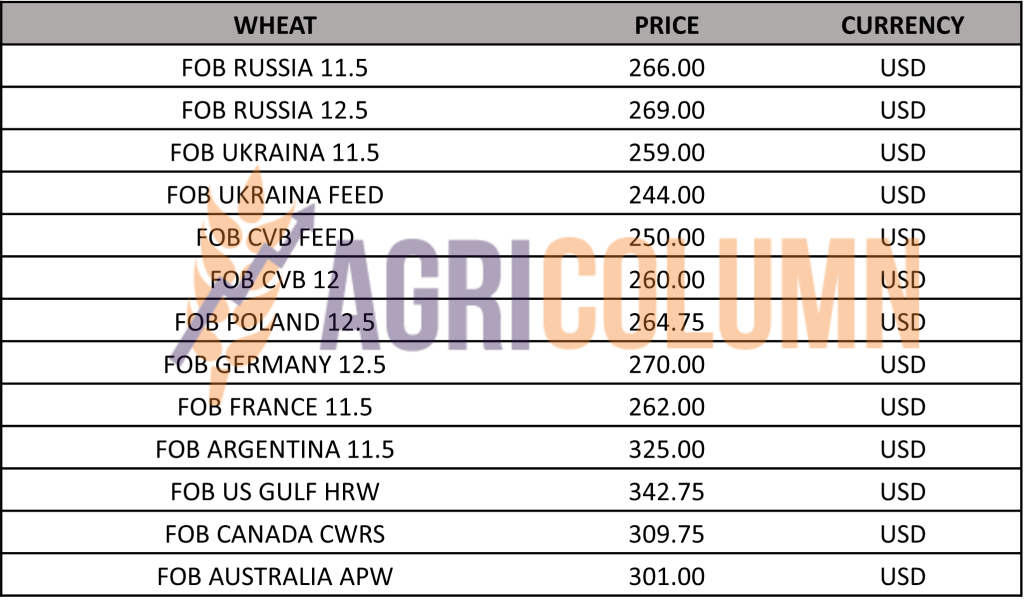
WHEAT PRICE INDICATIONS IN MAIN ORIGINS
CAUSES AND EFFECTS – THE STORY
The headline was held the previous week by the meeting of the Ministers of Agriculture from the member countries of the European Union and the possible decision that could be taken in the current context generated by the tensions created by the negative impact in the 5 countries of proximity to Ukraine.
The board passed and on Friday evening the decisions began to arrive. First, the import of Ukrainian goods to the 5 countries, Poland, Romania, Hungary, Slovakia and Bulgaria, is prohibited until June 5, 2023, at least for 4 products: wheat, corn, sunflower seeds and rapeseed. Sunflower oil is also under careful analysis, as it can be added to the list of restrictions.
At the same time, transit through the 5 countries was agreed. This must continue, but must be very carefully monitored by the countries concerned. From a documentary and sanitary-veterinary point of view, we add.
The countries in question would also receive an aid package worth 100 million euros, the distribution of which we cannot confirm at this time, because we do not know the award criteria.
Let’s now move into the wheat market and assess it by its current state. As we expected, the liquidations of positions have had high volumes in the last few days. The month of MAY23 is literally liquidated and the funds have liquidated their positions, short or long. Thus, CBOT and EURONEXT generated declines leading to final SEP23 results in both benchmark exchanges, namely 236.5 EUR SEP23 Euronext and 645 c/bu CBOT.
In this way, we say goodbye to the old crop, clearly, with the liquidation of MAY23. The European correlation occurs on the negative Premium of -8 EUR for the parity FOB Constanța, i.e., we have a basis of 8 EUR, according to the formula CASH-FUTURES = BASIS.
Russian wheat is falling, regardless of their desire to keep it at 275 USD, and we see it at 269 USD for quality 12.5 PRO FOB Novorossysk.
Let’s now do a brief recap together to see the influencing factors and their geographical distribution:
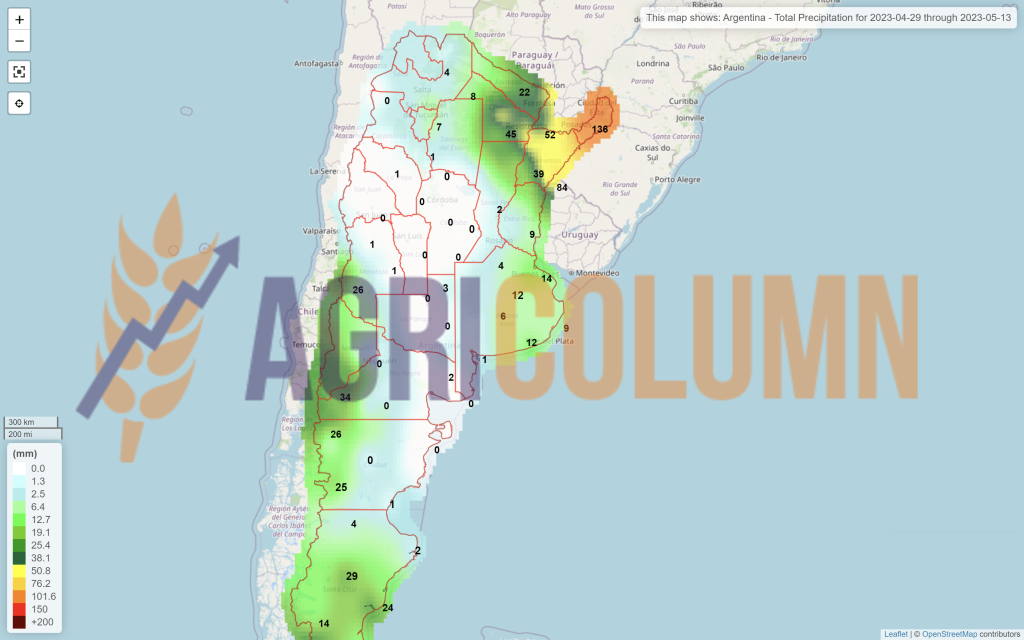
ORIGIN: Russia OK, Ukraine OK, European Union OK, USA OK, Canada OK, forecasts Brazil OK, forecasts Australia OK, forecasts Argentina average (16.5 million tons against 19.5 average, but a rebound from 12 million tons this season).
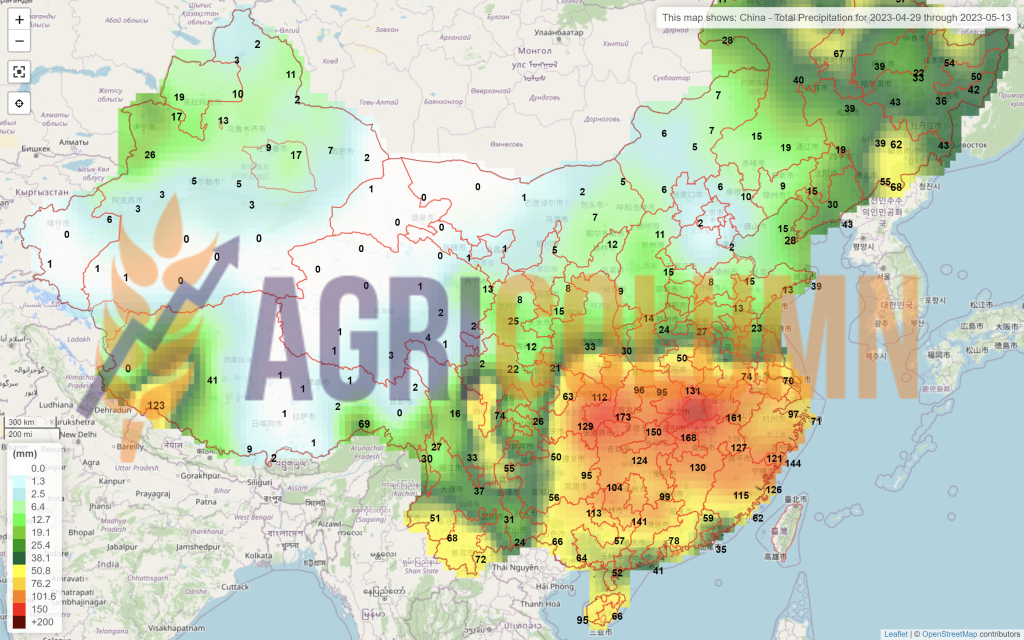
AREAS OF IMPACT: India OK, China above estimates (140 mil. versus 136 forecast), Turkey introduces a 130% tax on wheat imports to protect local farmers (sign of a good crop).
WEATHER: at the moment, it is favorable in the Origins and we estimate that until the harvest in the Northern Hemisphere, it will not be able to create any more surprises.
GEOPOLITICS: Here we will have fundamental changes. First, Russia’s actions in attempting to strangle the Grain Corridor. The latter announced that it will not extend this agreement after May 18, 2023. And, logically, we are thinking of a negotiation. One of Russia’s demands is to reconnect to the SWIFT payment system. JP Morgan received a license to process some Russian payments but the latter is not happy with this decision which does not satisfy their negotiation parameter. And we have, as we said in the previous issue, every chance to see the Corridor closed. All signs point to this outcome.
What we visualize in the next period:
- A potential spike in prices generated by the actions of Russia, which obviously wants to sell its goods as expensive as possible. This spike will be welcomed by all sellers in Origins, as profit is the goal for each of them.
- A logistical bottleneck in the Black Sea basin generated by the closure of the Corridor and the redistribution of flows through solidarity lines. And Romania will feel the biggest impact. Constanța Port will not be able to generate transit for both Romanian and Ukrainian Origins. Here we will be able to witness major problems, here we already visualize a calm before the storm. Here we are witnessing a lack of involvement at the level of the authorities, a fact that we have experienced before, reactivity by no means proactivity.

LOCAL STATUS
The feed barley price indications are at the level of 185-190 EUR/MT for the goods delivered in the CPT Constanța parity.
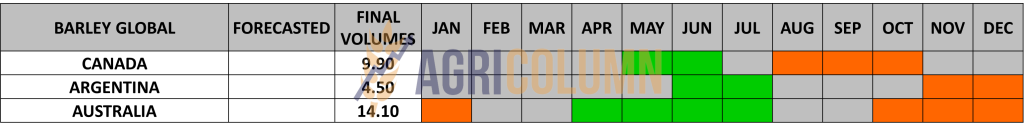
Romania will certainly generate a harvest close to 2 million tons, from an area of 400,000 hectares.
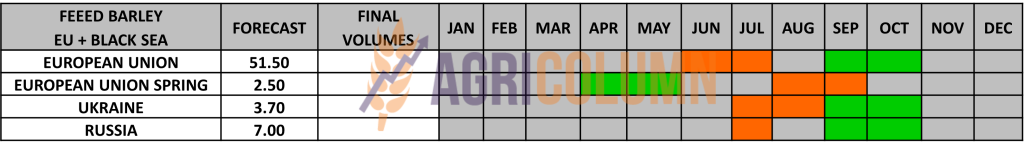
REGIONAL STATUS
The EUROPEAN UNION is secured, as we wrote in the previous issue, 54 million tons is the figure that guarantees the Union’s needs.
If we also take into account the countries that are not in this group, i.e. Great Britain, Serbia, Bosnia and Moldova, we will be able to add a volume of 7.9 million tons, lower than the previous season by 0.4 million tons.
As with wheat, when certainty replaces forecasting, we will make changes to the tables containing the crop volume figures.
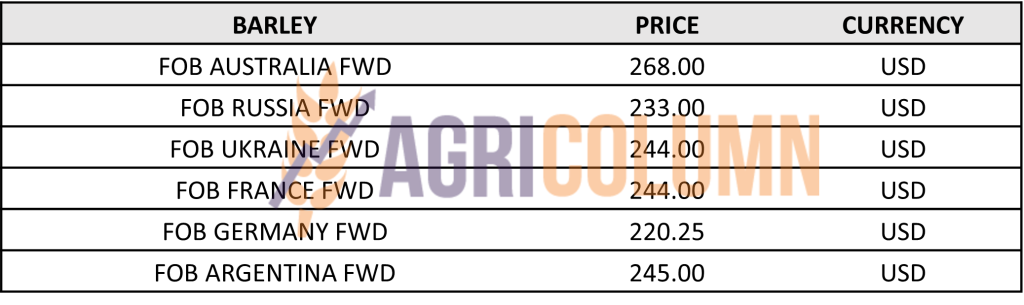
BARLEY PRICE INDICATIONS IN MAIN ORIGINS
GLOBAL STATUS
No essential changes.

LOCAL STATUS
Maize drops sharply, to the level of 215 EUR/MT in CPT Constanța parity.
The new corn crop is valued at 185 EUR/MT, exactly as we anticipated last week.
CAUSES AND EFFECTS
Clearly, what passes the Ocean returns to Europe. And what happened in the US led to today’s price in Port Constanța. It was actually the moment I predicted. I have recommended the sale of Old Crop and New Crop corn for the reasons set forth in previous issues. I say now once again, we will see corn at harvest in the field and at 150-155 EUR/MT.
REGIONAL STATUS
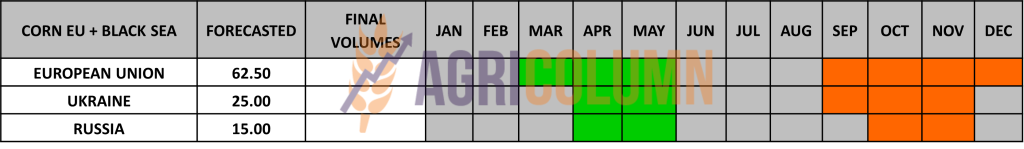
THE EUROPEAN UNION. No change in European Union law, the crop forecast is still 65 million tons. Regarding imports, the Union is positioned at the level of 22.65 million tons, with an intake of 12.5 million tons from Ukraine alone.
UKRAINE, no change in harvest forecast, about 25 million tons. The weather is helping with precipitation and soon we will be able to see seeding and emergence reports from Ukraine.
RUSSIA will generate, for its part, a volume of at least 15 million tons, with an export potential of 5 million tons.
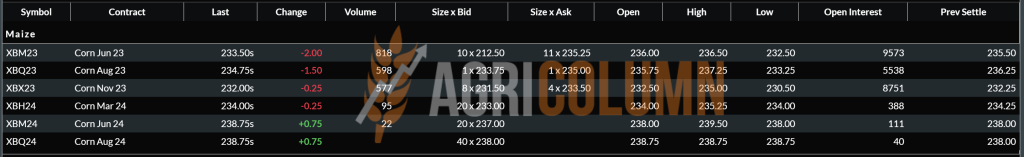
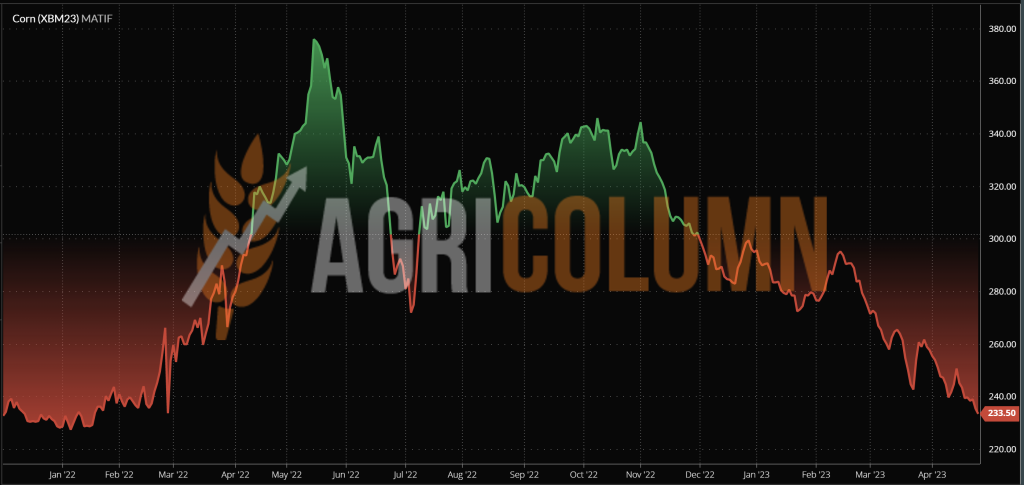
EURONEXT CORN – XBM23 JUN23 –233.5 EUR
EURONEXT CORN TREND CHART – XBM23 JUN23
GLOBAL STATUS
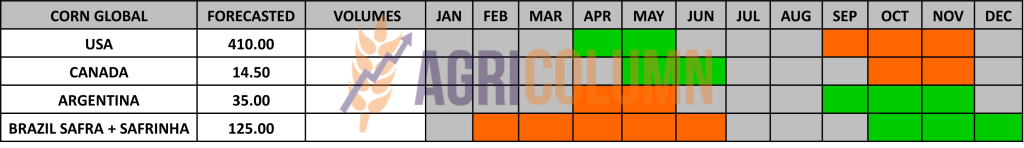
ARGENTINA – local analysis houses indicate 32.5 million tons, so another drop in volume.
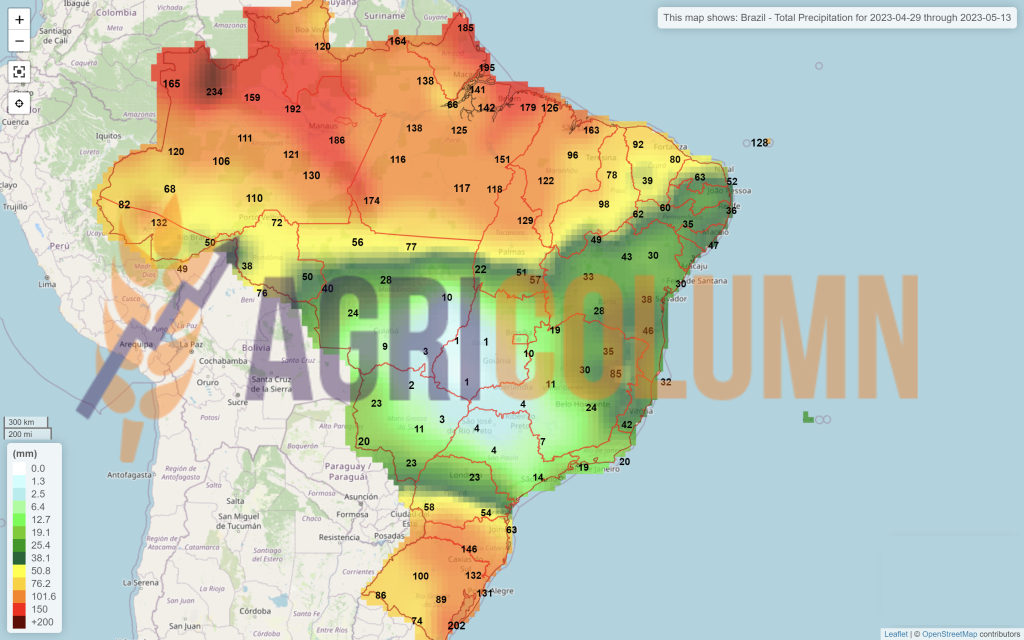
BRAZIL remains in the same forecast as in the previous report.
USA. 2023 US corn is 14% planted, compared to 7% last year and 11% average. This represents a 6% advance. Corn is 3% spring versus 2% last year and 2% average. The fastest planting progress continues to be in southern locations, with little or no corn planted in northern and northwestern areas. Missouri corn is 58% planted (18% average), Tennessee is 49% (29% average), Kentucky is 36% (23% average), Kansas is 24% (19% average), Illinois is 18% (11% average), Iowa is 10% (average of 10%), Nebraska is 10% (average of 7%), Indiana is 9% (average of 6%), and Ohio is 6% (average of 2%).
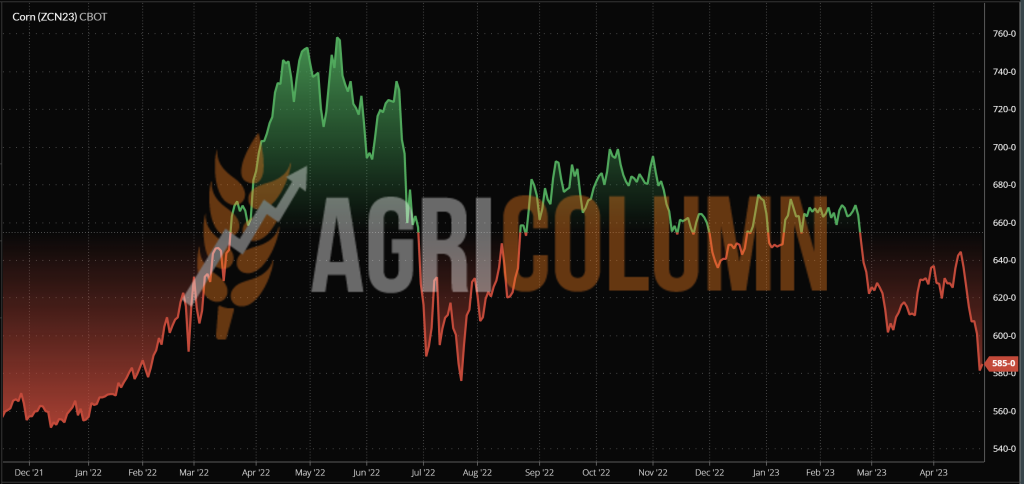
CBOT CORN ZCN23 JUN23 – 585 c/bu
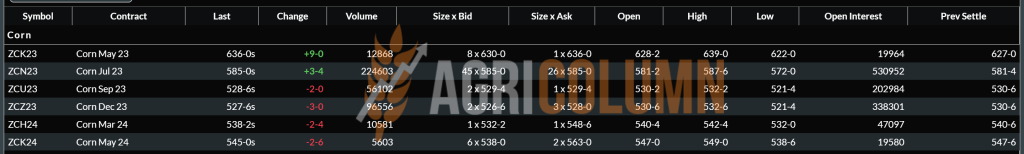
CBOT CORN TREND CHART – ZCK23 MAY23
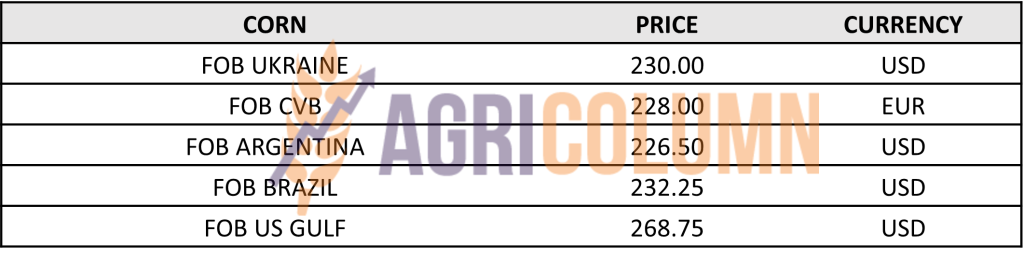
CORN PRICE INDICATIONS IN MAIN ORIGINS
CAUSES AND EFFECTS – THE STORY
Maize is fully feeling the shock of the transition by liquidating positions on MAY23 Euronext. Along with this factor comes the progress of US seeding, combined with the development process of the Brazilian corn crop.
But, apart from the two factors listed above, a third intervenes, namely the cancellation of some volumes of corn sold by the US to China, namely 570,000 tons. This prompted a simple question: Why is China pulling the brakes on purchases? Do they have enough stock or do they think the price is too high?
We believe that both reasons have sufficient arguments. In what we identify, we visualized a long time ago that China announced the curve of pork production and then no one wanted to take notice of this announcement.
Moreover, the price of corn was very high. Let’s remember how until 2 weeks ago it was positioned next to wheat and we were then estimating a decrease of 25-30 EUR/MT. And this is happening today. At the same time, let’s remember how we used to indicate the difference in CBOT between crops, Old Crop versus New Crop, and show this expressed in absolute numbers.
What’s next? A corn platform period, with the potential for a spike generated by Russia’s actions, but from June onwards, the weather will be the main marker in the price path of the new crop. Because summer is always hot and dry, and this affects the volumes.
But for the moment, as I said above, the transition is being carried out on the stock markets and the condition of crops is expected in the physical market, so we will have a stationary zone disturbed perhaps by Russia in the near future.

LOCAL STATUS
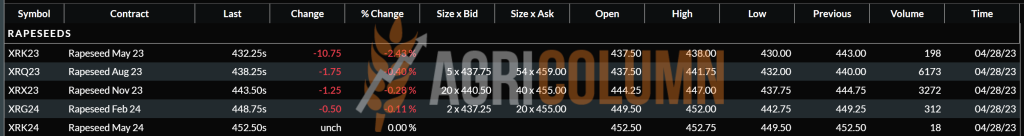
From now on we will only indicate new rapeseed crop. Thus, AUG23 minus 45 EUR/MT represents the sales benchmark in CPT Constanța parity. According to Euronext close, we have AUG23 positioned at 438 EUR, so CPT Constanța = 393 EUR/MT.
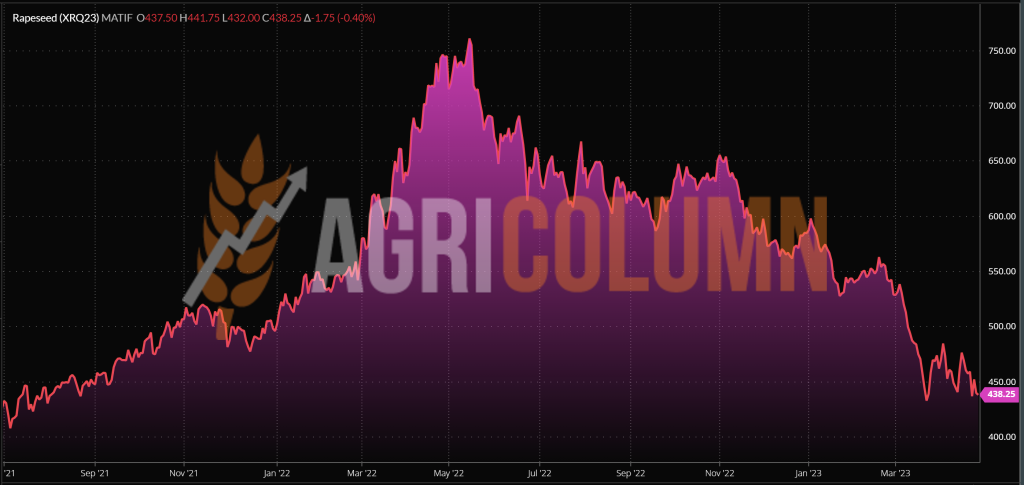
EURONEXT RAPESEED – XRQ23 AUG23 – 438.25 EUR
EURONEXT RAPESEED TREND CHART – XRQ23 AUG23
REGIONAL STATUS
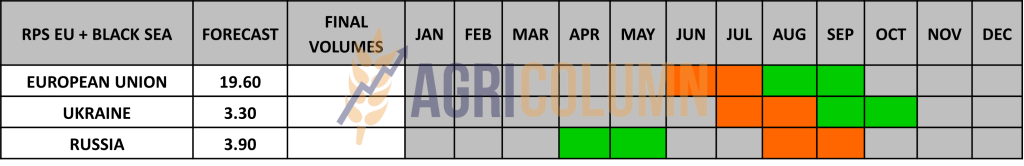
The EUROPEAN UNION remains in the same forecast status between 19.5-20.2 million tons. The Union has an impressive import volume, we could say, of 6.36 million tons mainly coming from 2 actors: Ukraine and Australia. Ukraine introduced a volume of 2.94 million tons into the Union, while Australia is at the level of 2.82 million tons.
RUSSIA forecasts 3.85 million tons as the volume of the next CROP. In line with the previous season, which places it in the Best 5 Years average.
UKRAINE is forecasting 3.45 million tons, similar to the previous season when they harvested 3.5 million tons.
GLOBAL STATUS
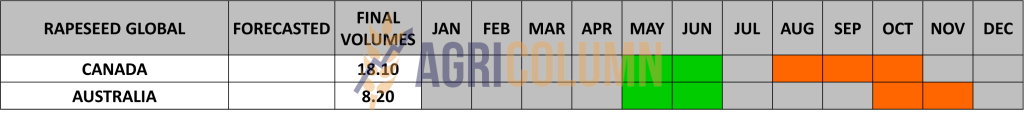
CANADA is forecasting 19.6 million tons of canola next season and rainfall in Alberta and Manitoba is encouraging at the moment.
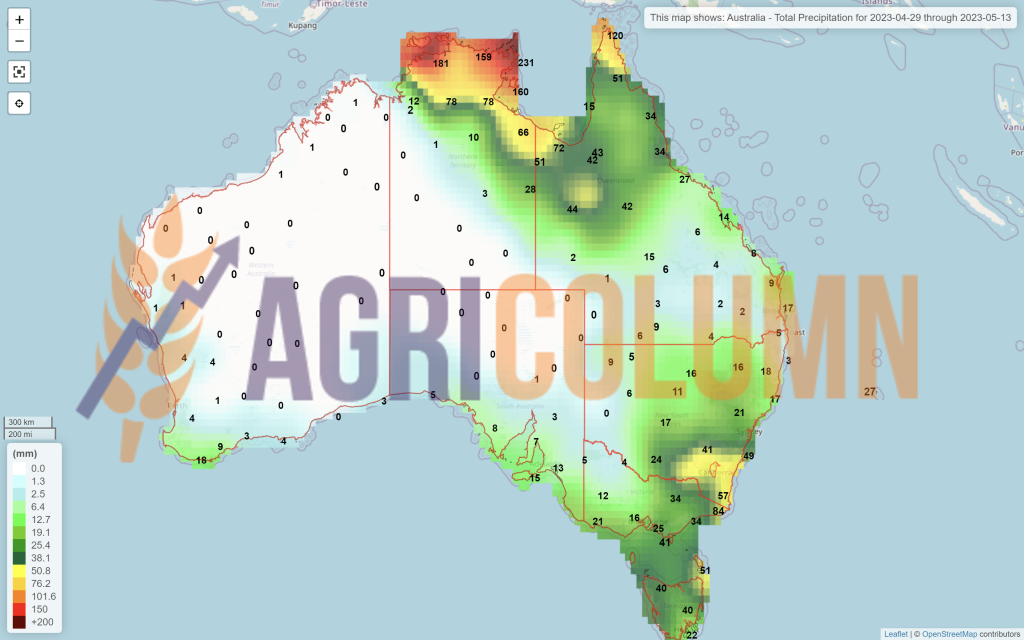
AUSTRALIA generates an average forecast of about 6.9 million tons with the mention that the effects of El Nino could generate adverse conditions, i.e. drought.
INDIA generates a forecast of 11.8 million tons. It is a high forecast compared to the average of the last 5 years, which is 9 million tons, and also above the previous season, when they harvested 11.5 million tons.
CHINA. 15 million tons is their forecast, up 0.3 million tons from the previous season. The average of the last 5 years is 13.8 million tons.
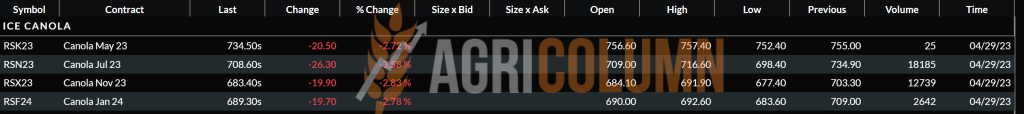
ICE CANOLA RSX23 NOV23 –683.4 CAD
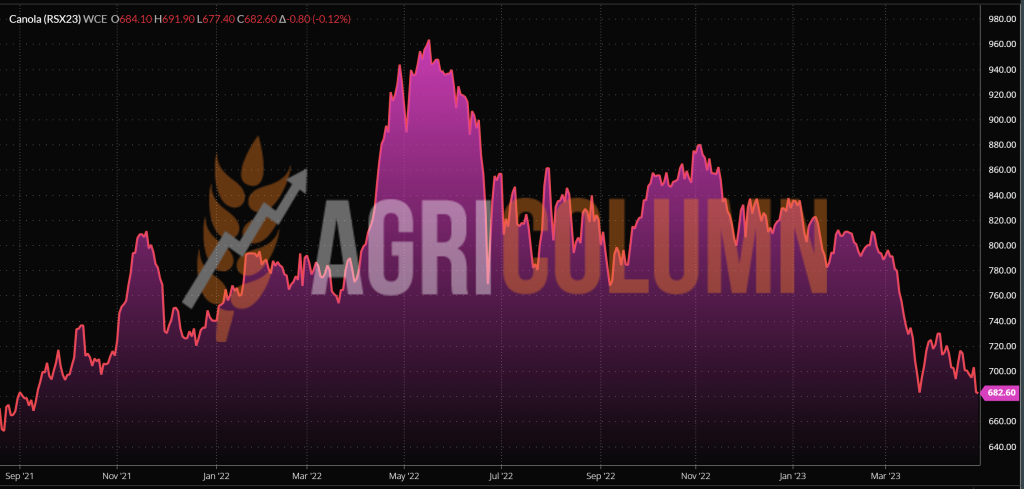
ICE CANOLA TREND CHART – RSX23 NOV23
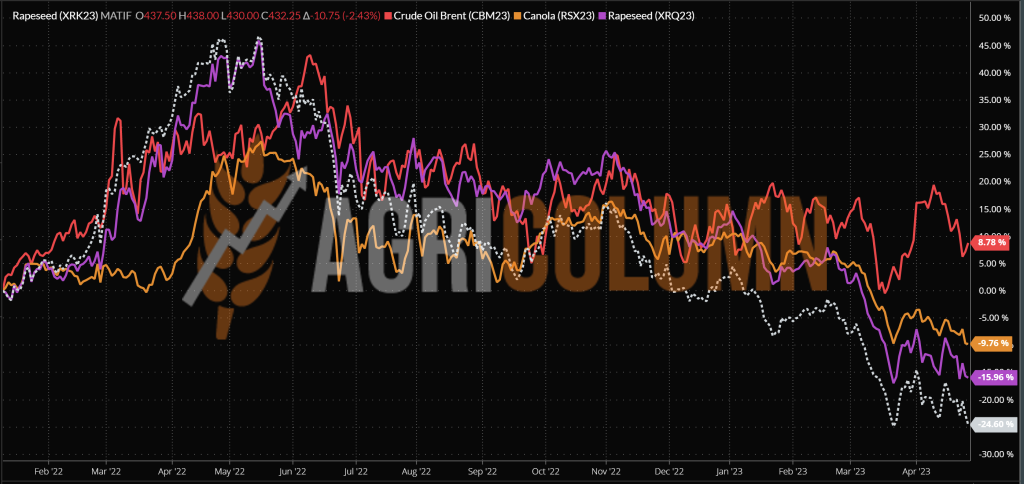
COMPARATIVE GRAPH. PETROL-RAPESEED-CANOLA CORRELATION
CAUSES AND EFFECTS – THE STORY
A mix of factors that put the European rapeseed in the carousel. Petroleum, palm oil, soy. All spiced up a week of ups and downs for rapeseed.
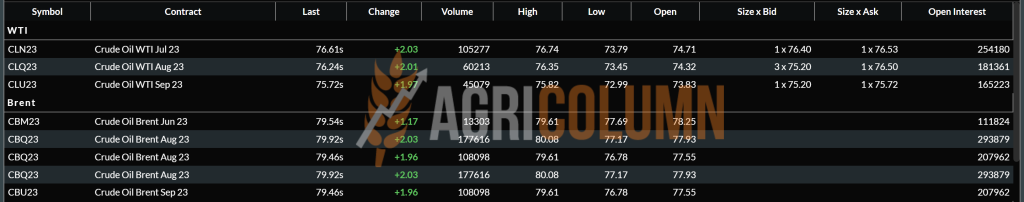
But now the fundamentals are relaxing after the liquidations in Euronext MAY23. Why do we say this? Because the last trading session brought support to rapeseed, yes support, by increasing Brent indications from 77 to 79.5 USD/barrel.
What can we expect from now on? Our assumption is that rapeseed will continue to decline. Canola is also falling and the Canadian crop inverse is much more dramatic than the European one and we are looking at JUL23 vs NOV23 with a level of minus 25 CAD i.e., 16.75 EUR.
However, the assumptions for a possible spike are in place in the next period. Geo-political conditions and their development are the essence of what is to come.

LOCAL STATUS
Port Constanța quotes sunflower seeds at 440 USD/MT.
Processors offer 425 USD/MT, DAP processing units.
CAUSES AND EFFECTS
The MAY 2023 coverage requirement is ongoing and we see a slightly more generous level in the sunflower seed price term. But this difference has a parity and exchange rate component. In other words, these extra 15-20 USD are penalized by a weaker dollar against the single European currency and a reduced local exchange rate in Romania.
If we sit to analyze an inverse crop potential, we visualize an equivalence between crops. So the values being equivalent, waiting, if financial liquidity does not require it, is an option for farmers at this time. We could see the retracement ending and implicitly a retracement to the 410 USD level.
REGIONAL STATUS
UKRAINE. It remains the same, i.e., minimum at 13 million tons, and if productivity increases, they will reach 15 million tons.
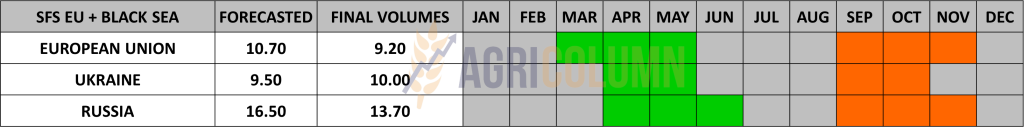
RUSSIA will generate, according to all our analysis, a crop level of 16.5 million tons of sunflower seeds and will be positioned on the average of the last 5 years.
The EUROPEAN UNION will also generate 10.5-10.8 million tons, also positioned in the average of the last 5 years.
GLOBAL STATUS
ARGENTINA is very close to the end of the sunflower seed harvest. About 3.7-3.8 million tons remains the final forecast.

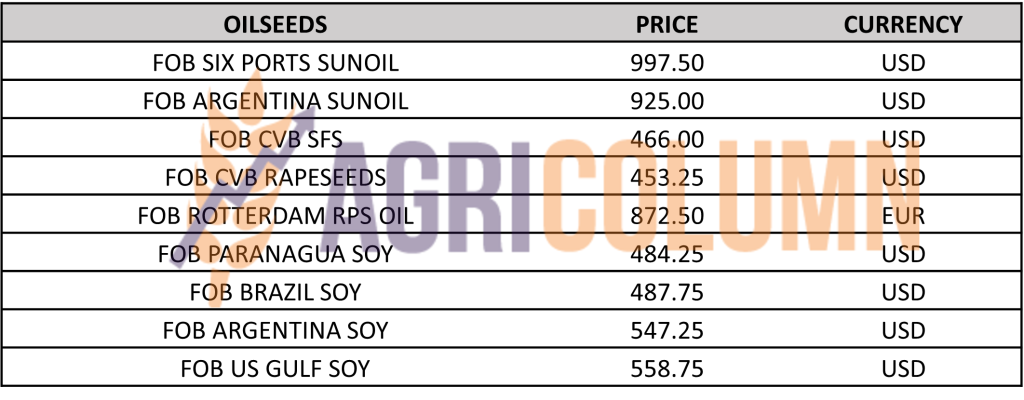
PRICE INDICATIONS FOR OILSEEDS AND CSFO IN MAIN ORIGINS
CAUSES AND EFFECTS – THE STORY
We’re holding the summary of the last report and viewing a coverage request for the month of MAY, so we’re discussing SPOT. This will naturally close and the 15-20 USD of demand will dissipate.
New crop is viewed volumetrically at 54.8 million tons and the new crop price contour is now pointing to a level of 420 USD/MT, DAP Processing Units.
Other influences that will impact the price level of seeds are still in shape and we refer to the closure of the grain corridor in Odessa. However, we have a counterbalance to this through Turkey, which at the beginning of June 2023 will introduce a 36% import tax on sunflower oil.
In conclusion, geopolitics and weather will dictate the next period, with potential growth coming from the closure of the corridor.

LOCAL STATUS
In Romania, the price indications for soybeans are at the level of 470 USD/MT, DAP processing units for non-GMO soybeans.
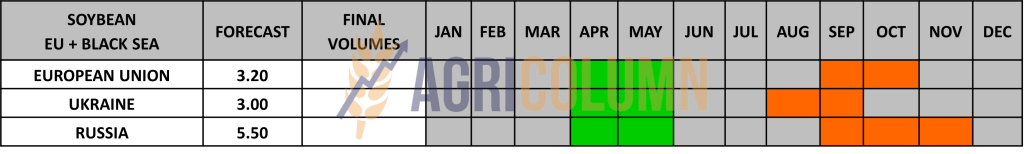
REGIONAL STATUS
THE EUROPEAN UNION. Total imports of soybeans this trading season reached 10,000,000 tons, and soybean meal reached 12.7 million tons.
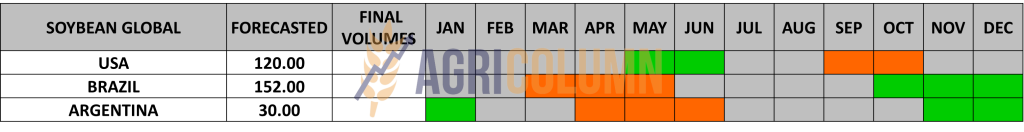
GLOBAL STATUS
ARGENTINA. It generates absolutely no change, it remains at the level of 23 million tons.
BRAZIL. It has reached 92-93% in the process of harvesting soybeans and everything is going smoothly.
USA. 2023 US soybeans are 9% planted, up from 3% last year and 4% average. This is a 5% advance on last week. The fastest soybean progress is also in southern areas, with very little planted in northern areas. Louisiana soybeans are 41% planted (25% average), Mississippi is 34% (25% average), Arkansas is 34% (15% average), Kentucky is 19% (6% average), Missouri is 16% (1% average), Tennessee is 16% (3% average), Illinois is 15% (6% average), Indiana is 8% (3% average), Ohio is 6% (2% average), Kansas is 4% (1% average), and Nebraska is 4% (2% average). Source: Dr Cordonier.
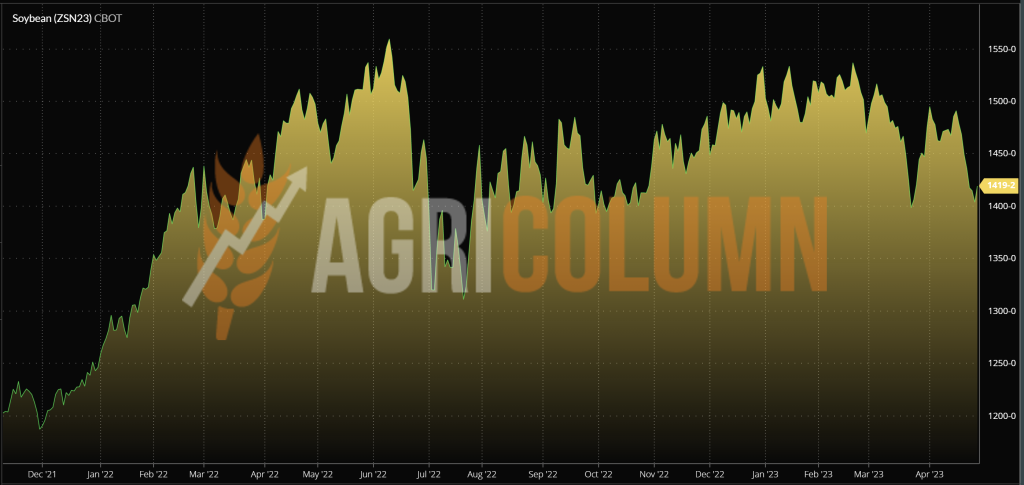
CBOT SOYBEAN ZSN23 JUL23 – 1,419 c/bu
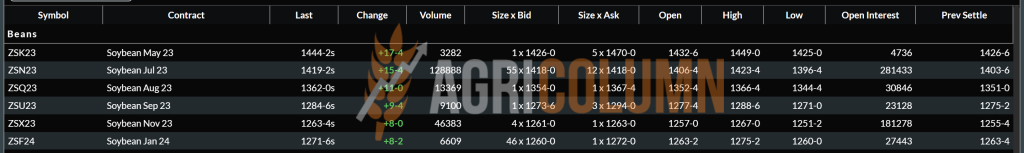
SOY GRAPHIC TREND – ZSN23 JUL23
CAUSES AND EFFECTS – THE STORY
Liquidations have obviously been the key word for the CBOT and we have seen fluctuations and swings over the past few days. Now things are heating up and normalization is gaining ground. However, we maintain the recommendations below, as they remain current.
Clear notice therefore to the sellers of new crop soybeans in Romania as well as to the buyers of soybean meal for the animal husbandry industry. The former must secure their forward price, and scrap users must not over-expose themselves by long-term buying and fixed and high price.


April 29 – May 13, 2023
Romania
Europe
Ukraine
Russia
Canada
USA
Brazil
Argentina
China
Australia