Romanian Agri Trade Summit, one of the largest events addressed to International Agribusiness, will take place on February 22, 2023 in Bucharest.
The initiative aims to reconfirm Romania’s strategic role in global agribusiness and to bring together the most important players in the dynamic grain market – top Farmers, Traders, Processors and Distributors.
This week’s market report provides information on:
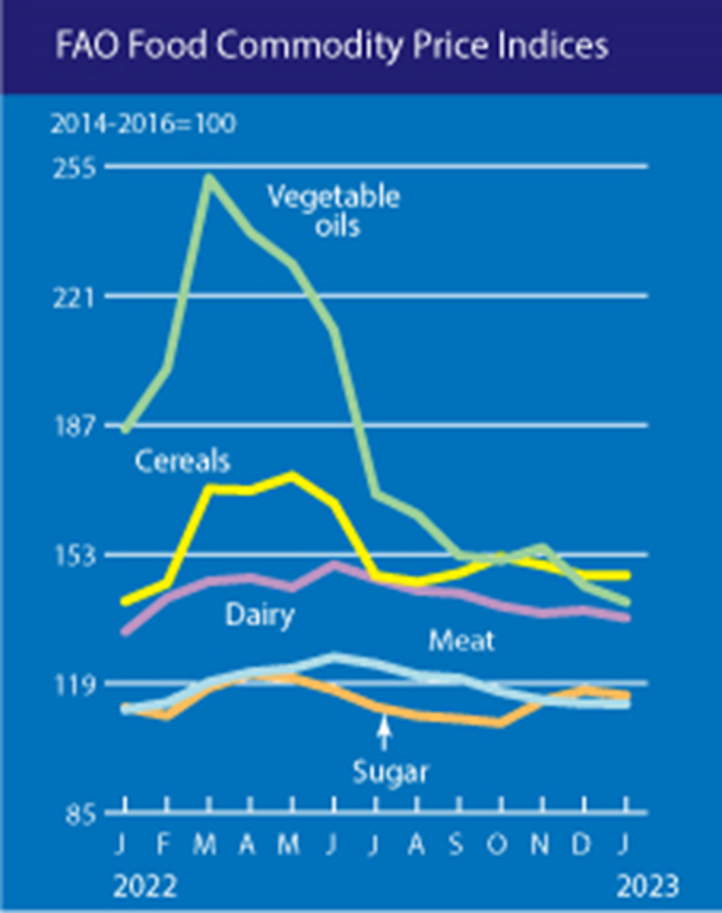
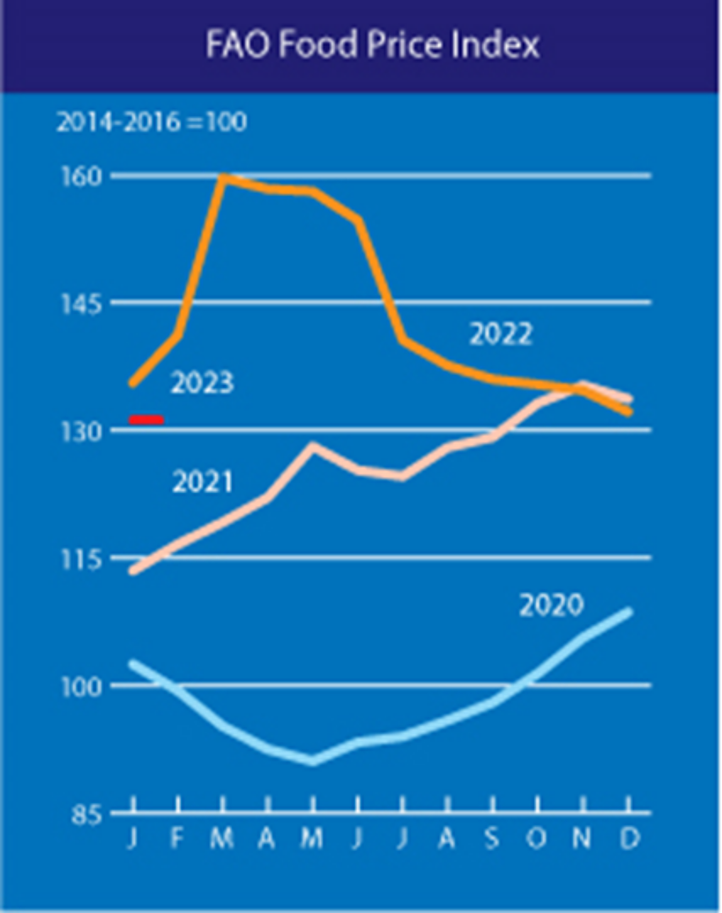
The FAO Food Price Index (FFPI) averaged 131.2 points in January 2023, down 1.1 points (0.8%) from December, marking the tenth consecutive monthly decline. With this latest decline, the index is down 28.6 points (17.9%) from its peak in March 2022. The index’s decline in January was driven by declines in the vegetable oil, dairy, and sugar price indices, while that of cereals and meat remained largely stable.
The FAO Cereal Price Index averaged 147.4 points in January, up fractionally (0.1%) from December and 6.7 points (4.8%) above its level a year ago. World prices of rice and corn rose, while those of barley and wheat fell in January. World corn prices also rose, albeit marginally (0.5%), driven mainly by strong demand for exports from Brazil and concerns over drought conditions in Argentina, offsetting a downward trend in export prices from US amid sluggish sales. World sorghum prices rose slightly (0.9%), driven mainly by strength in corn markets and lower production in the United States, the world’s top exporter, while lower barley prices (1.0%) reflected spillover effects from the world wheat market. Meanwhile, international wheat prices fell for a third straight month in January, down 2.5 percent, as global supplies rose due to higher-than-expected production in Australia and the Russian Federation.
The FAO vegetable oil price index averaged 140.4 points in January, down 4.2 points (2.9%) month-on-month and nearly 25% below the level recorded a year ago. The decline reflected lower global prices for palm, soybean, sunflower and canola oils. In January, international palm oil prices fell for a second month in a row, largely influenced by weak global import demand as major importers replenished stocks over the past few months. Global soybean oil prices also fell moderately, linked to weak import demand due to uncompetitive prices compared to other vegetable oils, as well as improved weather conditions in Argentina recently, which raised the outlook of production. In the case of sunflower and canola oils, international prices fell due to ample global export supplies.
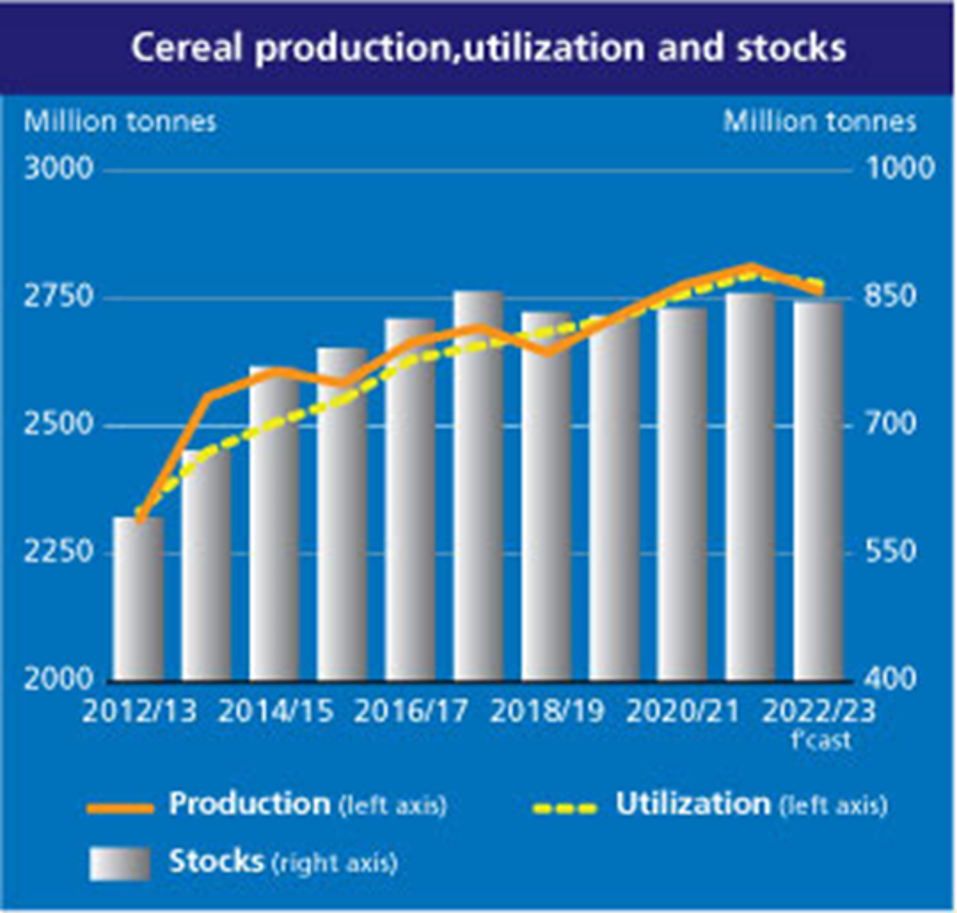
FAO’s latest forecast for world cereal production in 2022 was raised by 8.3 million tons (0.3%) this month to 2,765 million tons, although it is still 1.7% below compared to last year.
The increase is mainly related to wheat, reflecting upward revisions for Australia and the Russian Federation, which raised the forecast for world wheat production to 794 million tons and strengthened expectations for a record output in 2022.
For coarse grains, global output is set at 1459 million tons in 2022, down modestly from the previous December forecast and now 3.3% below 2021 levels.
The latest cut reflects lower corn production estimates for the European Union, the United States and the Russian Federation, which more than offset an upward revision for China. The forecast for world barley production was raised moderately, based on a recovery in crop prospects in Australia.

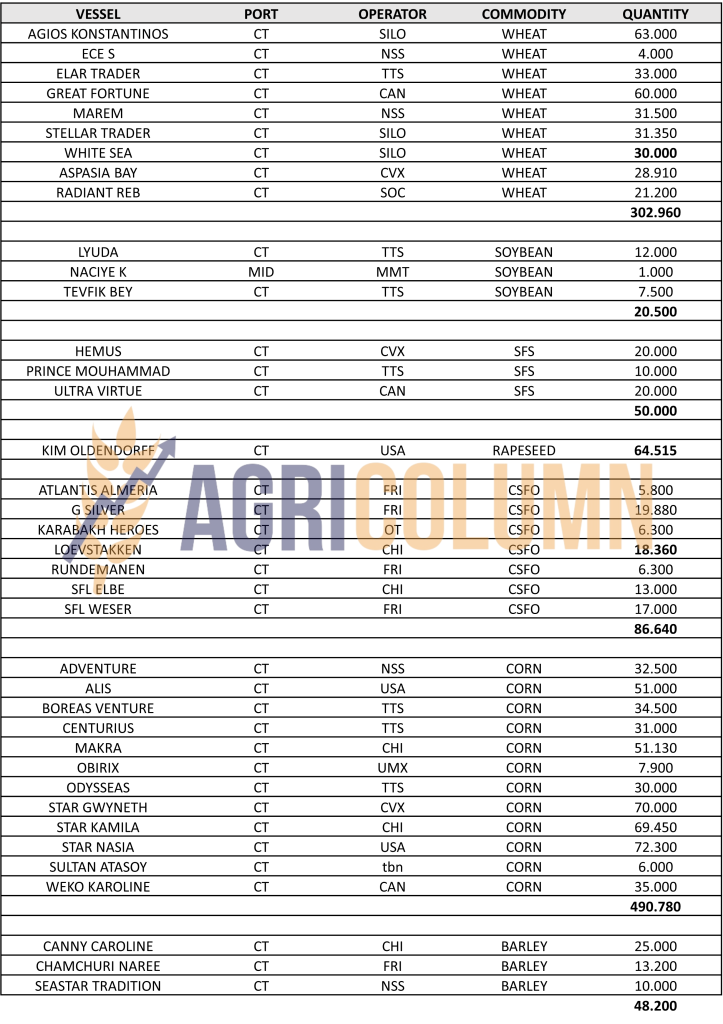
QUANTITIES IMPORTED FROM UKRAINE
TOTAL: 2,956,000 tons (wheat, corn, sunflower seeds, rapeseed, and feed barley)
WHEAT
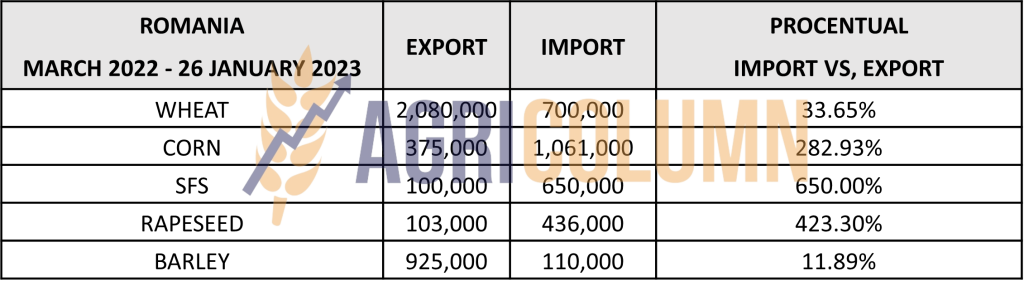
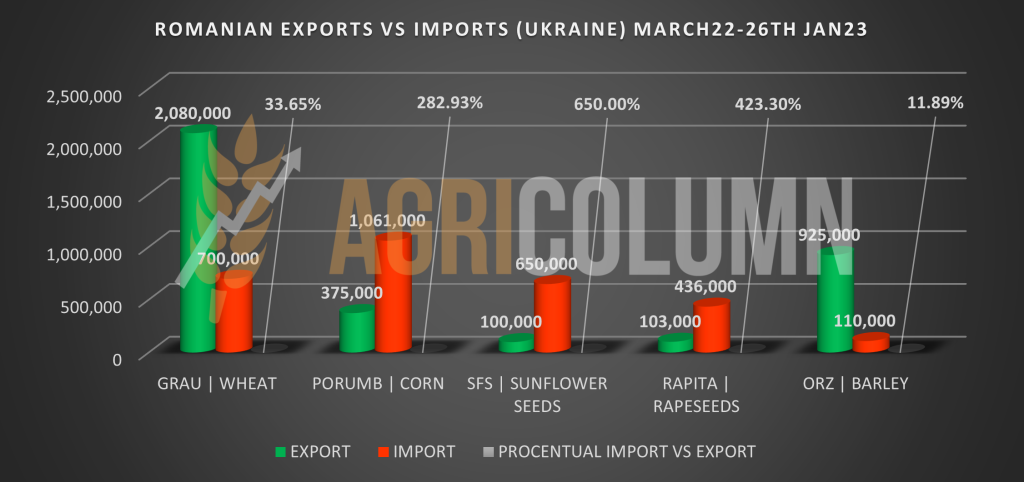
In the period March 2022 – January 2023, Romania had a wheat import level of 700,000 tons originating in Ukraine. On January 26, 2023, Romania had an export level of 2.08 million tons. Percentage wise, Romania imported from Ukraine 33.65% of what it exported. In the 2021-2022 season, Romania exported 6.37 million tons of wheat without intra-community trade.
CORN
In the period March 2022 – January 2023, Romania had an import level of Corn originating in Ukraine of 1.06 million tons. As of January 26, 2023, Romania had an export level of 375,000 tons. Percentage wise, Romania imported from Ukraine 283% of what it exported. In the 2021-2022 season, Romania exported 4.15 million tons of corn without intra-community trade.
SUNFLOWER SEEDS
In the period March 2022 – January 2023, Romania had an import level of sunflower seeds originating in Ukraine of 650,000 tons. On January 26, 2023, Romania had an export level of 103,000 tons. Percentage wise, Romania imported from Ukraine 650% of what it exported. Intra-community trade cannot be quantified, but Romania is the main producer of sunflower seeds in the European Union, with a share of 33-34% of the total EU production.
RAPESEED
In the period March 2022 – January 2023, Romania had a level of rapeseed import from Ukraine of 436,000 tons. On January 26, 2023, Romania had an export level of 100,000 tons. Percentage wise, Romania imported from Ukraine 423.3% of what it exported. Intra-community trade cannot be quantified, but Romania is quoted with an 8% share of total rapeseed production at the EU level.
BARLEY
In the period March 2022 – January 2023, Romania had an import level of feed barley originating from Ukraine of 110,000 tons. On January 26, 2023, Romania had an export level of 925,000 tons. Percentage wise, Romania imported from Ukraine 12% of what it exported. In the 2021-2022 season, Romania exported 1.69 million tons of barley, excluding intra-community trade.
QUALITY OF UKRAINIAN GOODS
CORN
Many quality problems were registered with the corn product. Ukrainian corn was harvested at 33-35% moisture in the fall of 2021 and with values above 30% in the fall of 2022. Drying costs were 55 USD/MT, so it was not subject to conditioning correctly. Ukrainian corn showed, for the most part, high levels of aflatoxin, mycotoxins, and a very high degree of broken kernels.
RAPESEED
The Ukrainian rapeseed was also an extremely unpleasant episode. A lot of genetically modified rapeseed (GMO) was imported into Romania and mixed with volumes of Romanian origin, which created significant damage. Foreign products have also been mixed into the rapeseed to increase the quantity, and we list here black seeds of other crops and iron filings. The damage is immeasurable.
SUNFLOWER SEEDS
Many lots arrived depreciated, being stocks from the previous year, which had a high level of acidity (FFA). Likewise, the lots from the current crop showed a high level of acidity, due to the rains that affected the quality at harvest.
PRICE DISCOUNTS
The discounts practiced by the traders who offered Ukrainian goods effectively decreased the Romanian market. There were very long periods when corn of Ukrainian origin was offered at 100 EUR/MT below the purchase level practiced by the Port of Constanța.
- Wheat was discounted with levels of 60-80 EUR/MT compared to the indications of the Port of Constanța.
- Ukrainian rapeseed presented discounts of 50-70 EUR/MT compared to local market and Port indications.
- Sunflower seeds were offered 50-70 USD/MT lower than the Romanian market indications.
LOGISTICS
Logistics cost levels in Romania have doubled, due to very high demand. Absolutely all resources were focused on Ukrainian goods because the commercial operators were offering very high price levels to benefit from them. Thus, the logistical shortage at the local level has become a daily certainty.
Over a road distance of 170 km (which before the conflict had a cost of 17 EUR/MT), the cost doubled to 35-36 EUR/MT. On a barge route between Corabia and Constanța Port, the initial cost was 16 EUR/MT, and with the excessive demand and concentration of barges towards Izmail, the same distance had a cost of 34 EUR/MT. The infrastructure of the railways has become unwieldy. Transport costs from Halmeu to Constanța, which used to be 23-24 EUR/MT, have reached 45-47 EUR/MT.
CONSEQUENCES
- Romanian farmers didn’t have proper access to the market. The lack of logistics and its huge costs created enormous damage to those who were able to advance the transport services. The doubling of logistics costs and their lack of availability made the price flawed from the start with a minimum of 15 EUR/MT and a maximum of 25 EUR/MT.
- Romanian farmers could not have access to the Port of Constanța, nor to the domestic processing market. The huge queues in the port area stretched along the A2 highway, the highway that connects Bucharest to Constanța. Moreover, they could not deliver to the processing units due to the influx of Ukrainian goods. A farmer cannot stay 4-5 days unloading, he must be present on the farm at harvest, having the combines in the field. Romanian farmers were forced in these circumstances to miss the peak moments of the market and implicitly not to sell. The market gap between peak times and today is at least 100 EUR/MT for wheat and maize and 250 EUR/MT for rapeseed. Sunflower was damaged for the same reasons with an average of 80 USD/MT.
- Romanian farmers did not receive the prices according to the Romanian market. The huge discounts practiced by the traders who imported from Ukraine made the prices received by the Romanian farmers to be reduced compared to what is practiced in the market, more precisely, by a minimum of 20-30 EUR/MT compared to the normalized daily indications according to EURONEXT and CBOT.
- The costs of Romanian farmers were extremely high, against the background of price increases generated by the conflict in Ukraine. Fertilizers doubled in price, crop protection products were 30-40% more expensive, and the cost of diesel fuel subsequently increased. Romanian farmers work according to European norms and respect them in everything. Farmers in Ukraine do not have European standards and have costs reduced by at least half.
- Goods from Ukraine did not have any tariff or technical barriers (sanitary-veterinary certificate was suspended). Quality no longer had any relevance in a European Union wanting a Green Deal. Let’s be consistent. There are rules for Romanian farmers, but not for Ukrainian goods?
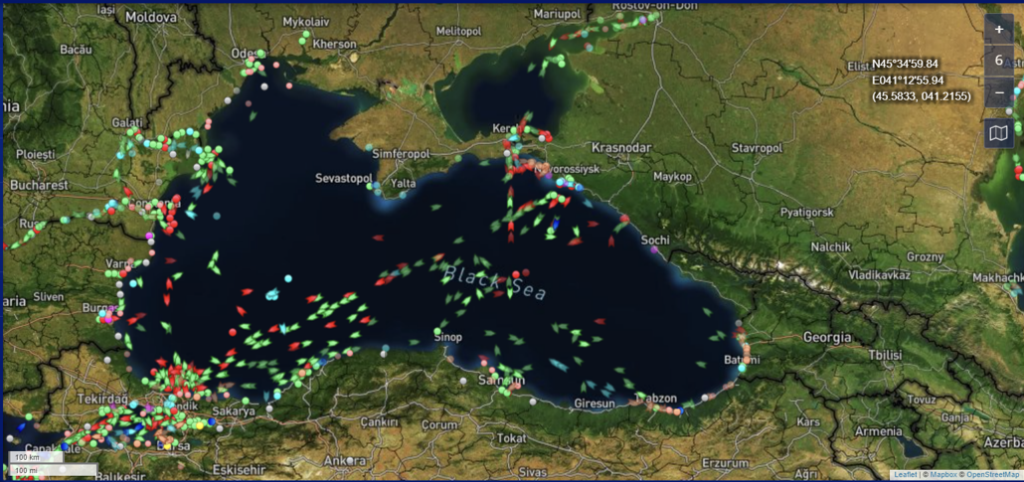
To understand the deformation of the quality system, from Istanbul, after the inspection, 203,000 tons of corn, 47,200 tons of crude sunflower oil, 13,200 tons of rapeseed and 9,000 tons of wheat were returned and unloaded in Constanța. In total, 273,000 tons of goods. The image below, dated January 26, 2023 with the congestion in Sulina and Constanța versus the few ships in Odessa – Pivnyi – Chornomorsk, is telling. Source: marinetraffic.com
MINIMUM SOLUTIONS
- Compensation granted to ROMANIAN FARMERS, as a percentage of the above estimates. Mechanisms and Procedures for operationalizing their distribution.
- REINTRODUCTION OF THE OBLIGATION OF THE VETERINARY SANITARY CERTIFICATE AT THE BORDER.
- Supervision of flows through segregation. If the indication is TRANSIT, the final destination should be indicated in the documents and then the copy of the document should be submitted to the competent authorities. A performance bond is required.

LOCAL STATUS
The indications of the Port of Constanța are still stable, at the level of 275 EUR/MT in CPT parity. The reflection in the domestic market is generated at approximately the same level. The feed wheat discount is also static, between EUR 17-20/MT.
The sales level of the new harvest remains static, at 242-245 EUR/MT in CPT Constanța parity.
CAUSES AND EFFECTS
The same situation as a week ago governs the Romanian market. The price level of the old crop is not encouraging for the farmers, and no one has any openness to sell the goods from warehouses. But time passes and is merciless. By its flow, it clearly warrants the forecasts I have been making for many months. The market is governed by supply and demand, and at this point, equilibrium does not exist. In other words, there is no competition, with Russian goods being the only ones making significant sales. All the Romanian offer is waiting and the only parameter to which it is linked is the intensification of the Russian invasion in Ukraine. Something that does not please anyone in terms of destructive potential and loss of human life, but which could, by its intensification, block trade in the Black Sea basin. The corridor expires on March 19, 2023, and all parties involved want to extend it. But the ultimate parameter remains clear, namely: the wheat is in Russia, by no means in Ukraine. In other words, if there is to be a jump generated by the war factor, it will not last long. Neither combatant will be able to sustain a long-term ground assault with troops beyond the end of February zone. “Rasputita” will come into its own with the arrival of spring in Ukraine, and both combatants know this.
Ukraine continues to impact Romanian agribusiness in all forms. In the period March 2022 – January 2023, Romania had a wheat import level of 700,000 tons originating in Ukraine. On January 26, 2023, Romania had an export level of 2.08 million tons. Percentage wise, Romania imported from Ukraine 33.65% of what it exported. In the 2021-2022 season, Romania exported 6.37 million tons of wheat, excluding intra-community trade.
Ukrainian wheat is traded in IZMAIL/RENI in CPT parity at the level of EUR 211/MT.
REGIONAL STATUS
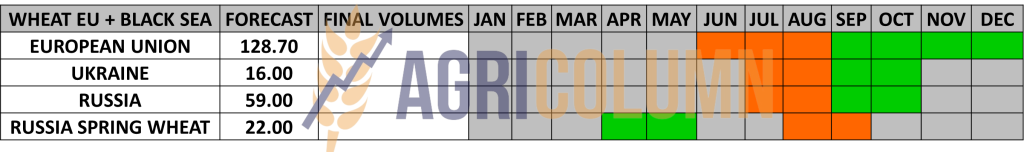
RUSSIA sells, sells, and sells again. The last sale in Egypt is a volume one, 535,000 tons, at a price absolutely incomparable to the rest of the competition. They know that they have an enormous amount of wheat in the country. About 22.6 million tons are still in farm stocks and mathematical forecasts lead to a 2022 crop ending stock of 15 million tons. The new Russian crop is positioned at a much lower level, at only 82-84 million tons. And the stock they hold will not take them out of their current position, that of a net seller with no price claims.
UKRAINE is still valued at 16 million tons of new crop, but there is a behind-the-scenes fight going on, politically. Because the term expires in May. At that time, Ukraine’s facility to export duty-free and without sanitary-veterinary certification to the European Union is expiring. And those politically involved are now generating an extremely aggressive lobby for the extension of this facility.
The EUROPEAN UNION approached the figure of 19 million tons of common wheat export for this season. More precisely, the EU is at the level of 18.8 million tons. If we add the other components, durum wheat, the equivalent in tons of wheat flour export, we reach a total level of 19.7 million tons of export in the 2022-2023 season. European Union imports are quoted at the level of 5 million tons of common wheat. Adding durum wheat and flour, we reach the value of 5.7 million tons.

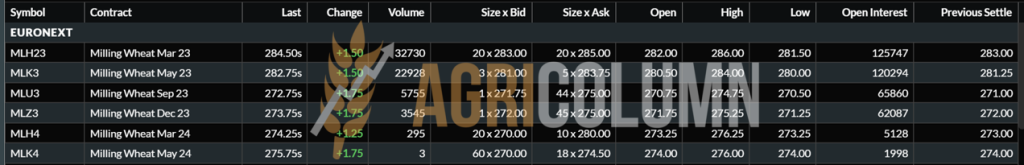
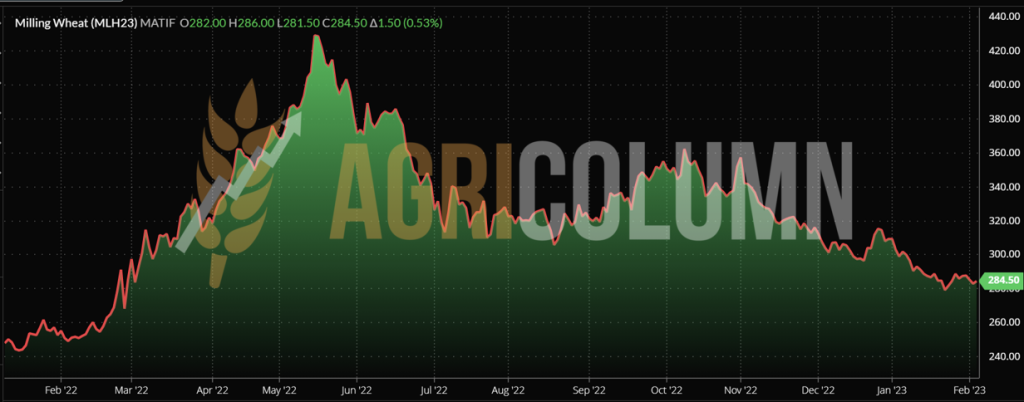
EURONEXT – MLH23 MAR23 –284.5 EUR
EURONEXT WHEAT TREND CHART – MLH23 MAR23
GLOBAL STATUS
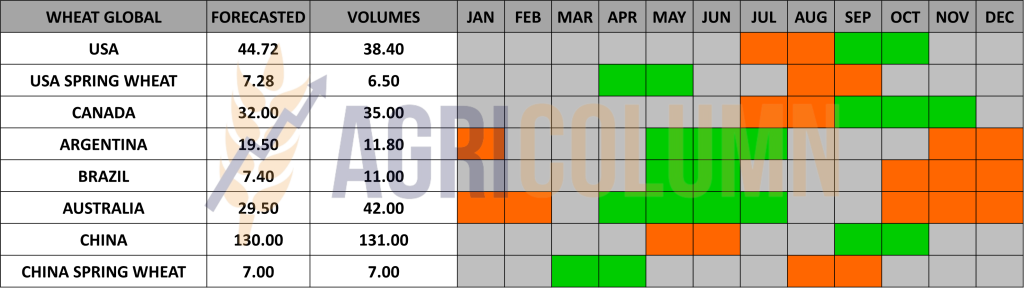
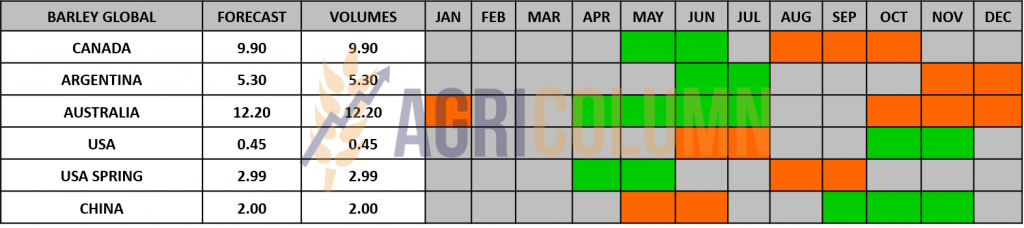
USA is starting to indicate new crop volumes close to the figure of 50-52 million tons. The potential will be generated by US spring wheat and the revival of winter wheat and are clearly signaled by North American analysts.
CANADA will start seeding in early May 2023, so there is still plenty of time. But the fallen precipitation positions it favorably. Saskatchewan 45%, Alberta 32%, Manitoba 15%, and Ontario 6% are the areas that will produce Canadian spring wheat.
ARGENTINA is out of season.
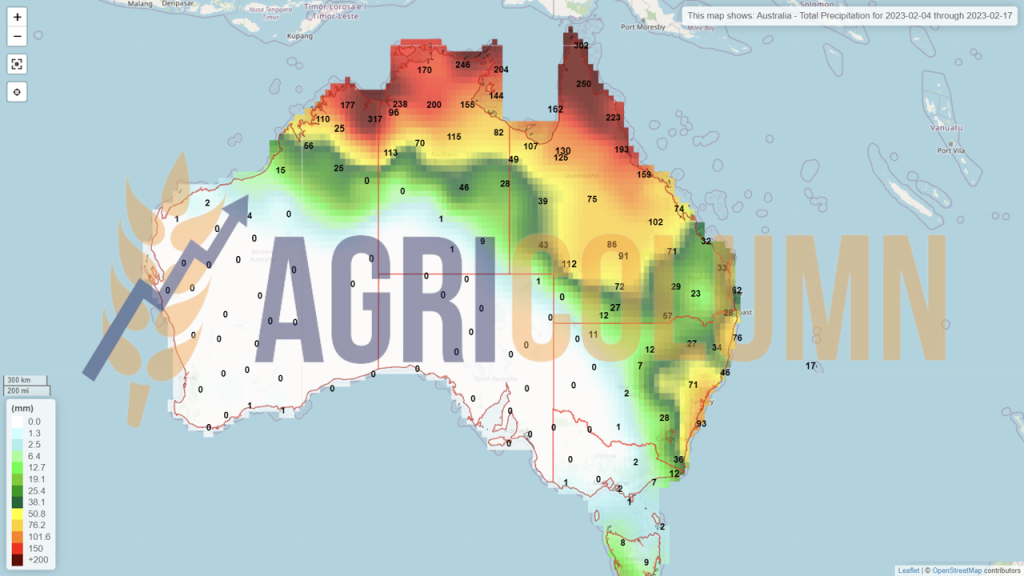
AUSTRALIA is still under rainfall, but figures will be continuously updated as time goes on to 41-42 million tons.
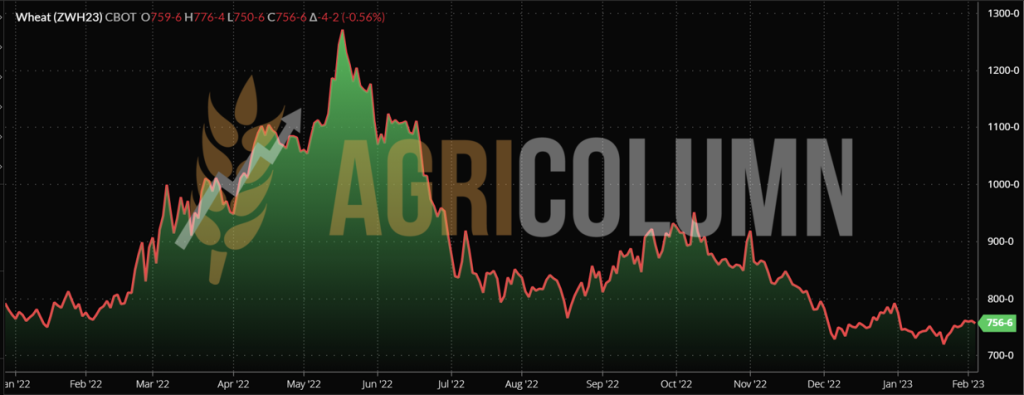
CBOT WHEAT – ZWH23 MAR23 – 750 c/ bu
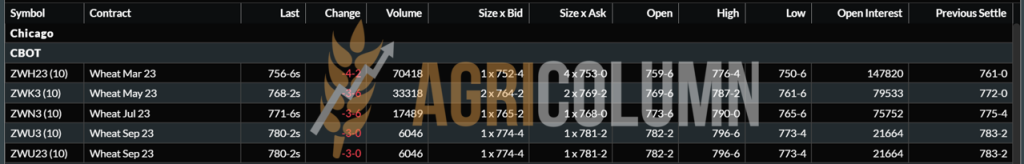
CBOT WHEAT TREND CHART – ZWH23 MAR23
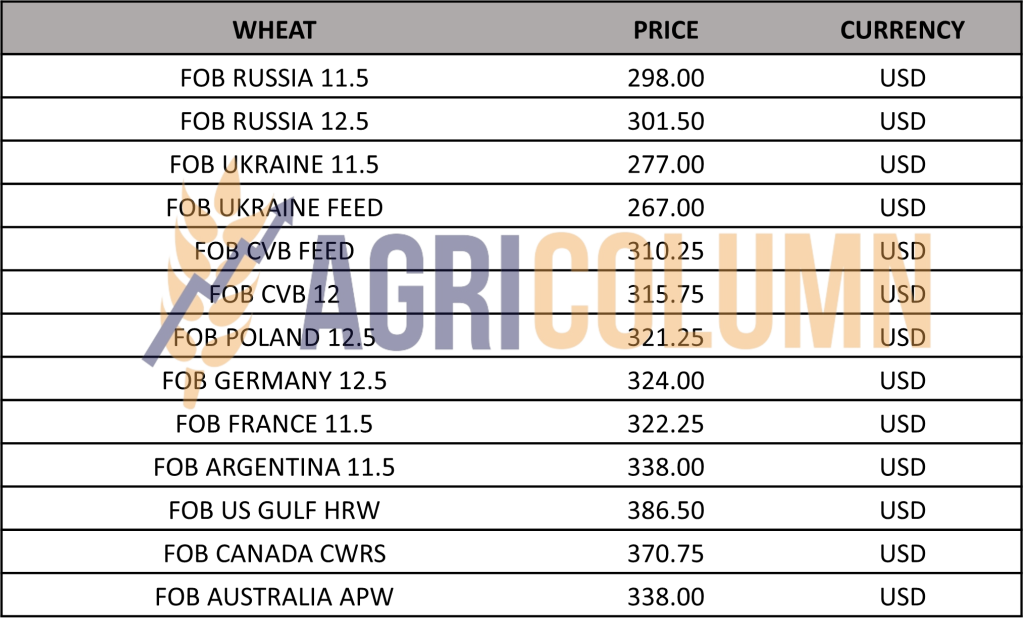
WHEAT PRICE INDICATIONS IN MAIN ORIGINS
TENDERS AND TRANSACTIONS
MIT Jordan purchased 60,000 tons of wheat at the price of 336.5 USD/MT from Anderson, with delivery June 15-30, in CFR Aqaba parity. This is new crop wheat, and knowing the behavior of the trader at Anderson, we are inclined to believe that they will ask for an extension to be able to generate new crop volume at the shipment. This will normally incur an additional cost, but the calculations are carefully made. In conclusion, we have the first new crop sale, and we have a Market Marker on the price of new crop wheat.
GASC EGYPT bought 535,000 tons of Russian wheat and more than half of this quantity is supplied by Grain Flowers. The price averaged 323.58 USD/MT, CFR, for wheat to be delivered between February 26 and March 20. Grain Flower, a GTCS-aligned company, sold a total of 360,000 tons. Aston also sold two lots of 60,000 tons at 324.45 USD/MT and Sierentz secured 55,000 tons at 325.8 USD/MT.
CAUSES AND EFFECTS
The US FEDERAL RESERVE raised interest rates by 0.25% to 4.75%.
The BANK OF ENGLAND raised the interest rate by 0.5%.
The EUROPEAN CENTRAL BANK increased the interest rate by 0.5%.
In March, the interest rate will rise again by another 0.5%
The fight against inflation does not stop but takes on new dimensions. Inflation measured at the level of the euro area was 9.2% in December 2022, and in January 2023, it decreased to 8.5%.
The price of fertilizers is falling, and we are at a 12 month low today. The price of gas also fell to the lowest level in the last 5 years.
- These two markers impact the market of agricultural commodities through the lower input in the establishment cost per hectare. Adding the values of genetics that must also decrease in cost due to the decrease in energy, we have an extremely important marker on the route.
The cost of transportation has also dropped to minimal levels. Russian oil effectively roams where it pleases and meets demand at very low levels. This generates in the chain transport price reductions. Russia – dark fleet, ships without transponders. The shadow fleet, which transports Russian crude oil, numbers 600 vessels: 400 crude oil vessels and 200 refined product vessels. These are the components of this flow. And let us not be surprised that after February 5 we will buy refined products in India from Russian sources.
The oil traders are Russian. The oil tankers are owned by the Russians. The insurance for these ships is Russian. Oil financing is Russian.
OPEC+ will “stand still” and be in “quiet mode” in terms of its production policy, meaning the current agreement will remain in place until the end of 2023 (as previously agreed by the group).
Novak (Russia’s Deputy Prime Minister) says oil prices are “acceptable” and oil markets are “stable”. He also noted that Russia’s exports and production are stable despite the sanctions.
And oil demand is expected to increase due to the improving COVID situation in China.
THE NEW CROP
- RUSSIA: 82 million tons + 15 million tons old crop
- EU-27 + UK: 145 million tons (including durrum)
- USA: 50-52 million tons
- CANADA: 33 million tons
- AUSTRALIA: 42 million tons.
The numbers say it all about the new crop.
The marker for the Romanian market is set by the sale by Anderson in Destination Jordan of the new crop at the level of 257-260 EUR/MT in the CPT Constanța parity. Romania will remain with a minimum of 2 million unsold tons from the 2022 crop, Bulgaria with 1 million tons, Serbia with 1 million tons.
Only the expansion of the conflict on the ground will give a boost to the price of wheat, but it will be short and intense. But then, seeing the aggregated factors (volume of goods, energy price, fertilizer price, old stocks), there is only one indicator: The only way is down, back to where we come from.

LOCAL STATUS
The price indications of feed barley in the CPT Constanța parity have gained a certain consistency. We see levels of 245-248 EUR/MT, so demand is starting to be felt at this level.
CAUSES AND EFFECTS
Barley also sets its market marker by selling to the Jordan destination of the Ameropa Group a volume of 50,000 tons, parity CFR Aqaba, with delivery June 16-30, 2023.
The price of this transaction is 302.3 USD/MT. This level clearly marks our indication for the new crop, as we said. And according to our calculations, this is 227-228 EUR/MT at CPT Constanța parity.
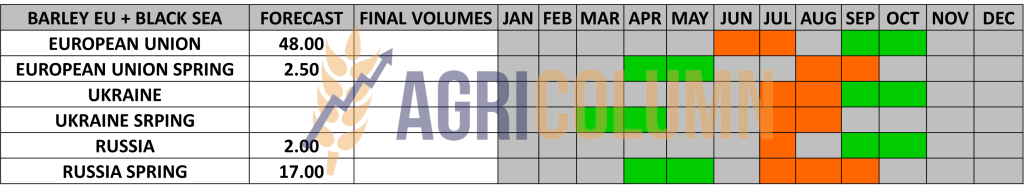
BARLEY PRICE INDICATIONS IN MAIN ORIGINS

GLOBAL STATUS

LOCAL STATUS
Corn indications in the port of Constanța are at the level of 260-265 EUR/MT. Here the interest of each exporter dictates.
CAUSES AND EFFECTS
Corn is on the same level and showing stability. The difference to wheat is only 10 EUR/MT and we are not discounting the working hypothesis that prices could become equal. Let’s remember 2020 and that’s enough. But even at this moment, Romania is suffering from the impact created by the Ukrainian flow of goods.
In the period March 2022 – January 2023, Romania had a level of corn import from Ukraine of 1.06 million tons. On January 26, 2023, Romania had an export level of 375,000 tons. Percentage wise, Romania imported from Ukraine 283% of what it exported.
In the 2021-2022 season, Romania exported 4.15 million tons of corn without intra-community trade.
Prices, as they are today, still indicate a severe impact on Romanian goods.
Ukrainian corn is offered at the level of 225 EUR/MT FOB IZMAIL/RENI, and the price in CPT IZMAIL/RENI is 188 EUR/MT.
REGIONAL STATUS
UKRAINE remains in the same perspective that we have known, which is to cross the border in significant volumes, in any direction, just to sell corn. Maize exports during the week reached 990,000 tons, bringing the total of maize exported since July 1 to 15.68 million tons. In the week to February 3, China was again the main destination for Ukrainian corn (321,087 tons).
RUSSIA does not register any essential changes. The area sown with maize in 2023 is planned to be 2,953 million hectares compared to 2022 compared to 2,841 million hectares (+3.3%). The 2022 corn crop is quoted at 11.8 million tons, up from 15.2 million tons.
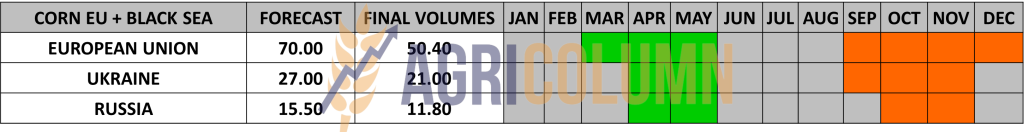
The EUROPEAN UNION reached the level of 16.5 million tons of imported corn.
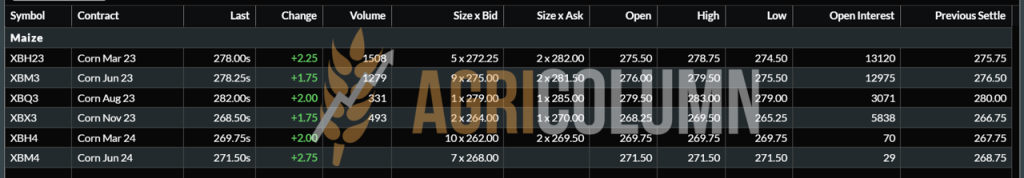
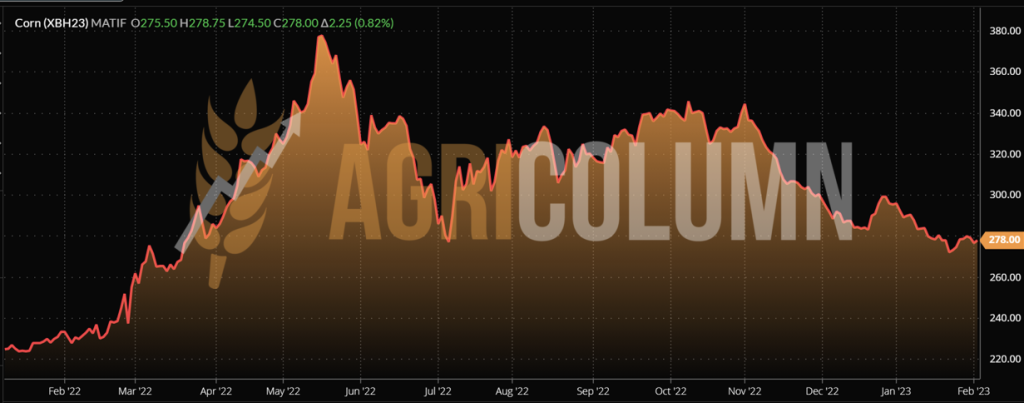
EURONEXT CORN – XBH23 MAR23 –278 EUR
EURONEXT CORN TREND CHART – XBH23 MAR23
GLOBAL STATUS
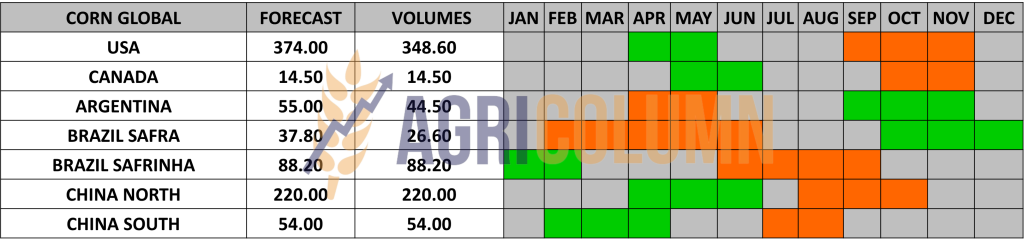
ARGENTINA. Corn sowing reached 96.5% of the projected area of 7.1 million ha. Rainfall in January benefited sowing operations, but water shortages continue to affect the east of the country, generating a drop in yield expectations that may impact production prospects. Corn rated good to excellent increased to 22%, while acreage rated good decreased to 46%. Therefore, areas in poor condition now represent 32% of the crop. Moisture is considered favorable in 56% of the area, while 44% of the area remains dry.
BRAZIL. Brazilian sorghum is further down from the forecast. Let’s not consider this a drama, because Safrinha can recover. The initial forecast was 28 million tons, then dropped to 26.4 million tons. Currently, Mercado Brazil puts forward the figure of 23.7 million tons. According to the USDA attachment, the two crops, Safra and Safrinha, will produce 125.5 million tons, but the journey is long. Each year, Brazil has tinted high volumes, but along the way, degradation has been a fellow traveler of forecasted volumes. Safra clearly has a deficit of 4.2 million tons. Rain continues and in many areas the soybean harvest and seeding following the corn harvest is not completed.
But meat processors in Brazil are concerned about local corn supplies amid heavy exports to China. The lack of railroads connecting the grain regions with the industrial areas that support pork and chicken production in the south is a major disadvantage.
USA. The US beef cow herd was estimated at 28.9 million head, down 3.6 percent from last year as the drought caused a major increase in the forage base. The reality is likely to cause some negative effects on corn, with fewer animals to feed and help bring prices down to a more manageable level.
CHINA. China’s 2022-2023 corn production is on trend to 277.2 million tons, up 1.7% or 4.6 million from last year, and feed mills have started to use more corn amid higher wheat and sorghum prices, according to a global agricultural information network report from the U.S. Department of Agriculture’s Foreign Agricultural Service (FAS).
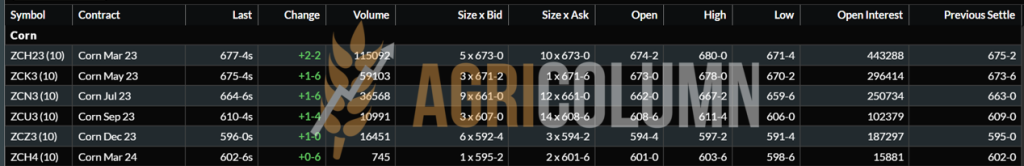
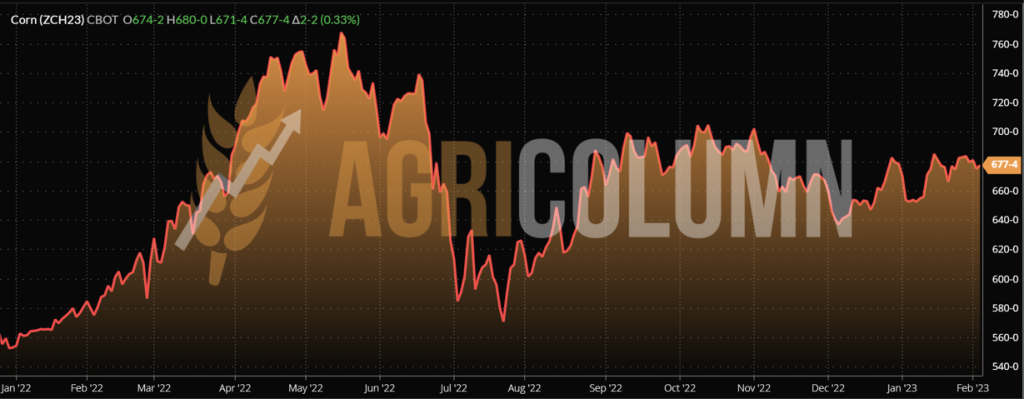
CBOT CORN ZCH23 MAR23 – 677 c/ bu
CBOT CORN TREND CHART – ZCH23 MAR23
CORN PRICE INDICATIONS IN MAIN ORIGINS

CAUSES AND EFFECTS
Corn is holding the stability we forecast. Its course is shaped by supply versus demand. As I said, China is entering the market, even if it benefits from a crop surplus of 4.7 million tons, we must remember the switch, i.e. the return to corn in feed. Let’s remember 2020 when they switched to feed wheat and sorghum because of the high price of corn.
Ukraine continues to play but is clearly penalized. And we hear voices claiming that Romanian corn is expensive. And we would ask what is it compared with? With goods from the Corridor? Maybe, but, apart from the quality advantage of Romanian corn, there is something else. Romanian ships do not have to wait for inspection in Istanbul for 10-30 days, but they pass without any stop and without any control.
At an average of 25,000 USD/day waiting cost and taking 30 days waiting time, we have a minimum cost of 12 USD/MT added to the price of goods from Ukraine.
A big player and at the same time of size is South America. It’s the arbiter that will drive the price of corn in the next period. The validation of the Brazilian volume and the development of the Argentine crop are the basic parameters in the period ahead. China, through demand, will expand the price of corn, or at least support it. However, let’s not forget that the market driver is wheat…unfortunately.

LOCAL STATUS
Rapeseed quotations in the port of Constanța are at the level of MAY23 minus 20-25 EUR/MT. This indication calculates a level of 520-525 EUR/MT. At the processing level, the quotations are MAIY3 minus 30 EUR/MT, i.e., a level of 515 EUR/MT. The new rapeseed crop indication is around AUG23 minus 30 EUR/MT, so an indication of 515 EUR/MT, DAP Processor.
CAUSES AND EFFECTS
Apart from a timid rise in the rapeseed indication on Euronext, there are no other premises at the moment. Everything is static, as we know, since the state of vegetation is favorable in Romania at the moment, and therefore there are no factors stimulating the price.
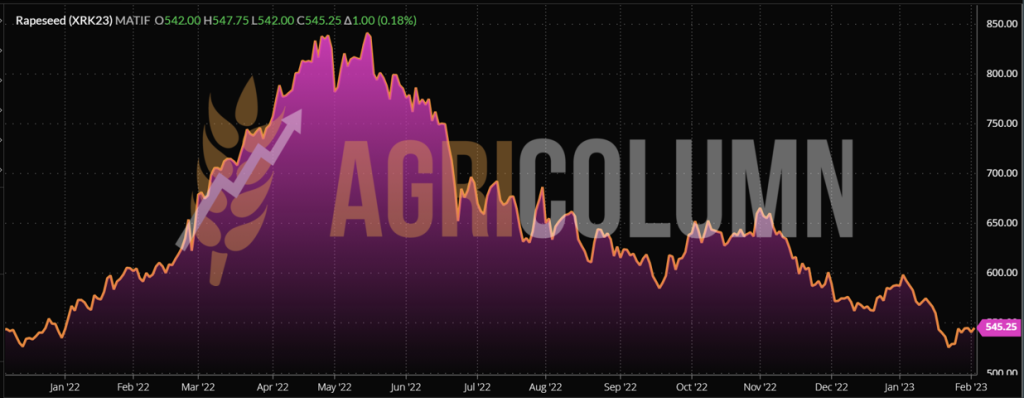
EURONEXT RAPESEED – XRK23 MAY23 –545.25 EUR
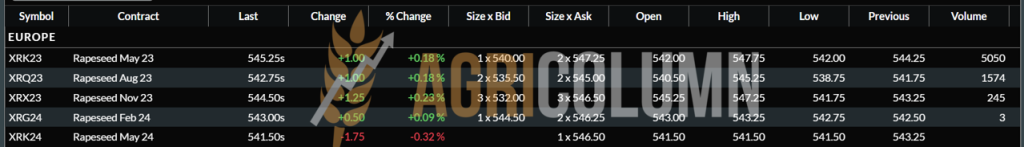
EURONEXT RAPESEED TREND CHART – XRK23 MAY23
REGIONAL STATUS
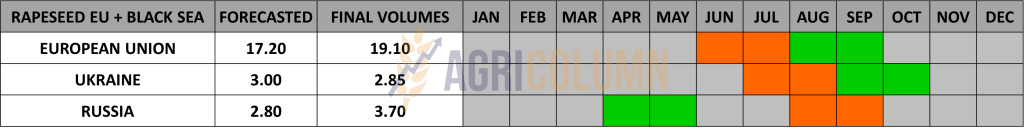
No change from last week in the European outlook, nor in Ukraine and Russia for rapeseed. The state of vegetation is in the same normal regime for this period. The coverage request is executed at a normal rate, referring to the processing units.
GLOBAL STATUS
CANADA, off season
AUSTRALIA, off season.

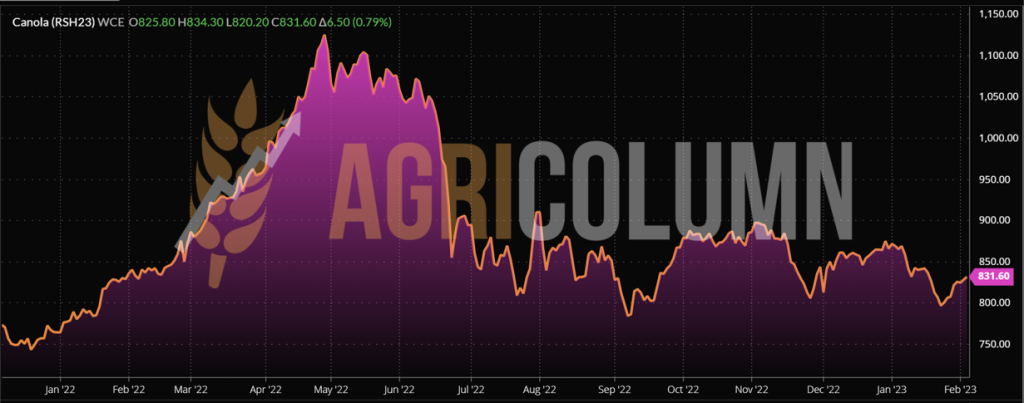
ICE CANOLA RSH23 MAR23 – 831.6 CAD
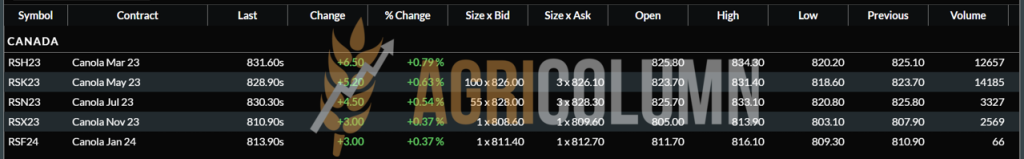
ICE CANOLA TREND GRAPH – RSH23 MAR23
COMPARATIVE GRAPH. PETROL-RAPESEED-CANOLA CORRELATION
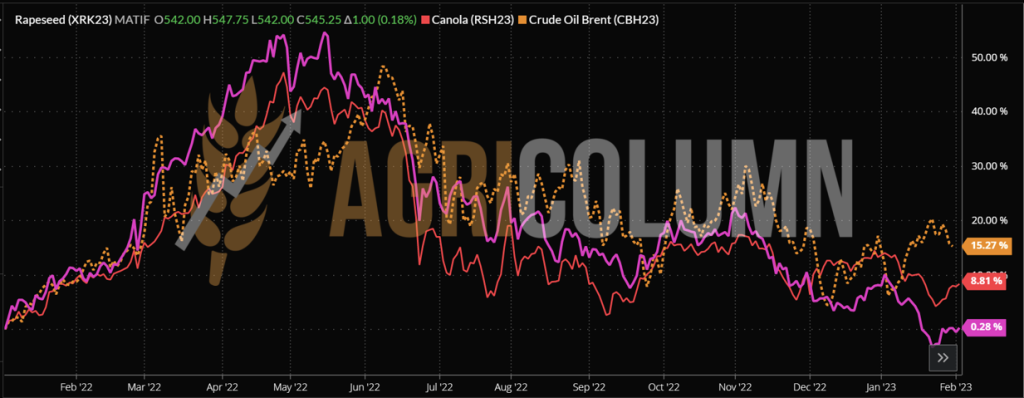
CAUSES AND EFFECTS
Euronext indications have become more meaningful. An increase of 9 EUR/MT in the condition where oil prices fell is still a 1% recovery from last week. The price of rapeseed oil remained somewhat stable at 1,057.5 EUR/MT FOB Rotterdam.
Conditionality over palm (Malaysian stocks rose 1.8% month-on-month amid export declines 16% month-on-month) and soybean oil is proving the main element, along with demand for biofuel and oil quotes.
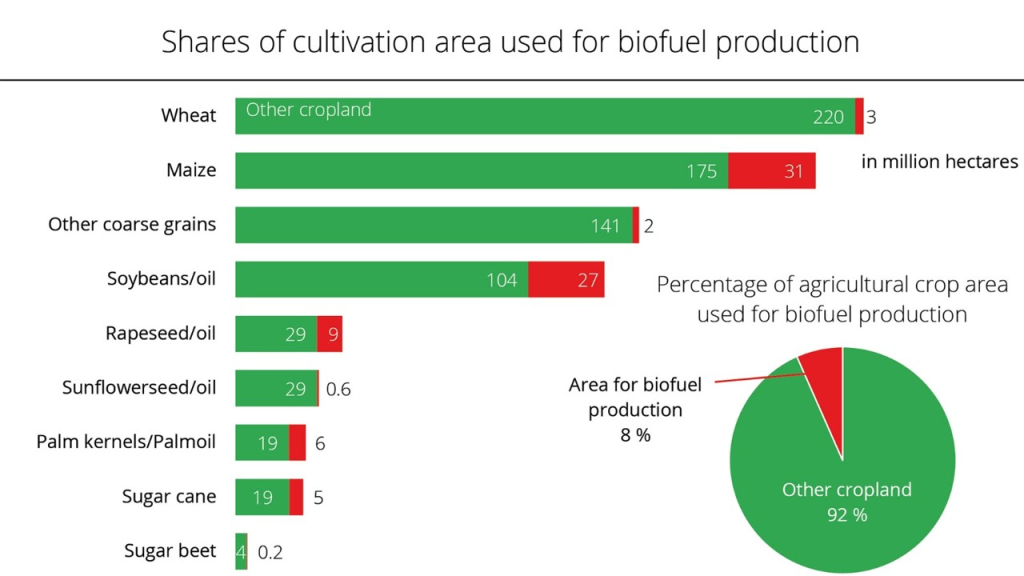
Of a total of 1.4 billion hectares of land used for crops globally in 2021, only about 8% of the area was used to provide feedstock for biofuel production, reported the Union for the Promotion of Oil and Protein Crops (UFOP) from Germany.
Most crops grown were used directly or indirectly, through animal feed, for human consumption, according to the Jan. 25 report. Biofuel feedstock production has been concentrated in regions with structural supply surpluses, the report says, and this has been reflected in high blending mandates compared to the European Union, for example in Indonesia (35% biodiesel) or the US (15% bioethanol).
“The main reasons are the stabilization of the market and the prices of agricultural producers, as well as the contribution to ensuring the supply of energy. If there were no biofuels to serve as a supply buffer, the pressure on the prices of raw materials would increase,” said UFOP. “Given that rapeseed has a share of 60% of feed proteins, only 40% of the cultivated area should be allocated to the production of biofuels,” said UFOP. “From the association’s point of view, this would be a fair and equitable approach, as the missing protein volumes would have to be compensated by imports which would require additional land use.”
UFOP stated that this compensatory effect was “deliberately neglected in all so-called indirect land use studies (ILUC) and related discussions”.
The organization said it highlighted this fact in light of the initiative recently announced by Germany’s federal environment minister, Steffi Lemke, to phase out biofuel production from cultivated biomass starting in 2030.
“It is incomprehensible that the German Minister of Agriculture, Özdemir, supports this initiative and does not take into account the interdependencies that have long been known to everyone. After all, the domestic and European production of rapeseed to make fuel for transport ensures, also the supply of non-genetically modified rapeseed protein for milk production,” said UFOP.
Lemke’s initiative also creates precedents that call into question the point and necessity of developing and discussing with farmers a National Biomass Strategy (SNBIS).
The above, aggregated, can constitute a basis of support in negotiations and discussions for the positioning of rapeseed in the future and the intrinsic value it generates, industrial, food and feed through the pellets produced. Unfortunately, Germany is wrong for the second time in a row, the first time in May 2022, and now they are doing it again without any coherent motivation.
Here’s what the share of the rapeseed crop in biofuel versus corn and wheat actually looks like. The picture shows us that everything is nothing but politics without sound thinking.
Rapeseed has a 9% share compared to soybeans, which has 27% and corn 31%:

LOCAL STATUS
Port Constanța remains in the 555 USD/MT area for sunflower seeds for now. HIGH OLEIC sunflower seeds are quoted at a base level of 565-570 USD/MT.
Processors are correlating and indicating a trading basis of 545-550 USD/MT at DAP Processing Units parity. Bulgaria, as is normal, imposes a higher trend, 570-575 USD/MT of cargo delivered to the processing units.
CAUSES AND EFFECTS
We have a threshold of 5-10 USD/MT that sunflower seeds have crossed in a positive way. But further, the market is curved by the influx of Ukrainian goods associated with the low demand for the time being from the European Union. The weak dollar doesn’t help much currently either. The moment that everyone is waiting for is an unpleasant one, namely the escalation of the conflict in Ukraine. It’s a moment that could send the price of seeds sky high. And unfortunately for the potential loss of life, that moment seems inevitable and will happen in late February 2023.
REGIONAL STATUS
UKRAINE remains in the same landscape of poor crude oil exports, intermittent processing and markets that once belonged to Russia are now within reach.
RUSSIA maintains zero duty on crude oil exports and registers new sales in Turkey, their traditional partner. The flower scrap, on the other hand, is taxed on export.
The EU is very slowly shaping its demand, fueled by the glut produced by cheap Ukrainian goods.
GLOBAL STATUS
ARGENTINA reports a record – domestic processing of sunflower seeds, which in 2022 reached the level of 3.38 million tons, 77,000 tons more than in 2019. This means a lower volume of seeds intended for export and, implicitly, more crude, or refined oil for the domestic or export market.

PRICE INDICATIONS FOR OILSEEDS AND CSFO IN MAIN ORIGINS

CAUSES AND EFFECTS
The impact of sunflower seeds from Ukraine is extraordinarily high. It affected and continues to affect Romanian seed prices. With a local production of 2.2 million tons and an import approaching 700,000 tons, the imbalance is obvious.
Romanian production had and has absolutely no protection.
Obviously, escalating the conflict through incursions of Russian ground troops will generate a direct price in the stratosphere. Everything will change at that time and all signs point to that time in late February – early March 2023.
What we also need to understand is that the 2023 crop forecasts lead to a larger area allocated to sunflower cultivation in the European Union and, implicitly, to a higher production of at least 1.75 million tons. We will return to this topic.

LOCAL STATUS
In Romania, the price indications for soybeans are at the level of USD 530/MT DAP processing units for non-GMO soybeans, with delivery after February 1, 2023. Between July 1 and January 29, 2023, approximately 149,000 tons were imported of soybeans and 246,000 tons of soybean meal.
REGIONAL STATUS
The EUROPEAN UNION. Weekly soybean imports to EU countries were 153,557 tons, up 2.5% from last week. Total soybean imports increased to 6.24 million tons, but this is 19.92% less than the same period last year.
As of July 1, 2022, the top EU soybean importers are: the Netherlands (1.79 million tons), Spain (1.65 million tons), Germany (1.12 million tons), Italy (467,732 tons) and Portugal (420,598 tons).
Soybean meal imports into the EU in the last reporting week (January 22-29) were 216,726 tons. Thus, total imports reached 9.19 million tons, which means a decrease of 4.33% compared to last year.
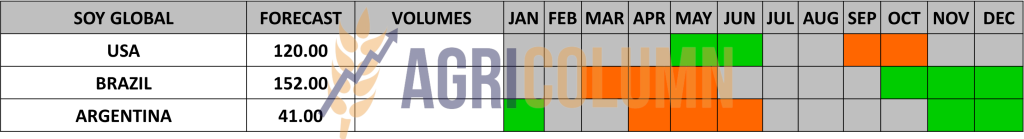
GLOBAL STATUS
USA. Weekly U.S. soybean export inspections were reported at the same level as last week at 1.8 million tons, near the top of market expectations of 1.6 to 1.9 million tons, according to data from the Department American Department of Agriculture (USDA). The main destination was again China, with 1.4 million tons. Other relevant destinations were Taiwan (102,761 tons), Indonesia (93,818 tons), Japan (90,063 tons), Germany (68,000 tons) and Mexico (43,309 tons). Total inspections since the start of the 2022/23 marketing year have reached 35.9 million tons.
USDA’s weekly 2022/2023 soybean net sales data shows a level of 736,000 tons in the week ended January 26, 36% below last week’s figure.
As for 2023/2024, net soybean sales of 192,000 tons were reported (132,000 tons to unknown destinations and 60,000 to China).
BRAZIL. Brazil’s 2022/2023 soybean harvest reached 5.2% of the 43.4 million hectare area, according to the Conab agency. Last year, 11.6% of the area was harvested during the same period, but this year, they are behind due to the rains that prevent field work. In Mato Grosso, 16.3% of the area is harvested, but although the pace is accelerating, last year they were at 31.7% of the area at this time.
Brazilian farmers have so far harvested about 8 million tons of soybeans, compared with nearly 13 million tons last year, when there was a crop loss, but work in the field has been much more dynamic.
Local consultancy Datagro cut its forecast for Brazil’s 2022/2023 soybean crop to 152.08 million tons. The area planned to be sown is maintained at 43.9 million hectares, over last year’s 42.1 million hectares. This is the 16th consecutive year of increase in soybean acreage in Brazil.
ARGENTINA. In Argentina, the rains of the last period have allowed the recovery of soybeans from the second harvest, in the context in which the sowing is coming to an end, according to the report of the Grain Exchange of Buenos Aires (BAGE).
Soybean crops rated good to excellent increased to 12%, while 42% of acreage was rated satisfactory, and acreage rated poor decreased to 46% of the total. Areas considered dry have dropped to 53%, and areas considered optimal and adequate are now at 47%. It is estimated that Argentina will harvest 41 million tons of soybeans on 16.2 million hectares.
Argentine farmers’ sales of new-crop soybeans fell 85.9 percent in the past week to 38,000 tons, according to the country’s Agriculture Ministry. This brought total sales of the 2022/2023 crop to 3 million tons, while at the same time last year sales totaled 6.3 million tons.
The US Department of Agriculture (USDA) cut Argentina’s 2022/2023 soybean crop estimate by 9.5 million tons to 36 million tons. A massive crop loss in Argentina would reduce exports of soybeans and soybean products during the marketing year, with negative knock-on effects for the country’s foreign exchange reserves, and in this case, the government may again consider dollar-soy program to support inflows of US dollars.
CHINA. Soybean volumes processed fell significantly over the New Year holiday period – just 30,000 tons of soybeans processed during the week, according to data from the National Grains and Oil Information Center (CNGOIC). Before the holiday, volumes processed were flat over the past two months at around 2 million tons per week. As the holidays pass, processing rates are expected to slowly return to previous levels.
The New Year holiday also halted sales, and soybean stocks at processing plants rose slightly. As of January 31, CNGOIC reported stocks of 4.26 million tons, up 0.7% from 4.23 million tons a week ago.
Soybean meal stocks rose slightly to 530,000 tons on January 27, up 10% from the previous week. Feed demand is expected to be weak after the festive period and this could lead to an increase in stock levels.
Soybean oil stocks also rose slightly last week to 730,000 tons as of January 31, up 2.8% from 710,000 tons two weeks ago. However, the soybean oil trade has recovered after the holiday period and is seeing much more activity this week.
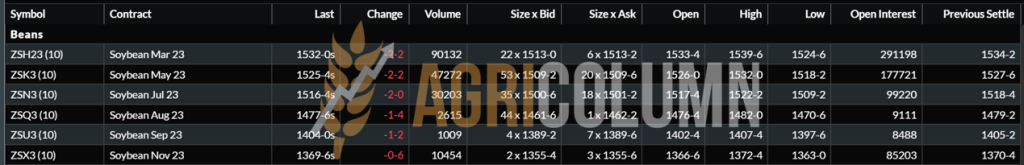
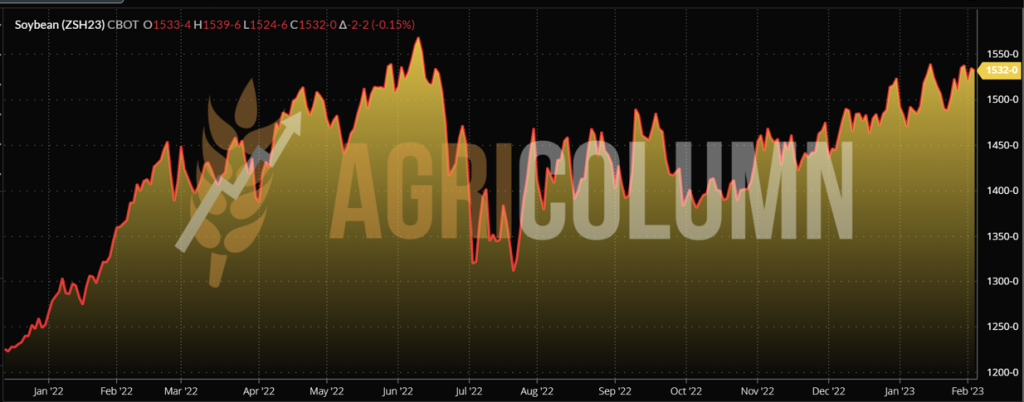
CBOT SOYBEAN ZSH23 MAR23 – 1,532 c/ bu
SOYBEAN TREND GRAPHIC– ZSH23 MAR23


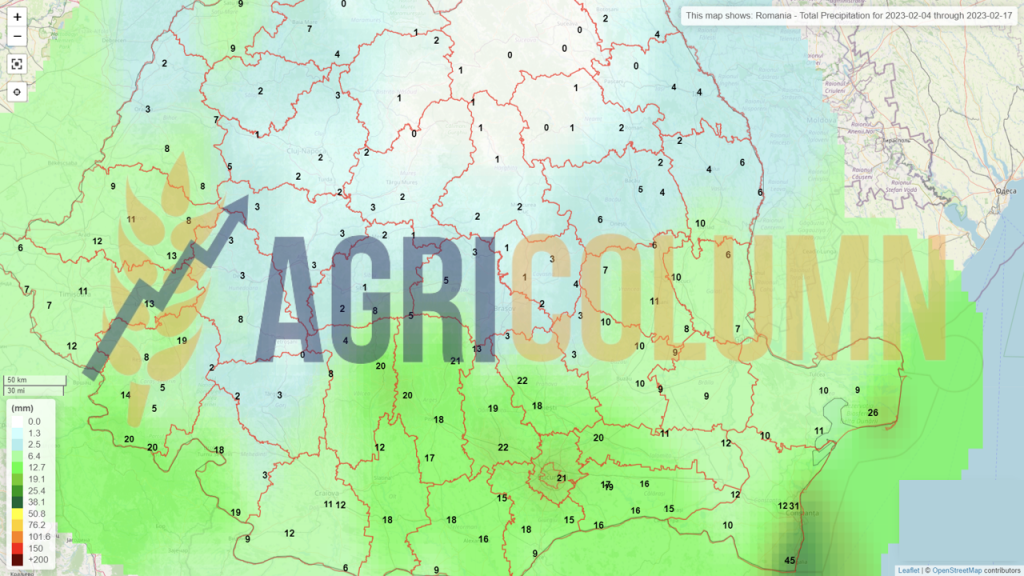
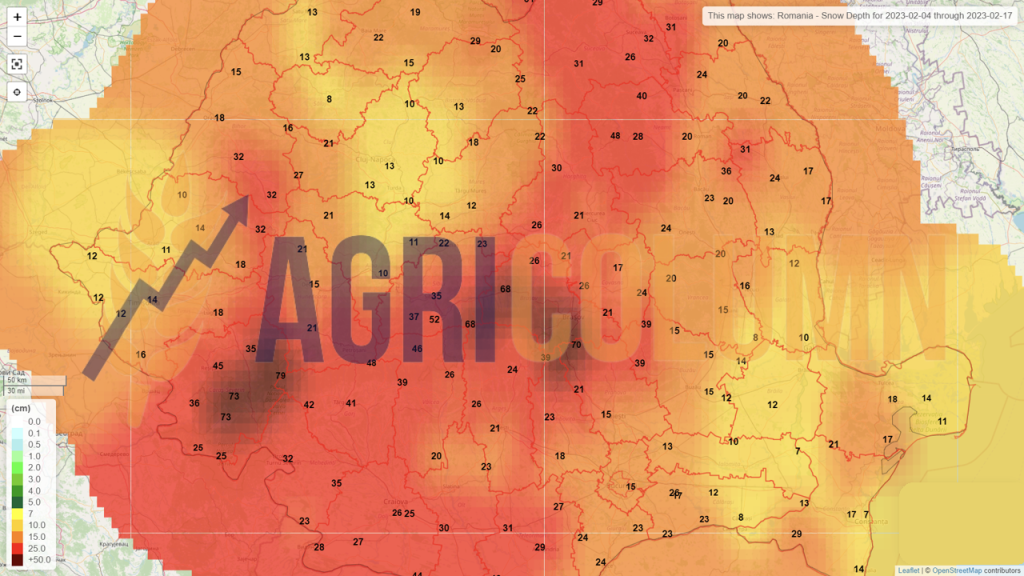
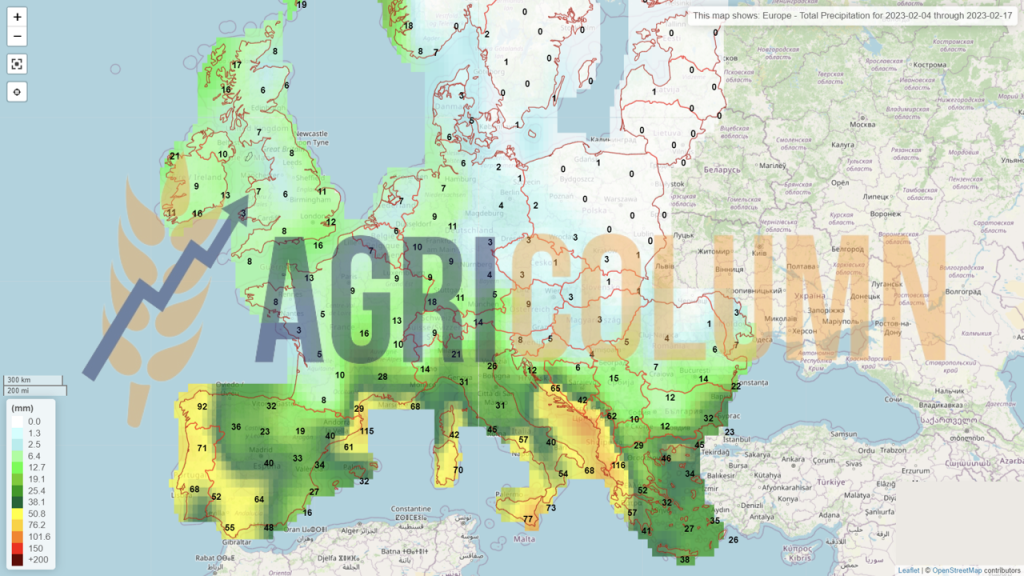
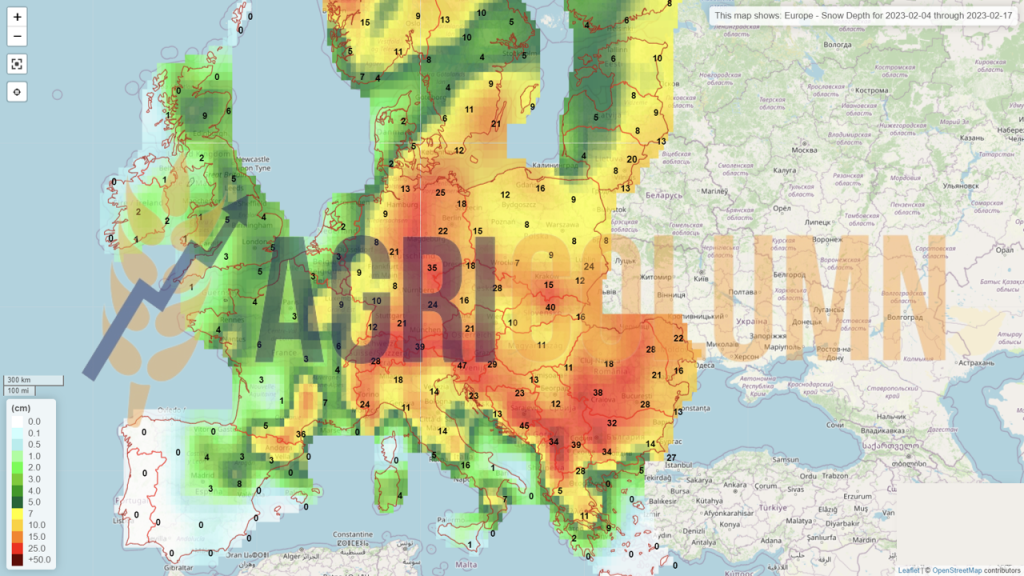
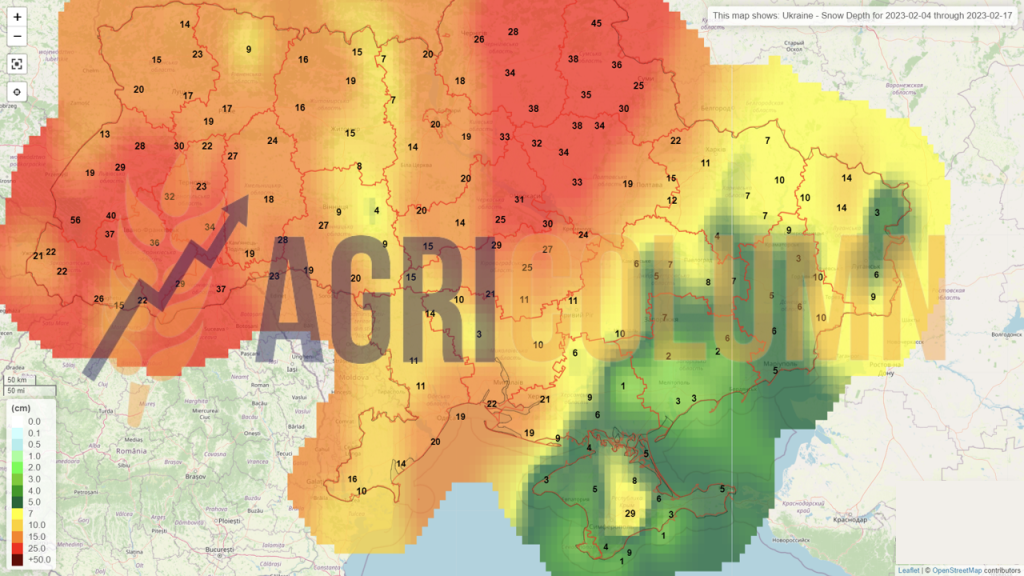
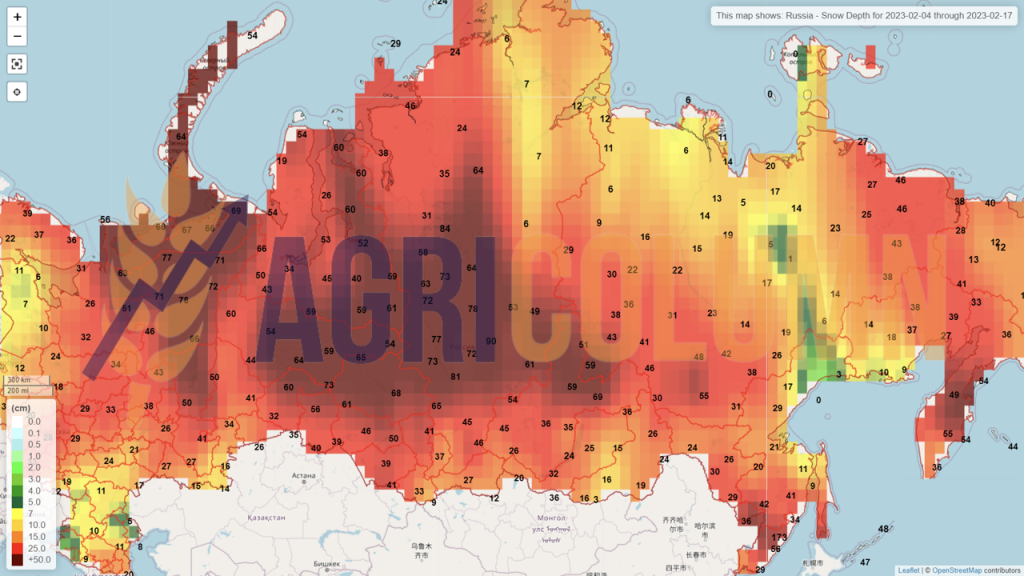
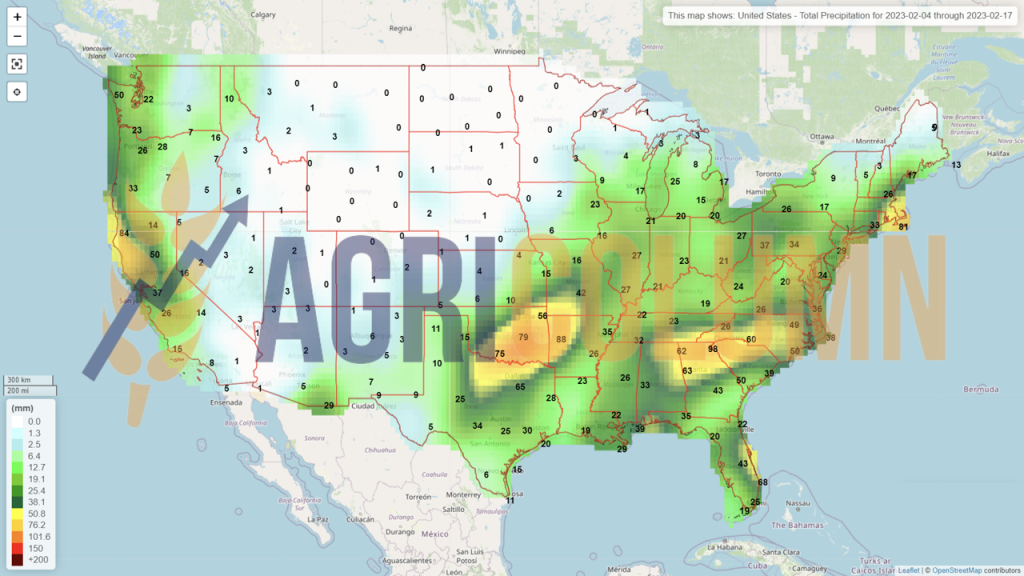
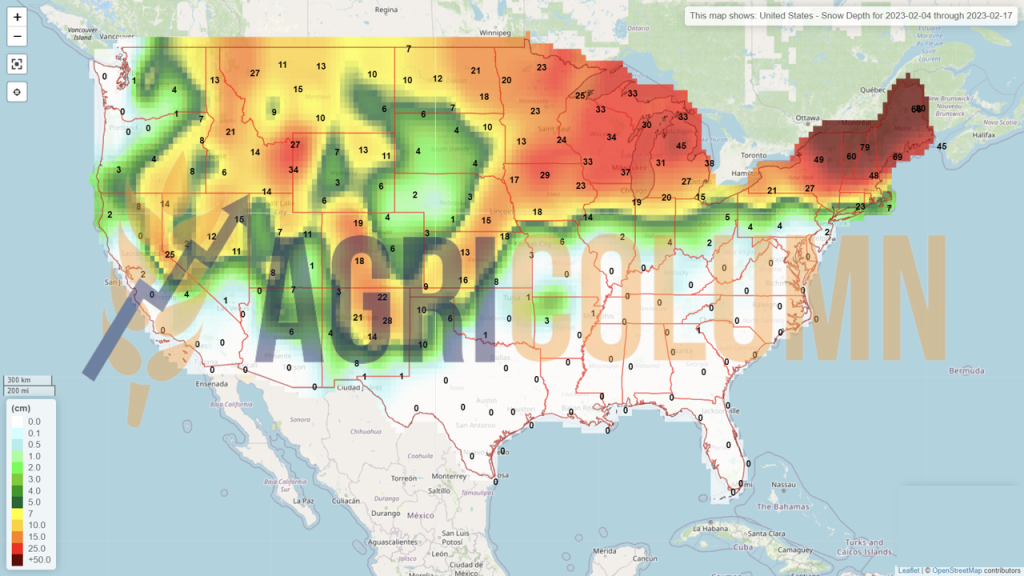
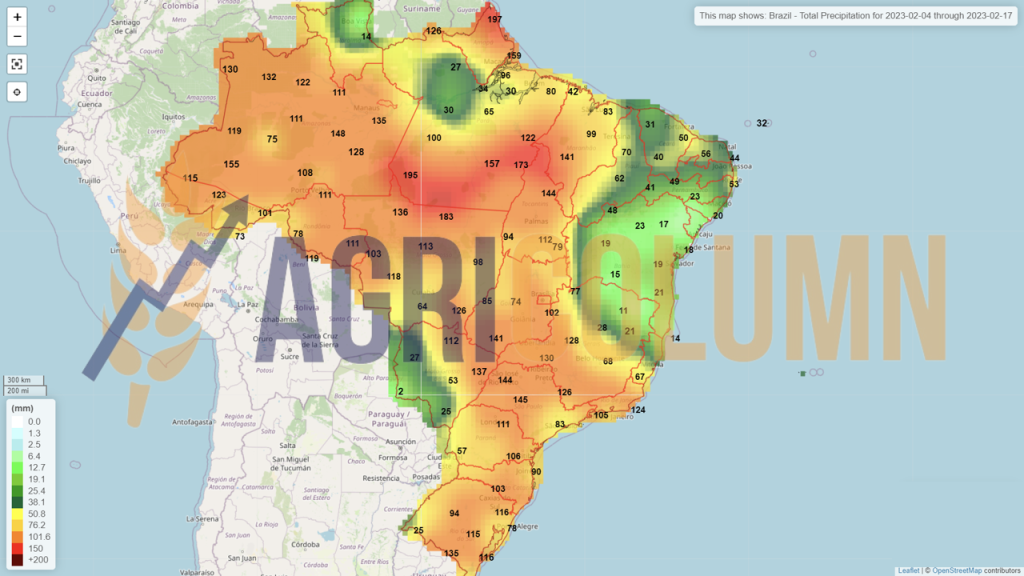
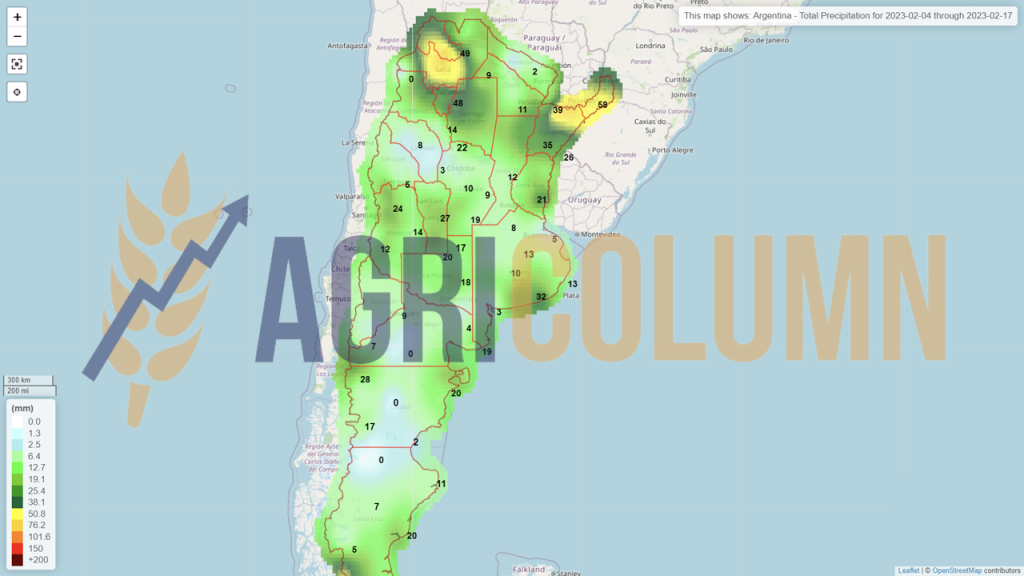
4-17 February 2023
Romania (rain)
Romania (snow)
Europe (rain)
Europe (snow)
Ukraine (snow)
Russia (snow)
USA (rain)
USA (snow)
Brazil
Argentina
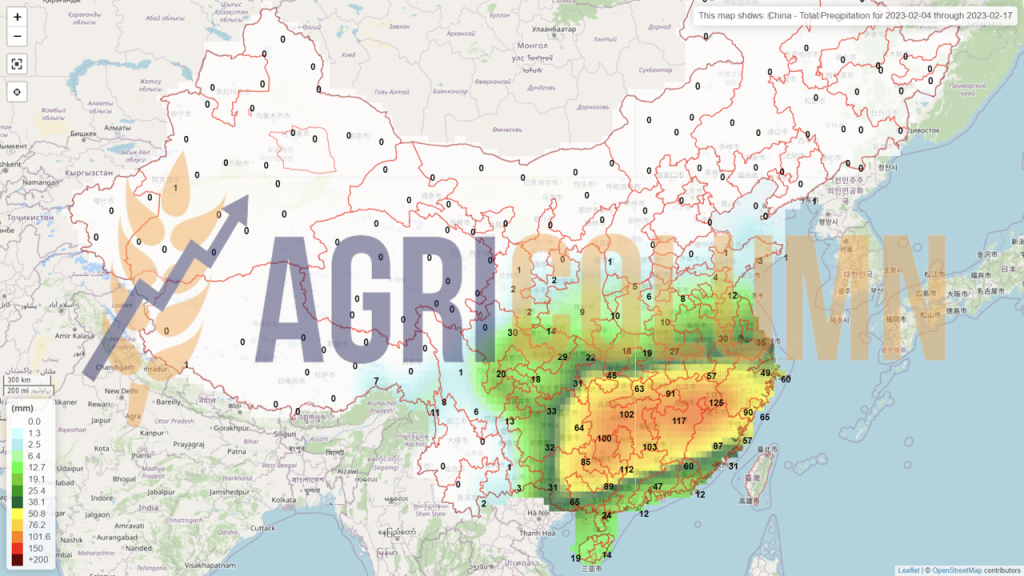
China (rain)
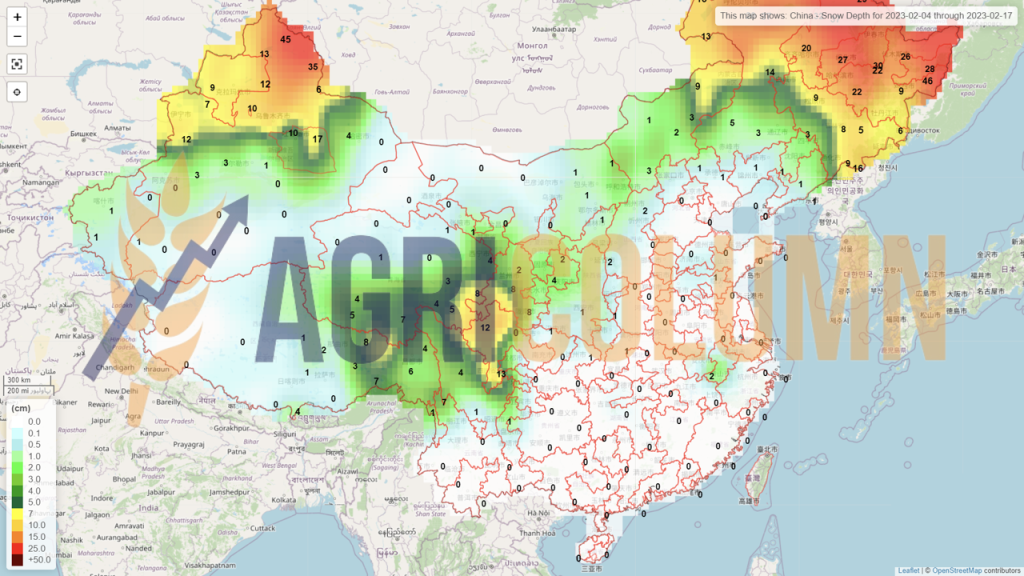
China (snow)
Australia