This week’s market report provides information on:
FAO INDEX
FAO: Agricultural production must increase by 60% by 2050 to meet global food demand.
FAO CEREALS
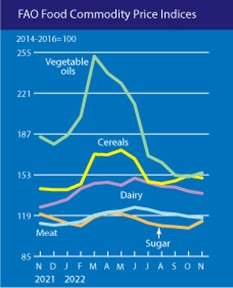
The FAO Cereal Price Index averaged 150.4 points in November, down 1.9 points (1.3%) from October but still 9.0 points (6.3%) above its value a year ago. World wheat prices fell 2.8 percent in November, mainly due to the reintegration of the Russian Federation into the Black Sea Grains Initiative and the extension of the agreement, weak import demand for supplies from the United States of America due to uncompetitive prices and increased competition on world markets with increased supplies from the Russian Federation.
Corn prices fell 1.7% month-on-month, also influenced by developments in the Black Sea Grains Initiative, while improved shipping on the Mississippi River in the United States also weighed on prices. Barley prices rose by 2.5%.
FAO VEGETABLE OILS
The FAO vegetable oil price index averaged 154.7 points in November, up 3.4 points (2.3%) after falling for seven consecutive months. The increase was driven by higher international palm and soybean oil prices, which more than offset lower rapeseed and sunflower oil quotes. International palm oil prices recovered in November, supported by renewed global import demand due to competitive prices relative to other edible oils, as well as concerns about lower production potential due to excessive rainfall from parts of the main growing regions of Southeast Asia.
Meanwhile, global soybean oil values rose slightly, supported mainly by persistent and robust demand from the biodiesel sector, particularly in the United States. In contrast, international rapeseed and sunflower oil prices fell in November, influenced by expected ample global stocks and the extension of the Black Sea Grains Initiative, respectively.
FAO FOOD
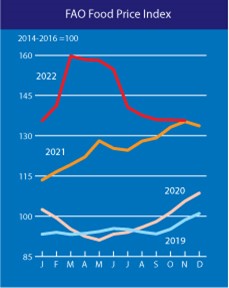
The FAO Food Price Index (FFPI) averaged 135.7 points in November 2022, virtually unchanged from October, with month-on-month declines in cereal, dairy and meat price indices that almost offset the increases in vegetable oils and sugar. At this level, the index was only slightly above (0.3%) its corresponding value from November 2021.

LOCAL STATUS
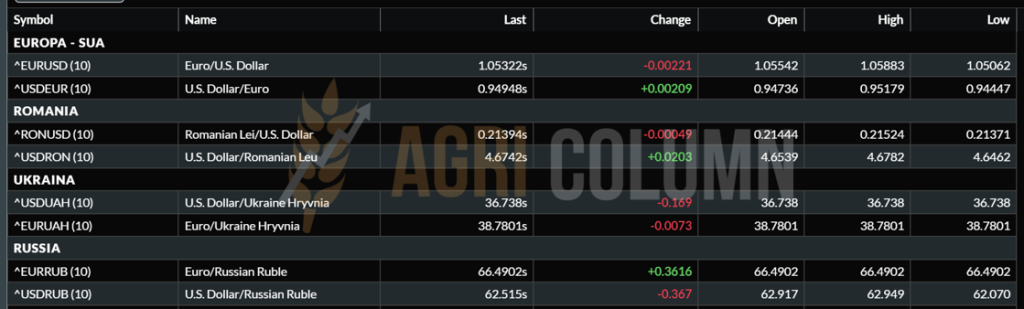
The indications of the port of Constanța are fluid. And we see in this only the weighted demand for coverage for short periods of time. The EURONEXT price is set around 288 EUR/MT CPT Constanța, while the cover request price also indicates values of 300 EUR/MT CPT Constanța.
In the domestic market, FCA Farms nominal indications indicate values between 264 and 284 EUR/MT. These levels have a significant difference of 20 EUR/MT and are the effect of local interest and the quality of the wheat offered for sale.
CAUSES AND EFFECTS
The WASDE report once again nuanced what was obvious and taken into account by traders, namely the availability of wheat in origins. The Black Sea basin made no exception to this rule and the generic price in FOB Constanța parity was diminished by competition with Russian wheat. In the next time frame, as we have pointed out in past issues, no physical fundamentals will support the price of wheat. As much as we would like to believe in a spectacular comeback, this will not happen. Wheat stocks in Romania have dimensions and farmers must understand that these stocks do nothing but generate financing, storage costs or determine a lack of liquidity in farms. Also, the fertilizer market may experience a decrease in availability during this period, and we are referring to the time until mid-February. The lack of availability of Ammonium Nitrate could raise the price level locally.
Returning to the topic, the remaining period until the threshold of the Winter Holidays will not generate volume demand for wheat. Processors have enough reserves to see them through to next year and that is a factor of stability in our market. Moreover, the share of stocks held by farmers generates peace of mind for the period when the supply will have to be replenished. Many processors claim that they are covered until the end of March 2023, but this is not an argument. The processors work according to some extremely well-made calculations, which contain, among other things, apart from the local supply (generous today), also the reduction of the risk in terms of the price. So they don’t overexpose themselves to market volatility, but adapt to the price pattern and its fluctuations.
Also in the chapter on Romania, we must highlight the increasing interest aroused by our country. We all know this and we clearly understand the effects that we have anticipated since March 2022 and that we see again in the physical market at these moments. We are referring to the Ukrainian capital, which will move to Romania, which will become a HUB for the transfer of goods from Ukraine.
In a Bloomberg article supported from the point of view of information by Cezar Gheorghe, the author of this report, we find the following details:
” More and more grain traders are present in Romania, one of the most important grain centers in Europe. The Andersons, Inc. plans to open a local office to trade grains and oilseeds with the goal of being up and running in time for next season, according to people familiar with the matter. Companies have started hiring locally, they said. The move would extend the recent international push by Andersons, one of the biggest US crop retailers. The company set up a trading office in Switzerland last year and hired several former Ameropa traders.
The famous trader Louis Dreyfus Co. is also starting an operation in that country, with its Ukrainian-born boss, Eugeny Didchenko, running the venture called LDC Balkans, people familiar with the matter said. Louis Dreyfus does some originating operations in Romania and the transboard of Ukrainian grain through that country, the respective people added. The company established a legal entity in Romania this year, a spokesperson confirmed to Bloomberg, declining to comment further. A spokesman for the Andersons did not respond to requests for comment.
Romania is one of the largest transporters of crops in the European Union, with large volumes of corn, wheat and oilseeds. Its ports have handled an extra influx of grain this year as Ukraine is forced to ship some of its agricultural products through neighboring nations amid Russia’s invasion.“
REGIONAL STATUS
RUSSIA continues to generate exports. Their analysis indicates a level to be reached of 4.4 million tons in December. The export duty set for the current week is 50.29 USD/MT.
Russian wheat is the winner in many transactions that took place last week as well, among which we mention a direct sale to Egypt, because, as we well know, the GASC tender system no longer exists. But desire is one thing and ability is quite another. Winter strongly shows its force generated by storms and extremely low temperatures.
Russian ports have been dealing with bad weather for several weeks, but this week the winds around the ports on the Don River were so strong that they effectively blew water out of the river ports, preventing any loading or unloading operations.
The storms also coincided with the arrival of winter and the start of the ice season, announced on December 7, which could also lead to an increase in freight rates as ICE class vessels need to be used more and more. Restrictions were not limited to the shallow water ports of Azov, with Russian deepwater ports such as Taman and Kavkaz also reporting some weather-related delays.
Also in the Russia chapter, we see attempts to capture the assets owned by multinational companies operating in this country: Uralchem announced its intention to buy the Russian assets of Cargill and Viterra and requested the government’s approval. However, both companies have informed the Russian Ministry of Agriculture that they have no plans to leave Russia and are not negotiating the sale of their local assets.
UKRAINE has the same reduced pace, but is listed on the rise with a level of 12.5 million tons in terms of wheat export level. But also in the three ports there are long-standing problems identical to those of Russia. Bad weather induces a reduction in port operations and there are quite long periods when the operation is stopped.
THE EUROPEAN UNION is out of season, but with a very good export level. What is decreasing, instead, is feed and industrial use within the European Union.

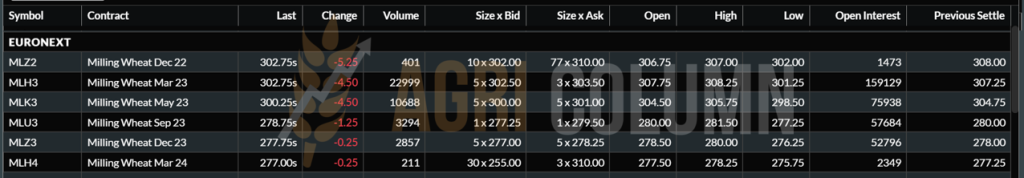
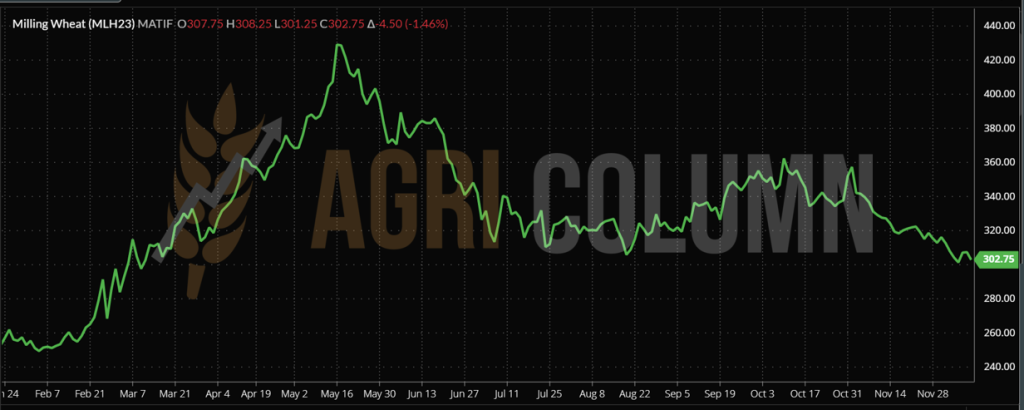
EURONEXT – MLH23 MAR23 –302.75 EUR (-4.50 EUR)
EURONEXT WHEAT TREND CHART – MLH23 MAR23
GLOBAL STATUS
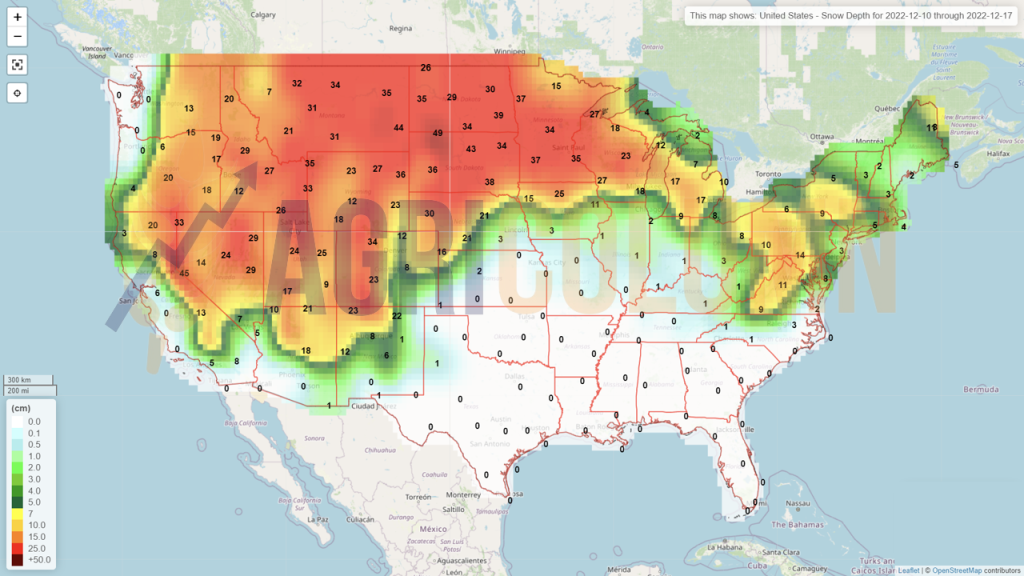
The US remains in the same status. The vegetation index for North American crops did not make significant progress. 75% of US wheat is in drought affected areas.
ARGENTINA is also revised by the USDA to 12.5 million tons of production, which leads to a decreased export level to 7.5 million tons.
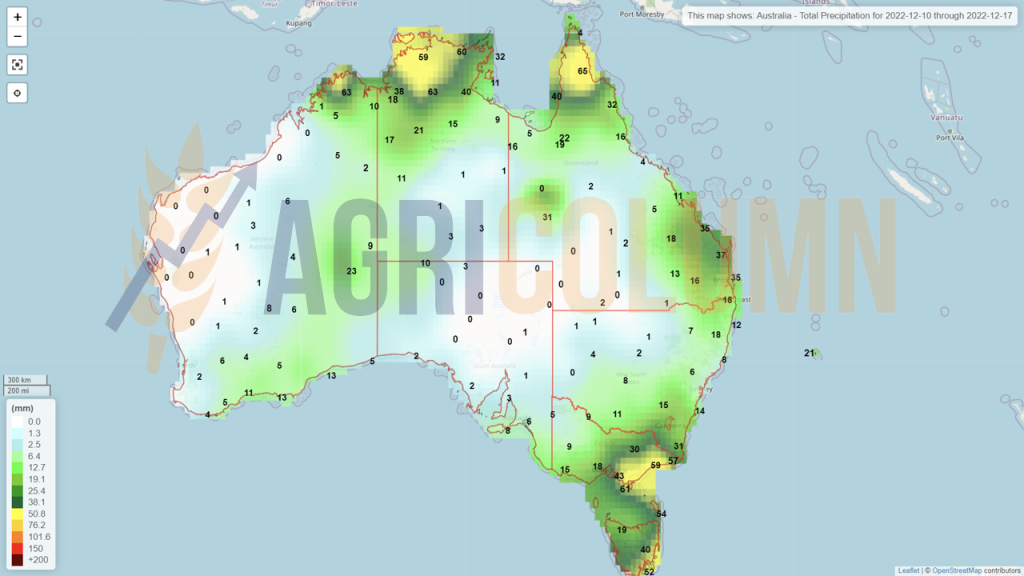
AUSTRALIA records success. Information coming out of Australia indicates an over-crop of 36.6 million tons, and quality, despite pessimistic forecasts, is not badly damaged. The English expression says: plenty of mid-protein available for export. That is, wheat with good quality for export. Rarer will be the one with protein over 13%, but here the market will be supplied by Canada.
BRAZIL is indicated with a record harvest volume level of 9.3 million tons, up 22% from last season. This fact will make it less dependent on traditional imports from Argentina.
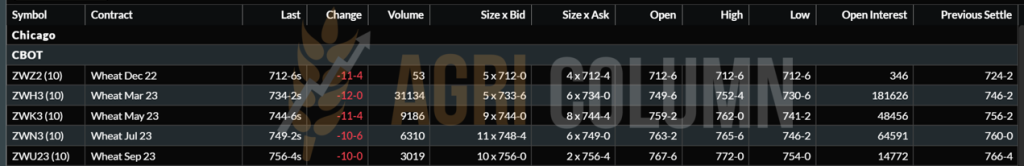
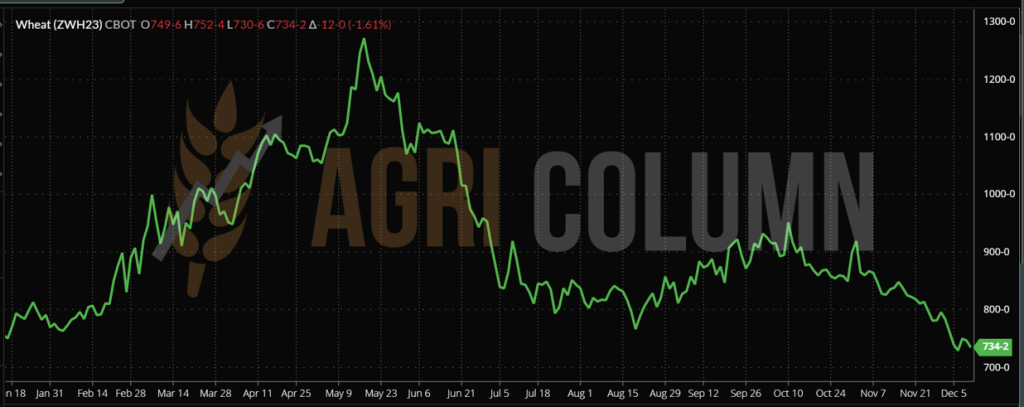
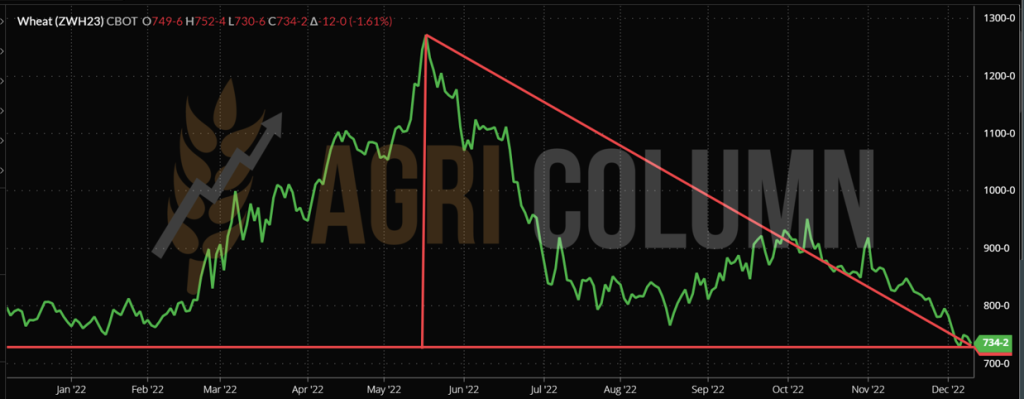
CBOT WHEAT – ZWH23 MAR23 – 734 c/bu (-12 c/bu = -4.4 USD)
CBOT WHEAT TREND CHART – ZWH23 MAR23
WHEAT PRICE INDICATIONS IN MAIN ORIGINS

TENDERS AND TRANSACTIONS
GASC EGYPT directly purchased 260,000 tons of wheat of Russian origin at the price of 354 USD/MT C&F. Delivery will take place between January and February 2023.
CAUSES AND EFFECTS
The WASDE report effectively calmed the wheat market by reducing Argentine potential, to which we add another certified minus from Canada of 1 million tons but adjusted by the surplus Australian crop and lower global consumption.
Thus, we head into the Winter Holidays with a calm wheat market. US wheat has come back from the stratosphere and we are seeing it take bearish shocks on the CBOT from the lack of competitiveness and resources in the physical market, which no longer accounts for the price levels it is at.
Despite the adverse weather, Russia and Ukraine are increasing export levels and we hope that everyone understands the fundamentals that we have been stating for a very long time, namely that WHEAT exists and will be delivered to Destinations.
Ukraine, in exchange for military support, initiates humanitarian deliveries to countries in Africa that have extremely serious problems. This is part of an agreement guaranteeing the support offered by the Anglo-Saxon coalition, which did not give in to the blackmail of a potential Russian attack from Belarus (Russia has massed troops in Belarus). Putin was demanding no more, no less, that in exchange for stopping supplies of military equipment and technology to Ukraine, he would partially withdraw and let the separatists sort out the front line in Ukraine during the winter. A bluff, of course, because, with the spring thaw, he would have returned determinedly with troops to Ukraine. So for the moment, things are settled in terms of wheat availability in the Black Sea basin, and Russia’s interest is to deliver wheat, to export as much as possible.
We are at a price level that sits on trading parameters close to those before the Russian invasion, and Russia’s interests in selling its resources are at the fore. This is evident from the fervor with which they try to find a way out for the liquid ammonia. Belarus intervenes in the equation of the transfer of Ukrainian goods and claims that it will allow their transit through its territory to the Baltic states, provided that the sanctions against fertilizers of Belarusian origin are lifted.
In the period ahead, the physical fundamentals will prevail and the price levels we see today will begin to decline a bit. The main indicator in the region remains Russia, with its aggressiveness in sales. On the European level, however, the price level of wheat will remain within the same margins of +/-, because the Origin is particularly important for certain Destinations. They prefer reputation and this is obvious.
Let’s look together once again at today’s price levels, which line up next to those before the conflict in Ukraine, generated by Russia. Putin’s war booty melts in plain sight and the weapon of food becomes a boomerang that turns against him.
CBOT ZWH23 – DIFFERENCE BETWEEN THE HIGHEST REACHED LEVEL AND TODAY’S LEVEL IS MINUS 538 c/bu (1,272 – 734 c/bu) = 198 USD

LOCAL STATUS
The feed barley price indications in the CPT Constanța parity are decreasing compared to last week, down to the level of 250 EUR/MT.
No news on the barley market at national or regional level.
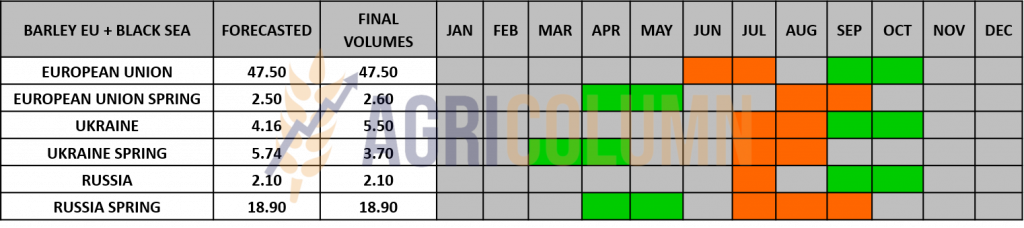
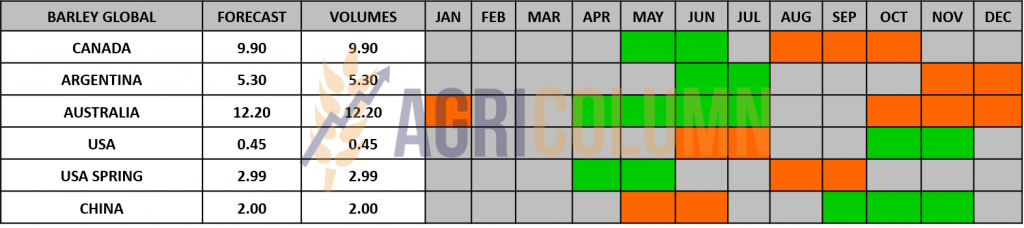
BARLEY PRICE INDICATIONS IN MAIN ORIGINS

GLOBAL STATUS

LOCAL STATUS
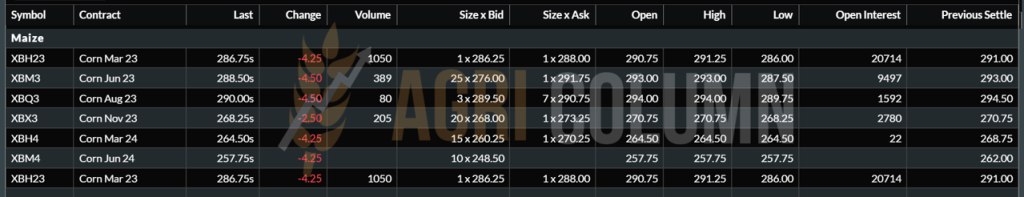
Corn indications in the port of Constanța have started to gain traction and we see quotations of 265 EUR/MT.
CAUSES AND EFFECTS
Maize is driven by wheat to decrease and this is a first parameter that conditions the low price levels in Constanța Port. Competition generated by Ukrainian goods is an aggregate decreasing factor next to the one mentioned above. Crossing Romanian territory generates local distortions. And, if we look only at Romania’s corn import level, we see a volume of 580-600,000 tons. It is unlikely for Romania, which is a net exporter and, despite a very poor crop, manages to cover its internal needs without problems and to generate pine on the free market and an export level quoted up to this moment at 280,000 tons. Of course, the market is free and Ukrainian farmers must be helped, but distortions create an impact in the income balance of Romanian farms.
REGIONAL STATUS
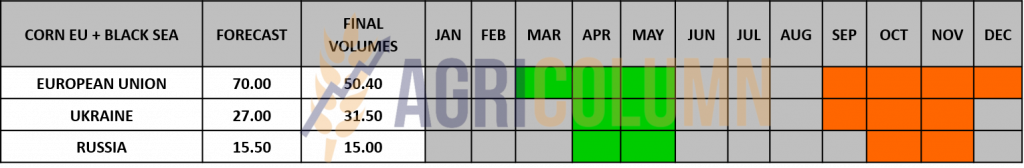
UKRAINE is experiencing the problems that I have been highlighting for some time, namely a decrease in the corn crop. USDA lowers Ukrainian crop level by 4.5 million tons, from 31.5 to 27 million tons. And if it was only that, it would be somewhat in line with the analysis houses in this country, but the harvest stopped at a level of 15.5 million tons, against the potential of 27 million tons. The rest remained in the field. Drying is extremely expensive and generates costs of half the selling value at FCA Farm parity, i.e. 55 USD/MT. The intention is to harvest after February and March, when the thaw and warmth will facilitate natural drying. But the humidity is already wreaking havoc on the Ukrainian goods left in the field. We insert a photo to exemplify this. Mold and quality deterioration are factors that cannot be ignored. Ethanol production would be the destination for damaged cargo or field abandonment.

RUSSIA is also losing volume in the corn crop. Identical to our forecasts, Russian corn production is down by over 1 million tons, from 15 to 14 million tons.
EUROPEAN UNION accelerates corn imports and today the level has reached the value of 12.7 million tons. The figure is telling, because last season in the same period, the Union generated imports of only 4.4 million tons. The goods are definitely of Ukrainian origin. The Union has a production deficit of 20 million tons and an import requirement of at least 22 million tons.
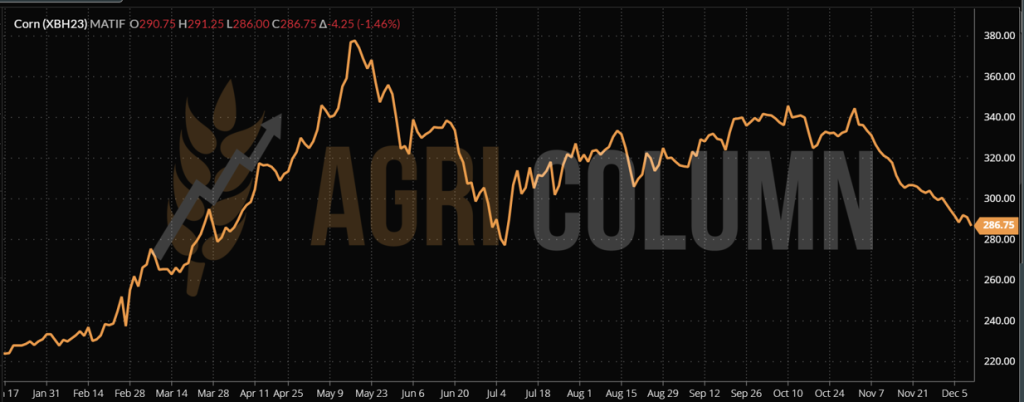
EURONEXT CORN – XBH23 MAR23 –286.75 EUR (-4.25 EUR)
EURONEXT CORN TREND CHART – XBH23 MAR23
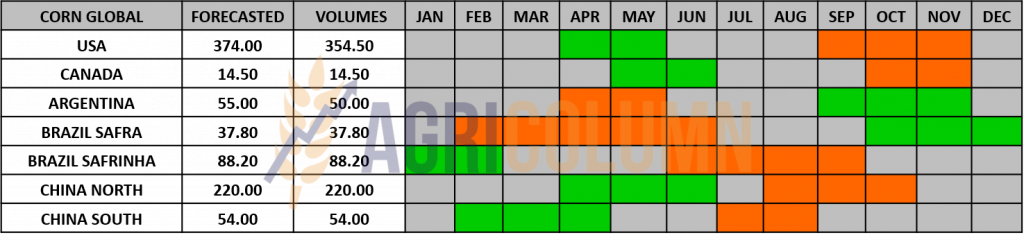
GLOBAL STATUS
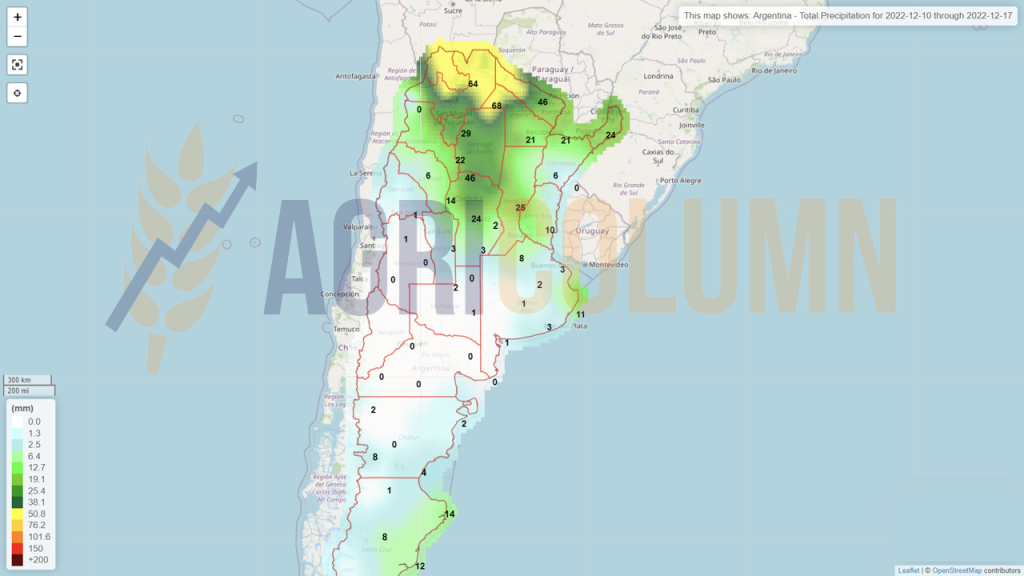
ARGENTINA is under the empire of excessive heat. Temperatures above 40-42 degrees Celsius are recorded. This aspect raises big signs of concern about the future corn crop. Here is clearly an epicenter of a future earthquake that will affect corn volumes globally.
BRAZIL is forecasting 28 million tons for the upcoming SAFRA crop, 4.4 million tons higher than last season. But we have seen this Brazilian Samba turned into a failure of Safra many times. Drought could mess up plans, and volume could be severely penalized. There are already signs in Rio Grande Del Sul, but we must be very precise to inform you that this region generates only 5% of the Brazilian corn crop. We remain under close observation.
The US is off-season, but in NOLA, the price of urea is falling and the calculations are starting to change. In other words, the price difference is 200 USD/MT urea, down from 700 to 500 USD/MT, and makes the drop in the CBOT corn price actually a win for American farmers.
Why? Simple, because they no longer spend so much on the establishment of the crop and thus become more profitable. There are already question marks over next season’s corn acreage. Will they grow to the detriment of soybeans? Apparently, the answer is YES.
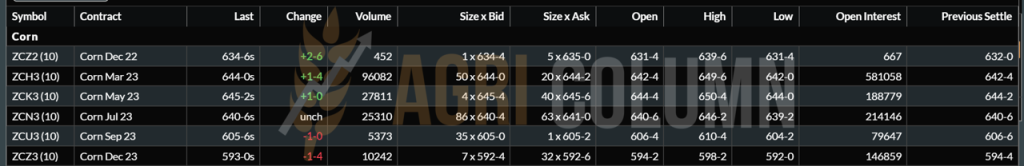
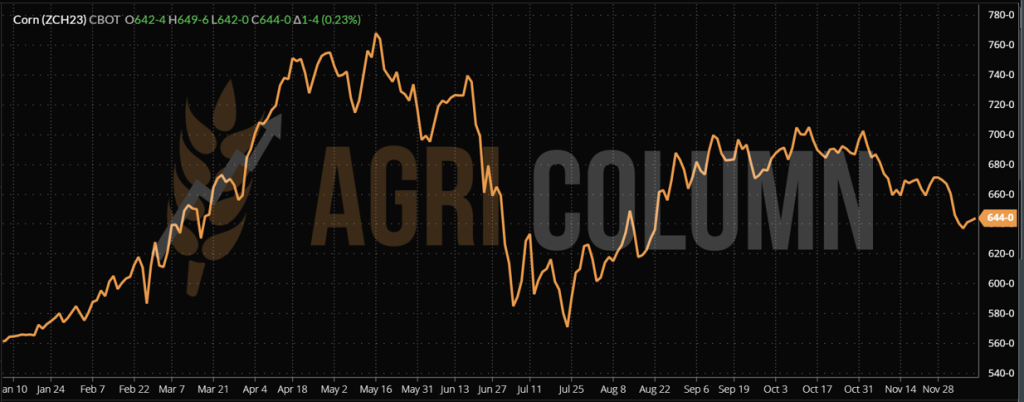
CBOT CORN ZCH23 MAR23 – 644 c/bu (+1 c/bu)
CBOT CORN TREND CHART – ZCH23 MAR23
CORN PRICE INDICATIONS IN MAIN ORIGINS

CAUSES AND EFFECTS
Maize, despite the decrease generated by the negative traction of wheat, remains extremely interesting from the perspective of the evolution in the next period. Why do we support this? The diagonal drawn between Argentina and Ukraine indicates problems in the Origins amoebas.
On the one hand, we have Ukraine with a potential decrease and 40% of the cargo still in the field that has the potential for qualitative degradation and abandonment. And on the other hand, we have Argentina, which, apart from the drought that has grinded it consistently, is now facing extremely hot weather, which is certainly penalizing the future corn crop, which was already advancing very slowly from due to drought and unsuitable conditions for sowing.
And one factor to watch closely is Brazil. At any time things can take a negative turn and the Safra crop can be penalized in volume.
Corn is therefore having a period of lull at the moment and we will cross the next month in close observation. Anything can happen anytime in South America. And in March it is possible, more than likely, that Ukraine will cause problems.

LOCAL STATUS
Nothing new in the rapeseed price ratio. We have the same mold – FEB23 minus 25 EUR. Instead, the interest of buyers disappears, and this does not cause new transactions.
CAUSES AND EFFECTS
Rapeseed does not find its course at all. After the EPA effect, oil is effectively dragging it down in terms of price. And, as we have been saying for some time, the route is not a favorable one in the next period, which we estimate to be at least 30-40 days.
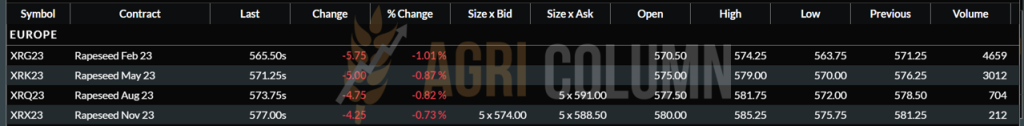
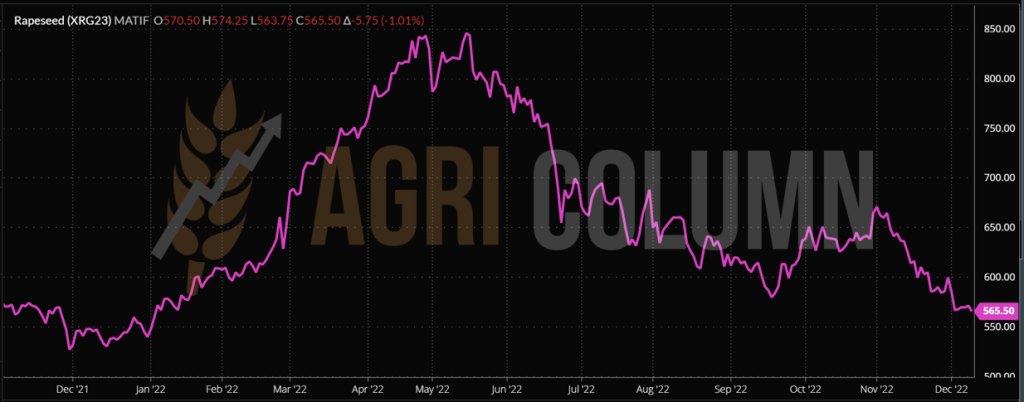
EURONEXT RAPESEED – XRG23 FEB23 – 565.50 EUR (-5.75 EUR)
EURONEXT RAPESEED TREND CHART – XRG23 FEB23
GLOBAL STATUS
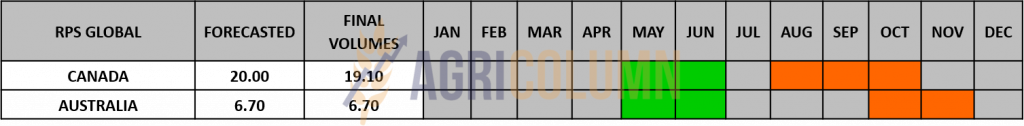
CANADA. Nothing has changed from last week, except that one million tons missing from the Canadian crop is acting as a pull factor for canola and keeping it high on ICE Canola.
AUSTRALIA generates a surprise and the crop estimate exceeds 6.7 million tons. At 7.2 million tons, the Australian canola crop is pressuring the price of the European commodity, as the destination China is not yet fully unlocked due to the lockdown and dissension between the two countries.
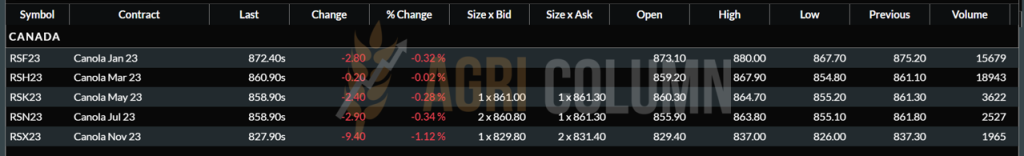
ICE CANOLA RSF23 JAN23 – 872.40 CAD (-2.80 CAD)
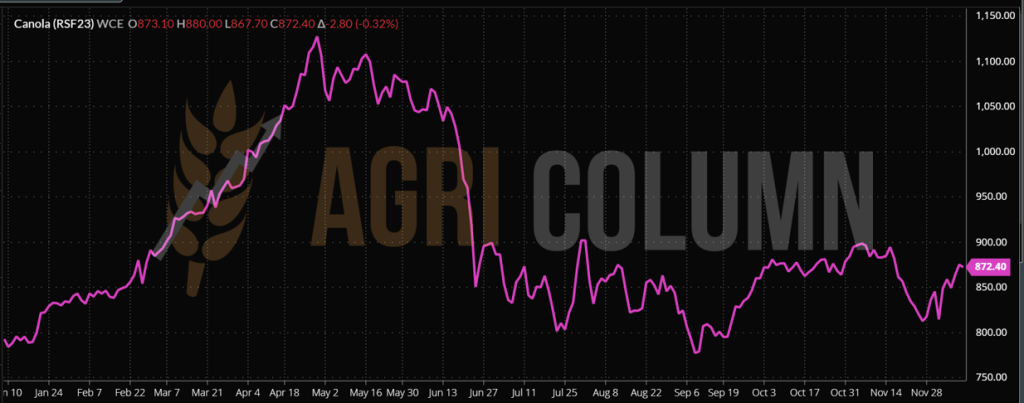
ICE CANOLA TREND GRAPH – RSF23 JAN23
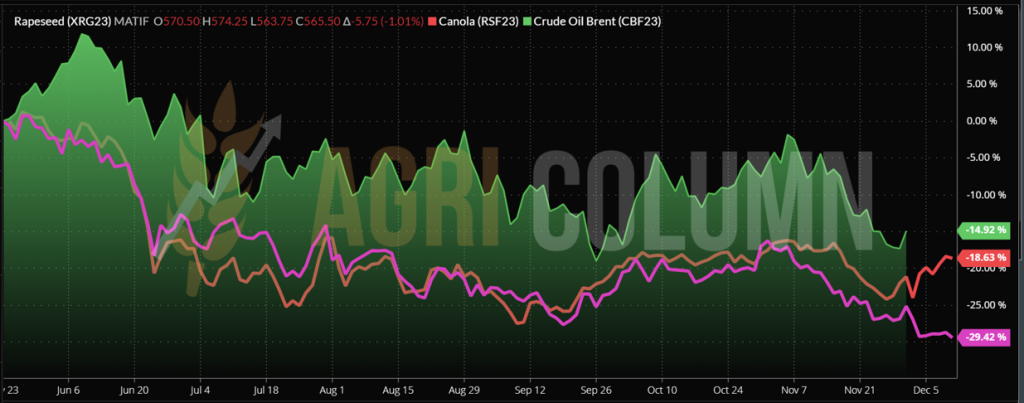
COMPARATIVE GRAPH. PETROL-RAPESEED-CANOLA CORRELATION
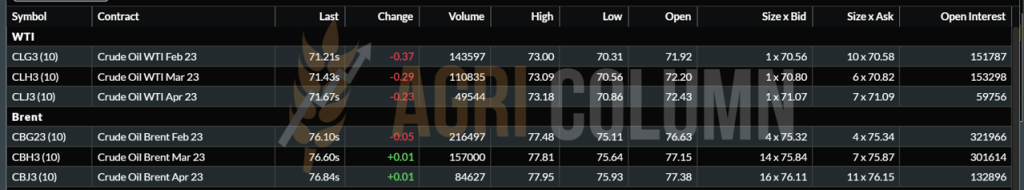
CAUSES AND EFFECTS
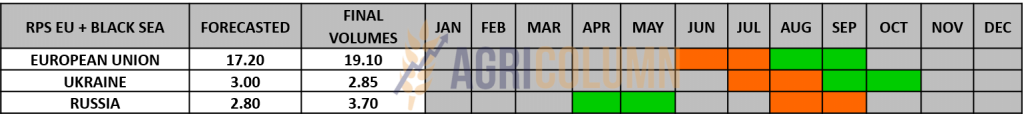
Rapeseed remains under pressure from Brent FEB23 indications, which fall to the level of 76 USD/barrel. Pressure from oil prices and pent-up demand remain the main factors. Coverage is the element that has been helped by Ukrainian flows that have supplied Europe with 2.8 million tons, an impressive level compared to European production of 19 million tons.
Next, soybean oil also acts as a brake on the development of the rapeseed price. The EPA mandate has ripple effects in the European market. Canola remains supported due to the lack of volume, but we must carefully shift our focus from the month of JAN23 to the next indication, MAR23, because in 2-3 days the liquidations and roll over of the JAN23 positions will begin.
The new rapeseed crop indicates an optimal state of health at the European and Black Sea basin level for this moment, so we have no reasons for concern here either. Rapeseed remains on this plateau and will not progress significantly in the coming period.

LOCAL STATUS
Primary indications for sunflower seeds are 555-560 USD/MT in CPT Constanța parity. The price for sunflower seeds delivered in DAP Procesator parity are discounted by a minimum level of 10 USD/MT due to logistical cost differences.
CAUSES AND EFFECTS
There is currently no liquidity in terms of transactions. Farmers are waiting for the transition to 2023. Processing units are reducing their engines in turn, as the Winter Holidays will follow, and the processing windows are very narrow. Effectively, December will be a very short one for processing.
REGIONAL STATUS
UKRAINE remains at the level of 9.9-10 million tons harvested and the situation of processing units has not improved. Lack of energy penalizes processing. The traverse of the raw material is also influenced by the prices in Romania and Bulgaria, which are no longer high at the moment.
RUSSIA stopped harvesting at the level of 13.7 million tons, but forecasts do not indicate a healthy volume. From the last forecast of 16.35 million tons, Russia drops to 15.8 million tons. This suggests that 2.1 million tons remained in the field. When, how and under what conditions they will be harvested are questions that create uncertainty.
THE EUROPEAN UNION is out of season, but the revision of the forecast brings its volume to 9.45 million tons, with an amendment for cargo from Ukraine, which has a volume level that entered the EU of 2.4 million tons, so a substantial contribution to the European production deficit. 25% of the European harvest volume arrived from Ukraine Origin. It is an impressive mathematical ratio.
GLOBAL STATUS
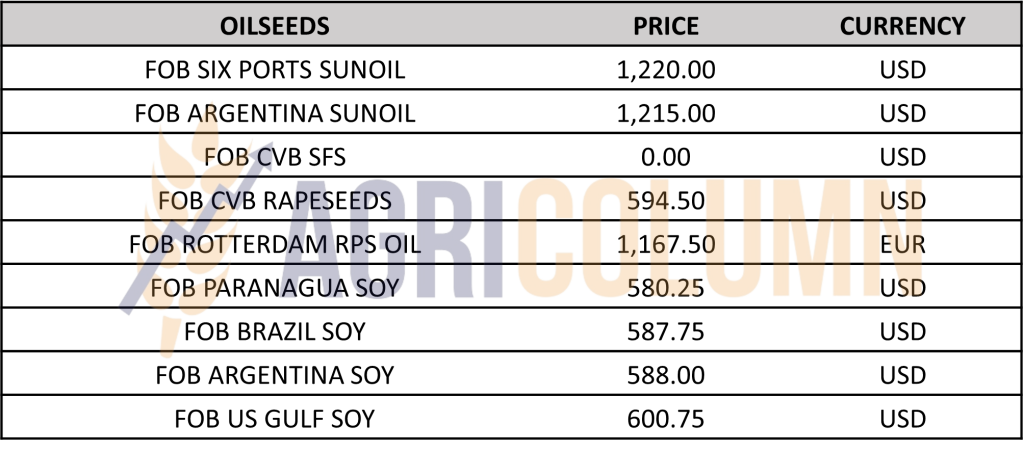
PRICE INDICATIONS FOR OILSEEDS AND CSFO IN MAIN ORIGINS
CAUSES AND EFFECTS
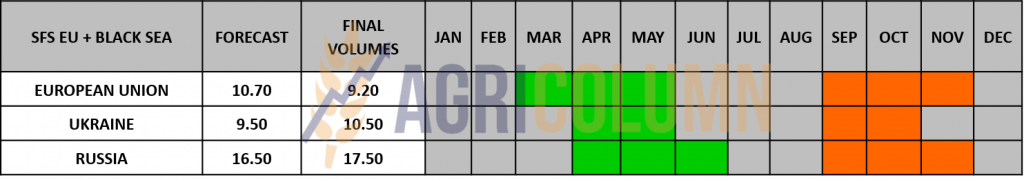
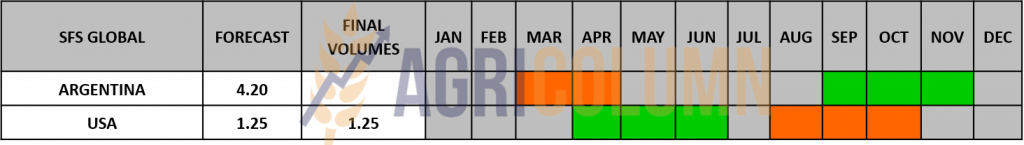
GLOBAL SFS:
- Global production decreases compared to last month by 0.6 million tons, from 51.3 to 50.7 million tons. In the previous season, 2021/22, production was 57.32 million tons.
- Exports increase from 4.85 million tons to 5.35 million tons.
- Ending stocks decrease month-on-month from 6.64 million tons to 6.05 million tons.
- SFS oil production remains unchanged, with a slight decrease from 20.11 million tons to 20.06 million tons.
- SFS oil imports increase from 8.94 million tons to 8.99 million tons. A low rise.
- Oil exports decrease from 10.57 million tons to 10.37 million tons.
- Domestic consumption increases from 18.46 million tons to 18.56 million tons.
- Final stocks of sunflower oil increase from 2.35 million tons to 2.46 million tons.
SFS REGIONAL PRODUCTS:
- Russia, according to the USDA, is still maintained at 16.5 million tons of sunflower seed production. But Russia internally lowered the forecast to 15.8 million tons, stopping the harvest at 13.7 million tons. 2.1 million tons are in the field unharvested and will remain so for some time.
- Ukraine is quoted at 10 million tons, compared to the 10.5 million initially estimated.
- The EU remains at 9.47 million tons, down from 10.2 million tons.
The data puzzle above prompts careful analysis. And we remember the fact that production volumes are lower compared to last year. We estimate 4.4 million tons, but it seems that we will reach a difference of 5 million tons. And Russia is the Joker in the cards. If what remains unharvested will be left on the field or degrades, it will result in a decrease in Russian crude oil export potential.
And Russian crude oil is literally dueling with Ukrainian crude oil in destinations that do not show a high enough focus for this product. These Asian destinations have an open appetite for palm oil, leading to a drop in the price of crude sunflower oil.
The scenario we generate is one where January and February will generate demand for crude oil. Origins will not have enough logistical power (weather = winter) to handle volumes and, moreover, both origins (Russia and Ukraine) will have processing penalized, Russia by decreasing volumes (2.1 million tons of raw material left unharvested), and Ukraine through insufficient operating capacity (the energy infrastructure destroyed by Russia). And the European Union will demand sunflower oil, through the cultural specifics of consumption and through the ban on importing products obtained through deforestation (palm oil).
Another price trend will follow the Winter Holidays. But until then, there are at least 40 days left.

LOCAL STATUS
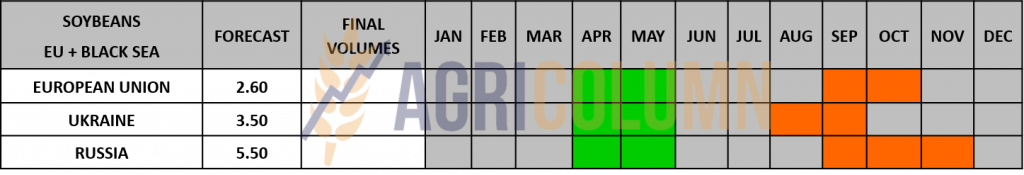
In Romania, the price indications for soybeans are at the level of 500 USD/MT DAP processing units for non-GMO soybeans. Between July 1 and December 10, 2022, approximately 130,000 tons of soybeans were imported.
REGIONAL STATUS
Weekly soybean imports rose from last week to 328,902 tons, bringing total soybean imports since the start of the season to 4.72 million tons, down 12% from last year.
Weekly soybean meal imports into EU countries increased to 350,537 tons, the total now standing at 6.9 million tons.
GLOBAL STATUS
USA. US soybean export inspections came in below market expectations at 1.7 million tons on December 1, according to the US Department of Agriculture (USDA).
Weekly inspections fell from 2 million tons the previous week and were below analysts’ expectations of 1.9 million tons to 2.2 million tons. The most volumes were destined for China, with 1.2 million tons of soybeans inspected heading to the Asian country. Other destinations were Indonesia (121,693 tons), Taiwan (94,266 tons), Mexico (90,260 tons), Egypt (56,655 tons), Canada (25,142 tons) and Spain (21,157 tons).
Weekly volumes led total inspections for the start of the 2022/23 marketing year to 21.1 million tons, down 10.9% from the previous year.
No major changes were reported for soybeans in the USDA’s World Agricultural Supply and Demand Estimates (WASDE) report released on Friday, with new estimates broadly in line with market expectations.
Estimates for global soybean production and ending stocks were slightly improved from November, with global production at 391.17 million tons and ending stocks at 102.71 million tons, up 0.6 and 0, respectively. 5 million tons. Production is increased due to higher production for India and Ukraine.
The USDA also lifted global soybean exports which were up slightly as higher shipments to Argentina were partially offset by lower exports to Canada and Paraguay.
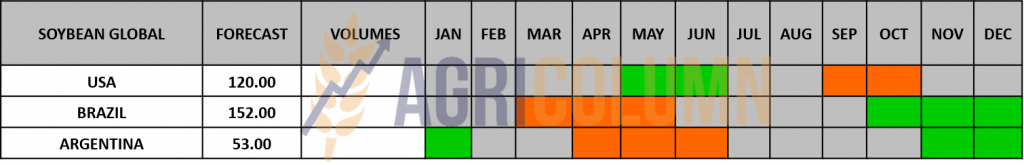
BRAZIL. Soybean sowing in Brazil is 90.7% complete, according to Conab, the country’s food agency. The pace of seeding is still behind the 95.1% completion rate reported for the same period last year.
Soybean planting in Mato Grosso has been completed, with the pace of field work close to that recorded in the previous marketing year and significantly above the average of the last five years. Production estimates were revised down slightly due to erratic rains over the past month, according to the state’s agricultural institute, IMEA, by 0.9 percent from its previous report. Brazil’s soybean exports in 2023 are projected at 93 million tons.
In the Brazilian state of Parana, the signed reached 99%. Soybean production in Parana is estimated at 21.5 million tons, up 79% from last year’s total of 12 million tons, on an area of 5.7 million hectares.
Brazil’s 2022/23 soybean crop is forecast at 153.5 million tons, an all-time high and up 20% from last crop’s output of 127.9 million tons, according to the Brazilian Association of Vegetable Oil Industries, All right. The increase is the result of a 20% increase in yield, projected at 3.7 tons/hectare, and a 4.3% advance in planted area to 43.1 million hectares.
ARGENTINA. Dry weather in most of Argentina is delaying seeding progress. During the past week, soybean planting advanced by 8%, reaching 37.1% of the planned area of 16.7 million hectares, which represents a decrease of 19% compared to the previous year, according to data published by BAGE (Buenos Aires Grains Exchange).
In all of Argentina, only 11% of the eastern crop is in good to excellent condition due to low water availability.
Soybean sales since the second preferential exchange program for exports, “dollar-soybean 2” took effect, continue to lag behind September levels, despite an increase from October sales. They rose last week to 74.2% of the current harvest.
Argentine farmers sold 2.37 million tons of soybeans from November 28, the first day of the dollar-soybean 2 program, to December 6, while in the first days of the dollar-soybean 1 program from September 1 they had sold 5.61 million tons.
CHINA. Soybean volumes processed in China rose by just over 2 million tons in the week to Dec. 5 amid rising soybean shipments, easing of Covid-19 restrictions and the approach of the twin festivals, according to data from the National Cereals Information Center and Oil (CNGOIC).
Deliveries of high volumes of soybeans in the week to December 3 led to a rise in soybean stocks at major processing plants, which were reported up marginally on the week at 3.49 million tons, an increase of 10.8% month-on-month and an annual jump of 17.3%.
Higher soybean availability helped boost processing volumes, which rose 2.5 percent on the week to 2.03 million tons and were 6.8 percent higher on the year.
Chinese stocks of soybean meal and soybean oil rose during the week as processing volume increased, and meal stocks rose and pressured prices lower.
Soybean shipments and stocks are expected to rise, while processing remains forecast at more than 2 million tons next week.
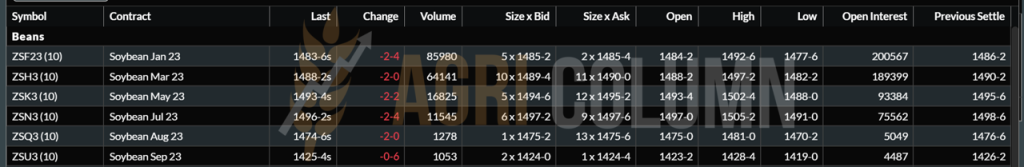
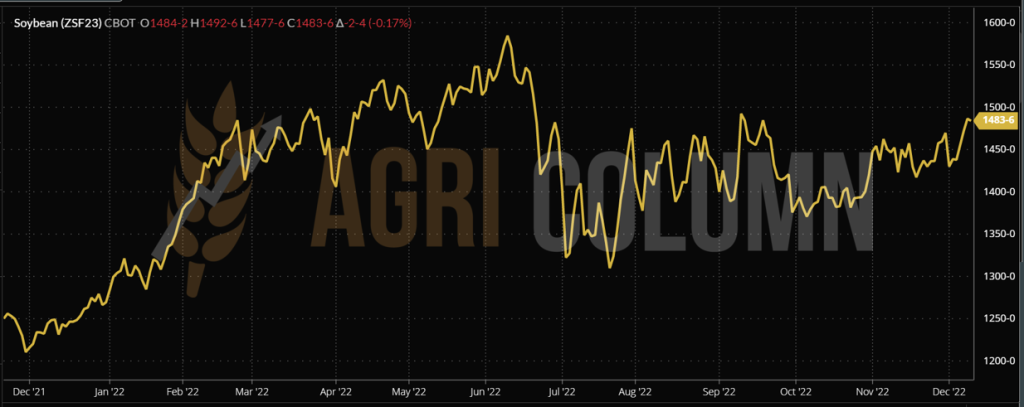
CBOT SOYA ZSF23 JAN23 – 1,483 c/bu
ZSF23 SOYBEAN CHART TREND JAN23


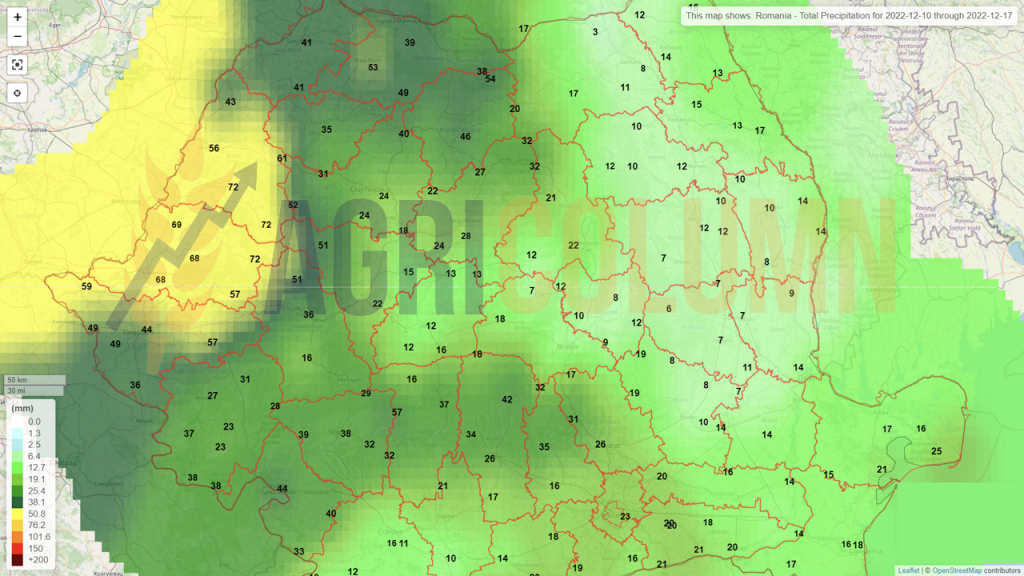
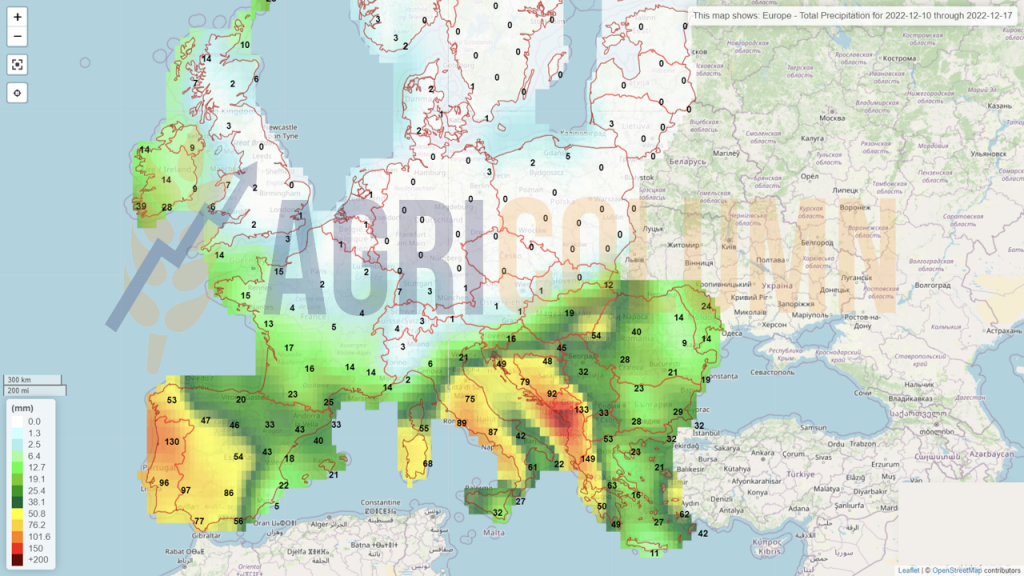
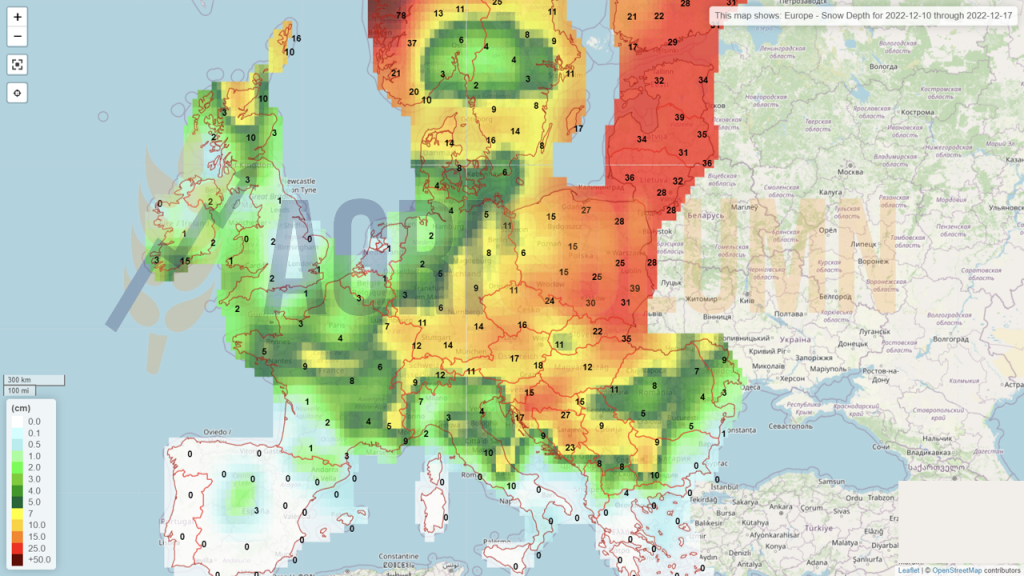
10-17 December 2022
Romania (rain)
Europe (rain)
Europe (snow)
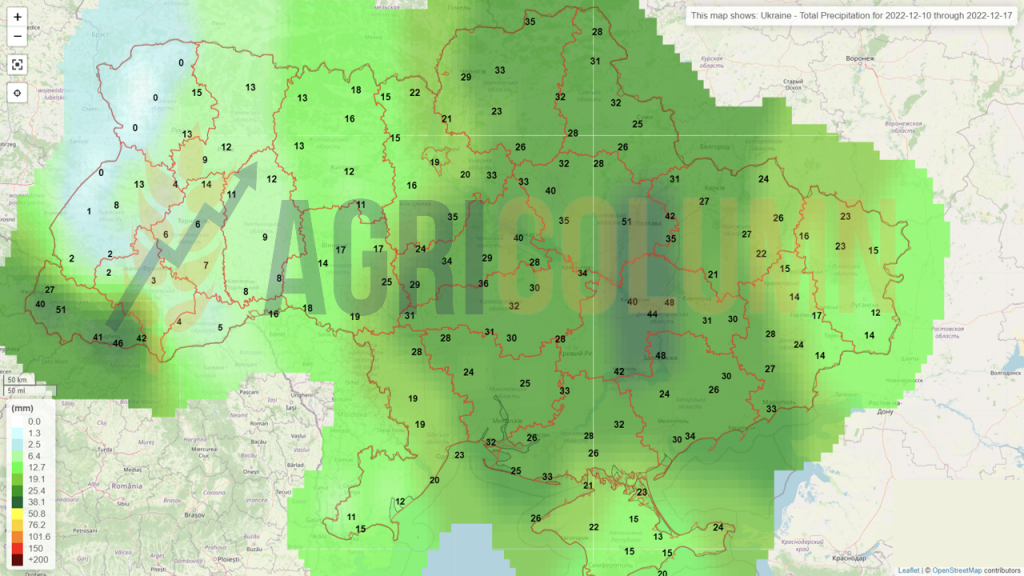
Ukraine (rain)
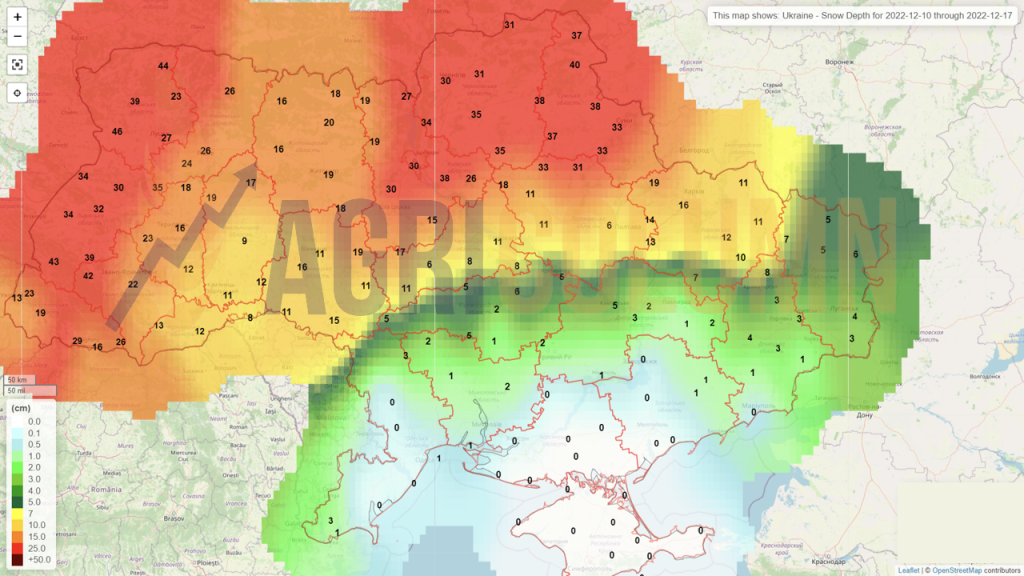
Ukraine (snow)
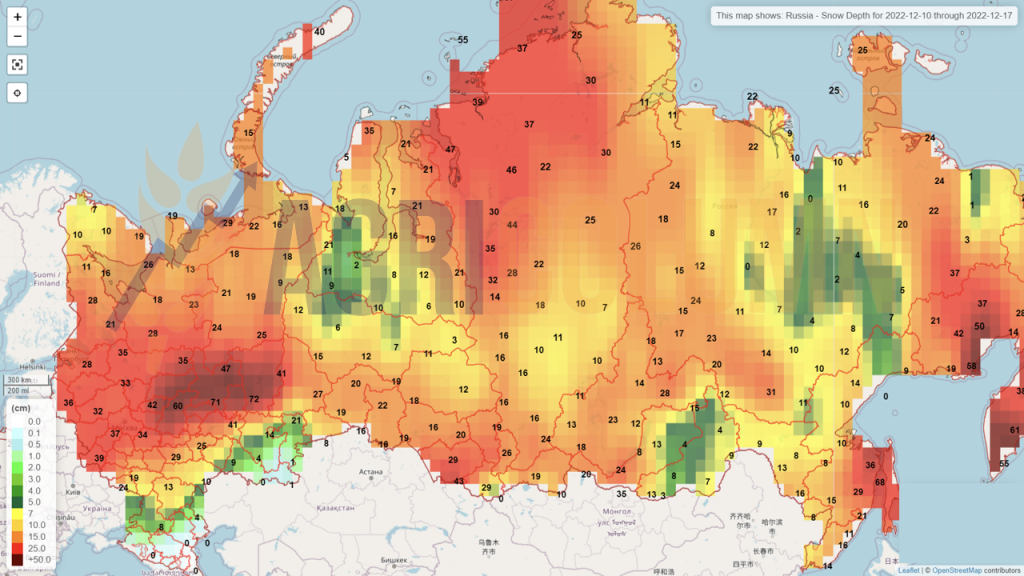
Russia (snow)
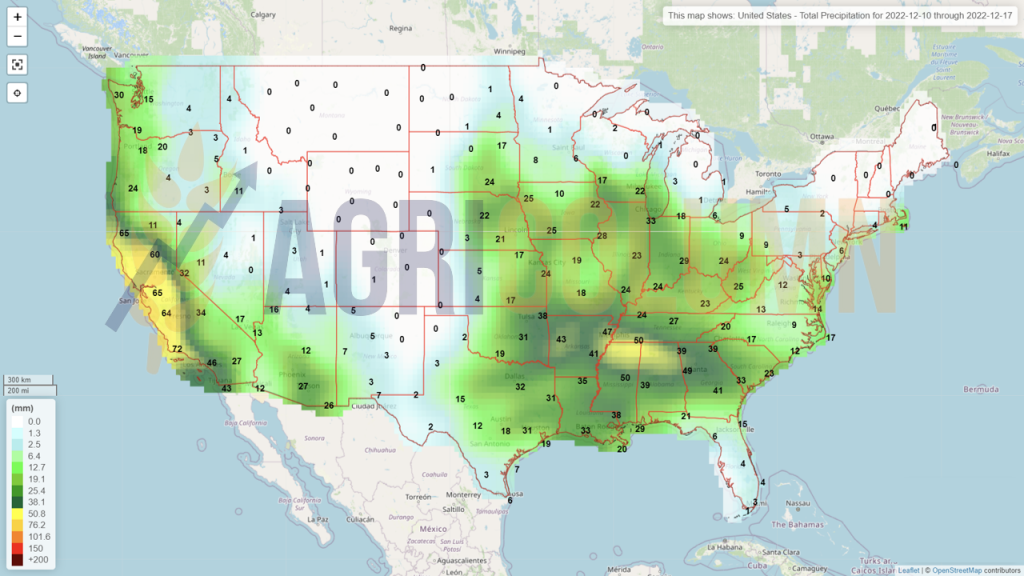
USA (rains)
USA (snow)
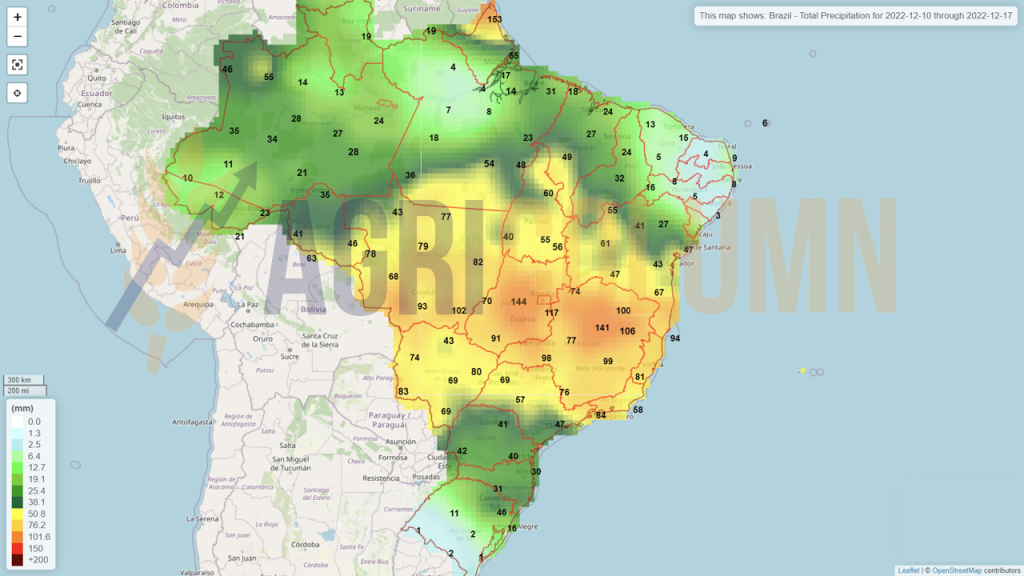
Brazil (rains)
Argentina (rains)
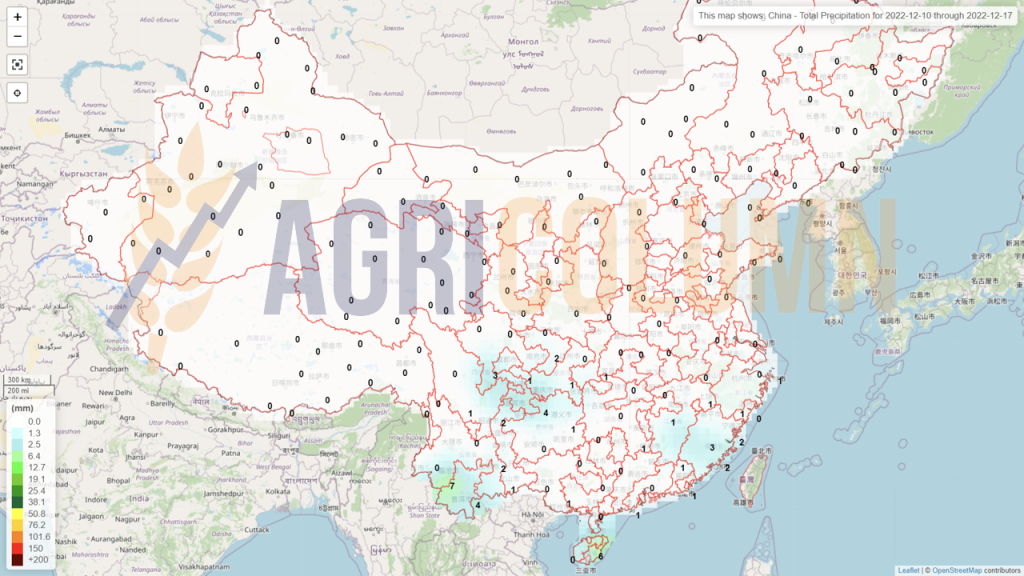
China (rains)
Australia (rains)