This week’s market report provides information on:

LOCAL STATUS
The indications of the port of Constanța decrease to the level of 296-298 EUR/MT in the CPT parity. The price of feed wheat is 25 EUR/MT lower than the price of milling wheat. In the country, at the level of processing, the price indications are aligned with the Port of Constanța, with processors offering values of 295-297 EUR/MT.
CAUSES AND EFFECTS
The wheat market received the technical shock of the change in stock positions from DEC22 to MAR23. The pressure exerted by Russian wheat is showing itself at this moment and we are now accounting for the reduction we have been talking about in many previous issues. Export values from the Black Sea basin clearly make Romanian wheat uncompetitive with Russian sales values. Unfortunately for farmers holding stocks, the end of the year confirms the factors we talk about in every issue of our market report, namely: Russian wheat in very high volume, its aggressiveness in the competition from the East and Asia, and the effects of the FED reverberating in the stock markets (let’s remember that we kept repeating the words of FED Chairman Jerome Powell: “it’s going to be a soft landing”). The FED has made it clear that it will not force the funds to liquidate automatically, but only upon expiration.
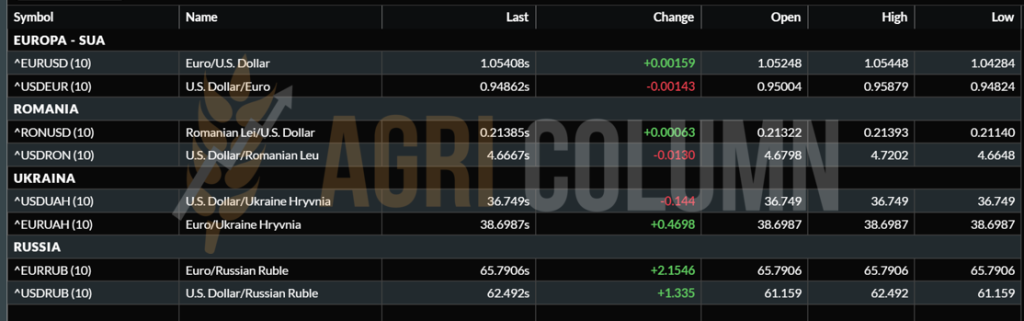
The end of the year will not bring improvements from this perspective, only a pronounced decrease in the price level. The low EUR price is also fueled by the EUR:USD parity which reached 1:1.05.
REGIONAL STATUS
RUSSIA continues its march in terms of wheat exports. The competitiveness of Russian wheat is clear and unequivocal. The latest trades reinforce this. At the same time, the condition of Russian winter crops is 80% good, with the amendment that 700,000-800,000 hectares remained unsown due to the closing of the time window.
UKRAINE remains in the same status: heavy export rate and a maximum of 3.7 million hectares sown in autumn. Of the more than 6 million usual hectares, only the memories remain at this moment. The conflict theater clearly marks this and penalizes the area allocated to wheat in Ukraine.
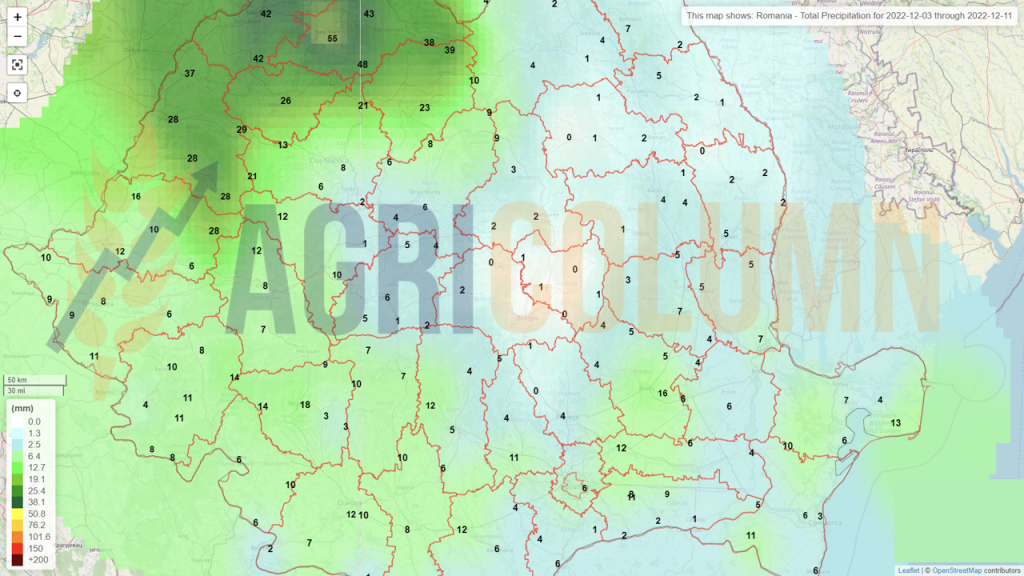
The EUROPEAN UNION presents itself somewhat mixed, with obvious problems in the south of Spain, with a good state of vegetation in France and Germany, with the problems we know in Romania and Bulgaria. But the rainfall in Romania can bring Romanian wheat back to normal yields for this period. Hibernation is very close, and we will look together at the zones as well as their future development.

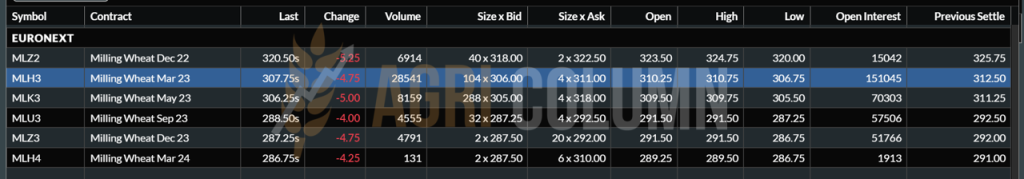
EURONEXT – MLH23 MAR23 –307.75 EUR (-4.75 EUR)
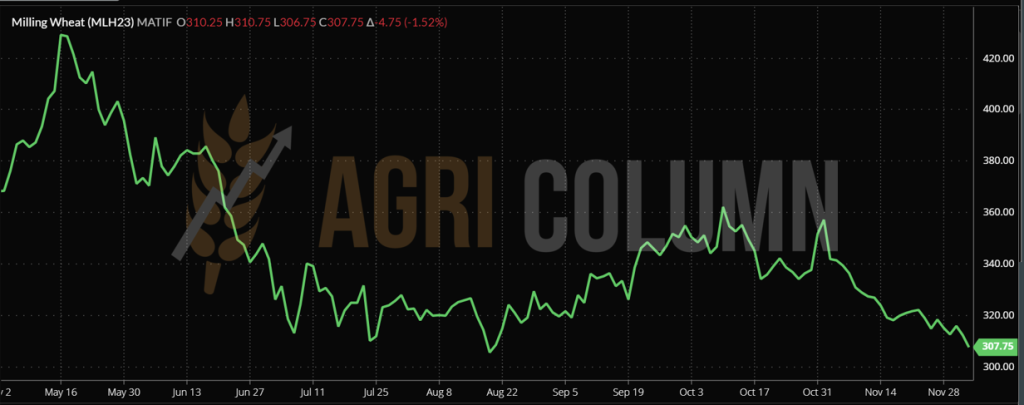
EURONEXT WHEAT TREND CHART – MLH23 MAR23
GLOBAL STATUS
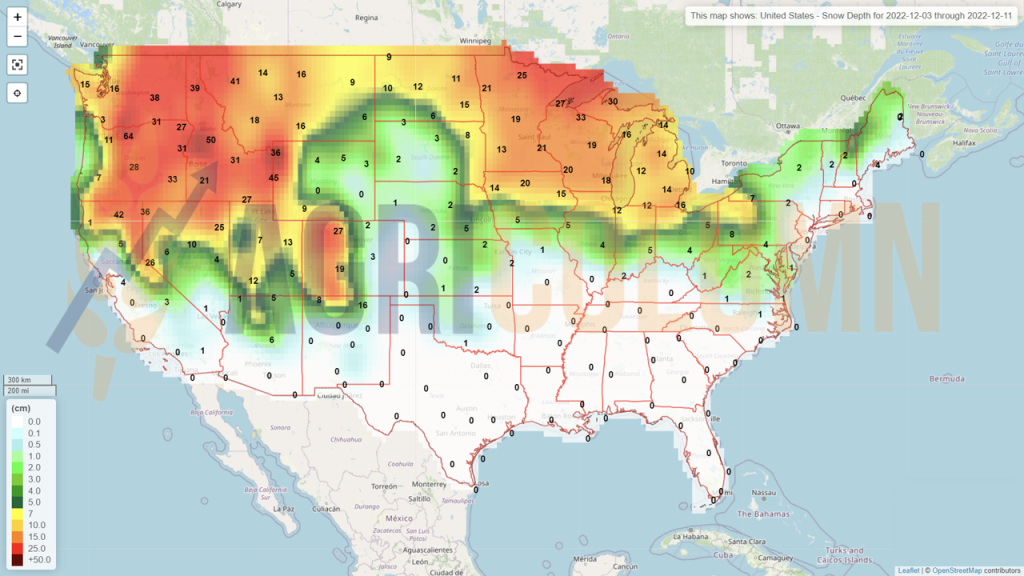
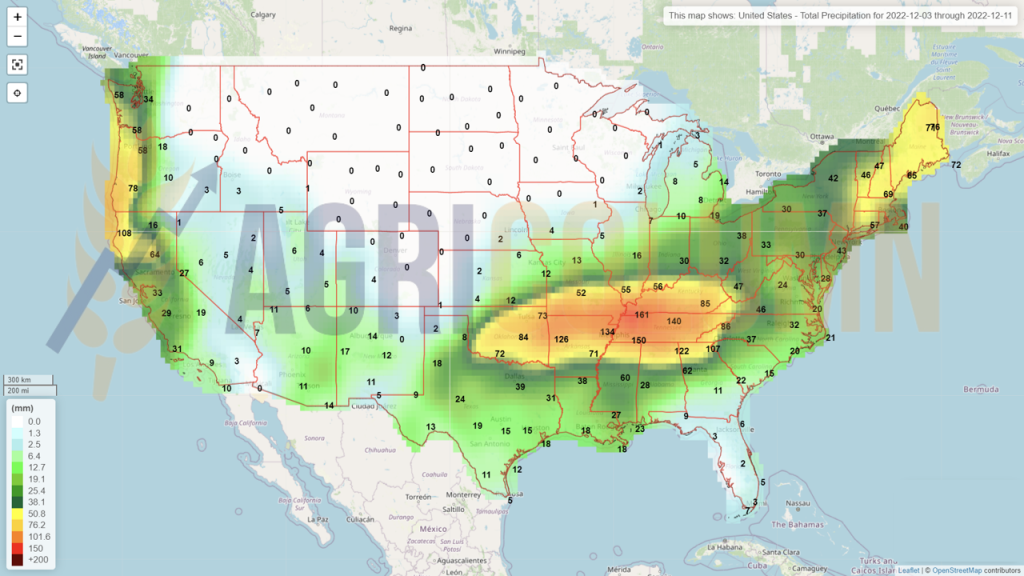
The USA gets snow and cold waves. American winter wheat areas are also mixed in the precipitation path. But blankets of snow are starting to cover American winter wheat areas, which is a very good sign for the crop. I’ve been saying in past reports that if American wheat gets the snowpack, it can recover. This is happening now, and vegetation conditions will certainly improve.
CANADA through StatsCan, the statistics body, penalizes the Canadian wheat crop by 1 million tons, compared to the estimate of 34.8 million tons carried out in September by satellite systems. Now Canada’s statistics based on farmer reports only generate 33.8 million tons of production.
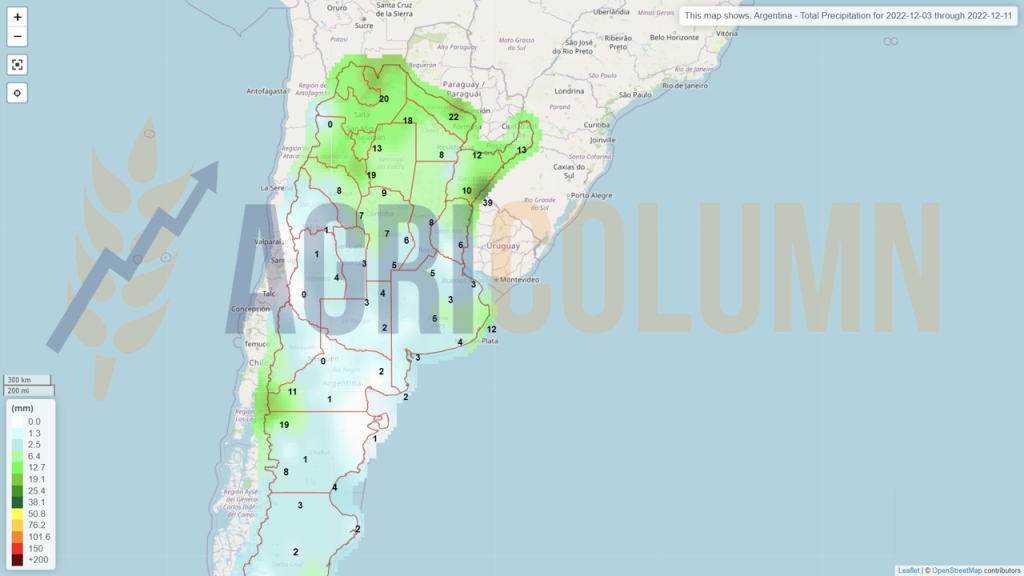
ARGENTINA. Argentina’s wheat production outlook is likely to face more cuts due to lower-than-expected yields, the Buenos Aires grain exchange said on Thursday, as the grain harvest advances amid a prolonged drought.
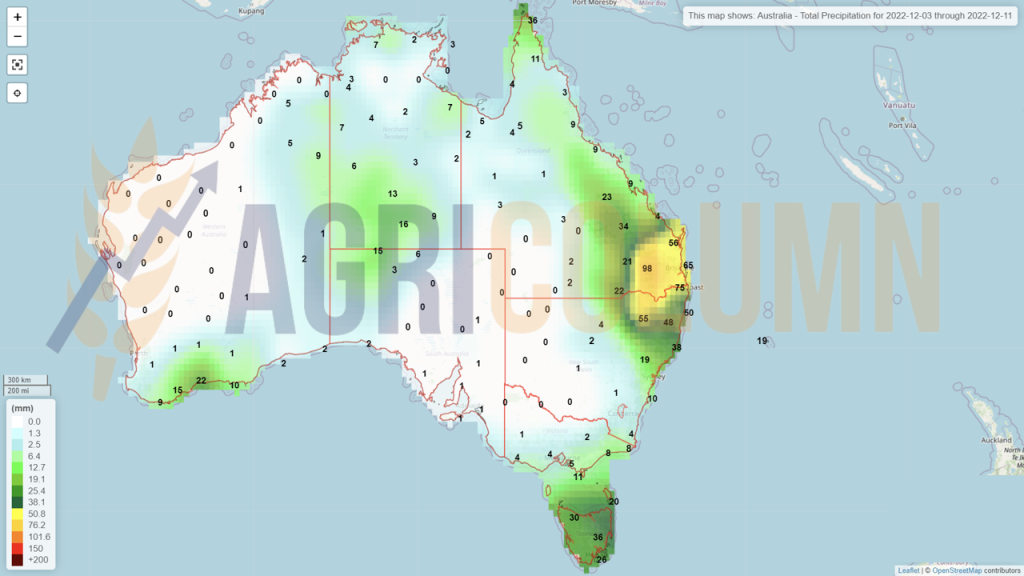
AUSTRALIA is in the same status, i.e., harvesting in full during this period, and the effects of Australian volume pressure are seen reverberating in the physical market by lowering the price level. There is wheat there, no matter how hard Russian analysts try to sell the idea that it is low-quality wheat. We all know it’s pure marketing for Russian wheat and nothing else.
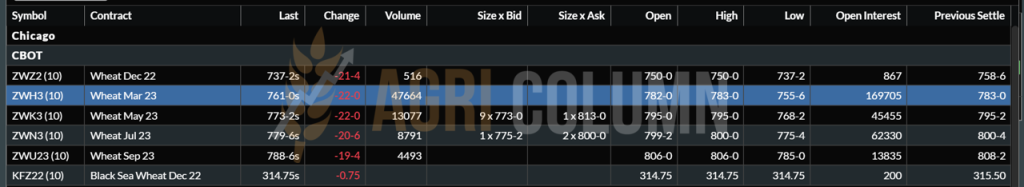
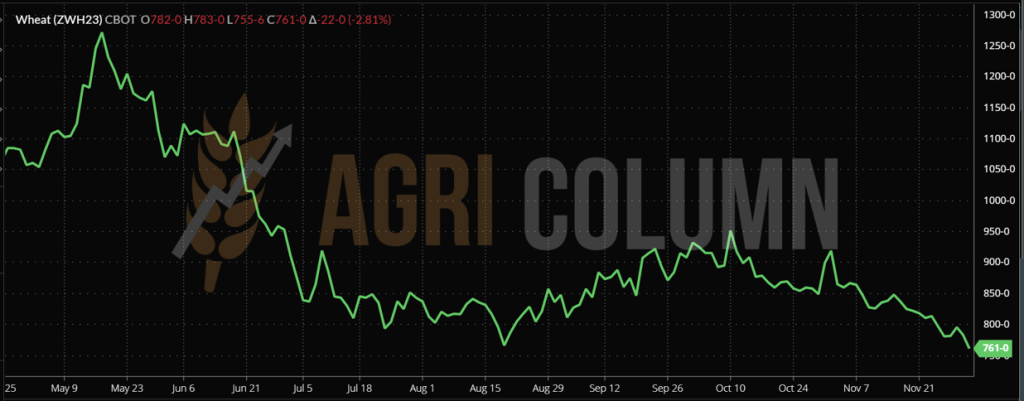
CBOT WHEAT – ZWH23 MAR23 – 761 c/bu (-22 c/bu = -8USD)
CBOT WHEAT TREND CHART – ZWH23 MAR23
WHEAT PRICE INDICATIONS IN MAIN ORIGINS

TENDERS AND TRANSACTIONS
TMO TURKEY purchased 465,000 tons of PRO12 wheat as follows:
- 195,000 tons for delivery December 7, 2022 to January 9, 2023 at an average price of 330-331 USD/MT;
- 260,000 tons for delivery January 6 to February 17, 2023, at an average price of 334 USD/MT.
Judging by the winners, it is Russian wheat that will be transported by small ships to the multitude of Turkish ports. The transportation cost is extremely expensive and can vary between 30-40 USD/MT. Effectively in Origin, the price will be 295-300 USD/MT.
TCP PAKISTAN purchased 915,000 tons of wheat on two price tiers related to the two cargo delivery ports, namely:
- 670,000 tons C&F Karachi at 372 USD/MT (Cereal Crop 130,000 tons, Agrocorp 120,000 tons, Aston 190,000 tons, GrainFlower 120,000 tons and FalconBridge 110,000 tons);
- 245,000 tons C&F Gwadar at 377 USD/MT (GrainFlower 100,000 tons, FalconBridge 100,000 tons, Aston 45,000 tons).
OAIC ALGERIA purchased about 420,000 tons of wheat at an estimated price level of 355 USD/MT CIF.
NO MORE GASC Tenders. The Egyptian Commodity Exchange has opened its doors in Egypt. The country is looking for new ways to supply grain. Egypt’s state-owned company GASC abandoned wheat procurement tenders and switched to direct contracts with suppliers. The first effects are seen in the Egyptian domestic market. On November 27, 2022 (the first trading session), 12,000 tons of Russian wheat from GASC reserves were traded at a price of 397 USD/MT. We take into account the latest purchase prices of 362 USD/MT C&F and see a significant margin.
CAUSES AND EFFECTS
The first move to yield was made by American wheat, which is showing much higher values than European wheat. This will generate more liquidity for European wheat as well. Destinations want cheaper freight, and the remaining window of time until the holidays will generate some emulation.
Exactly with the paragraph above I ended the column analyzing the causes and effects in the case of wheat in last week’s issue of AGRI COLUMN. And with it we begin, because it decisively marked the end of the week, guaranteeing our anticipations. Hedge funds had since Tuesday increased their bets on the market falling, reaching the highest level in the last 3 and a half years, with a value expressed in contracts of 53,400 lots (1 lot = 50 tons), a value not reached since May 2019 until today.
In practical terms, US wheat responded to the price pressure generated by the cheap commodity in the Black Sea basin. Competition from Russian wheat caused US wheat to respond with the massive decline we saw from November 30 to December 2, 2022.
On the European continent, the shock was also fully cashed in by Euronext. However, the decline was not as dramatic as the one on the CBOT. European wheat was anyway low in price compared to American wheat. Bets made by speculators on American wheat since the fall were based on two fundamental factors, namely: the crisis in Ukraine and the deficit recorded by the global market due to the lack of supply. Therefore, in the physical market, American wheat was extremely expensive and proved an acute lack of competitiveness.
Our expression that we have been using for about 2 months now finds its full coverage, namely that the Black Sea basin is flooded with Russian wheat. Yes, Russian wheat is gaining very significant volumes, tender after tender. But you must know that here it is not necessarily only about the price, but also about a very well-structured organizational discipline. Thus, Russia has more than 125 agricultural emissaries in the world and these people have a very clear mission to level the road for Russian goods. Basically, that’s what they do, they offer conditions for Russian goods. Nothing else, only with this objective they are tasked and nothing more.
In practical terms, Russian wheat saw no declines as reported levels. It is still positioned for 12.5 PRO quality at 310-315 USD/MT, while European wheat indications picked up a 5 USD/MT drop in FOB CVB parities (329 USD/MT, 12PRO), FOB France (333 USD/MT, 11.5 PRO), FOB Germany (338 USD/MT, 12.5 PRO) and FOB Poland (337.75 USD/MT, 12.5 PRO).
Last but not least, the reverberations of the FED weighed extremely heavily. The increase in interest rates extracted, one by one, large portions of cheap money from the mass of speculators. Over the past 8 months, we have been repeating about the FED effect and how it will generate the decrease by making money more expensive. However, we still have a drop ahead, namely that of December 2022. The FED will generate another rate hike meeting and the median estimates are for a 0.5% increase, which will cut another important proportion of the money destined for speculation scholarships.
The most affected were the farmers, who did not have the courage to follow our advice to sell the goods. Our arguments were extremely correct: volumes in the Black Sea basin, associated with France’s avant-time selling, along with FED and European Central Bank actions to correct inflationary levels.
The world’s population must be fed, and the skyrocketing wheat prices were not rational, but only dictated by the regional crisis created by Russia by invading Ukraine. I was saying that Putin is to blame for the price difference between 260 and 380 USD/MT in the Black Sea basin. The latest developments of the crisis justify this sentence.
The habit is second nature, and we see how, with the onset of winter and the somewhat freezing of the conflict, the price of wheat drops. The grain corridor extended by another 120 days also had its role. The guarantee of continuity provided by it has enabled the movement of goods, which, even if at reduced levels, exists. Most of the Ukrainian goods go to Europe by barge through Sulina and by land traffic.
January will generate some effervescence, but as we move past mid-February, we’ll see levels of new crop awarded at the price of old crop, with the caveat that Russia can ignite everything at any time. But we are not military analysts and we do not want to claim things that do not belong to us.
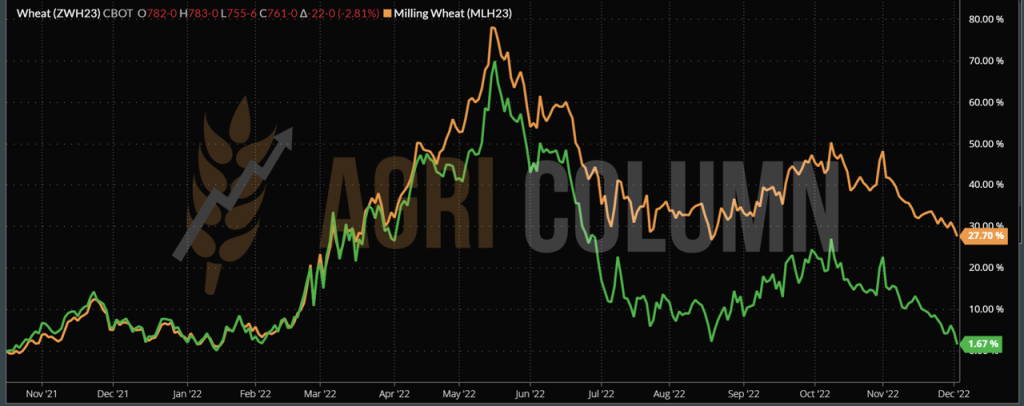
And at the end of the causes and effects column, we insert the EURONEXT and CBOT comparative route, to be able to see where we left in DEC21 and where we find ourselves in DEC22. European wheat is highlighted in orange.

LOCAL STATUS
The feed barley price indications in the CPT Constanța parity are decreasing compared to last week, to the level of 257 EUR/MT.
TMO Turkey purchased the desired volume at a level of 305-309 USD/MT. It was the logistics that made the difference, depending on the Turkish port of delivery. From the names of the participants, we estimate that it is a lot of barley from the Black Sea basin, Russian and maybe some Ukrainian.
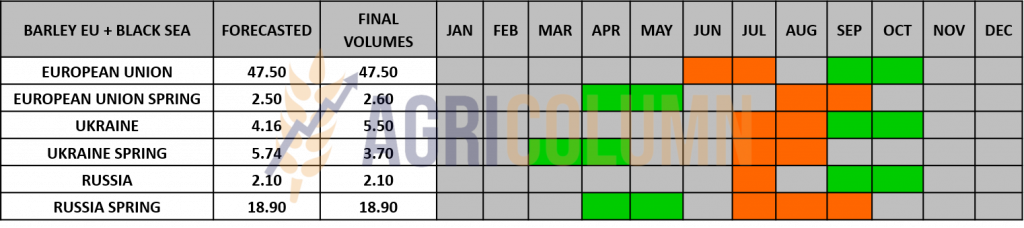
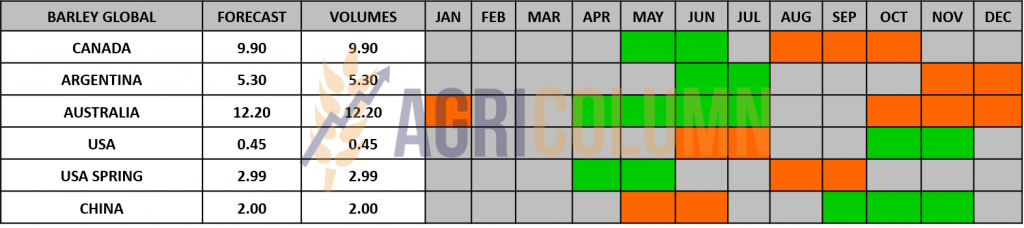
BARLEY PRICE INDICATIONS IN MAIN ORIGINS

GLOBAL STATUS

LOCAL STATUS
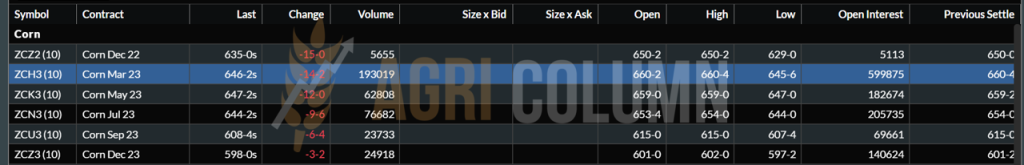
Indications of corn in the port of Constanța decreased subsequently to wheat, to the level of 260 EUR/MT, but, depending on interest, we also saw more generous quotations, up to around 265 EUR/MT.
Romania generates a final figure of only 8 million tons. The harvest is nearing the end and we estimate a crop of 88% nationally. The quantity is sufficient to cover the needs of the domestic market, and if we add the more than 500,000 tons coming from Ukraine, we have a sufficient volume to feed the export as well, timidly, indeed, but it exists.
REGIONAL STATUS
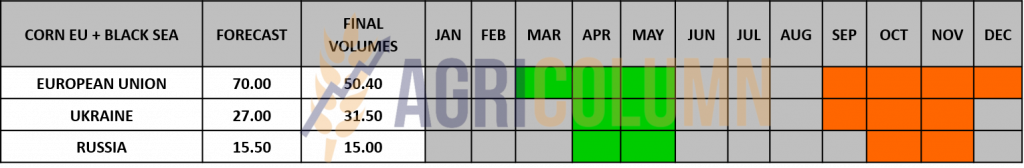
UKRAINE reached a harvested volume level of 15.5 million tons. Very behind compared to last season, when in the same period they harvested about 24 million tons. Ukrainian corn prices in the FOB POC parity (Pivnyi-Odessa-Chornomorsk grain corridor) are at the level of 252 USD/MT, while the price in the CPT parity is only 207 USD/MT.
The EUROPEAN UNION is out of season.
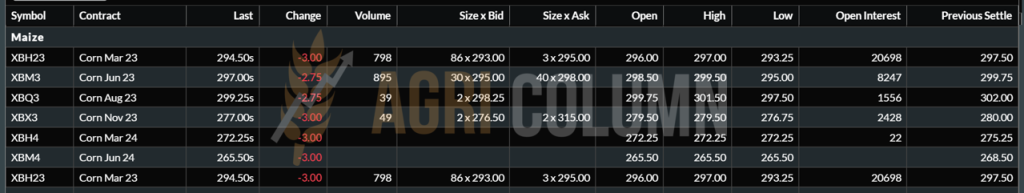
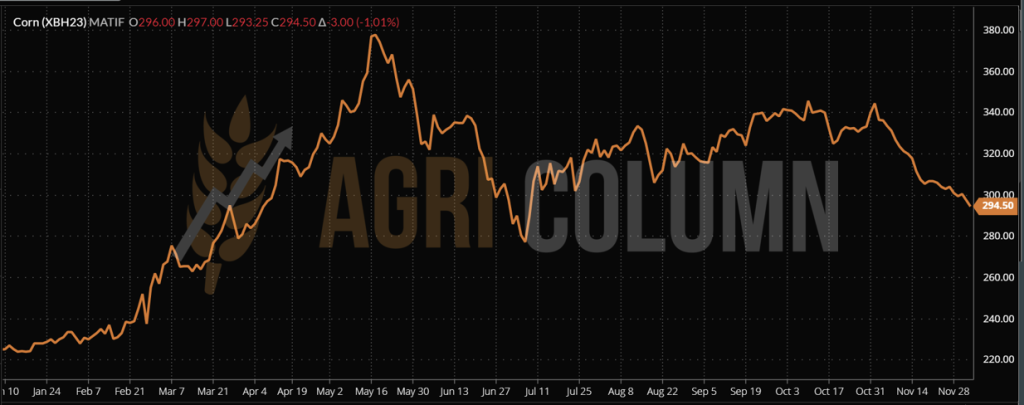
EURONEXT CORN – XBH23 MAR23 –294.5 EUR (-3 EUR)
EURONEXT CORN TREND CHART – XBH23 MAR23
GLOBAL STATUS
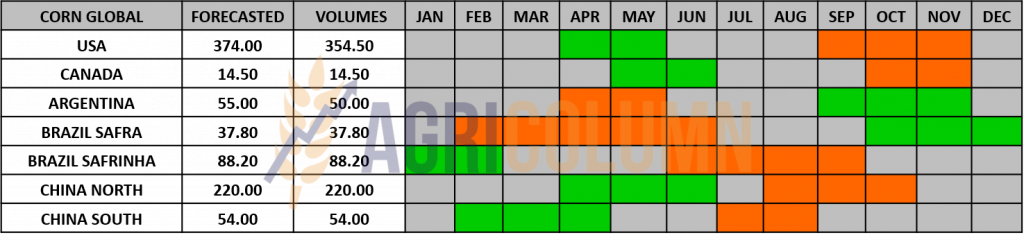
ARGENTINA. We have the same delay in sowing corn. The progress reached 23.6% of the allocated area, compared to a level of 37% in the average of the last 5 years. It is not an unrecoverable gap, but the sweltering heat of 40 degrees Celsius is not gratifying, in the absence of precipitation. NOAA predictions also point to February 2023 as a La Nina month.
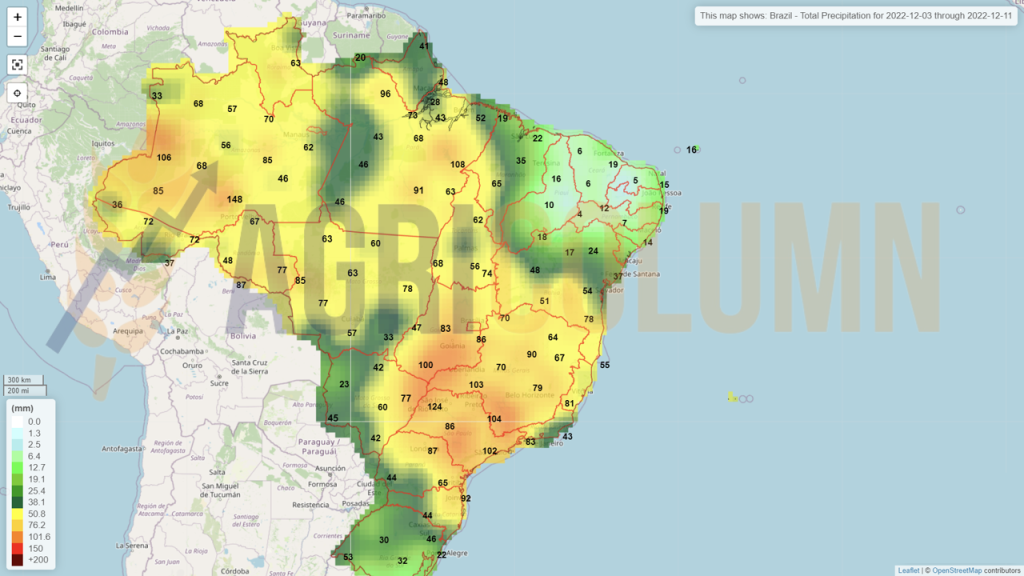
BRAZIL advances in HARVEST. The Brazilian pace is good, but in Rio Grande del Sul, the rains have stopped and given way to heat. But there is no danger currently.
US is off-season, but the problems with Mexico point to strong bargaining with Agriculture Secretary Tom Vilsack, who met with Mexican President Andres Manuel Lopez Obrador on Monday to discuss genetically modified corn, a signal of how alarming he considers the Biden administration over Lopez Obrador’s plans to ban biotech corn and other biotech products by January 2024.
Amid growing concerns about a potential ban on U.S. biotech corn exports to Mexico, Vilsack said the Mexican president reiterated the value of corn imports to his country.
During the previous marketing year, Mexico bought 16.8 million tons of corn, keeping it the top export market for corn, with sales valued at just over $5 billion, according to the U.S. Grains Council.
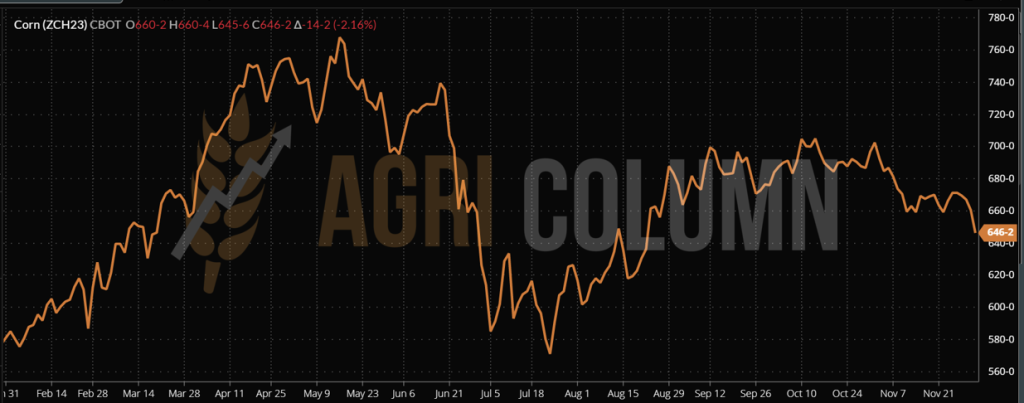
CBOT CORN ZCH23 MAR23 – 646 c/bu (-14 c/bu = -5.5 USD)
CBOT CORN TREND CHART – ZCH23 MAR23
CORN PRICE INDICATIONS IN MAIN ORIGINS

CAUSES AND EFFECTS
Corn is rallying the downtrend generated by wheat. But, unlike this one, it does not go down so radically. If we were to judge by percentage, we could say that corn loses only 50% of what wheat lost.
Ukraine moves very high volumes of goods through Sulina and land routes, but the weather will make this process very difficult. We estimate, however, that at this moment, the transfer routes are very well aggregated and a volume of about 1.8-2 million tons per month can be crossed through Romania, which represents an extremely generous level.
Russia has disappeared from the corn export landscape. Russian volumes are not offered for sale during this period, although with a harvest volume of 15 million tons, they have an estimated export level of 5 million tons.
What can be seen in the next period? Because corn is not a closed chapter.
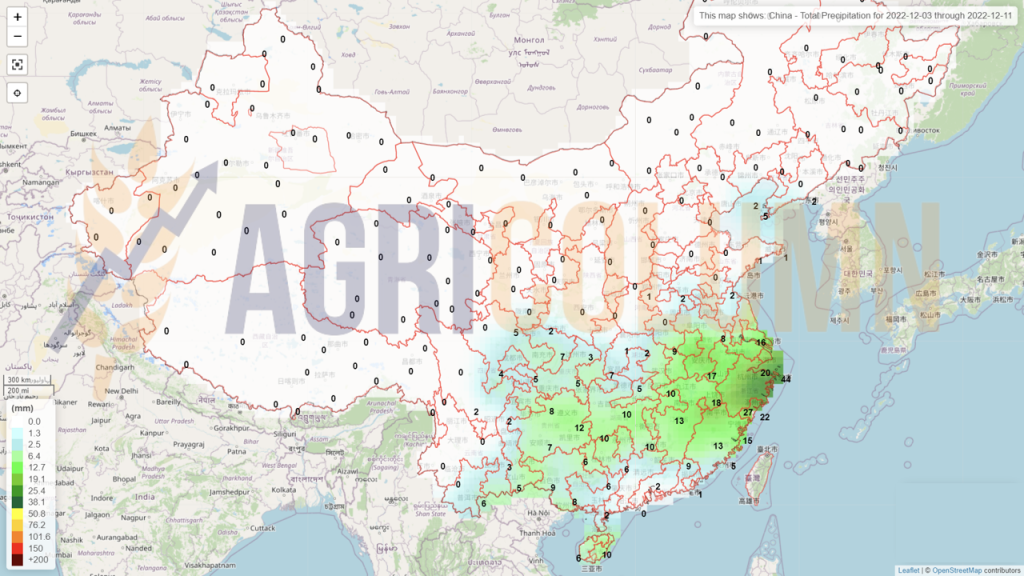
CHINA relaxes the lockdown conditions. Several major Chinese cities, including Beijing, have announced that they will cancel controls for COVID tests on public transport. Residents of Chengdu and Guangzhou are no longer required to show their test results when entering most public places. This should generate traction for corn as shipments will resume and demand for corn for industrial consumption should follow demand for fuel.
UKRAINE will generate uncertainty regarding the level of the corn crop. With a harvest volume level so far of 15.5 million tons, the findings lead to domestic estimates of 27.5 million tons. But when these volumes will come off the field is a question without a time horizon today. Winter, frost, moisture penalize harvesting in Ukraine.
SOUTH AMERICA will generate surprises, as always. The enthusiasm we see in this phase of sowing in Brazil may change radically if the rainfall does not generate confidence in the development of SAFRA corn. Argentina is already struggling with drought and sweltering heat that is penalizing seeding.
THE REGIONAL WAR. At any moment a crisis can be triggered, let’s not be fooled. Russia will not yield, and neither will the Anglo-Saxon allies. The stakes are extremely high, and Ukraine must win this war. There is a great deal of uncertainty here, despite the apparent calm.

LOCAL STATUS
Rapeseed indications comply with the FEB23 formula minus 20-25 EUR/MT for the goods delivered in CPT Constanța parity, but the processors increase the difference to minus 35 EUR/MT. Coverage is healthy right now, as we’ve estimated in past issues.
CAUSES AND EFFECTS
As we are used to, rapeseed correlates with the demand and, above all, with the indications of oil. In this sequence, we have nothing new from last week. Processing demand is covered and is the main driver of decline this period for rapeseed.
But from across the ocean are indications of the degree of use of vegetable oils in biofuels, which generates an obvious downward trend in canola, considering the connection with soybean oil, which received a mandate of only 1% from the EPA (US Agency for Environmental Protection). Thus, the price of soybean oil fell, followed by Canadian canola oil and, subsequently, European rapeseed oil.
Rapeseed does not have a favorable route in the next period, and we maintain this opinion.
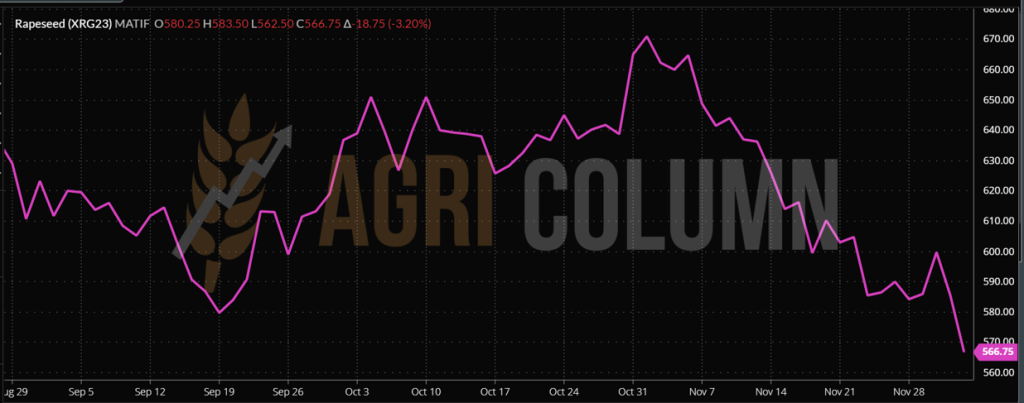
EURONEXT RAPESEED – XRG23 FEB23 – 566.75 EUR (-18.75 EUR)
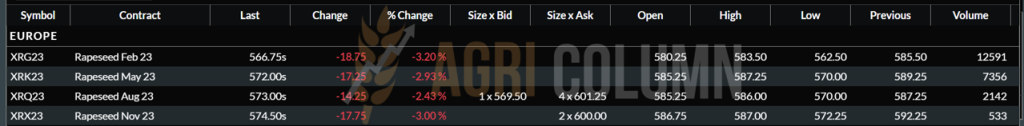
EURONEXT RAPESEED TREND CHART – XRG23 FEB23
GLOBAL STATUS
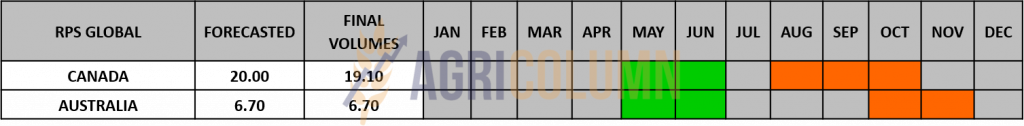
CANADA. StatsCan, Canada’s statistics body, is negatively revising canola production by 1 million tons, from 19.2 million tons in September to 18.2 million tons now.
AUSTRALIA is harvesting and acting as a pressure factor on the canola price.
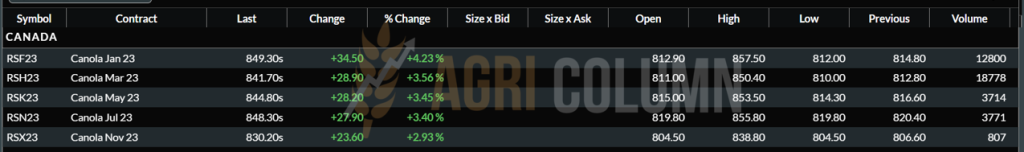
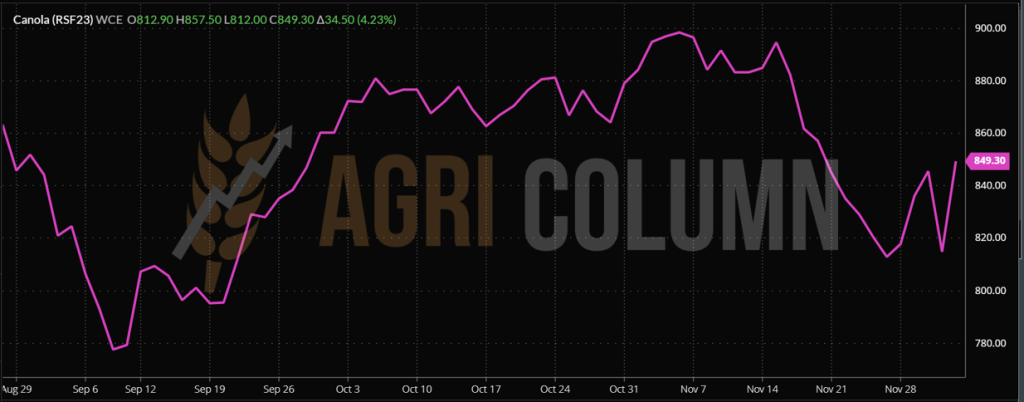
ICE CANOLA RSF23 JAN23 – 849.3 CAD (+34.5 CAD)
ICE CANOLA TREND GRAPH – RSF23 JAN23
COMPARATIVE GRAPH. PETROL-RAPESEED-CANOLA CORRELATION
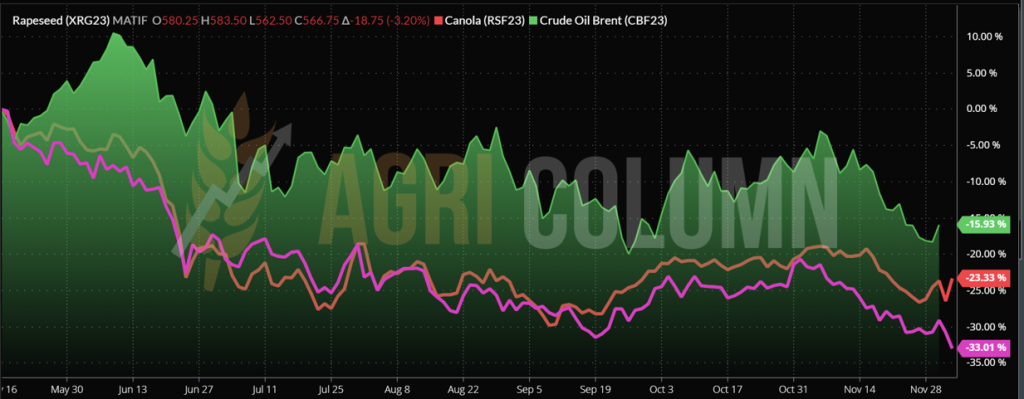
CAUSES AND EFFECTS
Prices fell by 2.8% after the US decision to increase the share of vegetable oils in fuel by just 1%. The decision by the US Environmental Protection Agency (EPA) to increase the share of biofuel use in 2023-2025 by only 1% disappointed traders, as a result soybean and canola quotes fell by 2.4-2.8%, and oil of soy with 6.8%.
The approval of canola oil in modern biofuels under the US Renewable Fuel Standard (RFS) program sent soybeans and soybean oil prices lower, even as refining volumes rose 17% in October.
Recall that EPA approved canola oil as a feedstock for renewable diesel, jet fuel, and other biofuels under the RFS program because greenhouse gas emissions from canola oil-derived fuel significantly exceed the 50% reduction threshold compared to fossil fuels.
It’s hard to predict how the EPA decision will change canola demand, but Canada will significantly increase canola oil processing in 2023-2025, which will reduce canola exports, especially to China, which, while not stable, is buying large lots.
January soybean oil futures in Chicago fell 6.8% to 1,485 USD/MT after losing 8.3% over the past week despite a 17.3% increase in processing US soybeans in October compared to September at 5.35 million tons, which is only 0.8% less than the record figure.
Euronext rapeseed fell under pressure from lower soybean and soybean oil prices, as the price of rapeseed oil will soon drop. The close occurred at the level of 566.75 EUR for the FEB23 indication.
And towards the close of the ICE Canola trading session, we saw a strong rebound in Canadian canola. Under the spectrum of a smaller crop and other factors we’ll list here, it gained 34.5 CAD.
EURONEXT being closed, it did not benefit, so we will see at today’s opening a recovery of the European rapeseed.
THE RECOVERY FACTORS are therefore the following:
- CHINA is easing lockdown conditions and by default we are seeing them quietly stock up on Australian and Canadian canola.
- A million tons missing in Canada means an impact. If we judge the size of the Canadian crop, it is about 5%.
- Canada will process a lot of canola and ship it to the US, so other destinations will see lower volumes than expected.
- But, in the future, at the European level, the demand will be dormant, pending the JFM stripe (JAN-FEB-MAR23).

LOCAL STATUS
Primary indications for sunflower seeds are 555-560 USD/MT in CPT Constanța parity. Bulgarian processors are quoting unchanged from last week at 575-580 USD/MT.
CAUSES AND EFFECTS
Today’s apparent calm will surely be short-lived. Lots are not offered for sale and liquidity is low. What is happening regionally today will have a serious setback starting from January here in Romania as well. Thus, we keep the estimate of the increase in the seed price level for the coming year, starting from January.
REGIONAL STATUS
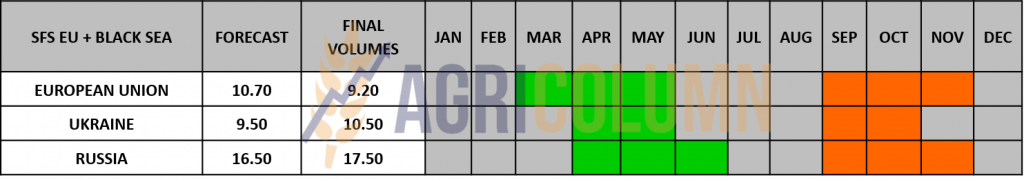
UKRAINE practically closes the harvest of sunflower seeds at the level of 9.8-9.85 million tons. There are rumors of a new export policy blocking VAT-free export. The cost of production in Ukraine is increasing due to logistics and electricity, and less supply of crude oil on the market is driving up the price.
RUSSIA temporarily stops harvesting at 13.3 million tons. Rain, snow, and frost make the harvesting operation no longer possible. We remind you that the official forecast from the beginning in Russia was 17.5 million tons, the recent one 16.3 million tons, and they stopped at 13.3 million tons.
The EUROPEAN UNION is in the off-season.
GLOBAL STATUS
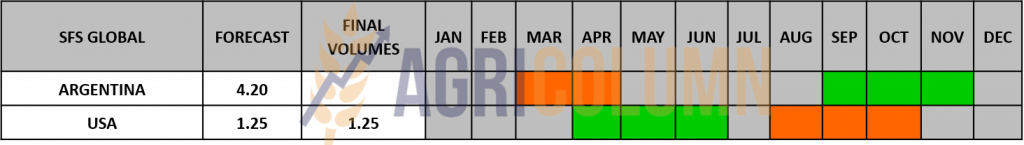
PRICE INDICATIONS FOR OILSEEDS AND CSFO IN MAIN ORIGINS

CAUSES AND EFFECTS
The weak presence of sunflower oil from Ukraine on the world market contributed to the influx of demand for Russian products. In the first two months of the season (September-October 2022), the Russian Federation exported 344,600 tons of sunflower oil. This level is double that of the same period last year.
Market participants explain the increase in exports by the increase in production of sunflower oil this season, as well as by favorable conditions: attractive world prices, zero export taxes and a reduction in offers from Ukraine.
But we are already seeing rising price levels at the local Ukrainian level. Large trading and processing companies are raising prices by 35-40 USD/MT. The reduced level of processing granted with reduced production generates a higher level for the raw material.
Also, the law that stipulates that a guarantee of 15% of the value of the exported goods must be submitted for exports exempts crude oil exporters from the obligation.
We are effectively witnessing a competition between Russian and Ukrainian oil these days. But Ukraine’s energy grid is badly damaged and will not be able to generate enough processing for the European Union. The raw material will have to take the path of export and, given that Ukrainian farmers do not sell the goods at a reduced level, we will witness future increases in the price level in Romania and Bulgaria, the main processing sources of the Union. Also, the raw material will have to cross overland and through Sulina to the European Union. We must not forget the production imbalance of the EU-27.

LOCAL STATUS
In Romania, the price indications for soybeans are at the level of 500-505 USD/MT DAP processing units for non-GMO soybeans. Between July 1 and November 20, 2022, approximately 130,000 tons of soybeans were imported.
REGIONAL STATUS
Weekly soybean imports fell to 110,986 tons. The total import of soybeans by EU countries since July 1 increased to 4.27 million tons, which is a decrease of 16% compared to last year.
Weekly soybean meal imports to EU countries fell to 217,799 tons, with a total of 6.54 million tons.
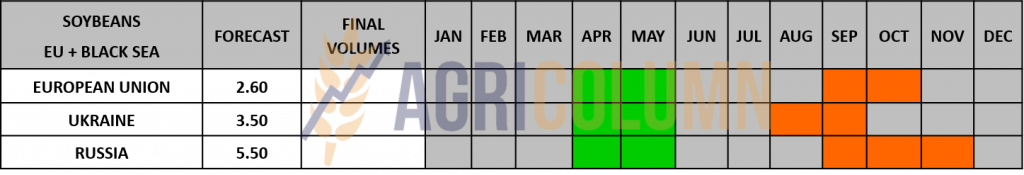
GLOBAL STATUS
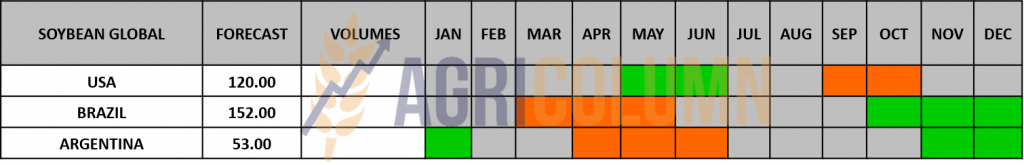
USA. Weekly net US soybean export sales reached 693,800 tons as of Nov. 24, according to the USDA, but analysts had expected net sales of between 550,000 tons and 1 million tons. China remained the main destination for soybean sales, receiving 927,400 tons, including 524,000 tons swapped from unknown destinations and a decrease of 70,200 tons.
Weekly soybean exports were down from the previous week at 2.1 million tons, mainly to China (1.5 million tons), the Netherlands (219,900 tons), Spain (95,100 tons), the Great Britain (66,000 tons) and Mexico (55,800 tons).
BRAZIL. Soybean planting is almost complete in the Brazilian state of Parana, as it reached 96 percent planting by November 28, according to the state’s agricultural agency, Deral. Last year, planting was almost complete and covered 99% of the planned area. Crop conditions remained stable, with 93% of areas considered good, 6% of areas considered average and 1% of areas considered poor.
Soybean production in Parana is estimated at 21.4 million tons, up 78% from last year’s total production of 12 million tons, on an area of 5.7 million hectares.
In Brazil’s largest agricultural producing state, Mato Grosso, a seeding rate of 99.5% has been reached, according to the state’s agricultural institute, IMEA. Mato Grosso is expected to produce a record soybean crop of 41.8 million tons this season, according to the latest IMEA estimates.
ARGENTINA. Soybean planting in Argentina advanced and reached 29.1% of the 16.7 million hectares planned for the 2022/23 season. Despite some rainfall during the week, the lack of surface moisture continued to affect the progress of the signed, and the pace is 17.2% behind last year, according to information from the BAGE (Buenos Aires Grains Exchange) crop update report.
BCR estimates a soybean crop in Argentina of 32-47 million tons, depending on weather conditions. Argentina’s 2022-2023 soybean production could be between 32.1 million tons and 46.7 million tons. Argentine farmers are worried about drought conditions in what will be the third straight year of La Niña, as the weather phenomenon tends to reduce rainfall in most of the South American country’s agricultural areas.
Last week, the “dollar-soybean 2” program came into effect. The new system will be in place until the end of the year and sets soybean sales at a preferential exchange rate of 230 pesos to the dollar, compared to an official rate of around 165-166 pesos to the dollar. Soybean sales rose, with farmers selling 869,320 tons of soybeans in the first two days of the program, but values remained below the volumes recorded in the first days of the original exchange program in September, according to Agriculture Ministry data analyzed by the Rosario grain exchange (BCR).
Argentine farmers sold a total of 13 million tons of beans under the previous scheme in September and now have about 12 million tons of old-crop soybeans still unsold. The somewhat limited volume of soybeans that farmers still have on hand isn’t the only reason participants expect the pace of new sales through the end of the year to not be as brisk as in September. Farmers are still uncertain about the current weather conditions that have delayed the 2022-2023 soybean planting, and if the weather conditions do not turn favorable, the sale of soybeans by farmers will be slightly slower.
CHINA. Soybean volumes processed in China rose sharply by 450,000 tons to 1.98 million tons, up 29.41% in the week to November 29 from the previous week, according to data from the National Cereals Information Center and Oil (CNGOIC). With the pace of soybean import arrivals picking up, CNGOIC expects processing volume to increase further, forecasting a volume of 2 million tons this week.
Soybean stocks at China’s main soybean processing plants also rose as import arrivals outpaced consumption, rising 1.75% to 3.48 million tons.
Soybean imports are expected to increase further with the completion of the US soybean harvest and the implementation of the dollar-soybean 2 policy in Argentina.
Soybean meal stocks reversed their downward trend and rose 22.22% to 220,000 tons last week, for the first time after a 4-month decline, amid increased processing levels. The level was still 4.34% lower than last month and more than 50% lower than last year’s 510,000 tons.
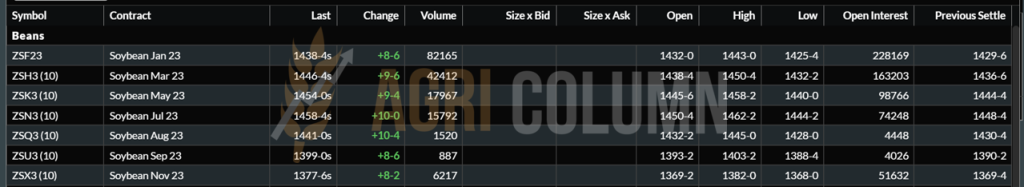
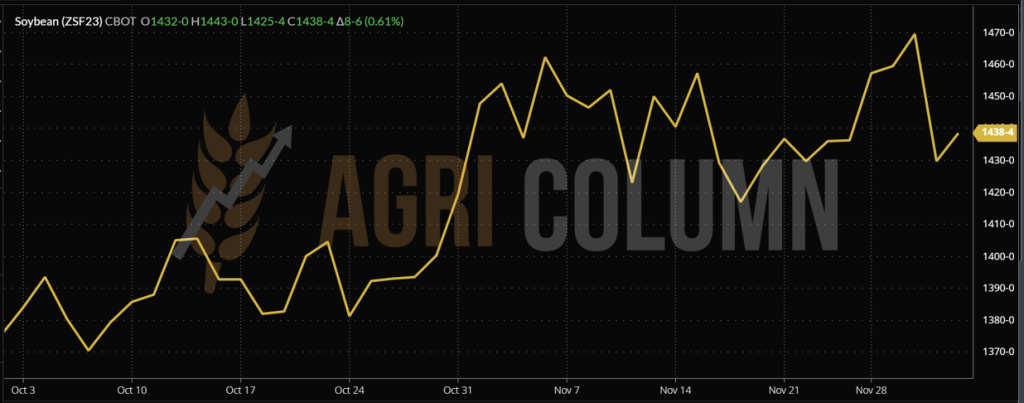
CBOT SOYBEAN ZSF23 JAN23 – 1,438 c/bu
CBOT SOYBEAN TREND CHART – ZSF23 JAN23


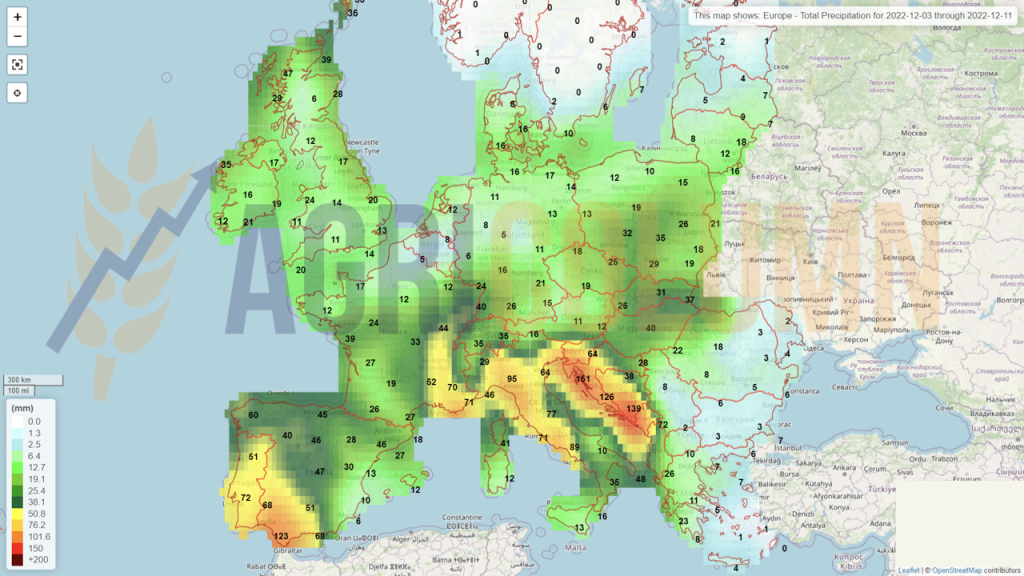
4-11 December 2022
Romania (rain)
Europe (rain)
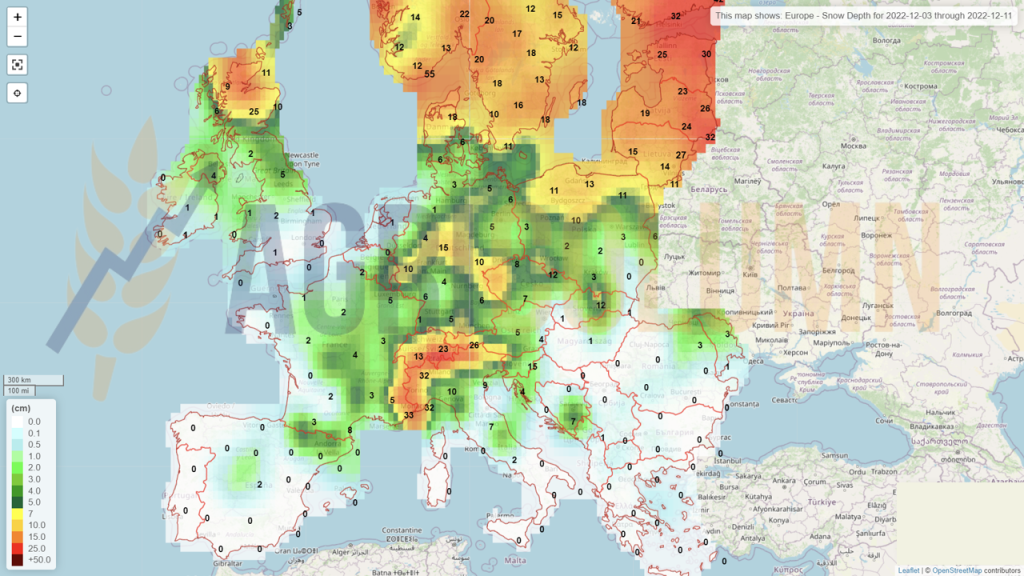
Europe (snow)
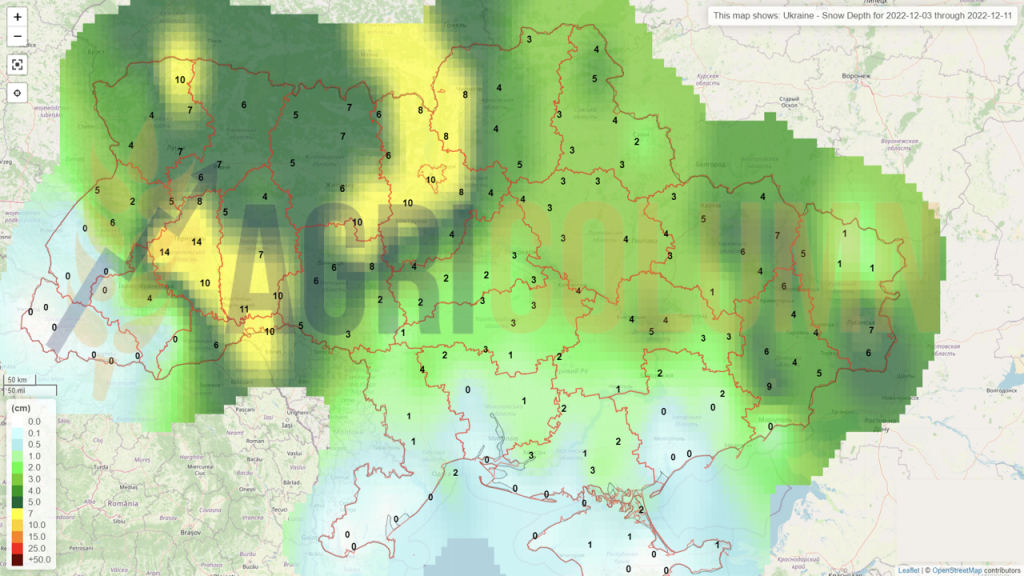
Ukraine (snow)
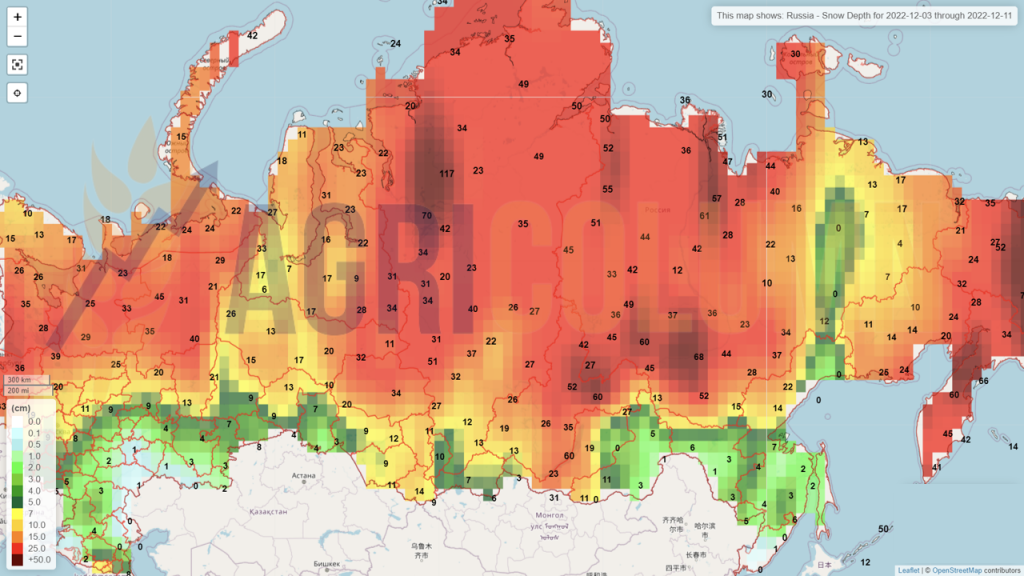
Russia (snow)
USA (snow)
USA (rains)
Brazil (rains)
Argentina (rains)
China (rains)
Australia (rains)