This week’s market report provides information on:
SUSPENSION OF THE GREEN CORRIDOR
CONSIDERATIONS AFTER RUSSIA’S DECISION TO SUSPEND THE CORRIDOR, FOLLOWING THE EVENTS OF OCTOBER 29, 2022, REGARDING THE UKRAINIAN ATTACK ON SHIPS IN SEVASTOPOL
Russia through the Ministry of Defense announced the suspension of the agreement regarding the “grain corridor”. This announcement came hours after Ukrainian water drones attacked Russian ships docked in the port of Sevastopol. Russia denounces a combined attack carried out with the help of Great Britain and thus reserves the right to SUSPEND the Istanbul deal.
Also on October 29, 2022, Russia announced that it would ship 500,000 tons of wheat to poor countries in Africa, to try to eradicate the potential for famine as much as possible, under the given conditions.
Following this announcement, we were trying to unravel the effects and causes that led to this.
Russia had for a very long time been dissatisfied with this Istanbul agreement, in the sense that its written demands had not been fulfilled. And we all know that the agreement signed by Russia with the UN and Turkey as a broker has never been seen by anyone except the signatories, Sergei Shoigu from Russia and Antonio Guterres from the UN.
But knowing the Russian negotiation system and knowing the sanctions imposed on the Kremlin regime, we believe that Russia has asked for no more and no less than the lifting of sanctions on banking transactions resulting from trade in wheat and agricultural products, as well as lifting the sanctions applied to fertilizer companies, in this case the Russian oligarchs who own them, for example Uralchem.
Russia has no role in the agreement signed by Ukraine with the UN and Turkey as a broker, as it is not a signatory party. That agreement has the power to continue beyond its expiration on November 22, 2022, unless terminated by either party.
Russia has been trying for a very long time through various statements and signals to reclaim its written claims in its Istanbul agreement. But the EU and Anglo-Saxon allies didn’t even want to hear about such a thing. From the perspective of the EU, it is simple and clear. The Union was not a party to that negotiation, only Mr. Guterres from the UN. Then let Mr. Guterres solve your written demands together with Mr. Erdogan, the mediator of the agreement.
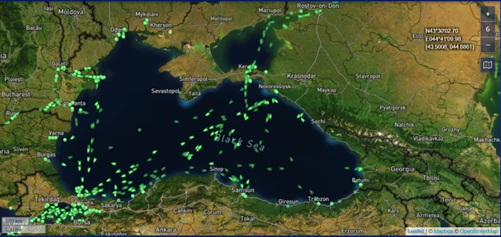
Russia has effectively sabotaged the grain corridor by being extremely slow in carrying out inspections of goods being escorted to Istanbul. There was a traffic jam of about 150-160 ships waiting to be inspected and pass through the Bosphorus. Source: Marine Traffic.
Turkey was and is a beneficiary of the corridor formed by the three ports, Pivnyi, Odessa and Chornomorsk (POC).
Turkey benefited from Ukrainian goods at a highly discounted price, Turkey received significant sums of money for logistics and inspections from Istanbul. Turkey’s interest is therefore mainly financial, how else? Cheap wheat and corn, together with oil and sunflower seeds.
AFTER THIS BRIEF SUMMARY OF THE CAUSES, LET’S GO TO THE EFFECTS OF THE UKRAINIAN ATTACK:
Russia suspends the grain corridor, claiming escort ships were hit. And if we compare the 1,000 Iranian drones that hit Ukraine’s energy infrastructure to this maximum 10 drone attack on ships in the port of Sevastopol, the ratio is effectively ridiculous. Moreover, in the port of Sevastopol were Russian warships, withdrawn from the Ukrainian coast following the Istanbul agreement.
Russia, hours after the announcement of the suspension of the agreement, notified the UN through its Russian representative regarding the meeting of the Security Council on this topic. It is the first sign that the Ukrainian attack was for Russia only a “casus beli” or leverage for a negotiation, which we will return to below.
For now, Russia by clearly expressing “suspension” indicates some essential things:
- Russia wants to negotiate the lifting of sanctions on payment systems. Let’s not forget that Russia sells wheat to Pakistan in the barter system (fruits and vegetables). It sella 5 million tons to Iran against drones and missiles, as well as spare parts from the Renault factory in Iran and so on, including Afghanistan (what will they get in return? Lithium and possibly uranium), Saudi Arabia, Algeria, India, Lebanon, Libya, and many other destinations, some of them extremely obscure, like Syria.
- Russia wants to lift sanctions on Russian oligarchs who own fertilizer plants. Their stocks are extremely high and they have no outlet. The batches stored throughout Europe are literally frozen, they are not allowed to be traded. Any bank that sees a payment invoice for fertilizers of Russian origin clearly refuses it. Even through the satellites created in Kazakhstan, Turkmenistan and Uzbekistan, traces of goods are detected. And realistically speaking, the three countries listed above have an interest in selling their own production, not the Russian one, even if it is discounted by the commercial network of the Russian oligarchs. Yes, they can sneak indigenizing goods through their lots, but the volumes are not large. Fertilizers are produced using gas and phosphate rock. At the moment, gas is extremely low because Europe no longer needs Russian gas (winter stocks are secured), Russian fertilizers are in very large stocks, and they cannot trade them.
In conclusion: Russia wants to sell wheat and fertilizers. However, no one has imposed sanctions on these products. So they can’t talk openly about it. There are sanctions on payments and oligarchs, which Russia prefers to keep quiet.
Russia will not dare to openly bomb the three ports in the Corridor. Why? Because those three ports are under the agreement signed by Ukraine, the UN and Turkey. And the deal is still in place. The very phrase “suspension” leads to this scenario. Even if they wanted to bomb everything, they can’t do that, there are too many Turkish ships providing logistics, and frankly I haven’t heard of any Turkish ships falling victim to Russian mines or bombing since the invasion started. Turkey would be the last country Russia would want to upset.
UKRAINE. In the less fortunate case of Russia re-establishing the blockade in front of Odessa, they would have the resources to overcome this impasse as well. We are talking about the logistics routes created via Romania, Poland, and Hungary. Logistics routes from the mouths of the Danube on barges, rail and land transport routes are already formed and with a little opening and more attention, as well as by opening new crossing points, it will continue to export its goods. Hard, but they will. The European Union and Anglo-Saxon allies will provide all their support to Ukraine. They will not give in to Russian blackmail under any circumstances.
The big loser in this tension is Russia, which has been trying for a very long time to lift the sanctions mentioned above. And by slowly but effectively sabotaging the corridor, through political statements, through pressure exerted on the Ukrainian energy system to limit the effectiveness of oilseed processing, they directed the process to today’s moment. But when you buy Iranian drones and recruit reservists with the arcane, use Studebaker trucks from the Second World War, donated by the Americans through the Lend&Lease program, you are actually showing what you have become and what you are. You are, in fact, showing your impotence taken to high levels. Russia is stripped bare today and exposed. The nuclear threat is far from being carried out. Why? Simple, because all the Russian oligarchs, all of Putin’s politburo and all the corrupt in his system, including here the famous FSB, as well as the Russian army, through its generals, Shoigu, the clown Kadyrov and the infamous Prigozin, the owner of the Wagner group, all want a one thing namely: LIFE. They want to live, not kill themselves for Putin’s sake. And Putin wants exactly the same thing, LIFE. He is not a hero, he is a coward, a creation of Russian intelligence systems, and these people always walk in the dark, because they fear for their lives.

LOCAL STATUS
The indications of the port of Constanța remain constant at the level of 320-325 EUR/MT in CPT parity. The price of feed wheat is EUR 25/MT lower than the price of bread wheat.
In the country, at the processing level, the price indications are 317-323 EUR/MT, depending on the quality offered to the processing unit.
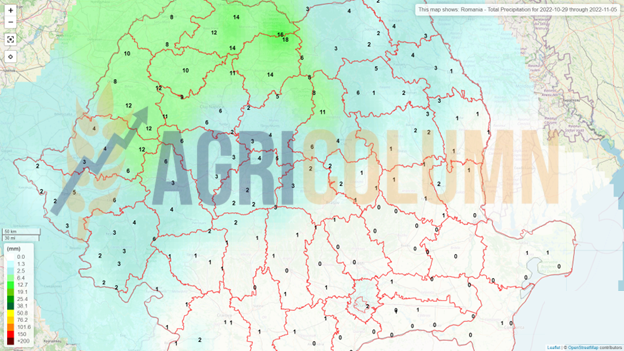
Also at the local level, sowing is still going on in certain areas of the country. And the target of 2.10-2.15 million hectares will be reached, for sure. But water is necessary, because the sprouted wheat is fragile and needs the presence of water for proper development before entering winter. The forecast doesn’t indicate anything on the horizon in terms of precipitation until around November 9-11. Then the precipitation front will enter from the west and hopefully have the strength to cross the Carpathian arc.
CAUSES AND EFFECTS
The only bullish factor for wheat prices may be a possible degradation of the Green Corridor. This is uncertain today, and the slowness of inspections that I also mentioned in the previous issue generates instability among Ukrainian exporters, who feel that they are losing a cadence in the export rhythm.
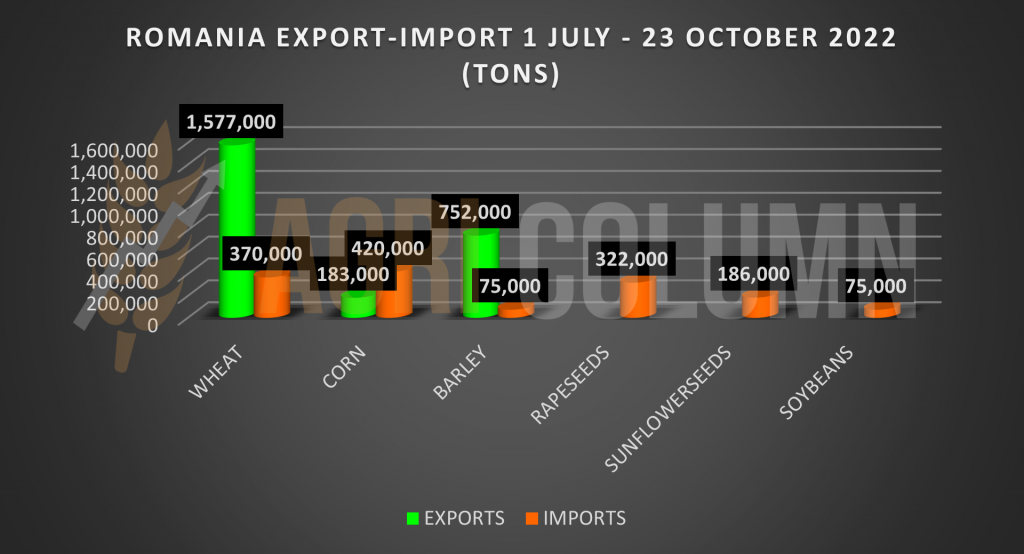
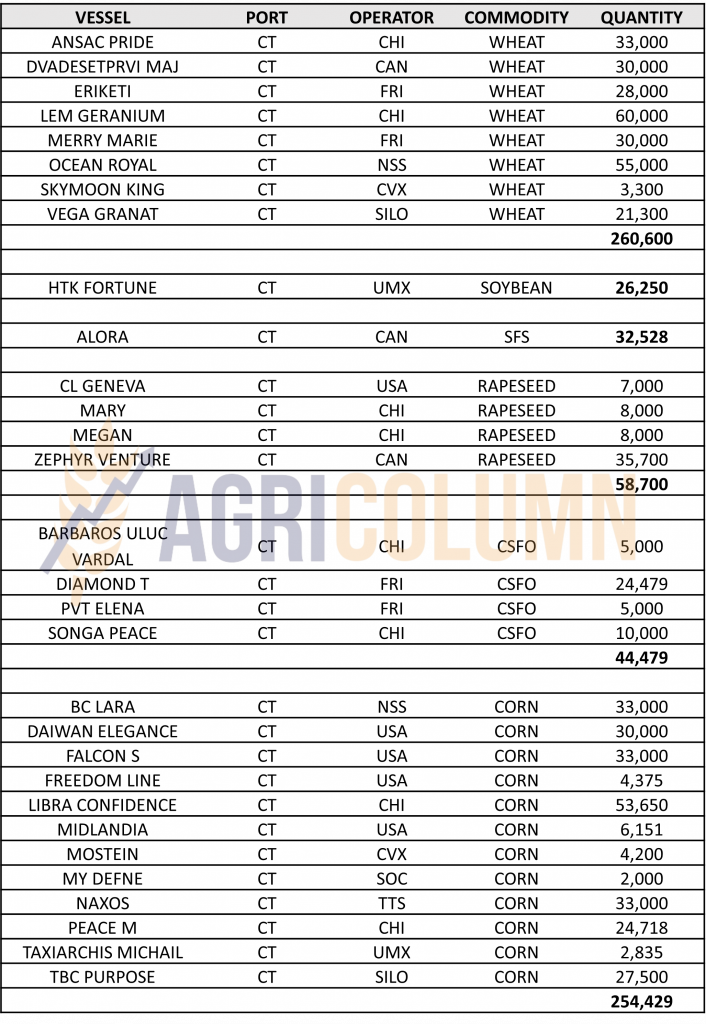
ROMANIA, at this moment, looks clearly unbalanced in terms of the level of wheat exports versus imports. We insert the balance on each product separately for a good visualization of the imbalance on certain products.
REGIONAL STATUS
RUSSIA is at the same accelerated rate of wheat export. Permissive weather still facilitates shipments of Russian wheat. In terms of sowing, things are clear, in the sense that they will leave unsown areas for spring crops in the rotation. However, they may be allocated to spring wheat, so the total area sown to wheat in Russia is not final. Now, we have a total of 18.8 million hectares sown, compared to the initial forecast of 19.5 million hectares. Their vegetation condition is very good due to the rainfall, as otherwise, because of the rainfall they have not been able to sow the allocated area.
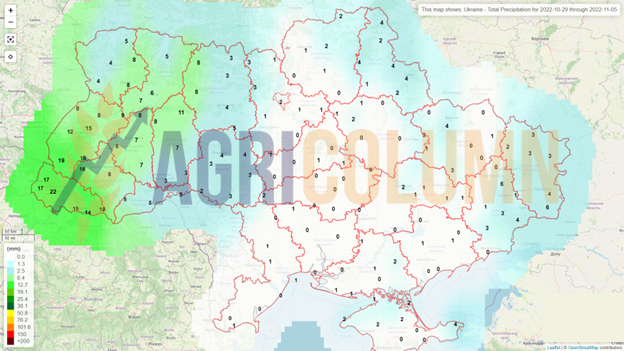
UKRAINE has managed to sow an area of 3.1 million hectares with wheat so far, which is about 80% of what was forecast, i.e. around 3.8-3.9 million hectares.
Amid talks that the “grain corridor” could be shut down in November, despite several auctions last week, Ukrainian grain was not widely offered and gained even less despite the low price. Many importers are looking for alternative origins. For example, Asian buyers have already increased their purchases of Australian wheat.
The pace of maritime exports slowed and a number of new contracts fell. The inspection procedure of ships heading through the “grain corridor” was also slowed down, which increased their downtime, reduced the number of requests for ships and consequently affected freight rates.
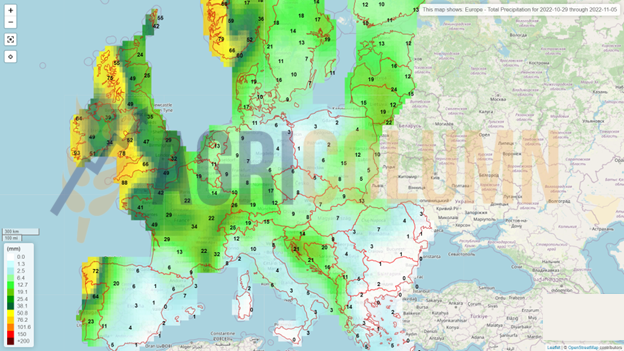
The EUROPEAN UNION shows a healthy vegetative index of wheat crops sown so far. The precipitation falling on the territory of the Union is beneficial and allows the development of wheat before entering the winter. At the level of hectares allocated to wheat cultivation, the distribution remains at the same level of 21.7 million hectares sown with wheat at the European level.
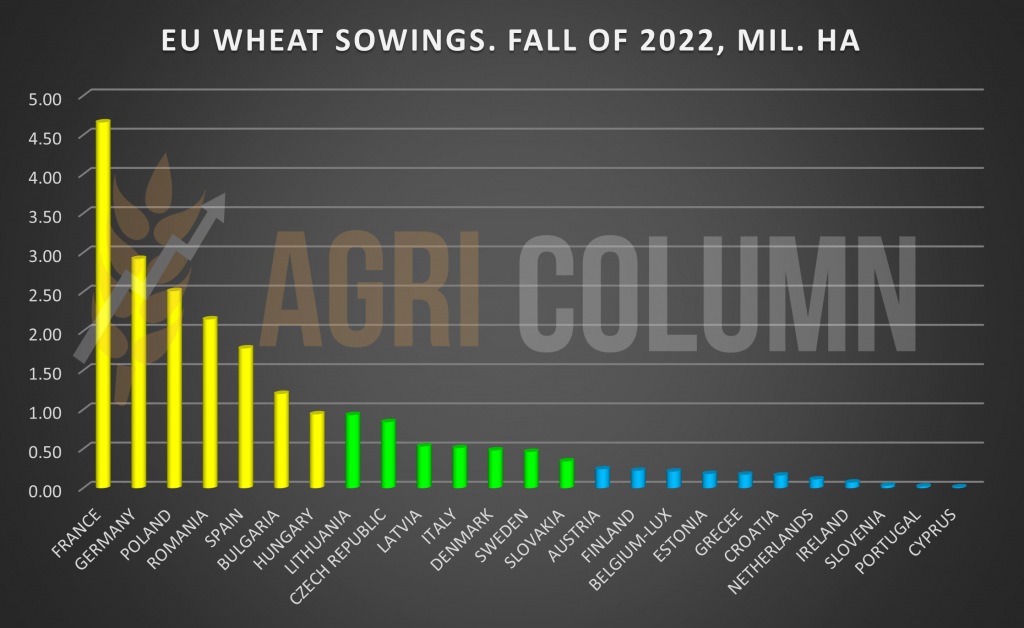
We insert the areas sown with wheat in the European Union segregated by Member States. Romania, as usual, has the 4th place in the European Union in the area cultivated with wheat.
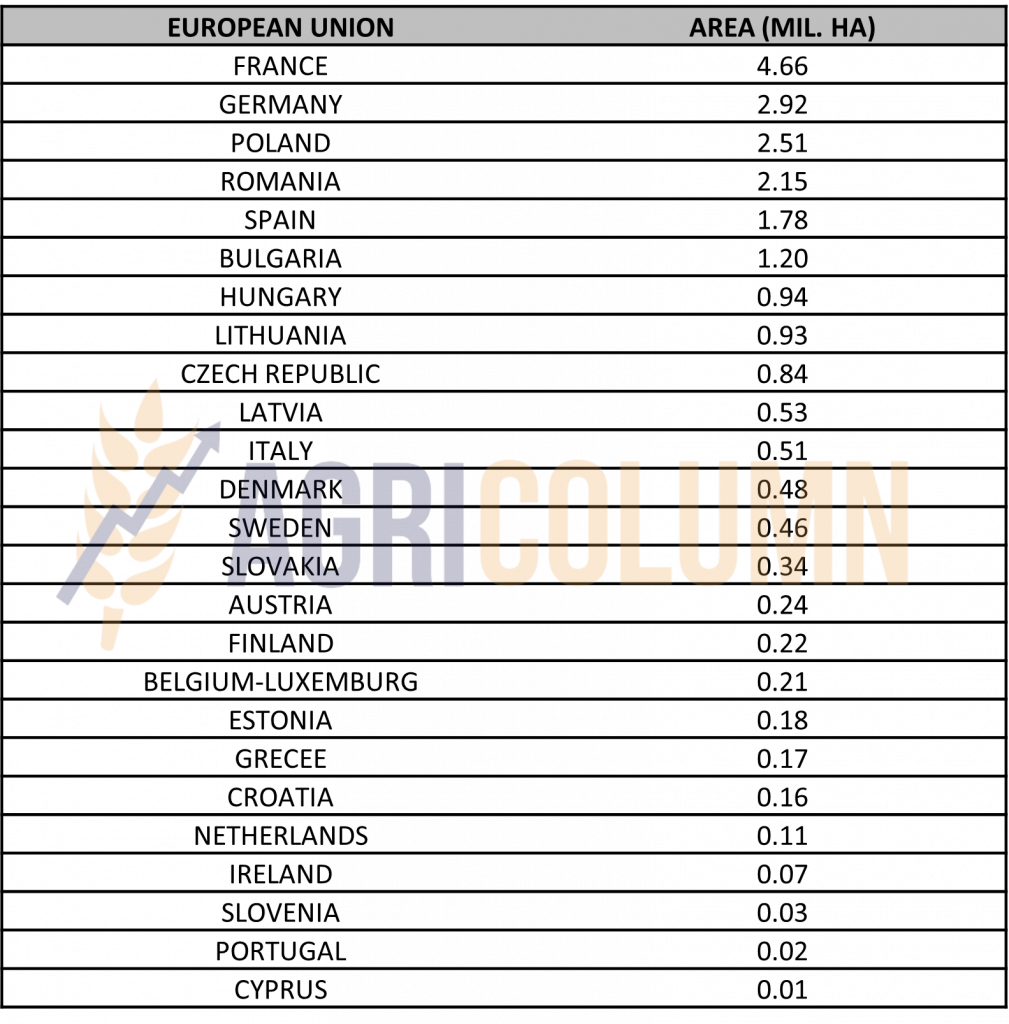
WHEAT SOWING CHART IN THE EUROPEAN UNION

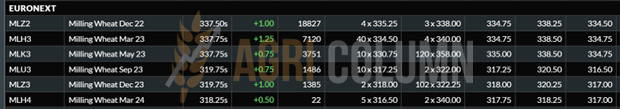
EURONEXT MLZ22 DEC22 337.5 EUR (+1 EUR)
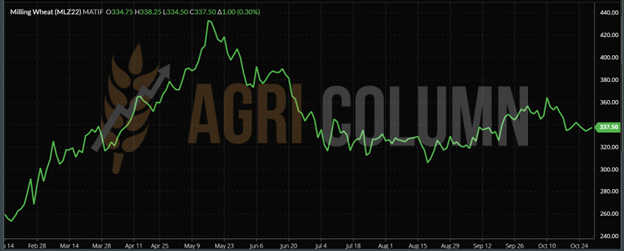
EURONEXT WHEAT TREND CHART – MLZ22 DEC22
GLOBAL STATUS
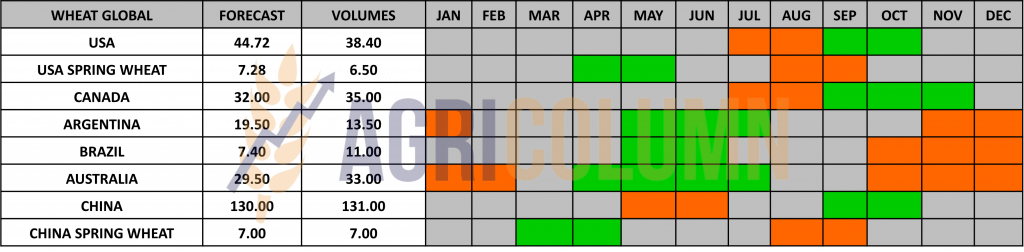
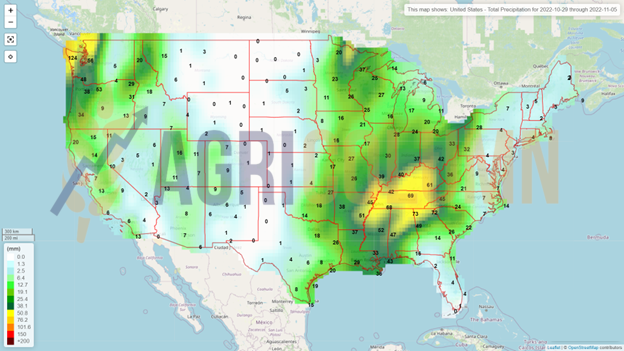
The U.S. is experiencing tremendous problems with wheat planted this fall. The Central Plains represented mainly by Kansas and Oklahoma have no healthy vegetation at all. Drought is already taking a bite out of the upcoming US wheat crop. According to analysts, 75% of US wheat is in the drought zone with a low reserve of soil water.
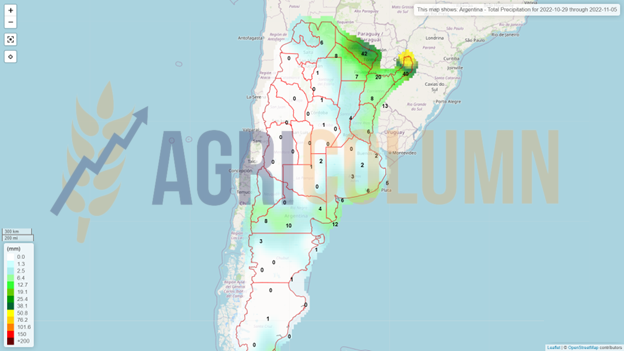
ARGENTINA drops production forecast dramatically. Subsequently, Argentina lowered the forecast from 19.5 million tons to 16.5 million tons. But this weekend, degradation has risen to very high levels, and according to local analysts, Argentina’s wheat production will be 12.5 million tons, a maximum of 13.5 million tons.
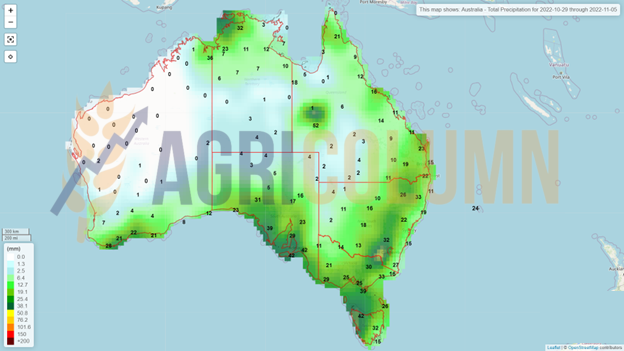
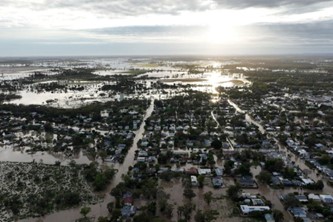
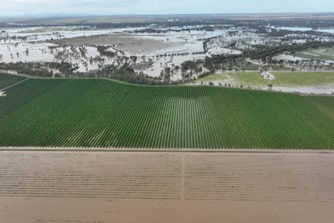
AUSTRALIA generates, in turn, very big problems, but because of the rains, which do not stop. About 120,000-140,000 hectares of wheat are irretrievably lost and the damage is in the order of 150 million USD. How will it all end? Quality and quantity? We will see together.
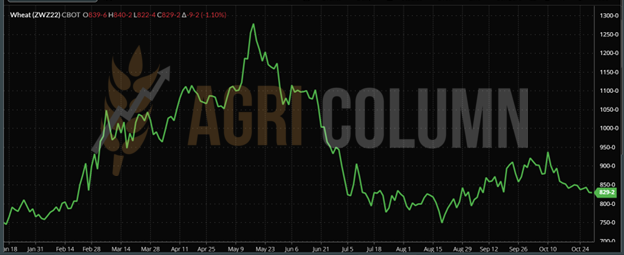
CBOT WHEAT – ZWZ22 DEC22 – 829 c/bu (-9 c/bu = -3.3 USD)
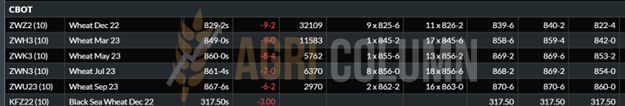
CBOT WHEAT TREND CHART – ZWZ22 DEC22
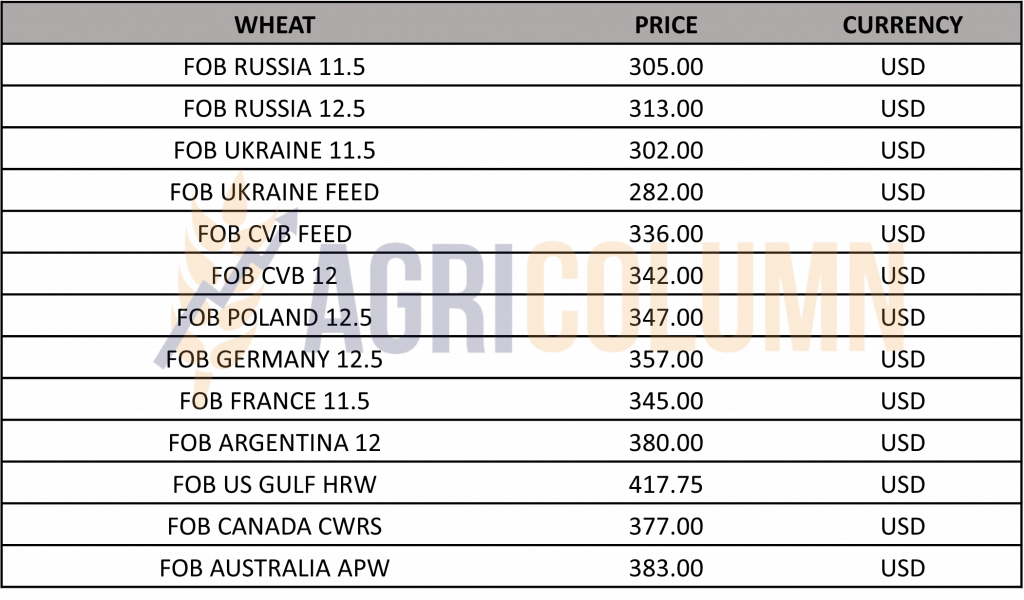
WHEAT PRICE INDICATIONS IN MAIN ORIGINS
TENDERS AND TRANSACTIONS
TURKEY TMO purchased 495,000 tons of wheat: 245,000 tons at an average price of 337.05 USD/MT and 250,000 tons, delivery November 25-December 13, at an average price of 341.65 USD/MT CFR Turkey.
SAUDI ARABIA SAGO purchased 566,000 tons of bread wheat, 12.5 PRO, for delivery in March-April 2023 at an average price of 384.75 USD/MT CFR. For Black Sea origin, the transportation cost is around 50-55 USD/MT. The difference is the port of delivery if it is in Jeddah or Yanbu. Thus, discounting the CFR price results in a level of 329.75 USD/MT FOB BLACK SEA. From this price we need to extract the costs of storage and financing of the goods until March-April 2023, about 20-22 USD/MT. This gives us a FOB BS price of 308 USD/MT. And finally, the cost of fobbing and the exporter’s margin must be extracted, at least 12-14 USD/MT. So the Black Sea equivalent indication is 294-296 USD/MT, provided the wheat is 12.5 PRO quality and clearly indicates Russian origin.
Sample from completed tender. Jeddah Port (CIF):
- 65,000 tons of wheat from CARGILL at 380.47 USD/MT CIF (March 1-10, 2023).
- 65,000 tons of wheat from OLAM at 378.25 USD/MT CIF (March 20-30, 2023).
- 65,000 tons of wheat from OLAM at 378.25 USD/MT CIF (10-25 April 2023).
MIT JORDAN purchased 60,000 tons of wheat from CHS at 372.75 USD/MT CFR AQABA, delivery in the first half of January 2023. The other bids were: Buildcom 374.50 USD/MT and Cargill 384.30 USD/MT.
TCP PAKISTAN. The lowest price offered in Pakistan’s tender for the purchase of 500,000 tons of wheat, which ended on Wednesday, was seen to be 373.00 USD/MT C&F. State agency Trading Corporation of Pakistan (TCP) is still considering bids and no acquisition has been reported. Offers submitted below. They must remain valid for 80 hours after submission. All bids involved wheat from multiple optional origins.
- Aston 120,000 tons at 373.00 USD/MT, CHS 125,000 tons at 384.40 USD/MT;
- Solaris 120,000 tons at 384.91 USD/MT, Falconbridge 120,000 tons at 387.79 USD/MT;
- Cargill 120,000 tons at 393.00 USD/MT, Ameropa 110,000 tons at 394.00 USD/MT;
- Agrocorp 110,000 tons at 397.38 USD/MT, Bunge 110,000 tons at 414.15 USD/MT.
CAUSES AND EFFECTS
Wheat consumes a technical end of the month in the stock markets. We are seeing declines in the CBOT these days, a clear sign of technicality, position liquidations and rollovers.
However, the tension in the Black Sea basin is in place. Nothing is decided yet. But Mr. Putin has the power to joke about the use of nuclear weapons, claiming that he only wanted to accumulate an effect and nothing more.
By diminishing Argentina and Australia, Russia will strengthen its position as the Primary seller (volume and quality). Russia will continue exports and is already strengthening its position in Asia. One by one, India, Pakistan, Iran ratified agreements for wheat deliveries against other agricultural products or armaments.
We have no illusions, Russia will not stop the invasion of Ukraine, it will only delay until the spring to restore its stockpiles of weapons and troops.
The weather helps Russia. If not for the problems in Argentina and Australia, Russian wheat would have suffered a price depreciation and, by implication, a drop in demand in certain destinations. But he has the lion’s share in Saudi Arabia, Pakistan, Iran, India and Turkey, destinations that buy extremely significant quantities at the moment.
The scenario where the corridor in Ukraine does not work can be considered, but there are too many problems that Russia would create if it stopped Ukrainian exports. First, their entire narrative of wanting the world to be fed would disappear. They would incur new sanctions on their ships and passage lanes to their destinations would be made more difficult.

LOCAL STATUS
The price indications of feed barley in the CPT Constanța parity did not experience any essential changes. They remain anchored in the area of 280-285 EUR/MT.
REGIONAL STATUS
UKRAINE has so far managed to sow a level of 0.39 million hectares with barley. Their forecast is 0.67 million hectares.
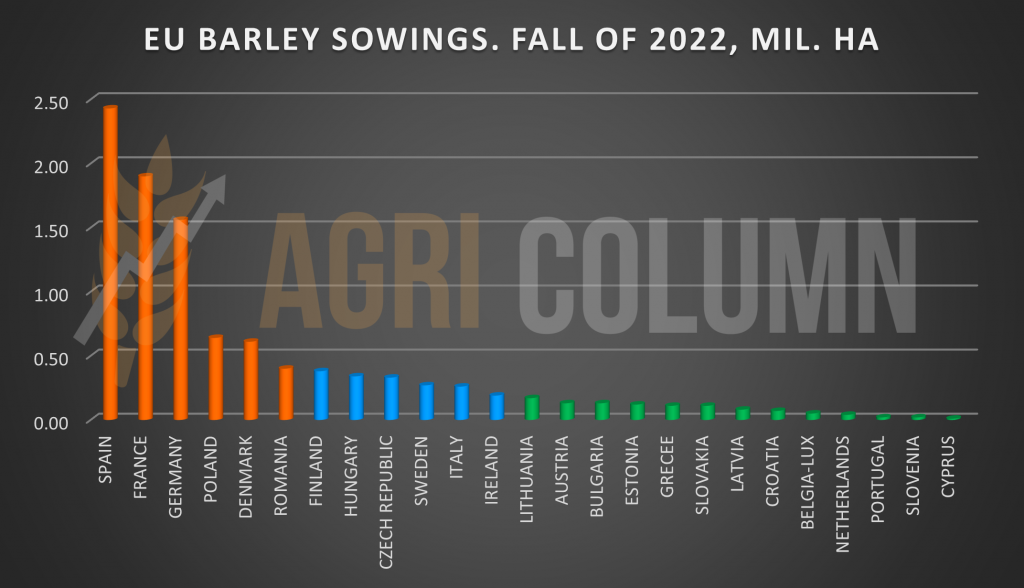
EUROPEAN UNION has a sowing figure of 10.37 million ha, in line with last season. Romania occupies the 6th position, according to the areas sown this autumn.
We insert the composition by country of the areas sown with barley.
WE ALSO INSERT THE EU BARLEY SOWING CHART
MIT JORDAN closes new tender with no purchase. The auction had 4 participants: Viterra, Olam, Ameropa and Australian Grain Export. MIT canceled its tender to resume this week on Wednesday for FH&SH March, FH&SH April deliveries. (FH = first half, SH = second half).
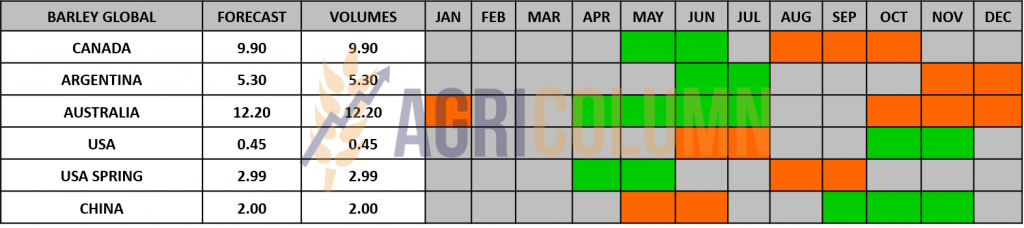
BARLEY PRICE INDICATIONS IN MAIN ORIGINS

GLOBAL STATUS
AUSTRALIA is experiencing problems right before the barley harvest and we will certainly see material changes in the volumes and quality of Australian barley.

LOCAL STATUS
Corn indications in the port of Constanța remain on the same platform of 295-300 EUR/MT. The port of Constanța, however, is quite crowded and storage spaces are less and less available.
CAUSES AND EFFECTS
Romanian corn continues its difficult path that it must take this season due to the drought that affected the volume. But support remains in terms of price. The price plateau is supported regionally by Ukraine and its volumes which have a touch of uncertainty related to the weather and keeping the green corridor open. The Istanbul agreement and its extension is the key to the future development of the corn price in Romania. But everything leads to a regional development of the corn price. The European Union has already increased the import estimate from 18 to 22 million tons.
REGIONAL STATUS
UKRAINE. Corn purchase prices fell last week at the western borders with Ukraine and for delivery to the port of Constanța. Prices were pressured by Ukrainian stocks and slowed seaborne exports due to concerns about the future of the “grain deal”. However, maize remains the key export crop and EU demand is stable, supporting prices. Moreover, the slow progress of the corn harvest limited the decline in prices. A total of 3.7 million tons left Ukraine only through the grain corridor.
Tender prices for delivery in November fell to 230-250 EUR/MT DAP on the borders with Hungary and Slovakia and to 225-240 EUR/MT DAP on the borders with Romania and Poland. Auction prices in the port of Constanța totaled 260-275 EUR/MT CIF.
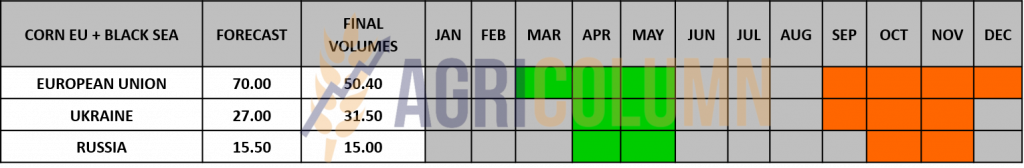
The EUROPEAN UNION is in the same status. With a disastrous crop of 50.4 million tons, it is relying on Ukrainian corn in the attempt to supply for feed use.
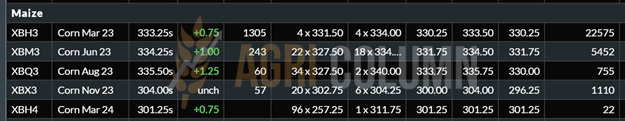
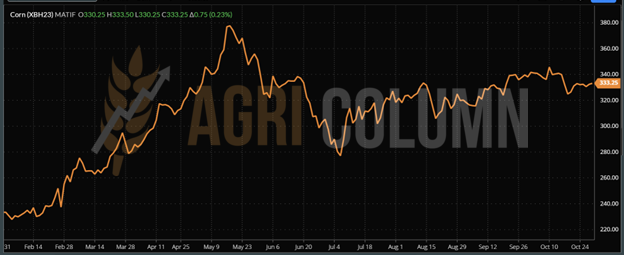
EURONEXT CORN – XBH23 MAR23 –333.25 EUR (+0.75 EUR)
EURONEXT CORN TREND CHART – XBH23 MAR23
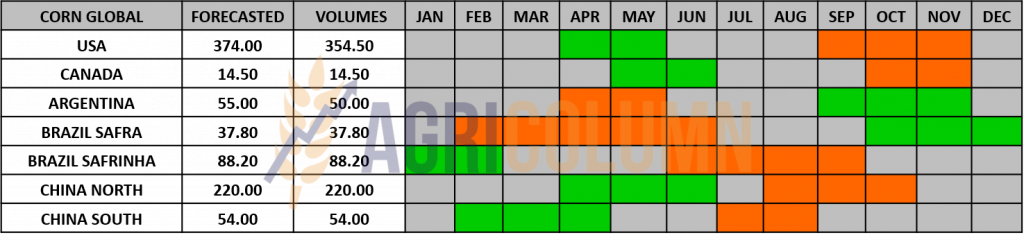
GLOBAL STATUS
The USA has reached the 66% corn harvest level. Dry weather helps the harvesting process. Further, the low water level on the inland logistics routes creates major problems for the transportation of corn from the Corn Belt to NOLA (New Orleans Louisiana)
ARGENTINA. BAGE (Buenos Aires Grain Exchange) reports a 17% corn seeding level. About 10% less compared to last year and compared to the 31% 5-year average. Lack of water in the soil is the main cause, and the rains that have passed have not succeeded in bringing the lands to the optimum mode for sowing.
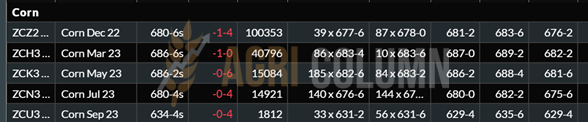
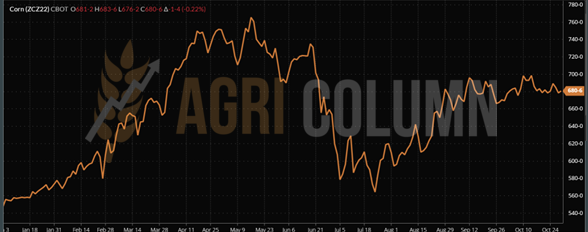
CBOT CORN – ZCZ22 DEC22 – 680 c/bu (-1 c/bu)
CBOT CORN TREND CHART – ZCZ22 DEC22
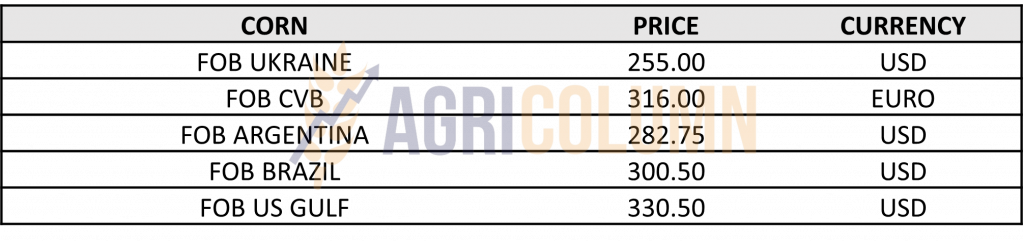
CORN PRICE INDICATIONS IN MAIN ORIGINS
CAUSES AND EFFECTS
Maize remains on the same platform as we mentioned in the previous issue. We will not see decreases in its price, primarily against the background of the fragility of the Ukrainian corridor, which is in a waiting state that creates assumptions and fears, fears that take a very obvious shape after the suspension of the corridor by Russia.
In Ukraine, rainfall, even if disparate, induces a delay in harvesting and implicitly drying costs or maintaining the price due to the lack of rhythm in deliveries to the EU or to the POC (Pivnyi, Odessa, Chornomorsk).
The European Union needs Ukrainian corn, and with China reorienting to other origins and the US facing the same low level on the Mississippi, the price remains stable for the period ahead.
Problems in Argentina should induce future concerns reflected in CBOT quotes and subsequently in EURONEXT. Lack of water penalizes seedling and is a future risk factor.
On the horizon, Brazil with Safra. Abundant water can cause delays in planting, and this can be seen in soybean planting in Brazil, where the land does not allow planting at the normal rate.

LOCAL STATUS
Rapeseed indications appear in the same mold as in the last period, i.e. FEB23 minus 20-25 EUR/MT for the goods delivered in the CPT Constanța parity and with FEB23 minus 15-20 EUR/MT for the goods delivered to the processing units.
In Romania, rapeseed suffers from lack of water. At the national level, this is already being felt, even if not in an extreme way. But there is no precipitation on the horizon, which raises the first alarm signals for rapeseed cultivation at the local level. The bet on rapeseed was obvious since the summer, but we don’t want this bet to turn against Romanian farmers.
CAUSES AND EFFECTS
In the coming period, rapeseed will correlate only with the price of fossil energy. Processing units have been supplied over the last quarter (or stripe, as it is called), so interest is not primary at this time. Moreover, their focus is on the purchase of sunflower seeds, which automatically leads to the utilization of 80-90% of the storage space.
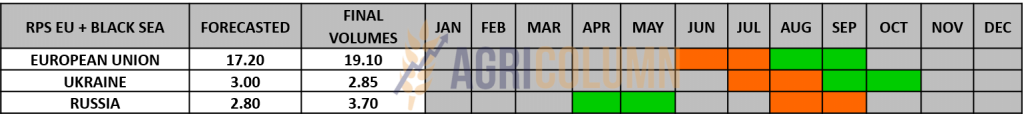
REGIONAL STATUS
We have no change at the regional level, but the main focus remains tracking the vegetation stage of rapeseed, which can be influenced by the weather. The European Union received precipitation in most of the territory, the exception being Romania.
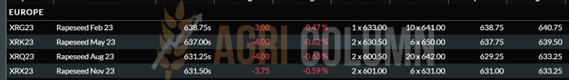
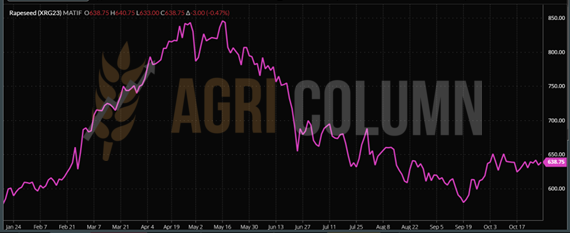
EURONEXT RAPESEED – XRG23 FEB23 – 638.75 EUR (-3 EUR)
EURONEXT RAPESEED TREND CHART – XRG23 FEB23
GLOBAL STATUS
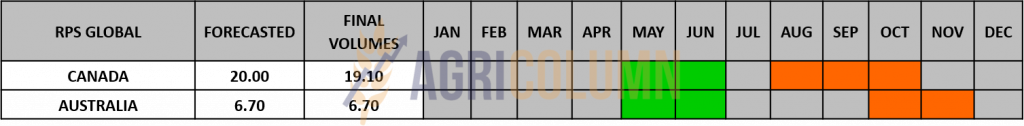
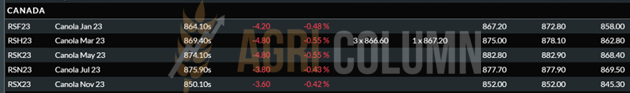
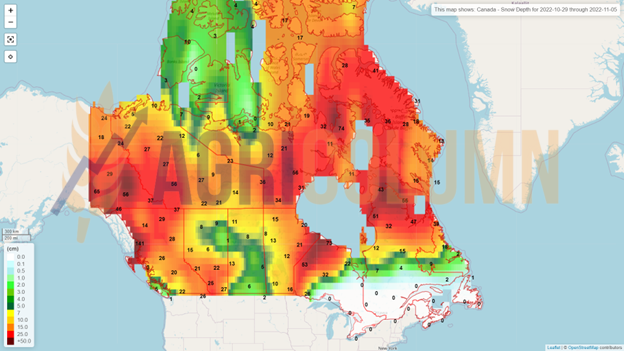
CANADA. Agriculture and Agri-Food Canada estimated Canada’s 2022-2023 year-end stocks as of July 31, 2023 at 500,000 tons, down from 875,000 tons the previous season. This gave some support to the ICE Canola and subsequently EURONEXT indications.
AUSTRALIA is under pressure at the moment. The rains do not stop and the rapeseed crop appears to have volume and quality problems. We will closely follow the development of this topic.
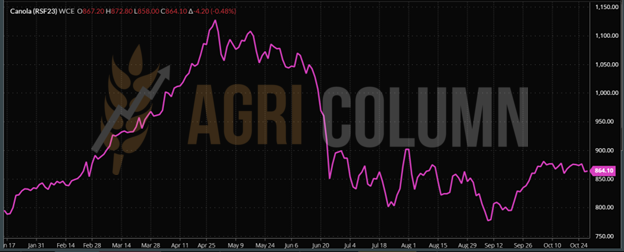
ICE CANOLA RSF23 JAN23 – 864 CAD (-4.2 CAD)
ICE CANOLA TREND GRAPH – RSF23 JAN23
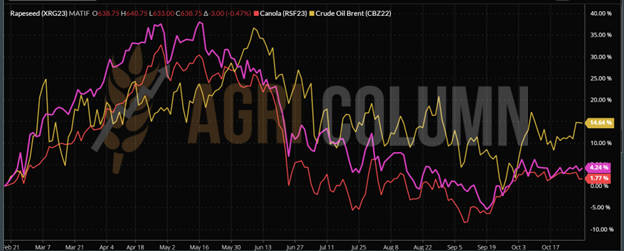
COMPARATIVE GRAPH. PETROL-RAPESEED-CANOLA CORRELATION
CAUSES AND EFFECTS
Rapeseed is currently correlated with fossil energy. But the southern hemisphere (represented by Australia) could steer the price trajectory higher than what we see today.
The positioning of biofuel demand is also a factor worth considering in the medium and long term. The discrepancy between the price of gasoline and diesel indicates support for the price of canola in the future, bearing in mind that canola oil is the ingredient used in the diesel blend.
Major US traders expect vegetable oil markets to remain tight in the coming years due to firm demand for biofuels and renewables.
The global market for vegetable oils will remain constrained due to the abundance of renewable fuel and biodiesel.

LOCAL STATUS
Primary indications for sunflower seeds are 565 USD/MT in CPT Constanța parity. However, players in the export or intra-EU trade market are having problems with storage space these days and are trying to push the delivery period towards mid-November. Processors display the same price levels at processing units, but they also have the same commodity storage space problem.
CAUSES AND EFFECTS
The local market begins to receive goods from Ukraine, and they make their way in as usual. Romanian farmers, however, maintain the retention of goods and do not trade until they need financial liquidity to pay dues to input distributors.
The price level offered by processors could be 10 USD/MT higher, but at the moment, farmers do not want to sell large quantities, so demand is not matched by supply.
Uncertainty in Ukraine is fueling the rumor mill and we are seeing price levels of 585 USD/MT for cargo delivered to Bulgarian processing facilities in the Ruse area. But logistics also costs money in this complex. Equivalence with 570-575 USD/MT DAP Romanian processing units is also kept in the logistics complex.
REGIONAL STATUS
UKRAINE is trying through domestic processors to create buffer stocks of raw material to generate domestic processing. Their constant pressure is argued by 2 factors. The first is a low production compared to last season, and the second is that Ukrainian farmers made money from the sales of raw material, so they have money to support the new production cycle. In the short term, processors run into two problems. The first is related to the price of sunflower oil, which remains low, and the second to the logistical problems of selling and distributing the processed product. But their argument is based on macroeconomic indicators of profit and job support. The European Union, however, wants the raw material, because it is much more profitable, and the prices in the parities of Romania and Bulgaria are on the path of 560-580 USD/MT DAP.
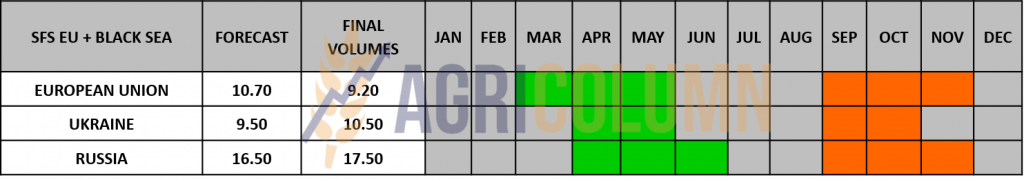
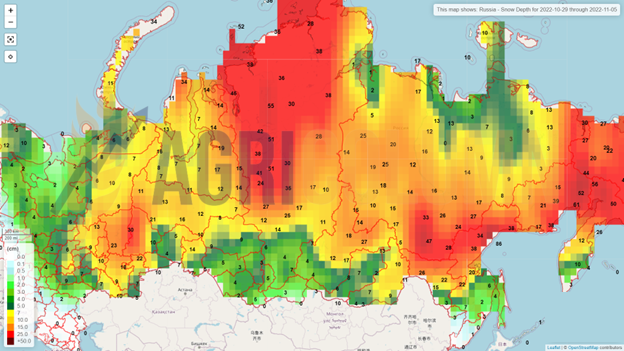
RUSSIA protects its raw material by extending the export tax of 50% of the equivalent value of a ton of seeds until August 2023. At the same time, it boosts the export of oil, therefore a value-added product, keeping the tax ZERO, again, until August 2023. And Russia is currently performing through sales in friendly countries (Turkey, Egypt, Iran). The first problem that appears on the horizon in Russia is the volume of the crop, which declines from the gigantic figure of 17.5 million tons to 16.5 million tons, and according to some analysts, 16 million tons. Due to the precipitation, the Russian harvesting process is deteriorating, and at this moment, the harvested area is only 4.4 million hectares, compared to last year in the same period, when 8 million hectares were already harvested. Let’s not forget that we are at the end of October, beginning of November, and in Russia it has been snowing for some time exactly in the most important production areas, that is, Volga, Central, South and Caucasus.
TURKEY produces 1.9 million tons of seed, up from 1.75 million tons last year, indicating self-relaxation from two separate segments. The first segment is that of temporary sufficiency, and the second of the imposed tariff barriers, 10% for the import of oil and 5% for the import of seeds. But the import of seeds from the Black Sea basin has been affected by the regional conflict, so Turkey has generated a much more sustained import of sunflower oil from Russia. The price of Russian oil is supported by the high transportation costs of Ukrainian oil generated by the narrowing of the maritime flow through the POC (Pyvni, Odessa, Chornomorsk) and the release of export duties. Turkey is thus a first beneficiary.
GLOBAL STATUS
ARGENTINA is still in the growing season with no further information on the sunflower seed harvest. But we don’t think they will be able to extract the forecasted 4.2 million tons.
Many saw in Ukraine’s wounds a potential to make a profit, but they got a bit of a time bump. The best examples are the USA and Argentina, which are affected by the weather factor in their attempt to produce sunflower seeds.
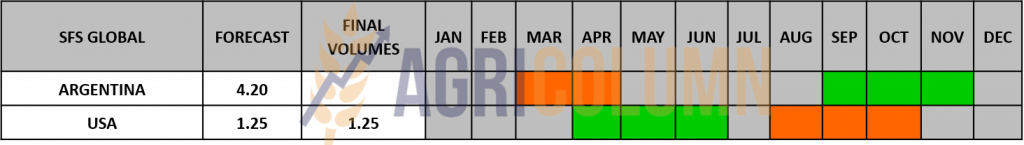
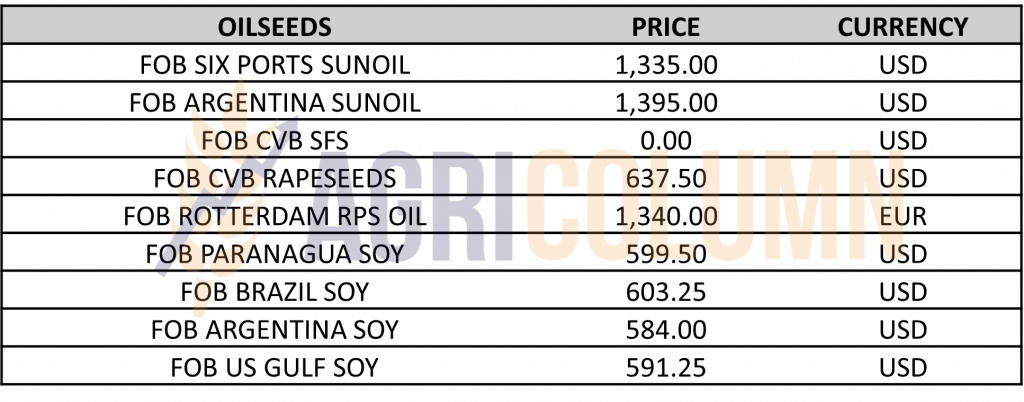
PRICE INDICATIONS FOR OILSEEDS AND CSFO IN MAIN ORIGINS
CAUSES AND EFFECTS
There are questions from Ukraine about a potential increase in the export tax, as well as restrictions on the export of raw materials, associated with a much lower harvest volume and, of course, the big question mark about the Green Corridor. There are also questions in Russia about their crop, which could be penalized by 1 million tons or 1.5 million tons. This is a price support parameter in the Black Sea basin.
Turkey is playing the price Joker, as imposing tariff barriers should normally lead to lower prices. But it’s not really like that. The tariff barrier will create other sales channels for Ukraine and Russia. And these channels will have to include the Turkish tariff barrier in the price.
Why? Because it must be competitive with this traditional destination. The European Union wants seeds, Ukraine generates them for you, forced by the war complex. Russia, through the 50% tax on seeds, keeps their price level high. The demand is there, but the numbers indicate something else: the EU is in deficit (max. 9.2 million tons of production). Romania is in deficit (max. 2.2 million tons of production), Ukraine is in deficit (max. 9.5 million tons of production and quality damaged by rains), Russia is in great delay and with a decrease in production (16- 16.5 million tons versus 17.5 million tons), to which is added the snowfall in the production areas.
As a conclusion, sunflower seeds will be in demand and will be supported by two parameters. The first is their low regional-global volume. This first parameter will be driven by the second, which is called the European regional specificity, which indicates the European dependence for the use of sunflower oil. This oil has no substitute in European consumption.
The suspension of the corridor will push the demand for crude oil and subsequently the seed price to higher quotations of 600-620 USD/MT.

LOCAL STATUS
In Romania, the price indications for soybeans are at the level of 580 USD/MT DAP processing units for non-GMO soybeans. Between July 1 and October 23, 2022, approximately 75,000 tons of soybeans were imported.
REGIONAL STATUS
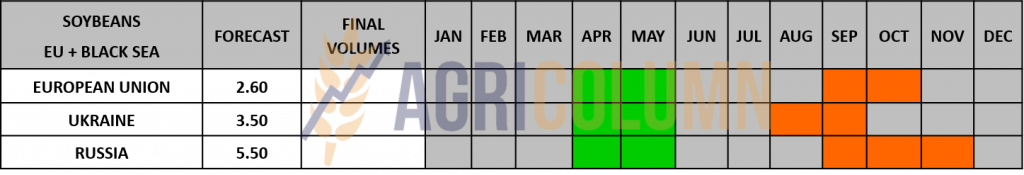
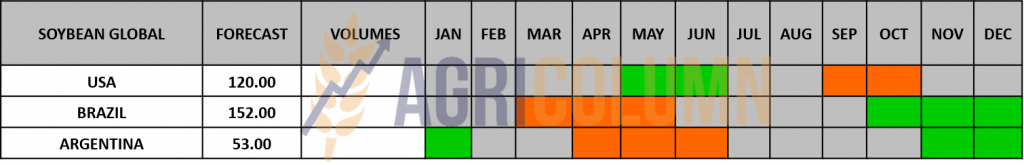
GLOBAL STATUS
USA. Harvesting of soybean crops has reached 80%. The USDA has announced that more than 75% of the soybean acreage grown by American farmers is genetically modified.
In the 2022/23 season, through October 20, 2022, the US achieved 7.3 million tons of soybean export sales, compared to 7.9 million tons in the 2021/22 season.
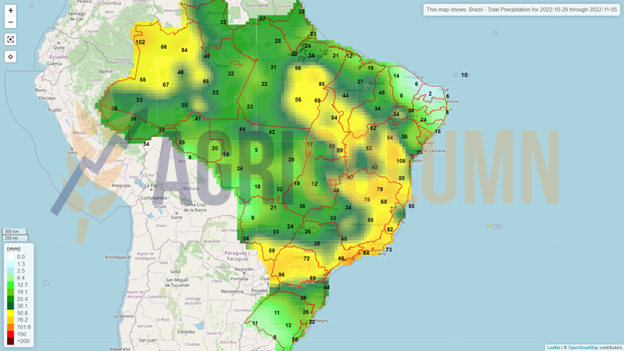
BRAZIL. Soybean farmers planted 34% of their acreage, compared with 24% the previous week and 38% a year ago. Amid excessive rains and low temperatures, sowing has lost momentum in the state of Parana, which is also experiencing slower plant development. Farmers had to replant in some places due to the unfavorable weather.
Brazil exported 104 million tons of soybeans in the 2021/22 season. Of these exports, 68% went to China, representing an increase of 6.7 million tons compared to the previous year. Spain, the second destination of soybeans from Brazil, reached 3.7 million tons of imports in 2021/22.
ARGENTINA. Soybean producers sold 70.3% of the Argentine 2021/22 crop, the percentage being below the level of 74.2% of the crop sold during the same period in the 2020/2021 season.
October sales slowed sharply from the dollar-soybean sales boom in September.
Argentina soybean processing falls 9% in September as farmers limit sales.
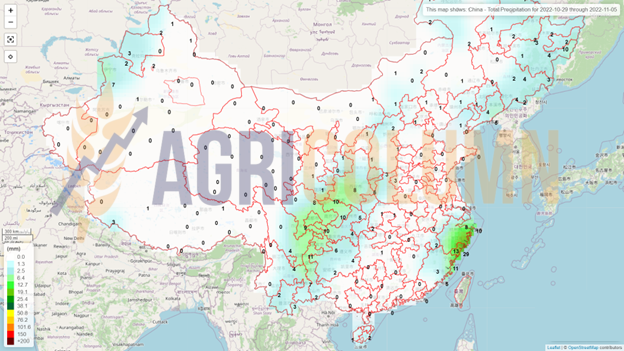
CHINA. China’s soybean processing volume fell to 1.81 million tons last week, down 650,000 tons from the previous month.
China is the main importer of soybeans from Argentina and Uruguay, reaching 1.7 million tons and 1.6 million tons respectively between January and September 2022. January-September imports were down about 7% from last year.
Origins of September 2022 imports are: USA = 1.15 million tons (vs. 0.17 million tons in 2021), Brazil = 5.58 million tons (vs. 5.94 million tons in 2021).
In the first 9 months of the year, China imported 69 million tons of soybeans, down 6.6% compared to the same period last year.
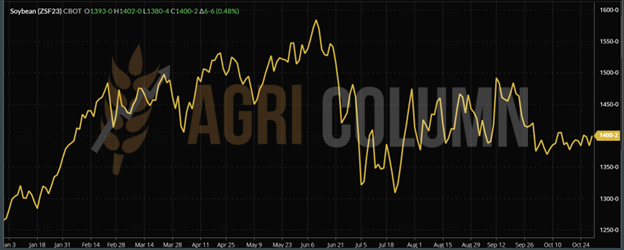
CBOT SOYBEANS – ZSF23 JAN23 – 1,400 c/bu (+6 c/bu)
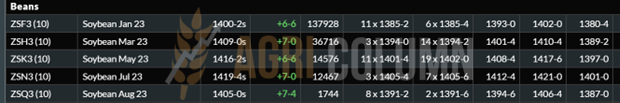
CBOT SOYBEAN TREND CHART – ZSF23 JAN23


29 October – 5 November 2022
Romania
Europe
Ukraine
Russia (snow)
Canada (snow)
USA
Brazil
Argentina
China
Australia