This week’s market report provides information on:
FAO INDEX
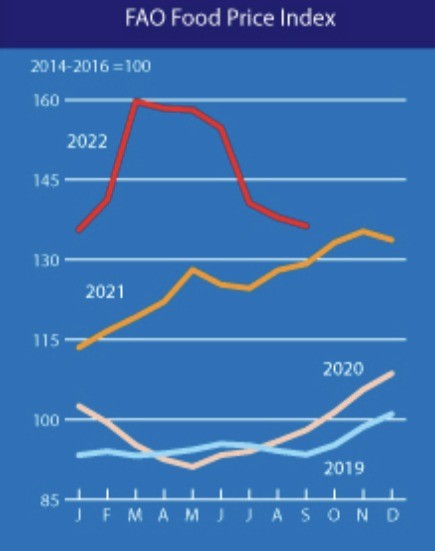

The FAO FOOD PRICE INDEX (FFPI) averaged 136.3 points in September 2022, down 1.5 points (1.1%) from August, marking the sixth consecutive monthly decline. The decline in the FFPI in September was driven by a sharp decline in international vegetable oil prices and moderate declines in sugar, meat and dairy products, more than offsetting a rebound in the cereal price sub-index. Despite the further decline, the FFPI remained 7.2 points (5.5%) above its value in the corresponding month last year.
FAO CEREAL PRICE INDEX averaged 147.8 points in September, up 2.2 points (1.5%) from August and 14.9 points (11.2%) above September 2021.
In September, international wheat prices rebounded 2.2%, supported by increased uncertainty over the continuation of the Black Sea Grains Initiative beyond November and the potential impact on Ukraine’s exports.
In addition, concerns about dry conditions in Argentina and the United States, as well as a brisk pace of exports from the European Union, in addition to higher domestic demand for the bloc’s wheat amid tightening corn supplies, provided additional support for wheat prices.
The FAO VEGETABLE OIL PRICE INDEX averaged 152.6 points in September, down 10.8 points (6.6%) from the previous month, marking the lowest level since February 2021. The continued decline in the index reflected lower prices for palm, soybean, sunflower and rapeseed oils.
In September, international palm oil prices fell for a sixth consecutive month, largely due to lingering heavy inventories, which coincided with a seasonal increase in production in Southeast Asia.
Meanwhile, global soybean oil prices fell moderately after a short-lived recovery in August in response to increased export availabilities from Argentina due to significantly higher sales by farmers. As for sunflower oil, international prices fell to a 14-month low due to increased export offers from the Black Sea region amid reduced import demand.
Global rapeseed oil prices have also fallen significantly, primarily due to abundant global production in the 2022/23 season. Low crude oil prices also contributed to downward pressure on world vegetable oil prices.

LOCAL STATUS
Wheat indications in the port of Constanța remain constant around the values of 335-336 EUR/MT in CPT parity. The domestic market remains at the level of 325 EUR/MT for goods delivered to the processing units.
Romanian wheat sowing continues and the window is open. Romanian farmers will easily reach the level of 2.15 million hectares and we believe that we will see this level exceeded. The explanation is extremely simple – moisture gained from precipitation fuels this process and the negative experience encountered with spring crops induces a lot of caution.
Thus, farmers prefer to provide greater rotation to autumn crops, in the general trend of avoiding the problems encountered in the 2020 and 2022 seasons, i.e. soil drought and extreme temperatures.
What we need to know, however, is that the weather forecasts generated by the American and European models indicate for the three winter months (December, January and February) a lack of accumulations of precipitation in the form of snow, as well as positive temperatures.
This aspect does not bode well for the perspective of the next agricultural year towards which we look with hope, but we emphasize that these forecasts do not indicate whether we will have precipitation in the form of rain. If we have precipitation in the form of rain, we could have the prerequisites for a good season, because in this way, the water reserves in the soil would be restored. The La Nina indication says that the effect will diminish starting in February, which would lead to the entry into the ENSO phase, and the precipitation balance could return.
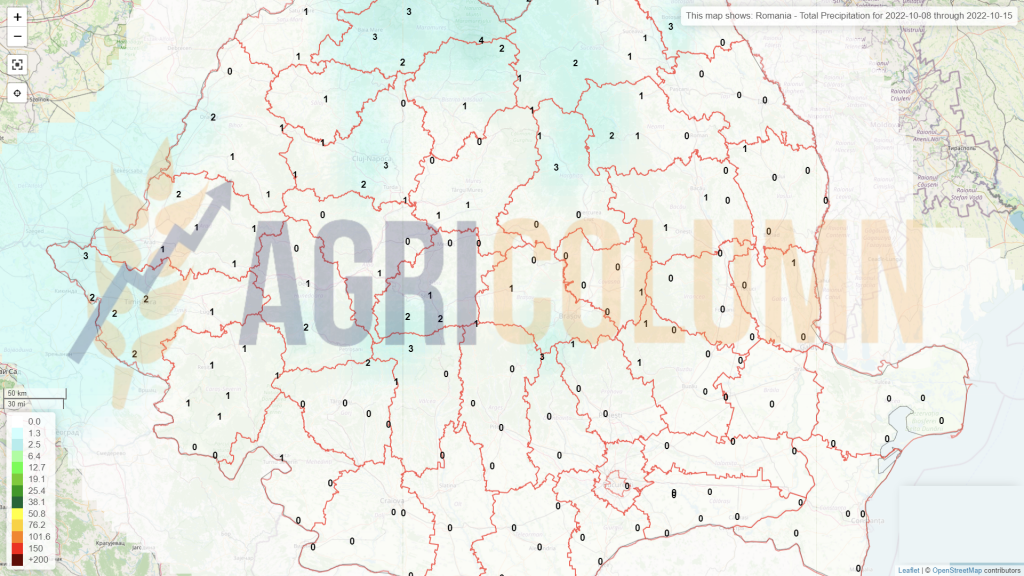
At this moment, in Romania, apart from the south-east and the counties with problems (Vrancea, Galați, Vaslui), the situation is satisfactory, European satellite data indicating this.
CAUSES AND EFFECTS
Returning to the daily landscape, we note a general relaxation of buyers in destinations. Next, Romanian wheat lacks competitiveness in the direct relationship with colleagues from the Black Sea basin. Their offers are much more attractive, whether we are talking about Russian wheat or whether we are talking about Ukrainian wheat through the Green Corridor.
The farmers who carried out the retention are starting to ask themselves more and more obvious question marks, and it makes sense that this should happen. Demand is latent and prices are granted according to the formula EURONEXT DEC22 minus 16-18 EUR/MT. Classical logic would say that wheat will increase with winter, but it is penalized by production values in the Black Sea basin.
Even the tensions induced by Russia with statements directly referring to the use of nuclear force fail to move stock market indications. All this time, Romanian farmers accumulate financing costs on stored goods.
Also in this chapter called causes and effects, we want to demystify a few aspects related to Ukrainian discounts. Yes, they exist, and indeed they distort the market as it is formed today. But we clearly see that Premium Buyers, i.e. exporters, pay a fair price agreed with Euronext for goods of Romanian origin. So in this flow there are no obvious distortions. The problems start from the intermediate chain or the low-level processing chain, i.e. local units with little processing capacity. They prefer Ukrainian or Moldovan goods at a lower price compared to Romanian goods. The differences are 20-25 EUR/MT.
But I invite you to a moment of reflection and inner questions that can fuel fair and realistic thinking. Do we understand that if there wasn’t this Russian invasion of Ukraine, we wouldn’t have these price levels? And I bring from memory the days at the end of November 2021, when the price of wheat was at the level of 260-265 EUR/MT.
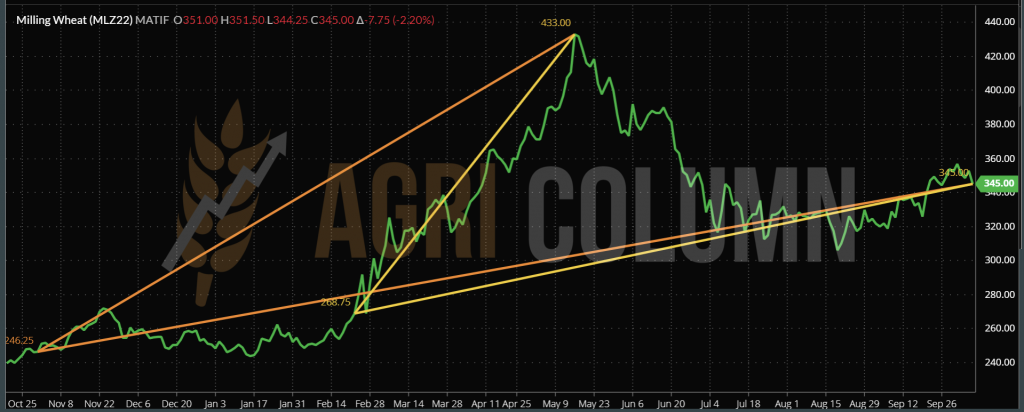
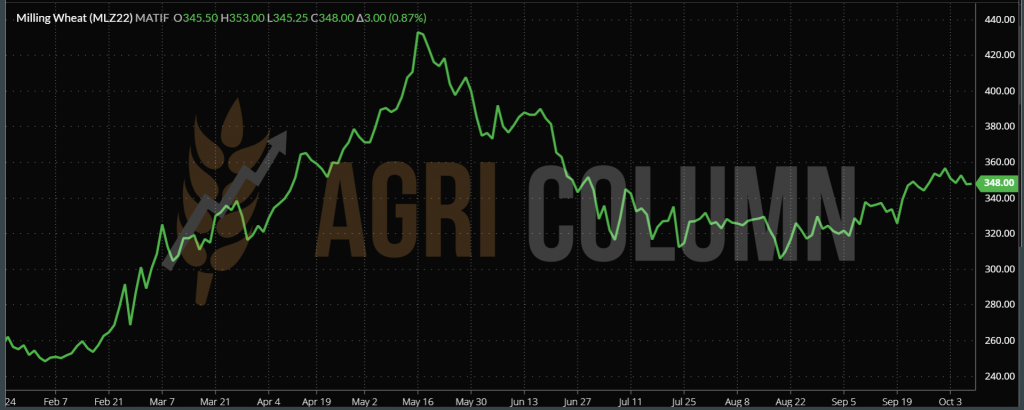
And as a record, I am inserting the EURONEXT indication price trend here. And we see how between NOV21 and the peak of MAY22 we have a difference of 187 EUR. And if we refer to the eve of the Russian invasion and refer to the peak in MAY22, we again have a plus of 164 EUR.
If we take the data ratio further, we clearly see between NOV21 and today a plus of 99-100 EUR. And the ratio between the pre-invasion price and today shows us 76 EUR.
That is why I induce this moment of reflection and positive thinking, to understand the numbers that clearly show the benefits that we did not think and did not dream of as a collateral effect of the war in Ukraine. A difference of 76 EUR/MT, to take the smallest one (except that the retaining of the goods was a major mistake in the perspective of the let’s say satisfactory crop from Romania), fully covers the Ukrainian discount, as well as the difference in establishment costs per hectare. And still from memory I bring the image of the desolate exporters in mid-May 2022, who told me: “Cezar, I can’t buy wheat at 415 EUR/MT CPT Constanța”. We are talking about that moment when each of us knew for sure that he could extract a minimum of 2-3 tons/hectare.
We must capitalize on the things we did not hope for. The higher price, generated by the troubles and sadness of a country invaded by Russia, is the positive collateral effect that we feel here in Romania. We need to think positively and understand the numbers and the fact that we are sheltered from the major problems and this includes the death that haunts the harvest in Ukraine without regard for anything at all.
We must capitalize on the potential that is latent today. We have all the conditions, we have the peace and the framework to do this. We must not think negatively about the trouble of another, but understand this and be participative in this process, naturally having benefits that we did not think or dream of.
REGIONAL STATUS
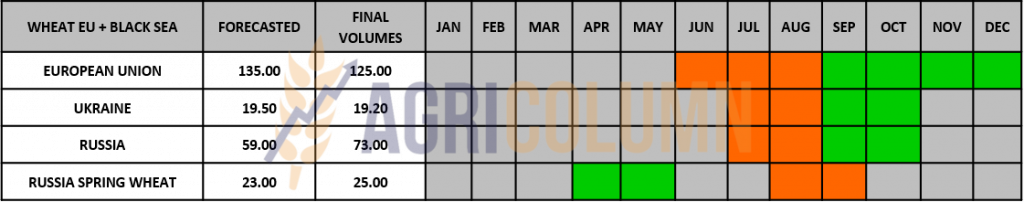
EUROPEAN UNION. EU wheat exports are now set at 36 million tons for the 2022/23 season ending June 30, down from 38 million tons expected in July, European Commission data showed. That would still represent a record high and remains above the 33.5 million tons estimated by the US Department of Agriculture.
UKRAINE. Ukraine’s final wheat crop is set at 19.2 million tons. Harvesting has been completed and this figure remains final. Ukraine’s autumn grain (wheat and barley) sowing area for the 2023 crop is unlikely to exceed 2 million hectares and the harvest volume could drop by at least 50%, the head of a major Ukrainian agricultural company said on Thursday.
RUSSIA. In the July-September period, Russia exported 11.92 million tons of wheat, 23.4% less than last year (15.6 million tons). And last year they failed in the wheat export plan, stopping at 33 or 34 million tons. During the same period last year, they shipped wheat to 70 countries, compared to just 40 countries this year. Last year, during the mentioned period, 137 companies exported, compared to only 73 this year. The Russian ports registered an obvious setback in comparison to the same period as the one expressed above: Novorossisk -17%, Rostov on Don -17.3%, Azov -20%.

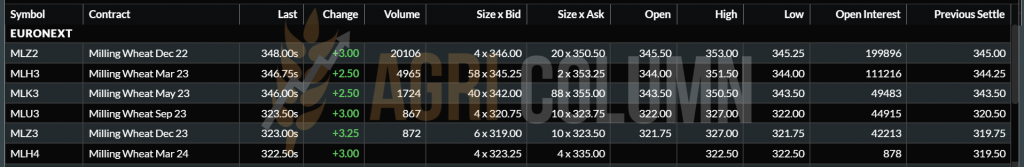
EURONEXT WHEAT MLZ22 DEC22 –348 EUR (+3 EUR)
WHEAT TREND CHART – MLZ22 DEC22
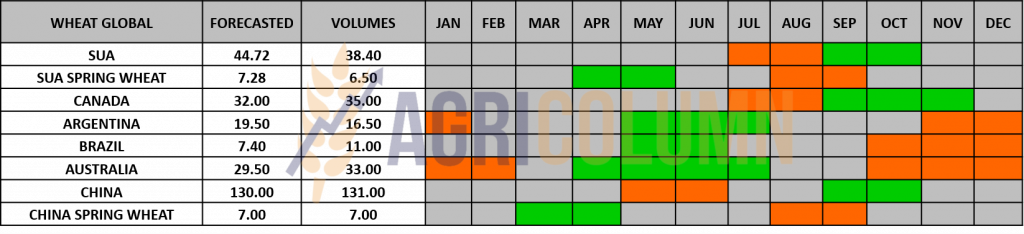
GLOBAL STATUS
ARGENTINA. The problems are compounded by the persistent drought and we will see a further negative adjustment of at least 1.5 million tons. From a level of 16.5 million tons, we could see Argentine wheat at the level of only 15 million tons.
BRAZIL gets a crop upgrade of 0.33 million tons. It is not much, but it enters the calculations as a compensating factor for the regular import from Argentina and thus corrects the import requirement from domestic sources.
CANADA remains unchanged. USA also unchanged.
EGYPT. Private imports face extremely serious problems. The price of wheat and flour used to make unsubsidized bread has risen in Egypt as importers struggle to pay for wheat stuck at ports amid a dollar shortage, traders and the country’s grains chamber told Reuters last week.
About 700,000 tons of wheat were not cleared from customs, causing about 80 percent of mills that produce bread, pasta and other goods sold commercially to cease operations completely, according to a Sept. 26 letter from the Federation of Egyptian Industries, Grain Chamber, to the Minister of Supply.
While global wheat prices have fallen to their pre-war level between Russia and Ukraine, prices in Egypt have risen due to depleted stocks, said Hussein Boudy, deputy head of the Chamber.
Egyptian importers are unable to replenish wheat stocks amid a dollar shortage caused by a rising import bill and falling tourism revenues from two of its biggest markets – Ukraine and Russia. Loss of confidence in the Egyptian pound by investors also contributed to the shortfall.
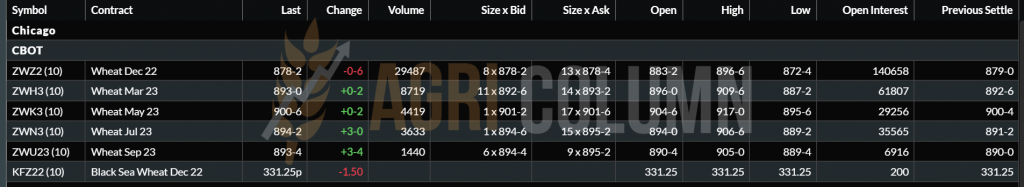
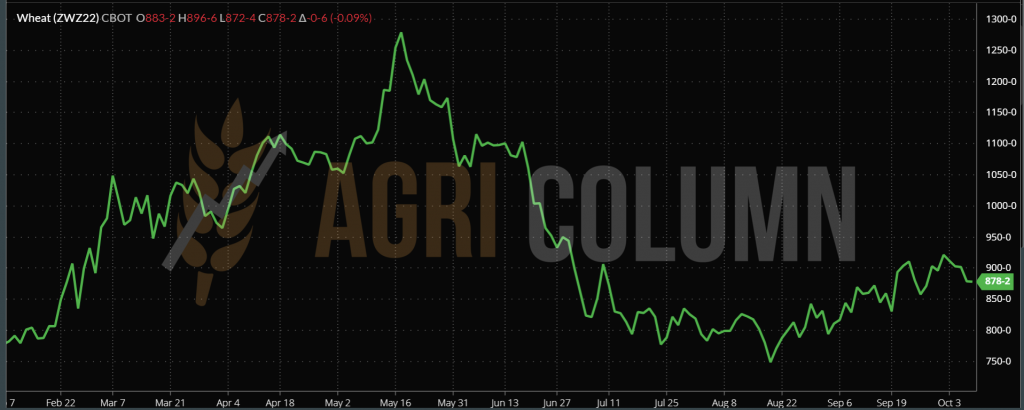
CBOT ZWZ22 DEC22 – 878 c/bu
CBOT WHEAT TREND CHART
TENDERS
OAIC ALGERIA purchased 300,000 tons of wheat at an average price of 370 USD/MT CIF. Estimates are 75-80% Russian wheat.
TUNISIA purchased 150,000 tons of wheat as follows: 25,000 tons Casillo at 383.49 EUR/MT | 25,000 tons Viterra at 385.74 EUR/MT | 25,000 tons Cargill at 383.79 EUR/MT |25,000 tons Viterra at 385.97 EUR/MT |25,000 tons Viterra at 385.48 EUR/MT |25,000 tons Viterra at 385.66 EUR/MT.
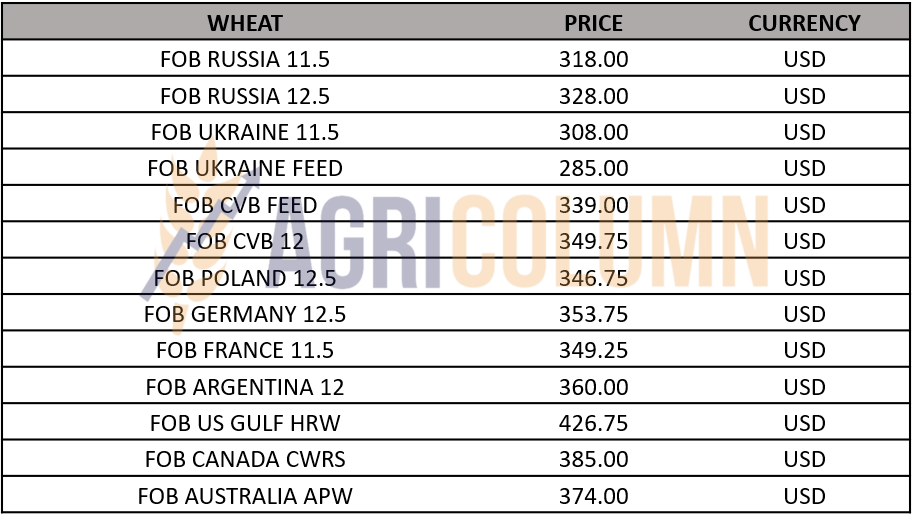
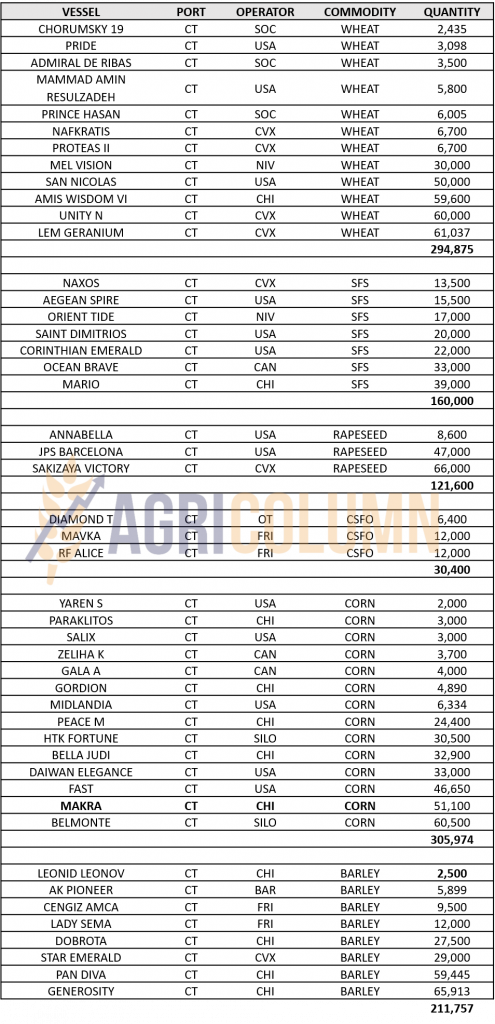
WHEAT PRICE INDICATIONS IN MAIN ORIGINS
CAUSES AND EFFECTS
The spike generated by the NASS report has diluted. The hedge funds generated profit by liquidating the positions, so we recorded, as was also natural, the return to the indicative parameters before the appearance of the report. These days the inflows and outflows of funds generate action, otherwise the physical markets remain steady and without much change.
The balance of the physical markets has been disturbed by absolutely no external factors in this period since the last report.
WHAT DO WE CONTINUE TO SEE?
- Russia has extremely long delays in the export process of wheat. The numbers are not encouraging at all and the delay will surely cost. It can already be seen in the pace of sowing autumn crops. Wheat will no longer have the same weight as before. The total wheat area will be reduced. At this point, estimates are 500,000 hectares short of the original forecast and see a final seeding of 16.5 million hectares, a 5-year low. The lack of profitability is obvious. Certain areas will produce vegetables or other crops next season in Russia.
- Destinations are pending. They want to see more price drops. Russia, for example, sells wheat FOB Novorossisk for 314-315 USD/MT. Their export tax is still at the level of 35 USD/MT, and there is no room for development unless they lower the export tax. A decrease in tax would generate an implicit decrease in price.
- The Russian invasion of Ukraine is pushed back step by step. It is not the end, but one can simply see from the rhetoric of Russian propaganda a step backwards. The topics of the speeches are no longer the exercise of nuclear power, but how to negotiate with Ukraine. It is also fascinating to see how from a belligerent rhetoric of Russian propaganda, the speeches turn to another level where they admit that the exercise of nuclear power is not an option. This only calms physical markets. We are under no illusions that this war will end in a short period of time, but we are glad that weighting is taking the place of warlike attitude based on the facts on the ground.
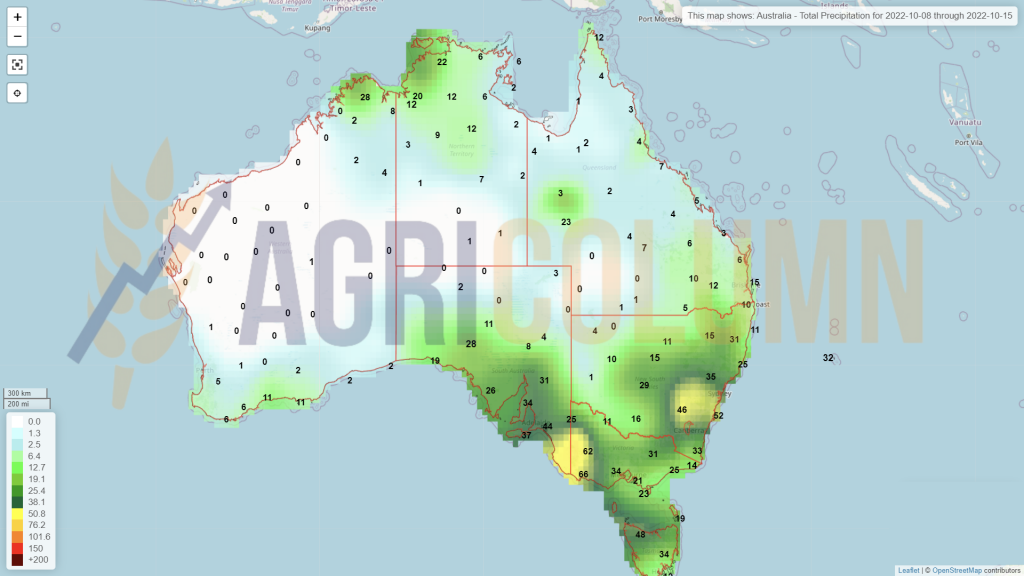
- Australia will come with a lot of wheat at the time of the harvest. Certainly, the quality will be affected due to precipitation, but the volume will be large enough to include good quality in it. Apart from Argentina, this is about where the wheat story ends this season, speaking of course about global production. It remains for the demand to take effect.
- Logistics could show its fangs again. OPEC+’s decision to reduce production by 2 million barrels/day starting in November 2022 could affect the price of goods, as a possible increase in logistics costs will be reflected in the price.
- The price of wheat will not undergo significant changes in the next period, but will remain on this plateau. The establishment costs of a hectare of wheat hang heavy in the price of commodities, but a level of 5 tons/hectare covers price increases in fertilizers and fuel, provided the weather is permissive.

LOCAL STATUS
The price indications offered by the port of Constanța are at the level of 290-295 EUR/MT. Barley has bounced back helped by corn and wheat these days.
REGIONAL STATUS
UKRAINE ends barley harvest and results exceed expectations. 5.5 million tons, against a forecast of 4.15 million tons.
MIT JORDANIA cancels a barley procurement tender and reschedules it for October 12, 2022.
TURKEY initiates a tender for the purchase of 500,000 tons of barley. The tender date is October 11, 2022.
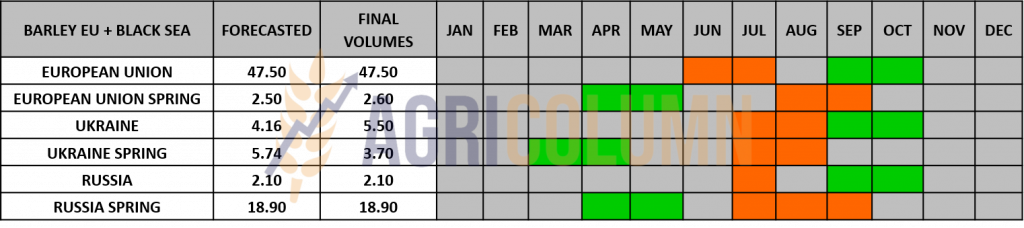
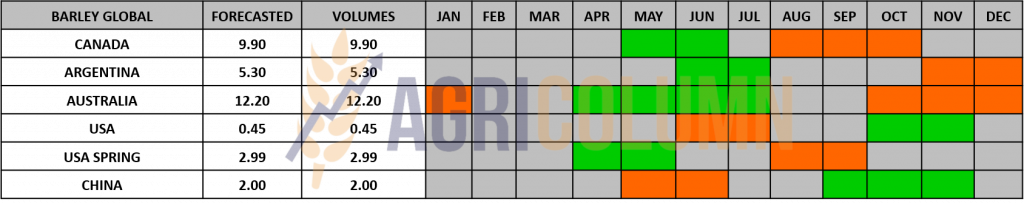
BARLEY PRICE INDICATIONS IN MAIN ORIGINS


LOCAL STATUS
The indications of the port of Constanța are increasing as we predicted. And they rise to the level of 305 EUR/MT. It makes sense, if you think about the Ukrainian goods sitting in the field in the rain at the moment. The saying that when it rains the price of corn rises in the harbor is fully illustrated.
No change in the status of the Romanian volumes. We have the same crop forecast and are still in the process of harvesting. But logistical problems exist and manifest themselves. Constanța port is effectively hyper-congested. And congestion is dictated by reasons other than those related to goods. We will return to this in the sunflower seeds chapter.
CAUSES AND EFFECTS
The rain provides the price support for corn in Constanța. When it rains in the neighbors who have to harvest 31.5 million tons (Ukraine), and we have shortages in volumes, the primary logic shows the effect, i.e. the price support, which started from 285 EUR/MT and is today at the level of 305 EUR/MT. The increase could generate another 10-15 EUR/MT if the rains do not stop in Ukraine.
REGIONAL STATUS
UKRAINE will go into harvest in force around October 15-20, 2022. The rains look like they will stop and so, after a short period of corn drying, we will see the first Ukrainian commodities of the 2022-2023 season.
HUNGARY massively imports Ukrainian corn. Indications are around 1.2-1.4 million tons so far. We remind you that Hungary was extremely affected by the pedological drought and the intense heat wave. Pannonia was supposed to deliver 7 million tons, but it delivers only 2.85 million tons.
THE EUROPEAN UNION is being calibrated by Ukraine’s crop and it will arrive after the complete stop of the rains that have held up the harvest in this country. We mention once again the volume level of 55.5 million tons, generated by the European Commission, in line with our estimates of a few months ago.
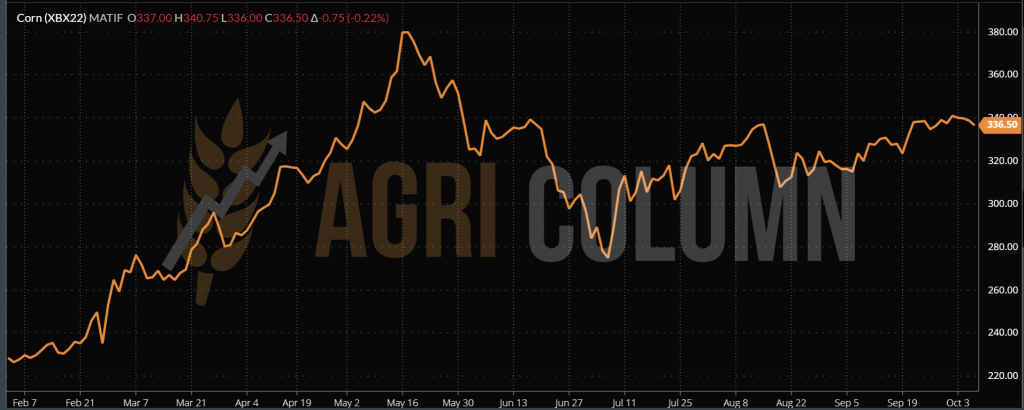
EURONEXT XBX22 NOV22 – EUR 336.5 (-EUR 0.75)
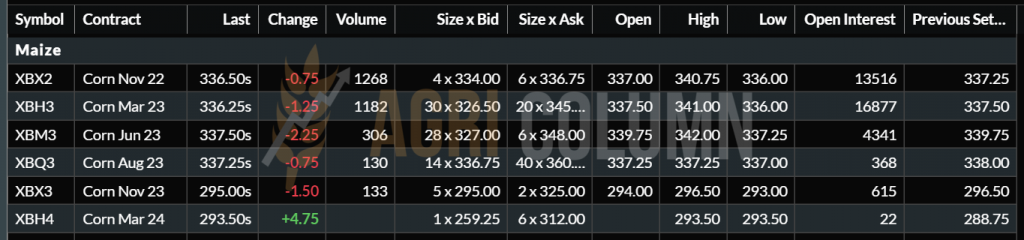
EURONEXT CORN TREND CHART – XBX22 NOV22
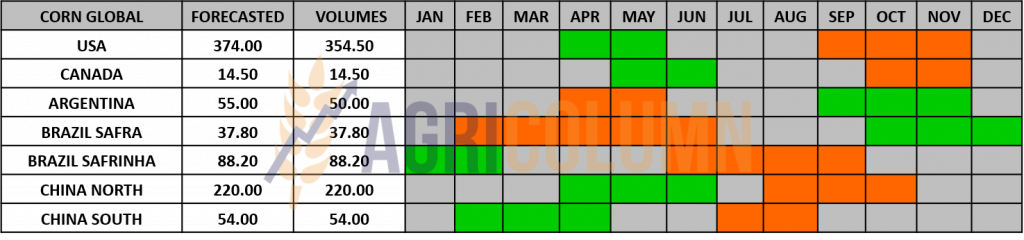
GLOBAL STATUS
USA. Barchart indicates a 0.79% increase in North American corn production. These percentages adjusted to the September 12, 2022 USDA figures lift production by 2.8 million tons to 357 million tons. This first indication relaxes the CBOT, but the October 12, 2022 WASDE report will be the arbiter, as other analysts were pointing to the exact opposite, namely a decline in US corn production. And the decrease will come from productivity per hectare. As of September 30, 2022 NASS was indicating 172.5 bu/acre and now analysts are indicating 171.8 bu/acre. Converting to the European metric system, we have an indication of 10.78 tons/hectare, compared to 10.82 tons/hectare on September 30. This clearly indicates a drop in production of 2.5 million tons from a level of 354.5 million tons to a level of 352 million tons. Our opinion is to give credit to the figures of American analysts, which indicate a decrease in production, not an increase in it. The logic of the facts on the ground is much more correct.
BRAZIL remains unchanged in the 2022-2023 forecasts.
ARGENTINA is downgraded by 2 million tons, but we noted this in the previous report.
PARAGUAY remains unchanged at 5 million tons of production, so we have no deficit in this area.
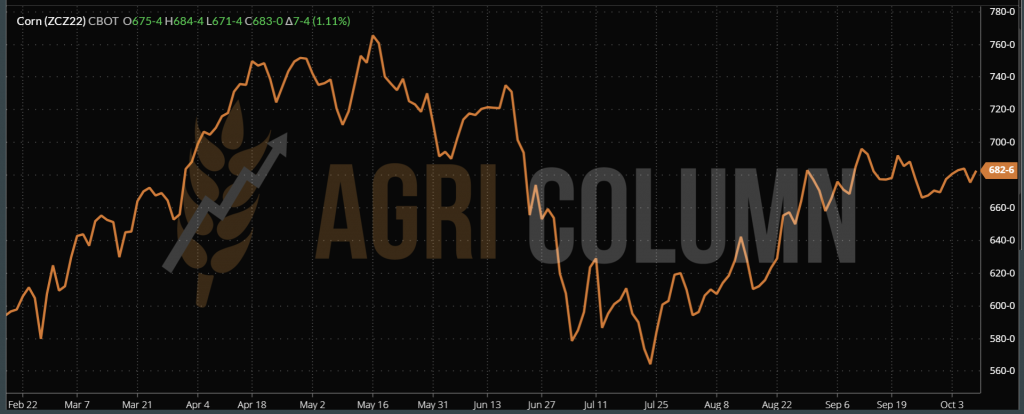
CBOT
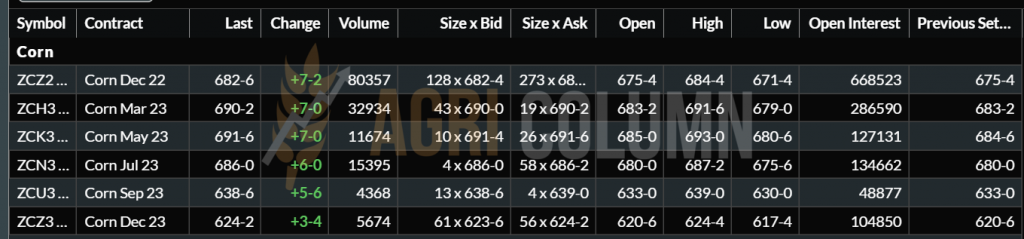
CBOT CORN TREND CHART – ZCZ22 DEC22
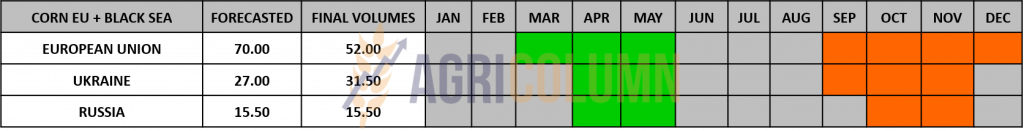
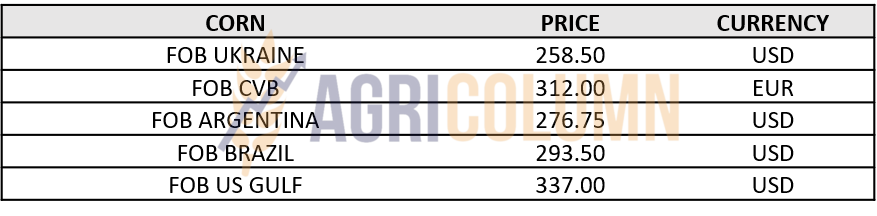
CORN PRICE INDICATIONS IN MAIN ORIGINS
CAUSES AND EFFECTS
- The price dynamics of corn was influenced by the persistent rain in Ukraine. This favored the increase of 20 EUR/MT in the CPT Constanța parity.
- At the same time, Ukraine delivers corn to China at the price of 275 USD/MT in FOB POC parity (Pivnyi, Odessa, Chornomorsk)
- Barchart shows us before the WASDE report that the American crop will not be degraded, but even upgraded by 2.8 million tons. It is quite an important figure for the corn price trend.
What do the above factors tell us?
- The price support that corn has enjoyed so far in the CPT Constanța parity could evaporate as quickly as it arrived. However, this may happen after October 18-20, 2022, when Ukraine’s corn will be ready for harvest, as Ukrainian farmers will certainly prefer natural drying in the field to artificial drying, which would inevitably bring costs, because of the price of gas.
- The fact that China is buying corn from POC Ukraine is a major indicator that Russia will not disturb the Great Panda Bear in its pursuit of cheap goods with a low logistical cost compared to other origins.
- American corn will not escape the specter of further crop degradations and about 2.5 million tons will be subtracted from the American crop. It is not very much, but it is the second time in a row. But consider that they went from a forecast of 374 million tons in June, and now find themselves with a cumulative minus of 22 million tons. Only the decrease in consumption would compensate, but we do not think so, we also see a decrease in US corn stocks.
- So Ukraine will fill in and be a bearish factor in the basin, but this factor will be canceled out by the North American crop and the Argentine forecast. In other words, we will see corn plateau in terms of price.

LOCAL STATUS
Nothing new on the rapeseed scene. The same repetitive scenario is set in motion every trading day – the NOV22 indication minus 20-25 (or 30) EUR/MT. The elasticity of the negative Premium is given by the position and profile of the buyer, whether he is a premium trader or a processor.
Romania reaches around 540-550,000 hectares of rapeseed sowing this season. The farmers’ rationality is a very correct one. The fear of repeated drought and intense heat has caused the acreage for rapeseed to increase.
CAUSES AND EFFECTS
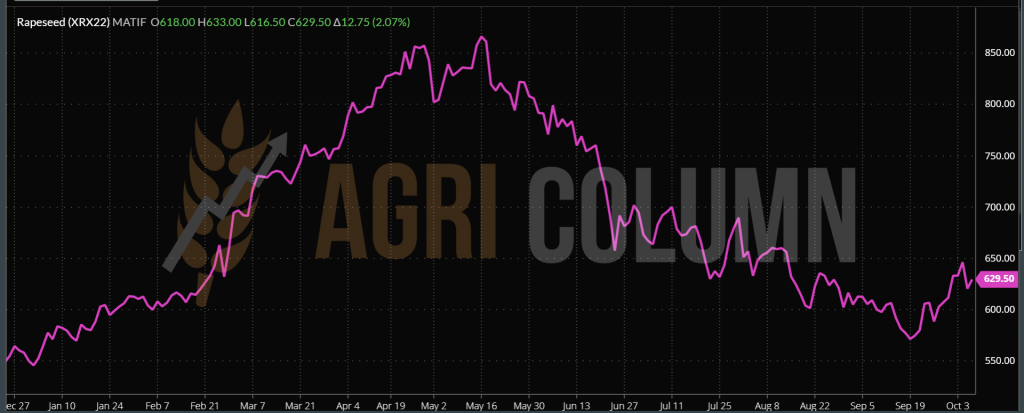
Rapeseed lives on spikes, as we are used to. It also touched 645 EUR/MT and is now resisting the level of 625-630 EUR/MT, but it is the Premium that dictates the final commodity price. And it is also the one that indicates liquidity, that is, the volume of goods existing on the market. The negative indicator against NOV22 is high, a sign of regional liquidity.
In other words, the goods are in stock and absolutely all buyers know it. The information generates the position and power to understand that they have no immediate fear of lack of volume. Coupled with general information on when farmers need to sell, this cements the negative premium to today’s values.
REGIONAL STATUS
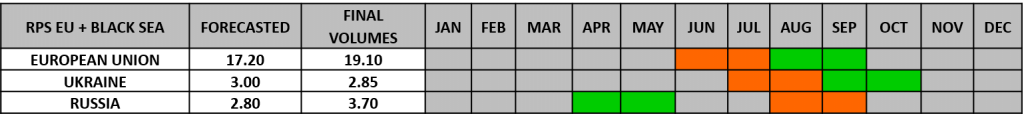
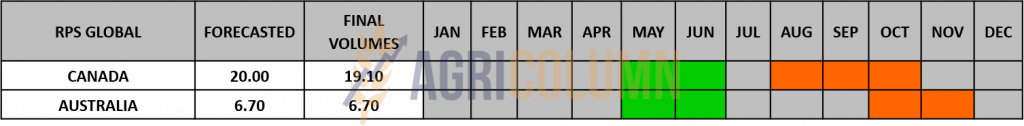
The EUROPEAN UNION reduces the harvest volume by 0.35 million tons, from 19.46 million tons to 19.1 million tons, after a re-evaluation of European crops.
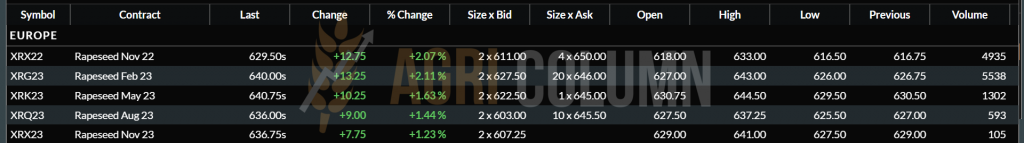
EURONEXT XRX22 NOV22 – 629.5 EUR (+12.75 EUR)
TREND CHART – XRX22 NOV22
GLOBAL STATUS
CANADA indicates no change.
AUSTRALIA indicates no change to the volume forecast at this time.
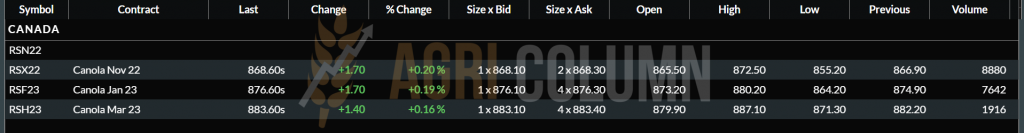
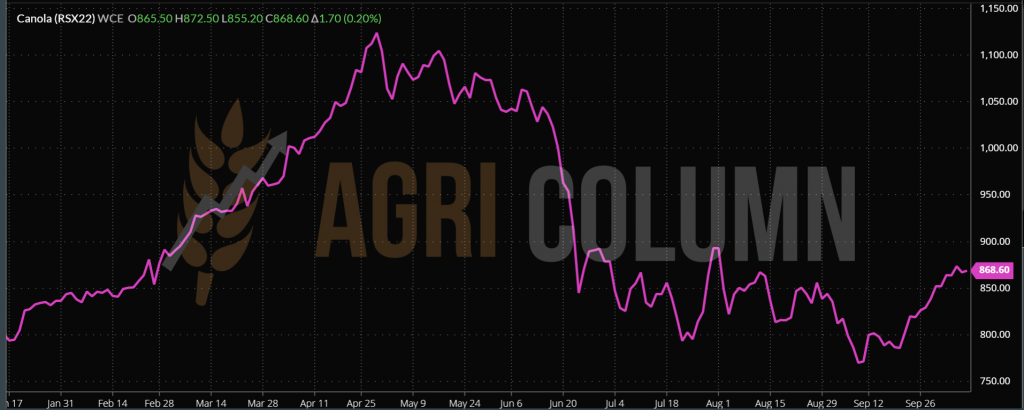
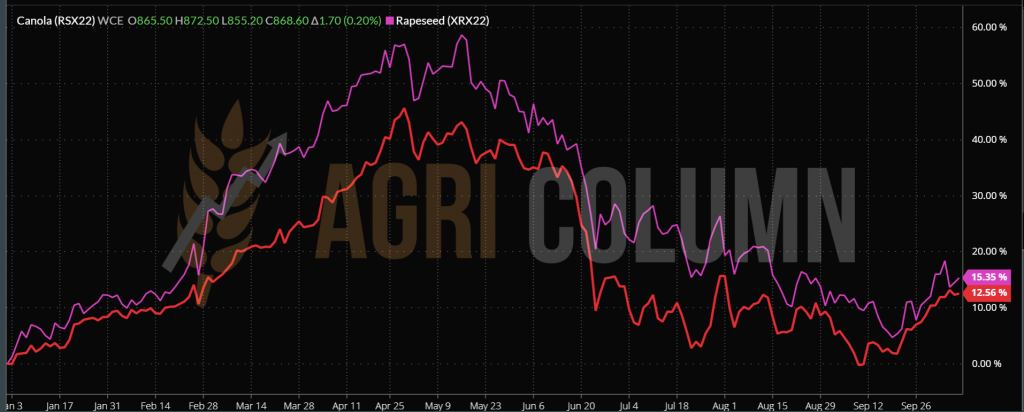
ICE CANOLA CANADA – RSX22 NOV22 –868.6 CAD (+1.7 CAD)
ICE CANOLA TREND CHART – RSX22 NOV22
COMPARATIVE ICE CANOLA – EURONEXT
CAUSES AND EFFECTS
The return of rapeseed to the level of 645 EUR/MT was due to the decision of OPEC+ to reduce the production of crude oil by 2 million barrels per day starting from November 2022. The spike generated has propelled rapeseed from the low orbit into higher price spheres.
However, the correction was immediately seen in the decline to around 615 EUR, a sign that OPEC’s decision was taken in the supply & demand calculations.
The return to 630 EUR was caused by the negative assessment of European harvest volumes. If we add the missing 0.36 million tons to Canada’s 0.4 million tons, it comes to 0.76 million tons that no longer exist of the global total. And for rapeseed, 0.76 million tons means a lot.
What do we see next?
- A correlation of rapeseed with crude oil, which reached values of 98 USD/barrel. So we see a generous pull that rapeseed gets.
- A correlation with volumes to be harvested in Australia. Any change in production will weight in the price of rapeseed, if it will be positive, and if it will be negative, it will support it. But so far, we have no indication of negative volume from Australia, which will start harvesting in mid-October.
- November 15-20 will undoubtedly arrive as well. Then we will find movements of investment funds on the European and Canadian stock market. Quotation benchmarks are changed and profit taking or roll-over operations will be carried out.
- As a sum of conclusions, rapeseed will remain in values between 615-630 EUR EURONEXT indication, but the negative premium will be the demand indicator. And the demand for the moment may calm down. In Ukraine, the rains stop, and sunflower seeds will be prioritized in processing. In other words, processing units will make the switch again, this time from rapeseed to sunflower seed processing.

LOCAL STATUS
The price indications of sunflower seeds have risen, as we mentioned in the last report, to values of 545-550 USD/MT in the CPT Constanța parity. Processors are posting indications of 540 USD/MT. Logistic norm and proximity speak for themselves.
The bonus for HIGH-OLEIC is in the range of 80-90 USD/MT, both for processors and exporters.
CAUSES AND EFFECTS
The main motivation for raising the price of sunflower seeds was the weather, which did not allow the harvesting of seeds in Ukraine. The cargo volumes being late to appear on the flows crossing Romania and Bulgaria, generated the price increase and the temporary change in the behavior of the processors. Practically, they started processing rapeseed to eat up the actual time until the Ukrainian crop arrived.
A whole series of problems began to affect agribusiness. And we are not talking about the micro level anymore, but about a higher level of alteration. We are talking about the appearance of non-compliant batches, more precisely, about GMO goods that alter the Romanian agribusiness market. This traceability that we have been talking about for a long time is not just a minor aspect, but a major one in this landscape. More clearly, large batches of rapeseed and GMO sunflower seeds transited into Romania from Ukraine and were sold to local traders who indigenized the goods and falsified the origin, turning it into Romanian. This is prohibited by law and causes extremely serious problems for the already fragile Romanian agribusiness ecosystem.
Batches of GMOs have reached processing facilities and purity tests have revealed this. Batches of GMOs sold as Romanian origin ended up in the exporters’ accounts, altering whole quantities with which they were mixed for export or intra-community trade. Here is an extremely dangerous side effect of not following traceability. The lifting of all restrictions made this Pandora’s box called GMO open and for it to enter the European Union. We would be very curious and receptive at the same time to hear COCERAL’s position on this. Let’s now understand how they view this aspect and what solutions they could generate to be able to block this phenomenon. We are here and we are open to any solution that could generate to curb this phenomenon.
Also, we would also like to mention the mixing of other materials in the delivered goods in order to generate higher revenues. These are acts of a criminal nature because otherwise what could we call the mixture of sand in soybeans, the mixture of iron filings in scraps and the mixture of radish seeds in rapeseed?
REGIONAL STATUS
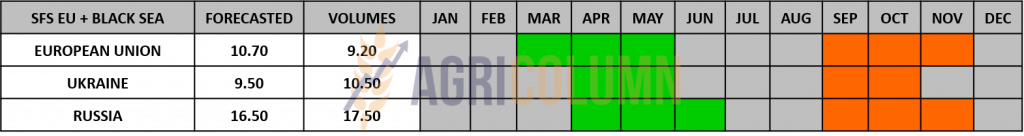
UKRAINE will soon start harvesting sunflower seeds. The rains will stop soon and after a few days of the fields naturally wind up, the combines will be able to get in and harvest. A question mark remains, however, regarding the percentage of the crop that was damaged by mold in the head of sunflower seeds. It remains to be seen.
RUSSIA is also in an obvious delay. Again, the rain prevents the harvest and we anticipate the same problems experienced by Ukraine – moldy seeds in the field.
GLOBAL STATUS
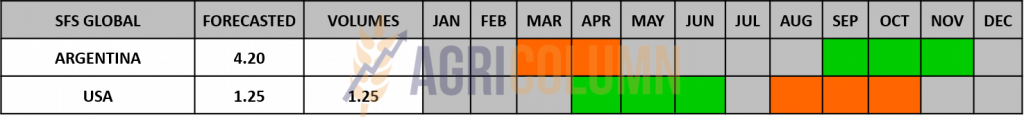
ARGENTINA still does not give new news about the sowing of sunflower seeds. For the moment, we rally to the sentence “no news means good news”.
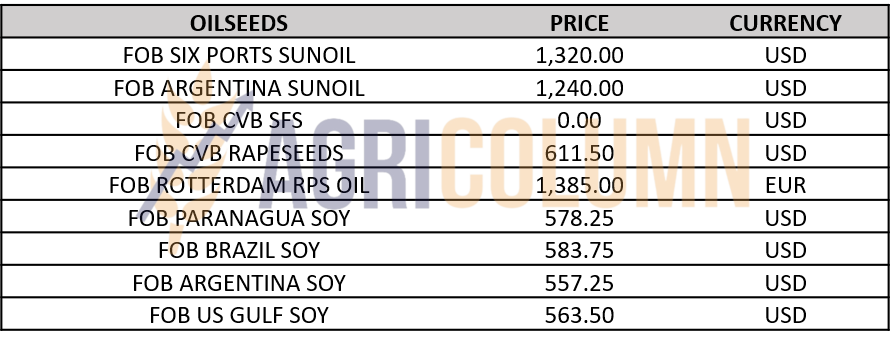
PRICE INDICATIONS FOR OILSEEDS AND CSFO IN MAIN ORIGINS
CAUSES AND EFFECTS
Price support has arrived since then. Rains in Ukraine and Russia halted seed harvesting. What percentage of both countries’ crops will be damaged remains to be seen. The certainty that there are damages is clear and can no longer be ruled out.
Another support factor came from the price of palm oil, which saw a slight increase generated by the OPEC+ decision.
Soybeans, on the other hand, were not the driving force. US volume indices remain flat and do not encourage higher quotes for soybeans.
The demand for sunflower oil has not excelled recently. Crude oil quotes in 6 PORTS hovered around 1,325 USD/MT.
What’s next?
- Seed price support will continue in the coming days. The lack of volumes will generate demand and, implicitly, an increase in the price level, by 10-15 USD/MT.
- It is very difficult today, but if the Ukrainian and Russian crops are penalized by deterioration of quality by 10%, we will be able to witness the transfer of the quantitative loss in the price of the goods. 10% in Ukraine means a minus of 1 million tons, and in Russia a minus of 1.65 million tons.
- Agreeing with the global estimate, we get a minus 5% of the total global production. To this minus could be added, later, it is true, Argentina, where now it is quiet… but also drought.
- A possible downward trend should not exist in the next period. There is still plenty of time before they harvest and deliver from Ukraine, and let’s not forget that their domestic processing also needs seeds, which will create competition.

LOCAL STATUS
Soybean processors have buying indications at 580-590 USD/MT. Between July 1 and October 2, 2022, approximately 43,000 tons of soybeans were imported.
REGIONAL STATUS
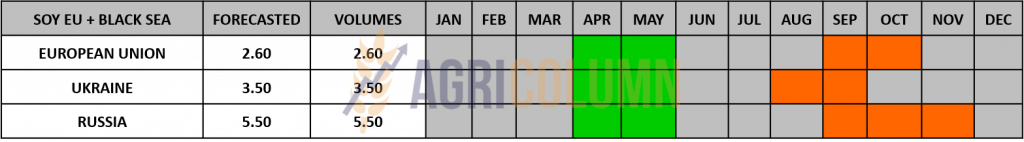
GLOBAL STATUS
USA
Soybean crops remain at the good-excellent level of 55%. Soybean harvest is at 22% of the area and progressing.
Weekly export data showed Mexico was the top buyer with 233,000 tons, followed by China with 157,000 tons. The total soybean contracts for the 2022/2023 campaign amount to 27.5 million tons, an advance of 4.5% compared to last year’s pace. In 2021/2022, the main destinations for US soybeans were China, Mexico, the EU and Egypt.
ARGENTINA
The month in which the “dollar-soybean” program was implemented through the exchange policy has ended, and the success can be seen. Argentine farmers sold 13.9 million tons of soybeans in September.
In terms of weather conditions, there is no good news for Argentina as hot and dry weather is forecast for the next 45 days during soybean planting. Unfortunately, the drought will last longer.
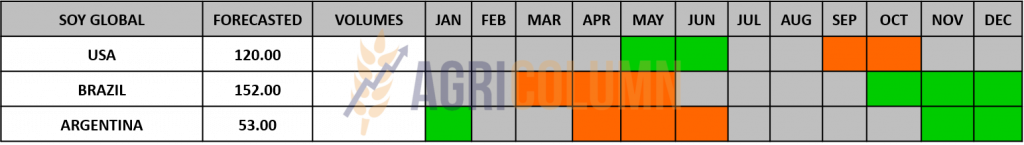
BRAZIL
Conab forecast a soybean crop at 152.4 million tons, up 21% from last year ‘s drought-affected crop. Brazilian farmers will increase the area cultivated with soybeans by 3.4%, to a record 42.9 million hectares, according to the initial forecast from Conab.
Excess rain in some areas of Brazil has slowed the planting of the country’s 2022/2023 soybean crop, and soybean planting progress is estimated at 4.5%. Parana has reached 12% and is the most advanced in the country, and Mato Grosso is at 6.3%.
In Mato Grosso, the main cereal-growing area, last week’s rainfall improved soil moisture and accelerated planting.
Brazil exported 4.29 million tons of soybeans during September, according to government data, down from 6.16 million tons in August and 4.83 million tons in September 2021.
Brazil’s soybean exports in October could reach 3.1 million tons, according to grain exporters’ association ANEC, up from 2.98 million tons in the same month last year.
CHINA
China is the world’s largest soybean importer and October imports are expected to be around 5 million tons.
Soybean meal prices rose to 787.24 USD/MT and will further impact Chinese pork prices.
Lower soybean imports could impact Chicago futures amid a general uptick in food commodity prices.
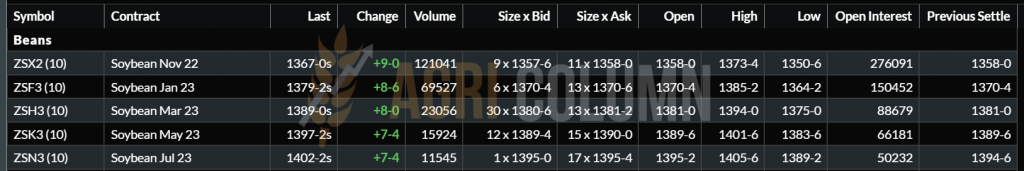
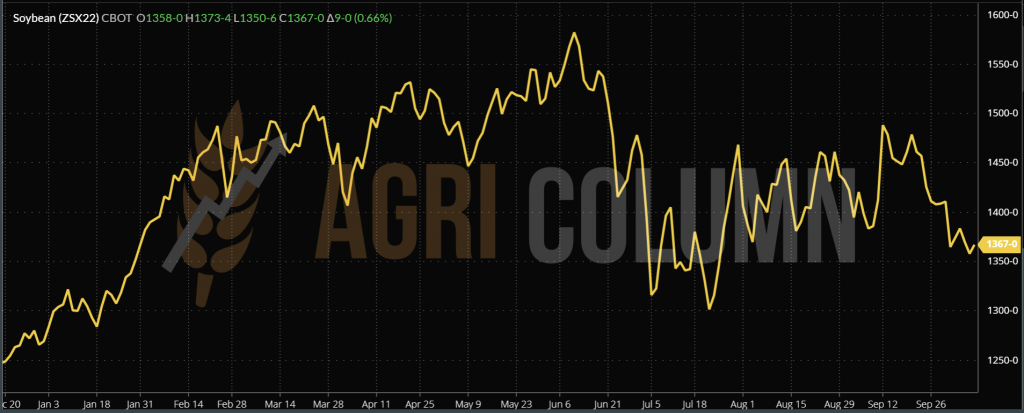
CBOT ZSX22 NOV22V – 1,367 c/bu (+9 c/bu = +3.3 USD)
CBOT SOY TREND CHART – ZSX22 NOV22
The current forecasts of Michel Cordonnier (the most reputable scout in South and North America) regarding global soybean production:
- South America: 5 million tons, up 38.3 million tons or 21.3%;
- Brazil: 0 million tons, up 25 million;
- Argentina: 50 million tons, up 6 million;
- Paraguay: 5 million tons, up 6.3 million.


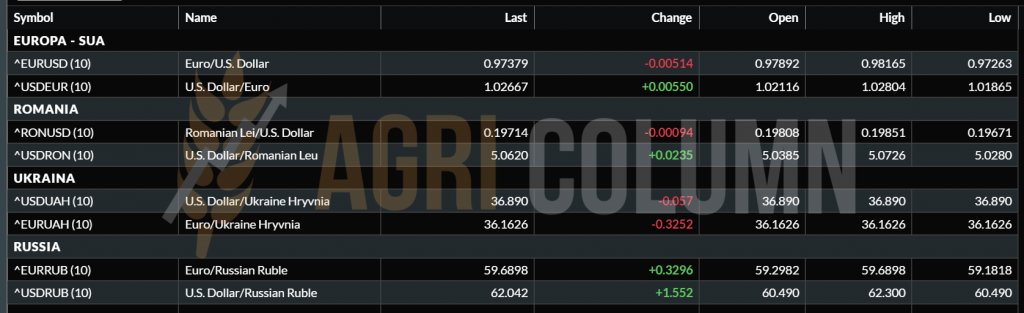
The dollar is coming back!! EUR/USD 0.97:1

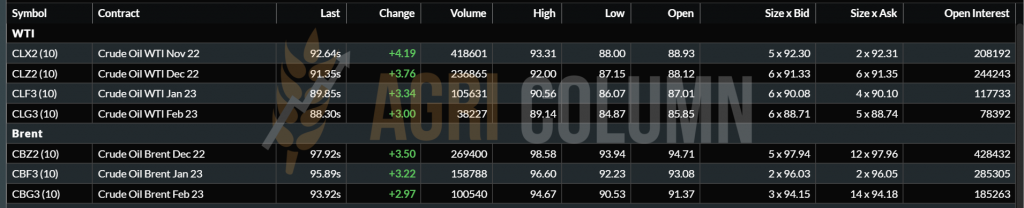
WTI 92.64 USD | BRENT 97.92 USD

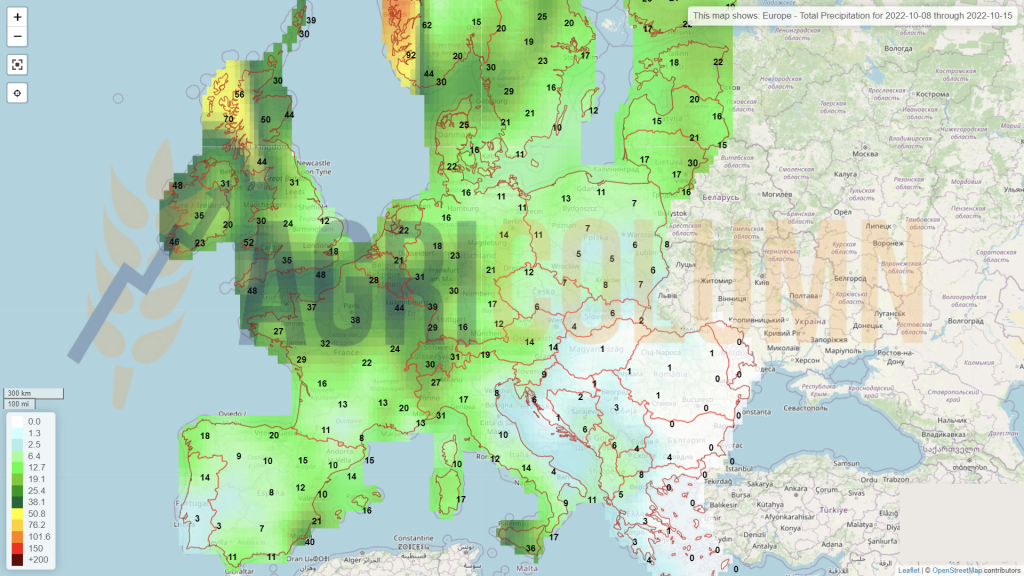
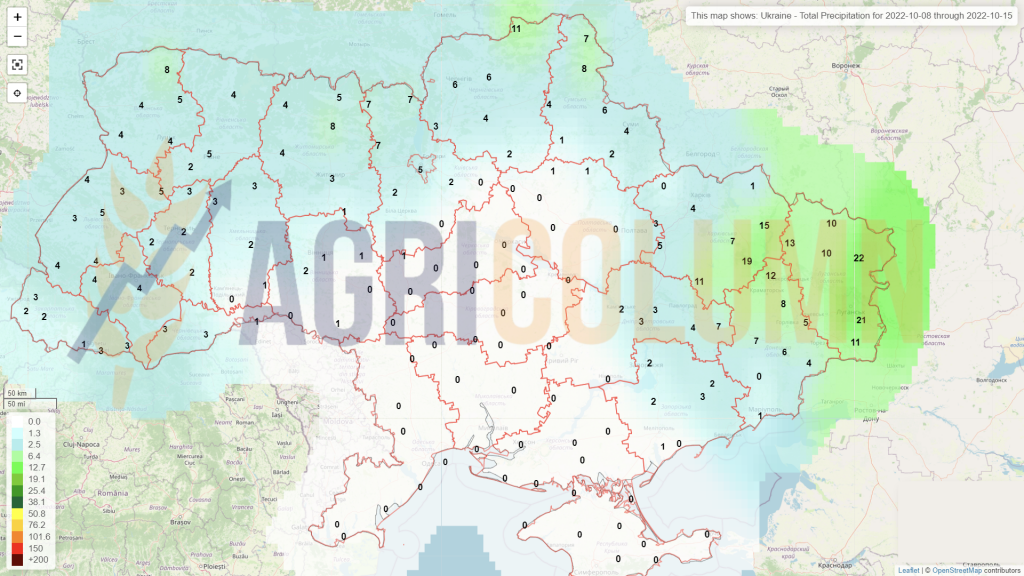
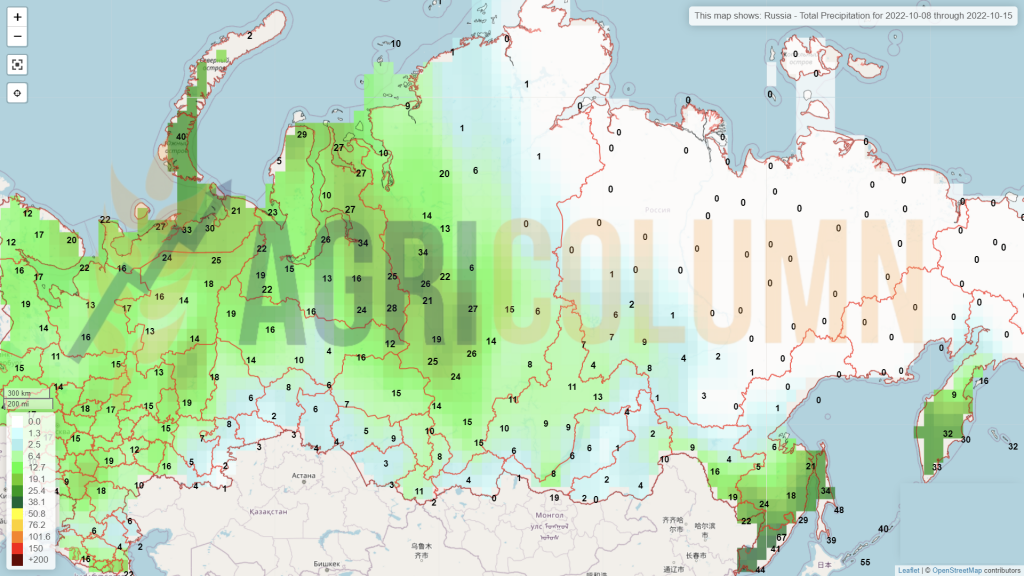
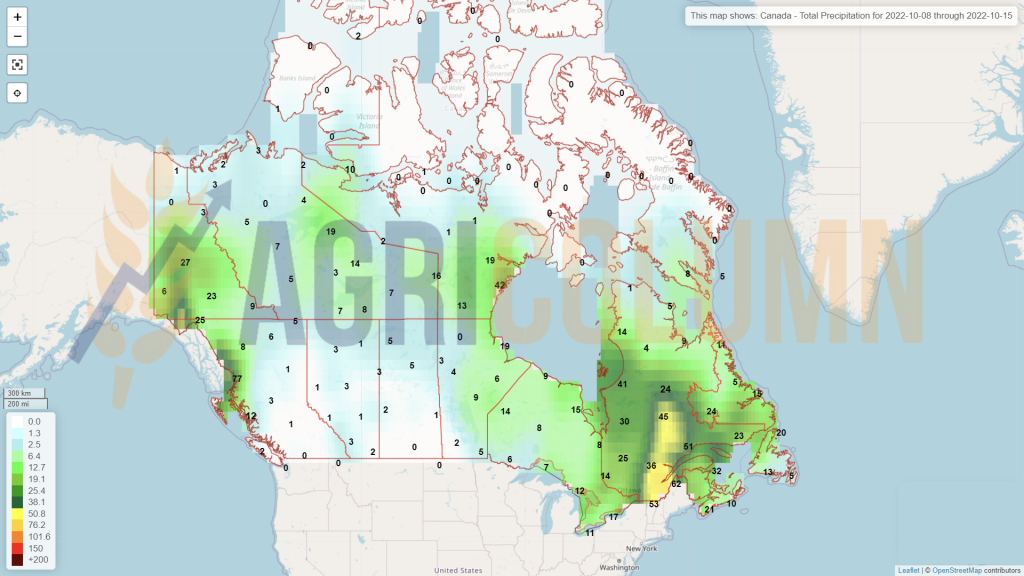
8-15 October 2022
Romania
Europe
Ukraine
Russia
Canada
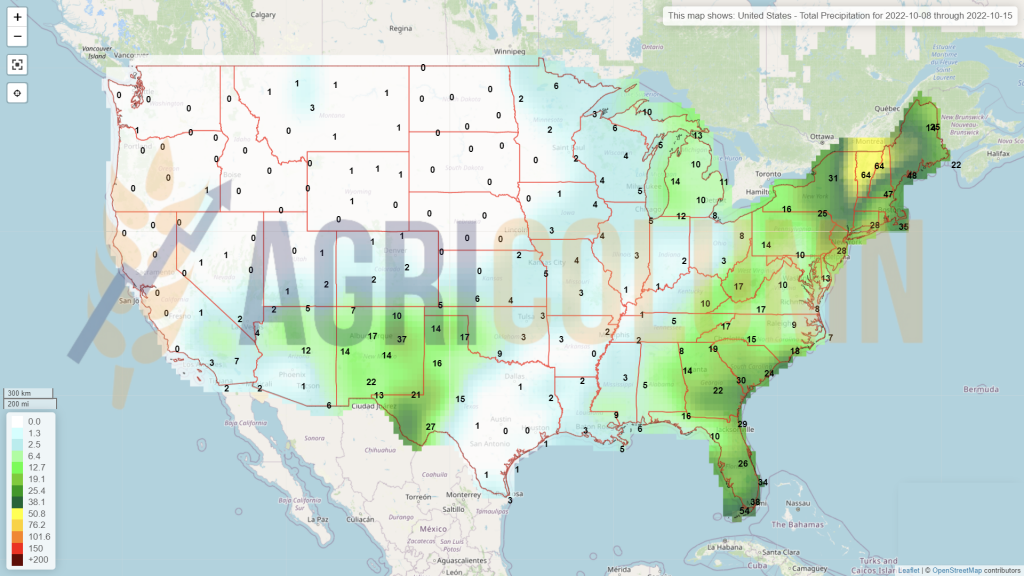
USA
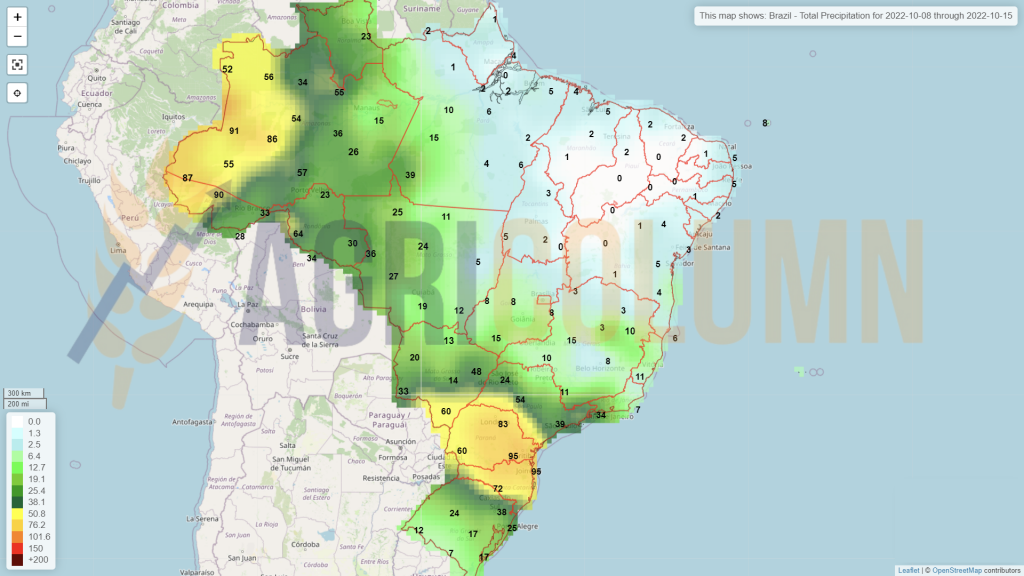
Brazil
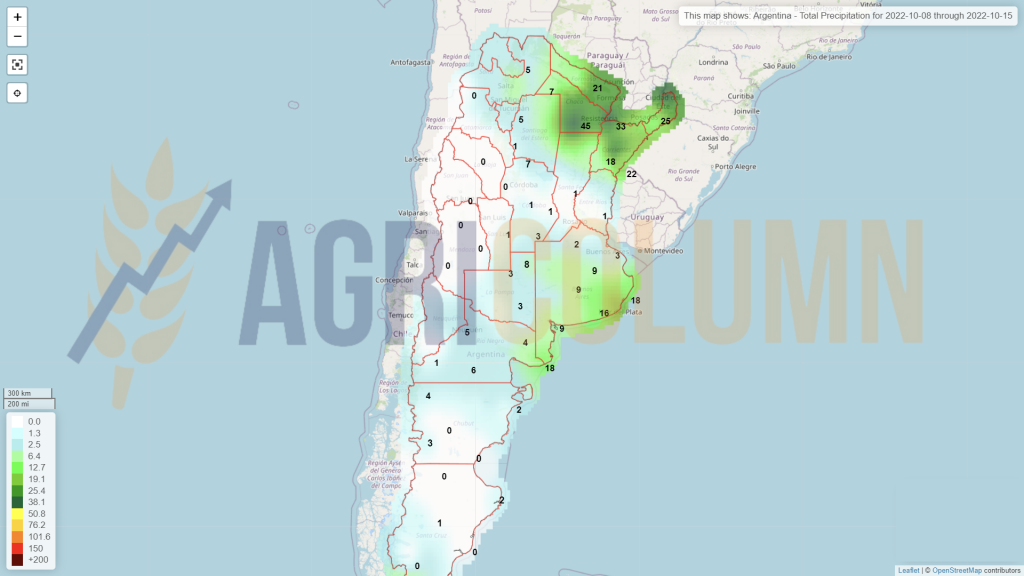
Argentina
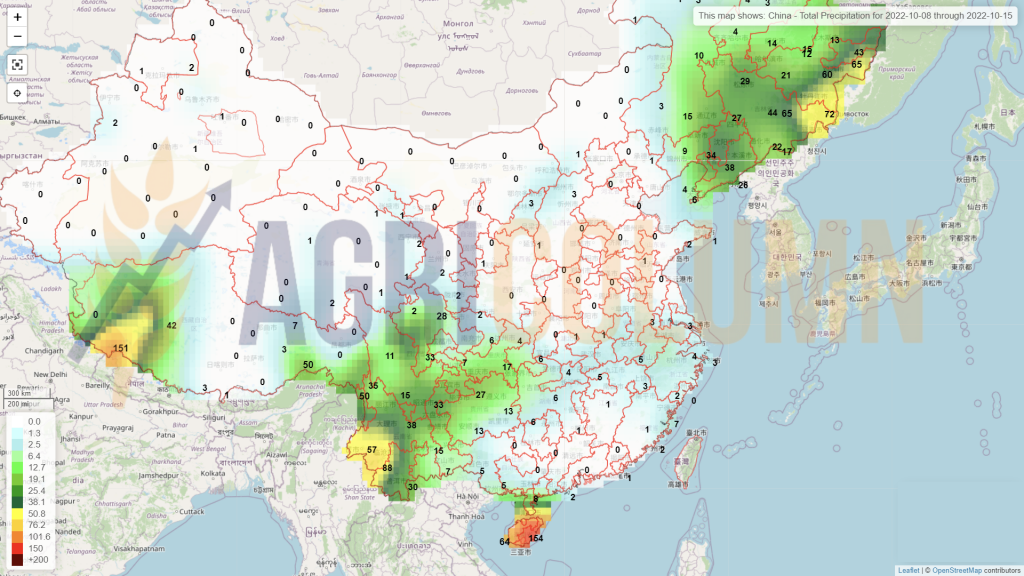
China
Australia