This week’s market report provides information on:

LOCAL STATUS
The price of wheat in the CPT Constanța parity is corrected to the level of 340-343 EUR/MT with a discount of 20 EUR/MT for feed quality. But during this period of time, Romanian farmers do not have an obvious focus on selling wheat.
Many of them are enjoying a well-deserved vacation, while a smaller part is already harvesting sunflower seeds. This low interest can be seen from the lack of interest in the sale, even in the tender organized by BRM – the Romanian Commodity Exchange by ANRSPS – the National Agency of State Reserves and Special Problems. Absolutely no bids have been submitted for this attempted purchase of 45,000 tons of milling wheat.
The wheat harvest is over and, traditionally, we could say that, as a primary consequence of farm capitalization, wheat has entered the wait-for-better phase. An important part of the goods, however, is in the 2nd trading belt, namely in the stocks of local intermediaries.
They, through the mechanisms developed in recent years, have created buffer stocks of goods that they will exploit at a given moment in the market on the distribution chain. We say this to highlight how supply and demand pressure builds in the market. There were times in the past seasons when the stock levels in the premises of the intermediaries varied between 20,000 – 200,000 tons of goods per legal entity.
CAUSES AND EFFECTS
The lapse of time warranted our analyses. From March 2022 until the end of May we clearly and obviously repeated the message of selling a maximum of 2 tons per hectare to capitalize on the levels still supported by the uncertainty coming from two sides: the war in Ukraine and the European and global crop levels.
The peaks of 400-414 EUR/MT in the CPT Constanța parity during that period were apparently not enough and many farmers fell into the trap of endless growth. The FEDERAL RESERVE melted the wheat indications through two consecutive interventions, a fact to which the Istanbul Agreement was also associated, together with the harvest pressure.
The effect we see unfolding will be one of forced cooling of commodity price inflation. The FED will also intervene in September 2022, and the result of the WASDE report of August 12, 2022 informs our analyzes regarding the trends of the next period of discreet but continued tempering of wheat prices.
REGIONAL STATUS
RUSSIA gets a well-deserved crop upgrade of 6.5 mil. tons, jumping it to 88 mil. tons of wheat. However, the quality is in doubt because of the rains that furrow the exact areas where they are harvested. Estimates by Russian traders lead to a share of 60% milling wheat and 40% feed quality wheat, due to quality washout and the potential for field sprouting. Traders are already putting a difference of 25-30 USD/MT between the two qualities.
The problems encountered in the Russian campaign are, on the one hand, related to the availability of machinery involved in the harvesting process. To these is added the availability of spare parts for machines of Western origin, a problem that appears to be insurmountable at the moment.
Russia steps up wheat sales. The beginning of August, more precisely the first 10 days, finds them with an export level of 1.35-1.4 million tons. Russian ships effectively create a sea bridge from the Sea of Azov to Turkey and the Bosphorus Channel, starting from the remote Rostov-on-Don Channel and ending at the port of Novorossyisk. But there are ships of small operational capacity, the so-called handy, with a transport capacity of 12,000-25,000 tons. They are not large tonnage ships, due to the insurance cost set at 5% of the value of the vessel and thus the income from the cargo decreases substantially.
UKRAINE remains flat on wheat production, according to the USDA, and harvest is well underway.
EU gets a downgrade of 2 million tons, despite France’s announced upgrade of 1 million tons, to 33.9 million tons. It is an aggregate effect of European harvest volumes.
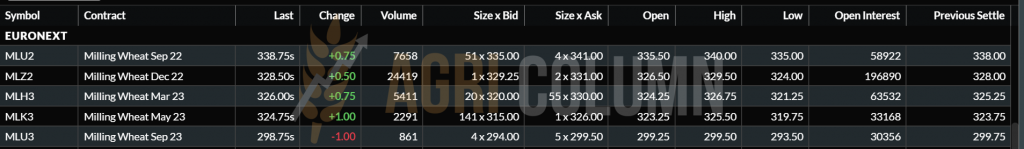
EURONEXT MLU22 SEP22 – 338.75 EUR (+0.75 EUR)
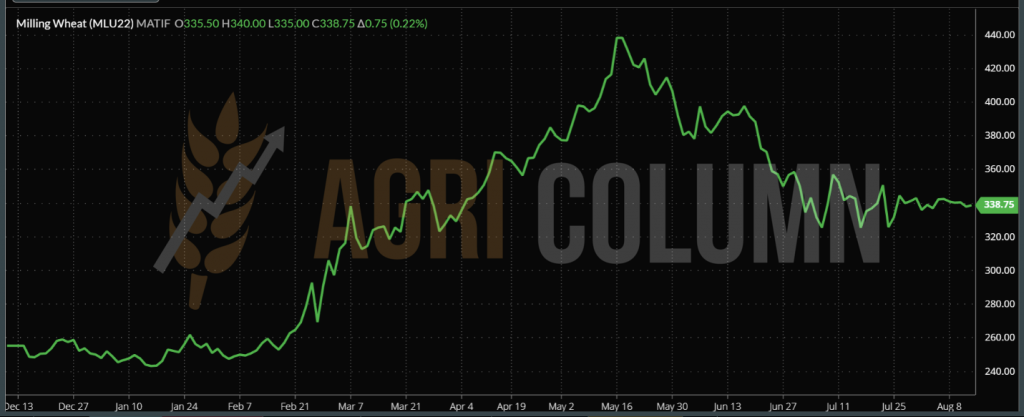
EURONEXT WHEAT TREND– MLU22 SEP22
GLOBAL STATUS
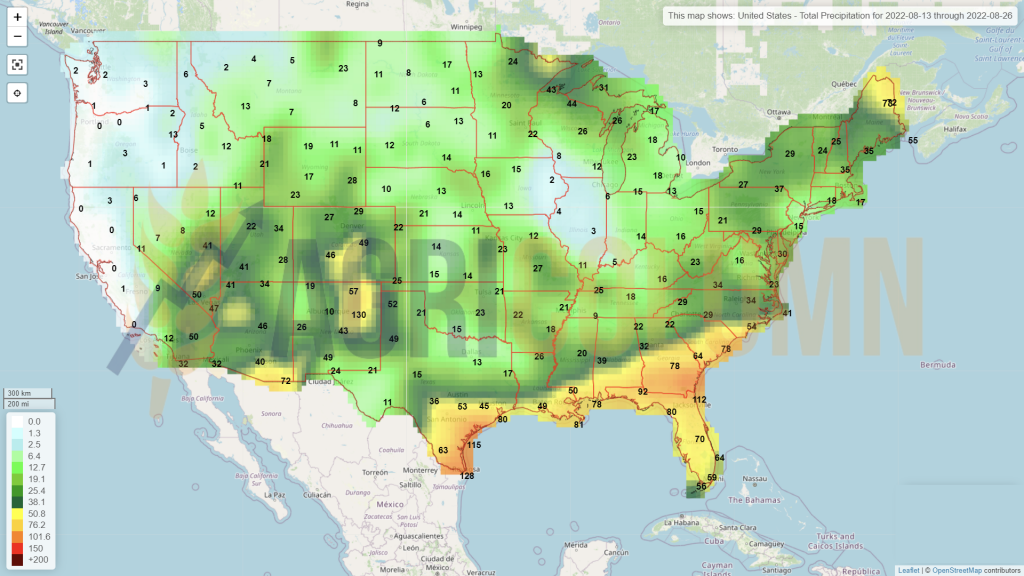
US, broadly speaking, remains the same in terms of volume potential. Their stocks remain in the same volume range, and the general condition of spring wheat remains optimistic for this period. The winter wheat harvest level has crossed the 80% barrier, and the US volume is set at 48.5 million tons.
CANADA receives 1 million tons following USDA assessment. The volume level thus increases to 35 million tons.
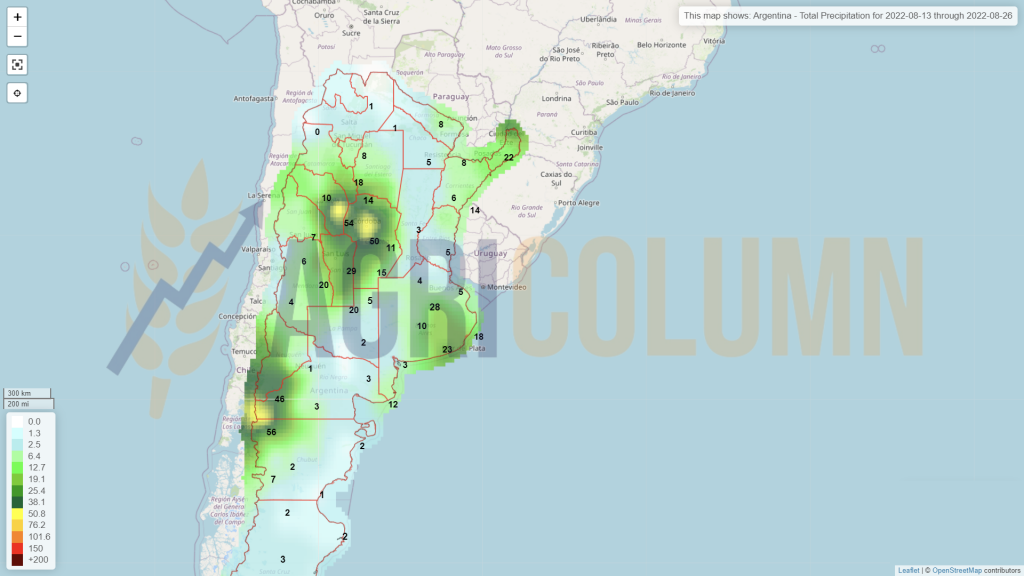
ARGENTINA is degraded by 0.5 million tons and is listed at 19 million tons of crop potential, but our analysis puts it at only 18.5 million tons. We will watch and see together the development of the Argentine crop.
INDIA loses 3 million tons following WASDE report. This is not new; all the traders were working with these numbers. Thus, according to the USDA, India is now at the level of 103 million tons, but the reality is, in fact, 99 million tons of harvested volume.
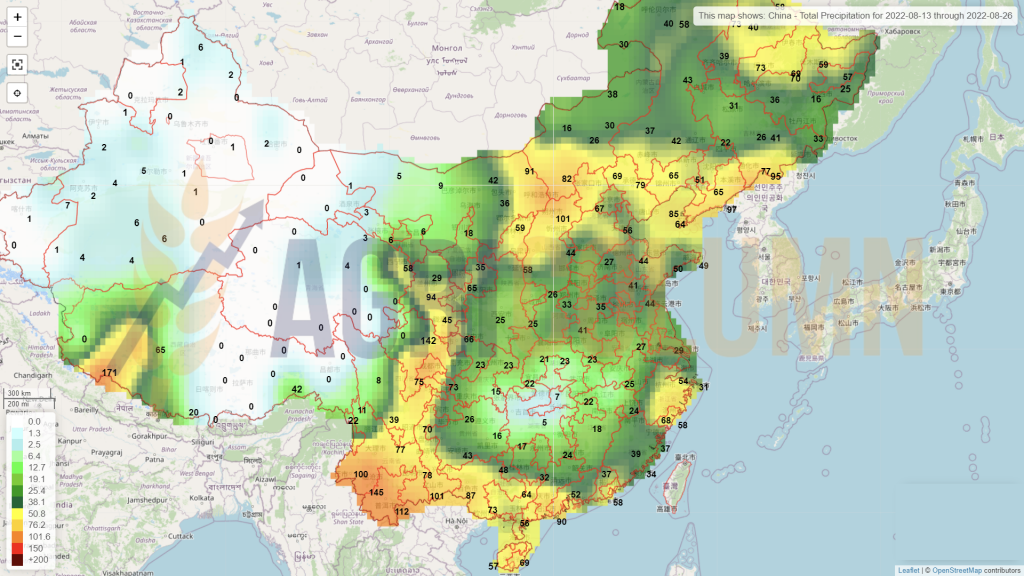
CHINA gets a 3 mil. tons crop upgrade and is marked with 138 mil. tons total production. This narrows China’s import level. China usually imports 12 million tons of wheat.
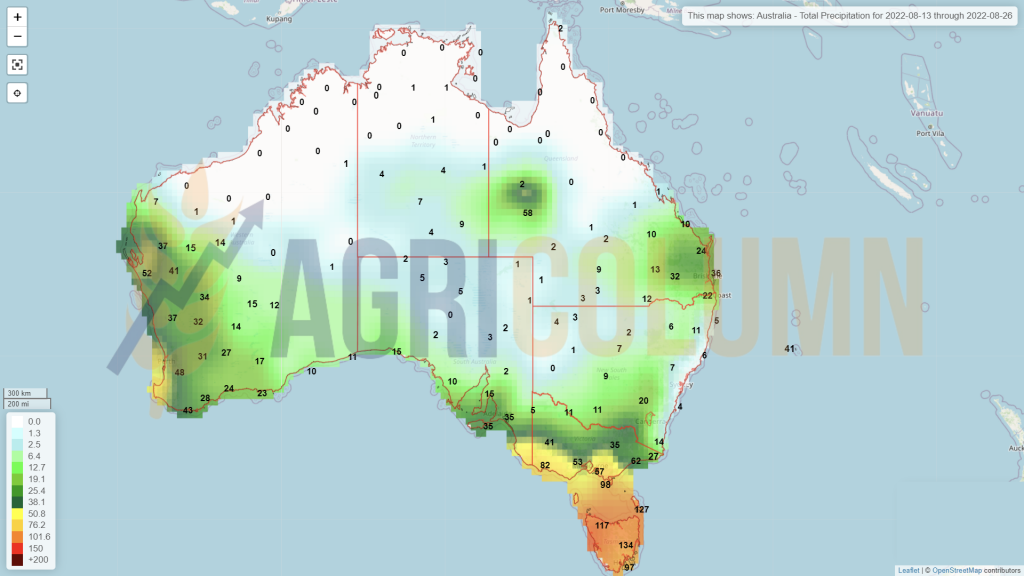
AUSTRALIA, a story that is developing nicely for the second consecutive year, gets a 3 mil. ton crop volume upgrade to reach 33 mil. tons.
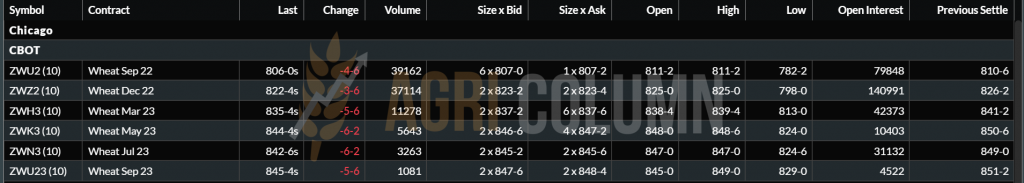
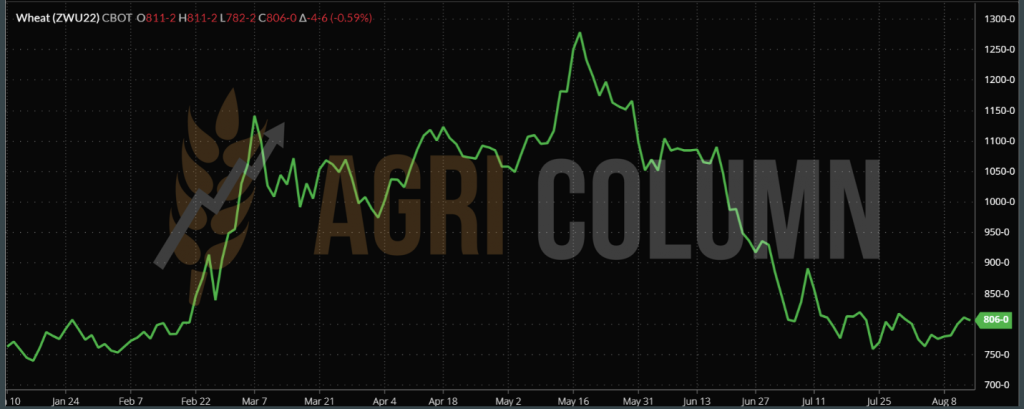
CBOT ZWU22 SEP22 – 806 c/bu (-4 c/bu = -1.47 USD)
CBOT WHEAT TREND CHART– ZWU22 SEP22
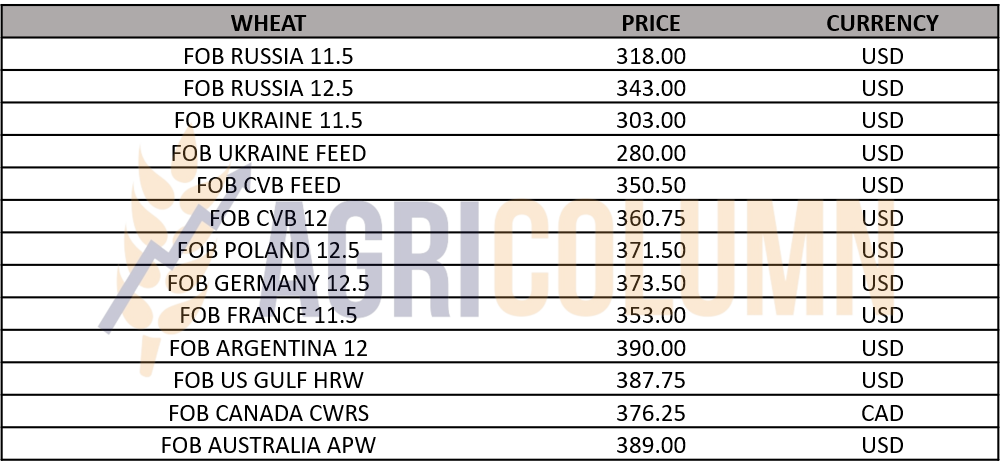
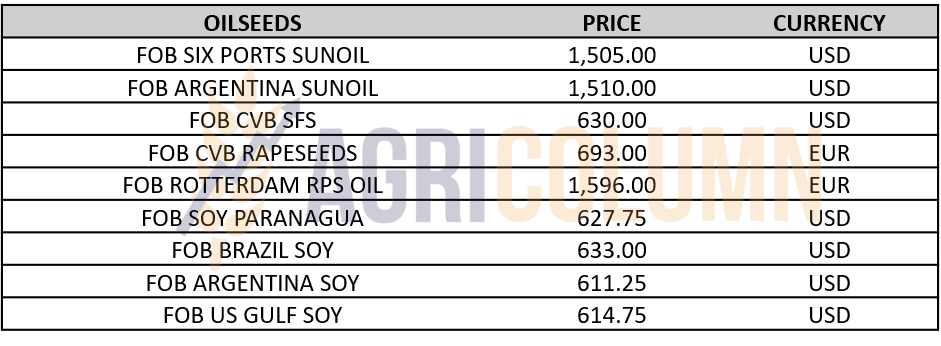
WHEAT PRICE INDICATIONS IN MAIN ORIGINS
CAUSES AND EFFECTS
First of all, in the causes chapter, we would highlight the Russian effort to sell wheat. Russian harvest volumes are partially guaranteed by the USDA and the 88 million tons does not include the Crimean crop. With this crop and what is being mined from the Russian-controlled southeastern Ukraine, we could see a total level of 95-96.5 million tons indisputably.
As we said in the last issue, Russia gave up the “safety corridor” for helping countries in difficulty against the lifting of sanctions on its ships, as well as the permission to trade fertilizers. And this is clearly visible. August is one that will serve as a landmark in Russian wheat sales. Their target is 5 million tons in August 2022. Frankly, we don’t see them being able to meet it, and this will cause Russia to become more competitive, with the tax change being a factor that can help as a price component. Let’s not forget that during all this time, Russia did not stand idly by, about 1.5 million tons being exported via Kazakhstan.
Another cause that determined the cooling of the wheat price was the start of operation of the Ukrainian export from Odessa. One by one, the ships started to leave, but their destinations made us wonder what kind of humanitarian corridor this is, if they reached Turkey and the EU? Leaving this rhetorical question behind, the opening of export from Ukrainian ports has in turn caused a factor of pressure on the price of wheat, even if the wheat has not yet come out in the expected volumes.
The world wheat balance is beginning to balance. China compensates for volume losses in India, Russia fully compensates for the European Union, Canada and Australia bring more volume for the next period. The conclusion is in line with the expectations of our analyses, namely that wheat prices have no reason to rise in the near term.
The global synthesis indicates a need for obvious supply but at affordable prices. And Russia, with a share of at least 25% of the global wheat trade, brings exactly that, affordable prices. Even if it doesn’t suit them, Russia has to sell at these levels. Volumes create pressure and the need for cash flow is obvious. Russia’s step back by accepting Ukrainian exports from Odessa is actually a big win in this whole market context. Russia is regaining its place in global trade and bringing, along with cargo volumes, price moderation. At least for a while.

LOCAL STATUS
Indications of feed barley in CPT Constanța parity remain anchored at the level of 285-288 EUR/MT. There were days in the past week when they rose to the level of 300 EUR/MT, but for a very short time, more precisely on August 10, 2022. Barley is following the trajectory of wheat and although price indications should have been 298 EUR, they are fined by the Russian volumes in the Black Sea basin.
REGIONAL STATUS
The port of Varna has more generous directions than those offered by Constanța. Neighbors in Bulgaria indicated 295 EUR/MT for feed barley.
The State of Jordan organized through MIT a tender for the purchase of about 60,000 tons of feed barley. Despite the presence of 4 companies that submitted price offers, the lowest being from the Australian Grains company set at 346 USD/MT CFR Aqaba, the tender was cancelled. MIT Jordan’s target price was 336 USD/MT, but no participant wanted to cut the level to the Jordanian target.
BARLEY PRICE INDICATIONS IN MAIN ORIGINS


LOCAL STATUS
The price of corn in the CPT Constanța parity remains anchored in the area of 300 EUR/MT. Quotations for the new crop are, however, out of phase for the time being compared to the Romanian harvest volume.
Locally, processors and feed mills are diligently looking for quantities of corn from the local crop. However, reluctance is the watchword in these terrible days for the Romanian corn crop. Shily, in some areas entered the “first cuts” mode, but yields per hectare are disappointing.
The USDA report puts us at 10 million tons, in its characteristically conservative style. A new review will be taking place at in the September report.
CAUSES AND EFFECTS
Absolutely nothing can change the disaster of the corn crop in Romania. Farmers are assessing the damage and, in addition to the lack income from the lack of goods to sell, they now have on the bill the invoices due for the inputs that financed the hectares of corn.
It is, if you like, a very loaded payment note, which will bring in many of the small farms in Romania a high potential for bankruptcy. The effects of this drought transferred to the balance sheet of Romanian farms will have a negative charge and will affect the financing potential of the farms in question for the continuation of the production cycle related to the 2022-2023 season.
REGIONAL STATUS
UKRAINE, as we said in the previous issue, looks very good. USDA, through the WASDE report, raises the harvest volume forecast to 30 million tons, representing a significant upgrade, a 20% jump in volume from 25 million to 30 million tons. Ukrainian corn is mostly located in the north of the country and is, in this case, somewhat protected from the vicissitudes of the war that is being waged on the territory of this country.
RUSSIA also gets back half of the original degradation, i.e. 0.5 million tons, with a potential total harvest volume of 15 million tons.
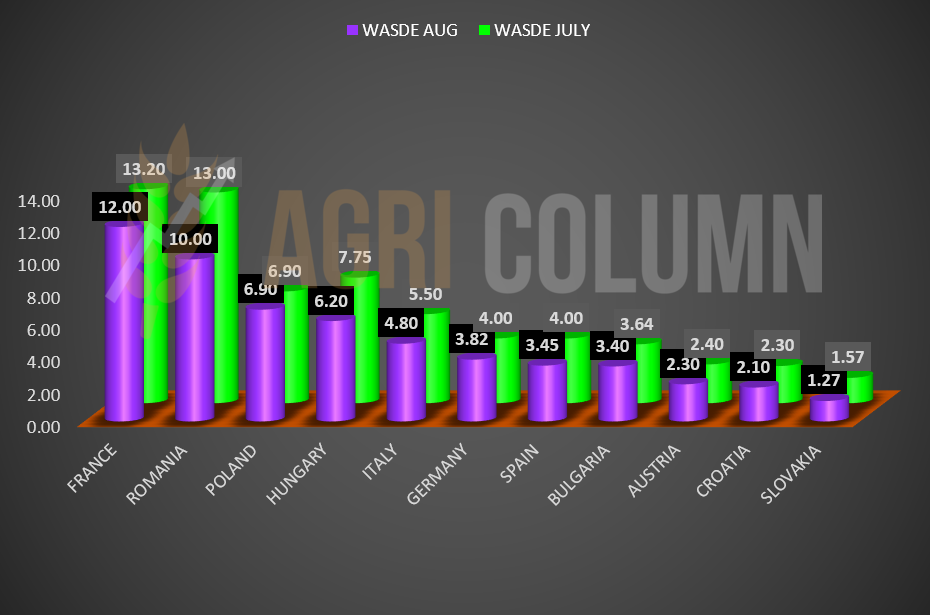
The EUROPEAN UNION is degraded, but in the USDA’s own style. Despite the volume forecasts which, according to our analysis, indicated 55 million tons (totally in agreement with Strategie Grains which indicated the same level), the USDA only goes down to the level of 60 million tons, i.e. by only 8 million tons. We’re used to the USDA and the gradual way they review crops, and this doesn’t surprise us at all.
We insert a graph comparing USDA July vs. USDA August forecasts to visually understand the differences created by the terrible drought that was accompanied by one of the 6 warmest Julys in the last 146 years.
USDA July vs. USDA August 2022 (million tons)
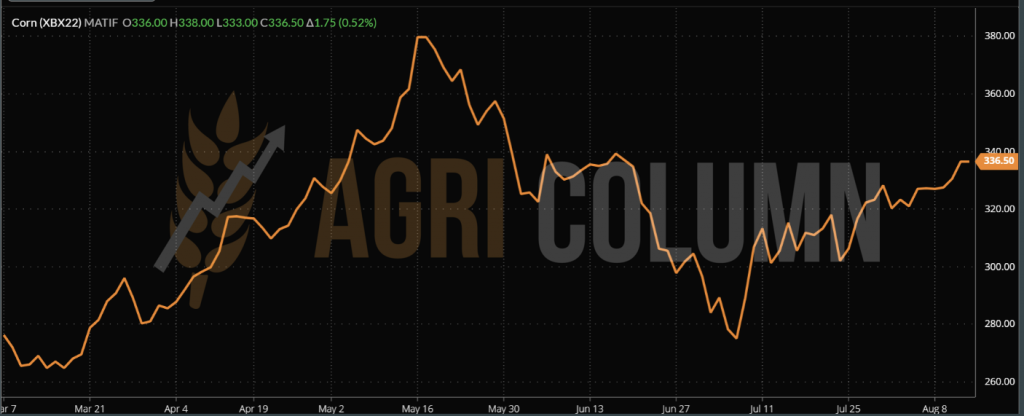
EURONEXT XBX22 NOV22 – 336.5 EUR (+1.75 EUR)
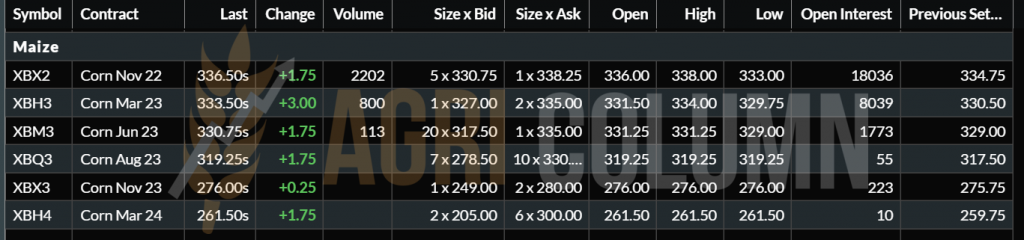
EURONEXT CORN TREND CHART – XBX22 NOV22
GLOBAL STATUS
The US receive the shock of heat and lack of water. The USDA downgrades the US corn crop to 365.58 million tons, from 373 million tons. All of the decrease comes from re-estimating production, which drops from 177 bushels/acre to 175.4 bushels/acre, meaning yield per hectare drops from 11.1 tons to 11 tons. The decrease is important, if we also associate it with a lower level of stocks in the USA by about 2.08 million tons. Cumulatively, the forecast volume reduction of 7.4 million tons and 2.08 million tons decrease in stocks generates a deficit of 9.48 million tons.
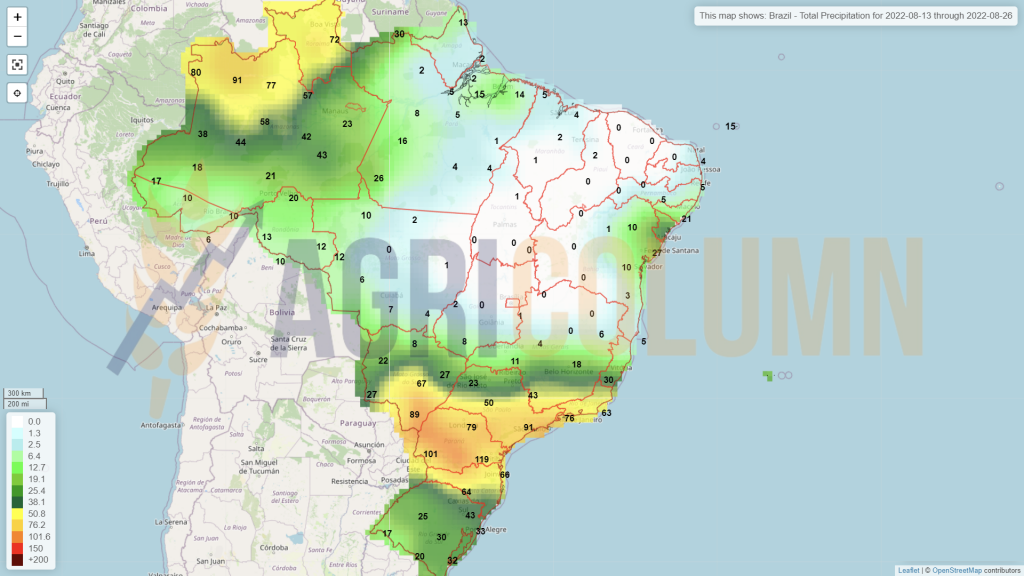
BRAZIL remains unchanged in USDA forecasts, with 116 million tons of 2022 production Safra + Safrinha and projection for 2023 of 126 million tons.
ARGENTINA also remains unchanged, with 53 million tons this season and a forecast of 55 million tons next season.
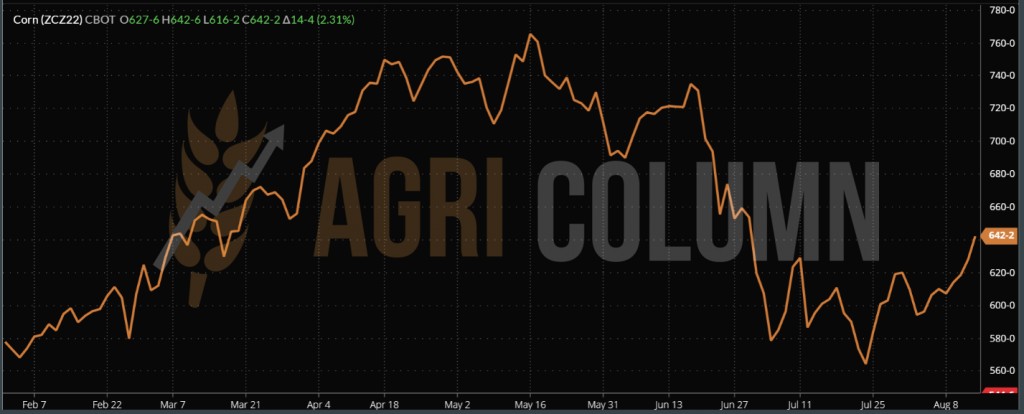
CBOT ZCZ22 DEC22 – 642 c/bu (+14 c/bu = +5.5 USD)
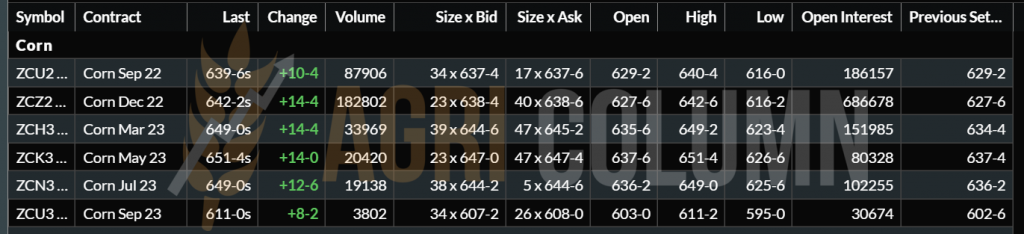
CBOT CORN TREND CHART – ZCZ22 DEC22
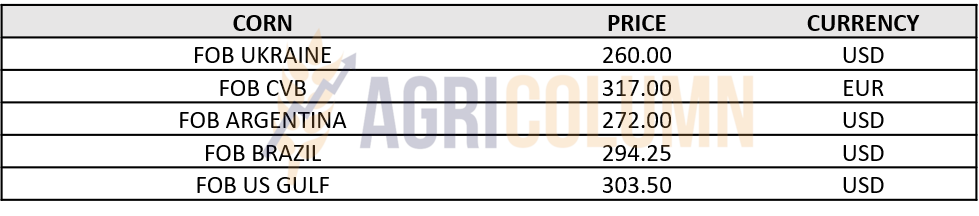
CORN INDICATIONS IN MAIN ORIGINS
CAUSES AND EFFECTS
As early as May, we predicted that corn would become the star of the year, as it happened in 2020. Of course, we did not see the disastrous effects of the drought in Romania and Europe, but at that time, we saw the long-term effects in the US and the slowness of flows from Ukraine.
Today we see causes that have generated extremely low corn production at the level of the European Union, and at the same time, the decreases in production and stocks in the USA. So we have multiple causes spilling over globally. The US and Europe are two extremely important producers of the raw material.
What’s next in terms of effects? First, we will see how the corn will actually support the wheat. The price difference between EURONEXT SEP22 WHEAT and NOV22 CORN quotes are separated by only 2 EUR in favor of wheat. But from August 15-20, the funds will start liquidation of positions and roll-over to SEP22 wheat.
Very soon we will end up with the DEC22 reference for wheat, which today indicates 328.5 EUR, that is, we are entering the scenario with corn more expensive than wheat. Here the market will regulate and your wheat will be pulled up by the corn, which will be supported by Supply and Demand.
Ukraine, as we said in the last issue, will become a pillar of supply for the EU and we will see an extremely large amount of goods from this origin crossing the western borders with Romania and Poland, towards Constanța with an intra-community destination. The shortage of about 13-14 million tons in the European Union will be partially compensated by Ukraine, by a lower consumption and a partial replacement with feed wheat.
With the start of the corn harvest in Ukraine, we will see how China’s source of supply shifts to the Black Sea basin. Logistics explains absolutely everything, and if today China buys from Brazil, it is for the simple reason that it has this option open, the goods being available there. But the logistics cost from Brazil to NE Asia is 55 USD/MT.
The US has a logistics cost of 65 USD/MT today and is well behind Brazil in terms of sales volumes. With the harvest of corn in Ukraine, China’s focus will be shifted here in the basin, with the logistics cost being only 42 USD/MT. So we have a difference of 13 USD/MT compared to Brazil and 23 USD/MT compared to the USA. This will support corn in the Black Sea region.
And with this effect we will see the support of corn in the long term, because September is coming, and the rains in Ukraine will delay the harvesting process, then generating drying costs, in the condition of expensive gas. We will also see price increases due to the lack of delivery availability to the assigned ports, Odessa and satellite Chronomorsk.
What we will see in the long run will be a high default rate on the part of Ukrainian sellers. Goods sold cheaply due to the restriction of access to the sea route find their way today through this logistics route. And Ukrainian sellers will or will not use force majeure to break contracts that were drawn up at ridiculously low prices of 70-80 USD/MT EX-FARM. This effect will also generate price support.
And if you are wondering if Russia will allow this corridor to continue to operate, the answer is only one, yes, definitely. Why? For the simple reason that it does not want to disturb Mr. Xi in his attempt to buy corn at a competitive price from the Black Sea basin. Mr. Xi himself called Putin in the run-up to the Ukraine invasion and warned him to remain calm until the Winter Olympics in China close.
After all, Russia gained infinitely more from the Istanbul Agreement, through the right to ply the seas and oceans with Russian ships and the fertilizer trade. The latter is another vital element, as fertilizers must be sold. What to do with them if you produce them? Store them? There is no point, they will only generate costs, no profit, not to mention that when they are potentially released to the market, they will cause massive price drops. And like a zero-sum game, the world needs fertilizers. As is Russian gas, which is a favorite play target. The profile is identical. What should Russia do with the extracted gas? They have to sell or they stop mining. It’s very simple. One way or another, Russian gas must flow. That they blackmail and play games is a norm of Russian policy that has been perpetuated for years, not necessarily following the sanctions generated by the invasion of Ukraine. Maskirovka is the name of the Russian game and it has applicability in everything.
Another effect that would occur later would be a potential degradation of the American crop. And this topic deserves to be followed with all attention, which we will do, for sure.

LOCAL STATUS
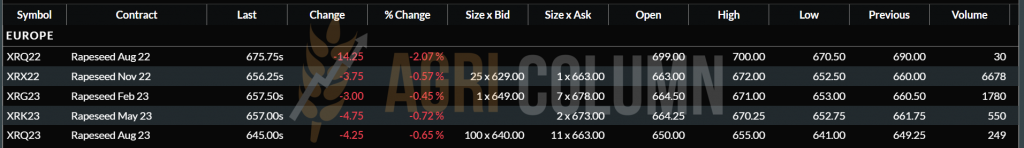
Rapeseed indications are maintained at a level above the level of 650 EUR/MT in the CPT Constanța parity. Within the domestic market, prices decrease with the logistical difference between the processing units and the port of Constanța.
Thus we visualize the EURONEXT NOV22 indication being equated in terms of price by certain buyers from the port of Constanța, while others discount this indication by 10-30 EUR/MT, depending on the place of delivery – in the country, at the processing units or in the port of Constanța.
CAUSES AND EFFECTS
One thing is certain. Processors are changing these days from the use of rapeseed to that of sunflower seeds, an absolutely normal thing for this time of the year, and their interest in the purchase of new cargo lots is determined only by the possibility of including storage until November 2022.
REGIONAL STATUS
Here it is worth noting Russia, which will waive the export ban on rapeseed starting August 31, 2022. This will facilitate the export of Russian rapeseed to Asia. China will be the preferred destination for Russian rapeseed.
We are therefore talking about an export by rail to China via the Asian route. Russia has a canola crop quoted at 3.9 million tons, which is a record and an increase of 1 million tons from the previous month in Russia’s account.
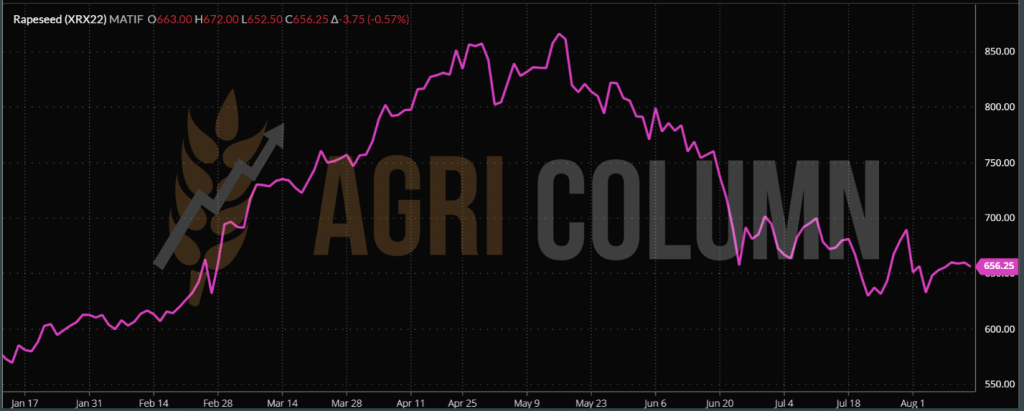
EURONEXT XRX22 NOV22 – 656.25 EUR (-3.75 EUR)
XRX22 NOV22 CHART
GLOBAL STATUS
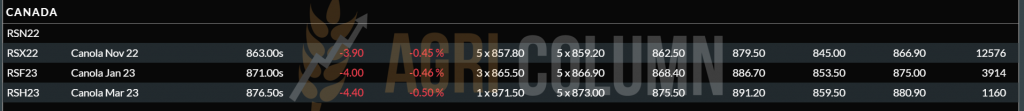
In CANADA, canola development is on schedule with no problems at this time. No particular problems are seen in the coming week.
AUSTRALIA has also received rainfall and canola is at its optimum development stage.
ICE CANOLA RSX22 NOV22 – 863 CAD (-3.9 CAD)
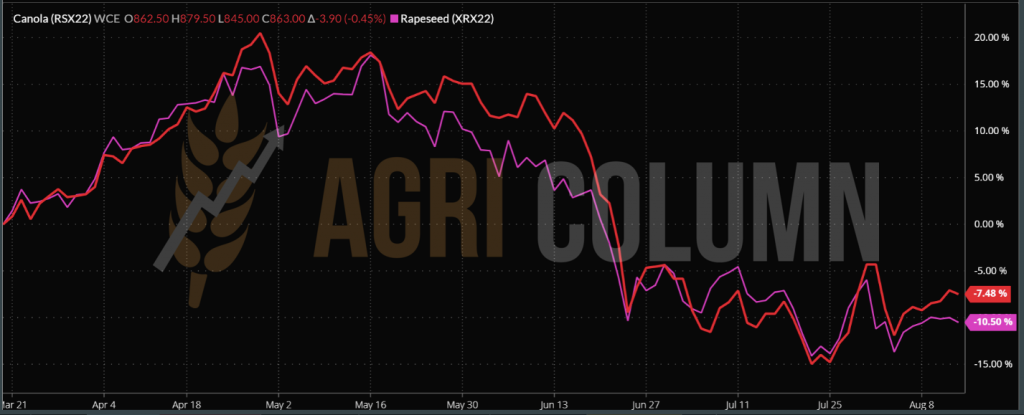
COMPARATIVE GRAPH – EURONEXT vs. ICE CANOLA TREND
CAUSES AND EFFECTS
As usual, rapeseed has several factors that influence it in its course. With rapeseed/canola boosting for human consumption and the strengthening role in VEGOIL, soy’s influence is seen in every swing up and down on the CBOT.
PALM OIL also influences the price of canola and we see how the latter’s rise has generated support for canola, helping to recover from a decline. Palm oil returned to the 4300 MYR (Malaysian Ringgit) area.
At the same time, oil was a correction factor on the price of rapeseed. The fall to 94 USD/barrel BRENT corrected the rally. But Brent rose to close the trading session by 4 USD to 98 USD/barrel, so we should see a positive note for rapeseed in Monday’s Euronext session.
The price of rapeseed oil in Rotterdam rose by 8.5 EUR to 1,596 EUR/MT in FOB parity. As I said, an interest in rapeseed will be much more augmented in the October-November period, but articulated from the point of view of the price of VEGOIL and fossil energy.

LOCAL STATUS
The indications of the port of Constanța have reached the level of 600 USD/MT, and the local processors do not leave anything lower. For firm lots the same price level is offered in DAP Processor parity.
However, we see how a pressure market is forming that we anticipated, namely intermediaries and multinationals that have a business relationship in Bulgaria. They are actually everywhere in the areas where they are harvested and offer prices of 590-600 USD/MT FCA FARM southern Romania. The cargo is then sold to processors in Bulgaria, who offer 630-640 USD/MT.
REGIONAL STATUS
BULGARIA will generate a low crop of sunflower seeds. A yield of 1.7 tons per hectare will lead to a crop level of 1.5-1.53 million tons, against an initial forecast volume of 1.8-1.9 million tons. Here we must mention the intention and the processing requirement of 3 million tons. Where does the difference come from? From Romania and partly from Ukraine. Now we understand the recurring competitiveness with which they act daily on the Romanian market.
UKRAINE begins to suffer from heat in the Odessa region and volume forecasts begin to melt at 38 degrees temperature. Here we encounter another phenomenon that does not surprise us. With the opening of access to the three ports, local processing needs raw material, and Ukrainian farmers see the possibility of capturing a much better price level than what they have had so far.
We will also see a wave of defaults here by invoking the force majeure clause on two levels. At one time, some Ukrainian farmers will no longer honor their contracts with buyers and factories because of the price increase. On the second level, we will see merchants who will no longer honor their contracts in Ukraine (to processors) and contracts in Romania and Bulgaria, for two reasons. On the one hand, Ukrainian farmers will no longer deliver the goods, and on the other hand, the price increase will make the trader-intermediary want a much higher price for the goods.
In Ukraine, the price of crude oil has already risen by USD 200/MT, and processing units are paying 15,000 UAH/MT for raw material. Ukraine will start exporting crude oil and thus the pace of deliveries to Romania and Bulgaria will be greatly reduced.
At the same time, we shade Ukraine’s “intention” to send 1.6 million tons of sunflower seeds to Romania and Bulgaria for processing and shipment to EU consumption, which is set at a level of 200,000 tons of crude oil monthly. In Romania, there is not much room for processing for other destinations unless this… is expressly requested. We will watch and see the results of these declarations of intent. The data we have indicates a maximum of 1.25 million tons of export from Ukraine, speaking of raw material, of course.
The EUROPEAN UNION lowers the forecast volume of sunflower seeds to 9.7 million tons, i.e. a minus of only 1.2 million tons compared to the initial forecast of 10.9 million tons.
RUSSIA is raised to the level of 17 million tons. This increase of 1.5 million tons is due to the increase in the sown area, together with an export level of 0.8 million tons.
CAUSES AND EFFECTS
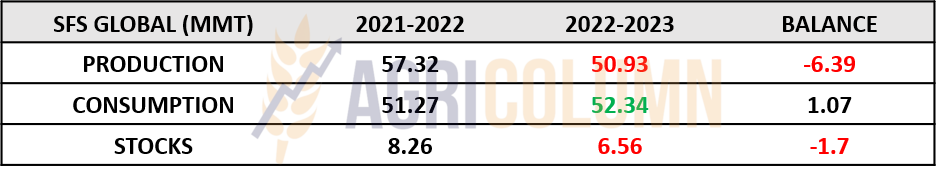
Global sunflower seed production will be 6.39 million tons lower this season, falling below the 2020 level. Thus, we will have global production of 50.93 million tons, compared to 57.32 million in 2021.
Consumption increases by 1.07 million tons, up to the level of 52.34 million tons, and here we have an apparent paradox. We consume more than we produce.
The basis remains stocks lower than last year by 1.7 million tons, of 6.56 million tons. But what the numbers ignore is that of the 6.56 million tons, 1.5 million are from Russia, which has increased production to 17 million tons from 15.5 million initial production. As we well know, Russia exports crude oil at a horribly high tax, so we will have much more expensive oil.
The effect of the numbers, combined with the much deeper effects of the drought, are driving the price of the commodity to a higher level than that shown today. Much higher. We’d venture to say we’ll be comfortably close to 700 USD/MT, if not over that threshold.
CSFO AND OILSEEDS INDICATIONS IN MAIN ORIGINS

GLOBAL STATUS
Globally, soybeans are corrected by the WASDE report, and you can read more about this topic in the August 13 AGRI Column special report. The context, however, is one that raises questions, because in the future, even in the condition of a much better yield, we have the following picture:
- The US is experiencing drought conditions in the Midwest that have persisted for some time and could jeopardize the total US soybean volume. It is an area to watch further.
- American exports continue, but are penalized logistically. The main competitor, Brazil, sells twice as much as the US, motivated by logistics costs. The logistics difference between origins to NE Asia is 10-11 USD/MT in favor of Brazil.
BRAZIL is kept at the same level of production of 126 million tons and future crop of 149 million tons.
ARGENTINA indicates the same level of production of 44 million tons and a future crop forecast of 51 million tons.
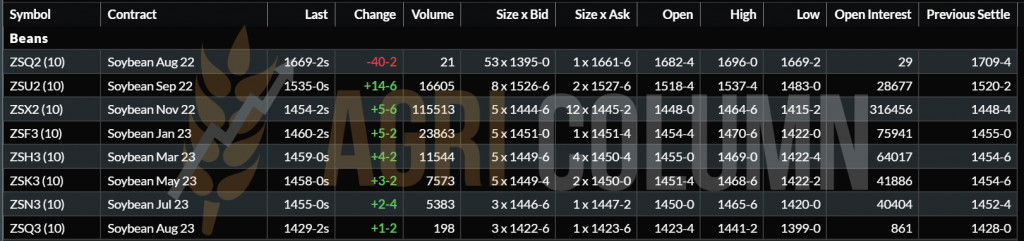
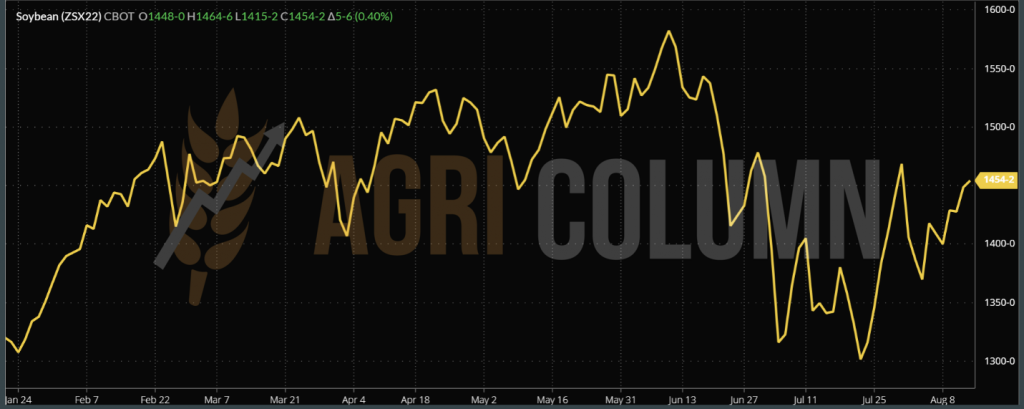
CBOT ZSX22 NOV22 – 1,454 c/bu (+5 c/bu)
CAUSES AND EFFECTS
Under these conditions, it is somewhat difficult to believe that soybeans will again reach levels of 1,580 c/bu. Only if the big three players in the soybean market experience serious problems due to lack of precipitation and excessive heat, we could still reach such indications. But if August passes in the US without major problems, we will see a relaxation expressed in the CBOT.
CBOT SOY TREND CHART – ZSX22 NOV22


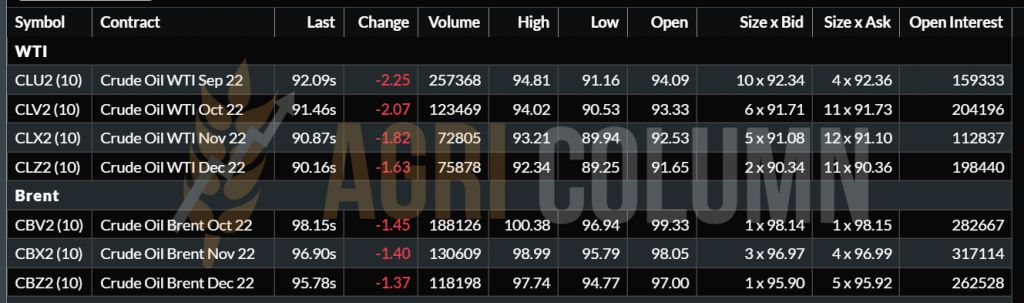
WTI 92 USD/BARREL | BRENT 98 USD/BARREL

13-26 August 2022
Romania
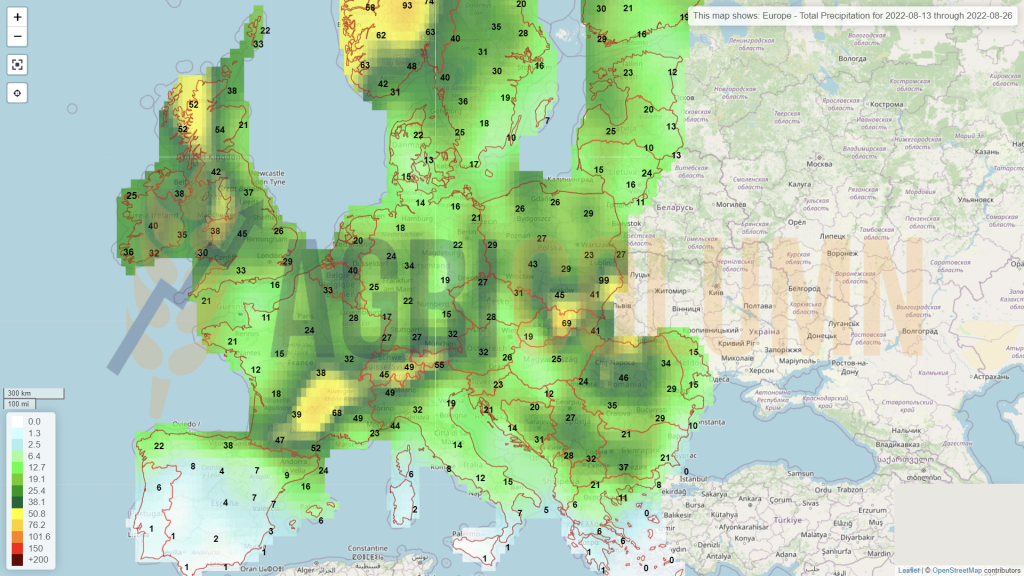
Europe
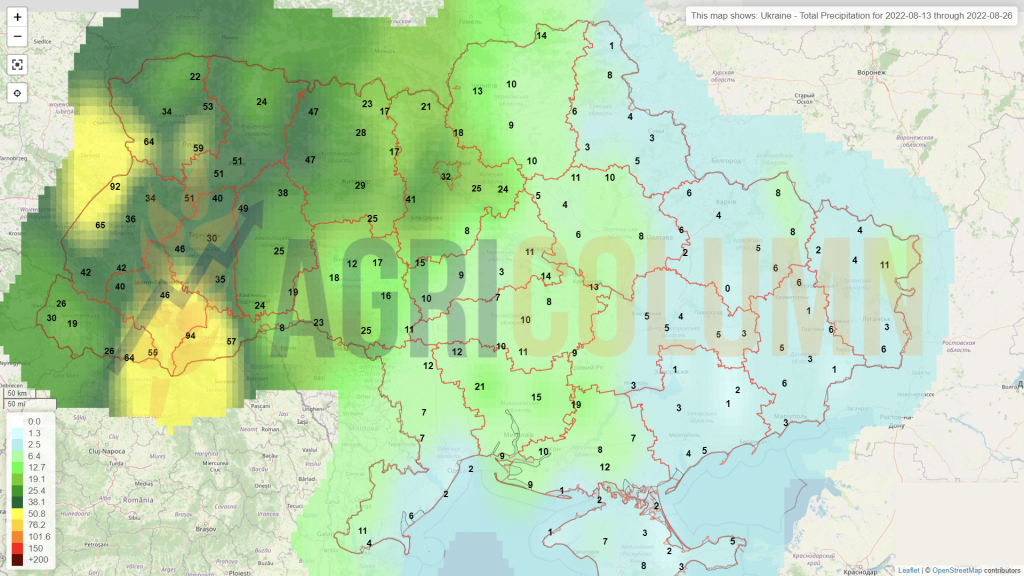
Ukraine
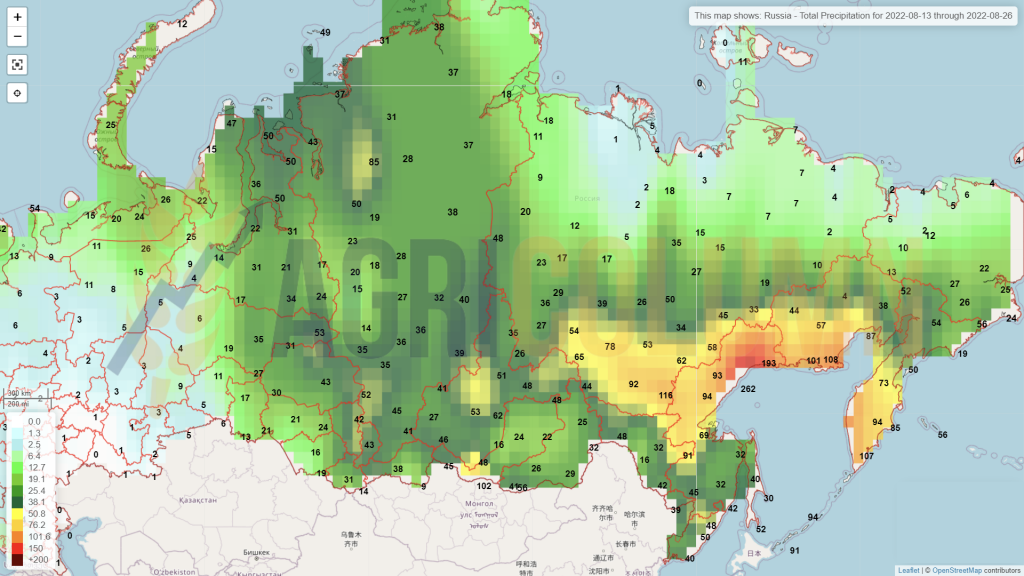
Russia
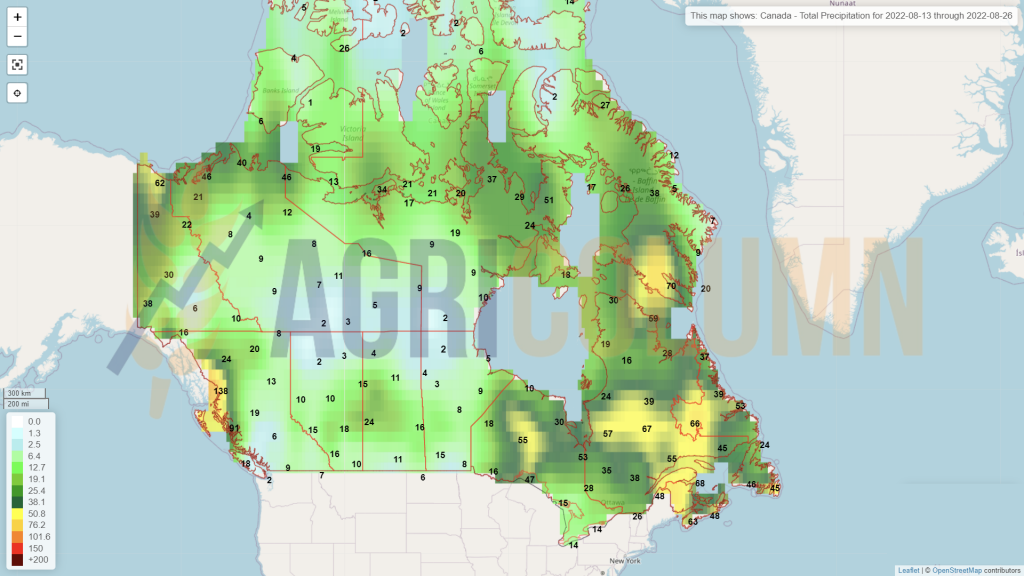
Canada
USA
Brazil
Argentina
China
Australia