This week’s market report provides information on:
The FAO Cereal Price Index averaged 147.3 points in July, down 19.1 points (11.5%) from June, but remained at 21.0 points (16.6%) above its July 2021 value.
International prices of all grains represented in the index fell. At the top of the decline, world wheat prices fell as much as 14.5 percent in July, partly in reaction to a deal between Ukraine and the Russian Federation to unblock Ukraine’s main Black Sea ports, signaling an imminent resumption of grain exports from Ukraine. Seasonal availability from ongoing Northern Hemisphere harvests also weighed on prices.
However, international wheat prices were still 24.8% above last July’s values. International coarse grain prices fell for a fourth straight month, down 11.2 percent, but remained 12.1 percent above their year-ago levels.
The deal to unblock Ukrainian ports was also largely behind a 10.7 percent drop in world corn prices. Increased seasonal availability in Argentina and Brazil, where corn harvests progressed faster than last year, also helped reduce price pressure.
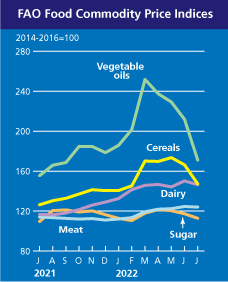
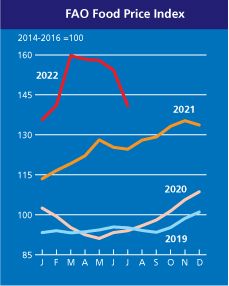
FAO Price Index on food (FFPI) averaged 140.9 points in July 2022, down 13.3 points (8.6%) from June, marking the fourth consecutive monthly decline. However, it remained 16.4 points (13.1 percent) above its value in the corresponding month last year. July’s decline was the steepest monthly decline in the index since October 2008, led by significant declines in the vegetable oil and grain indices, while those for sugar, dairy and meat also fell, but to a smaller extent.

LOCAL STATUS
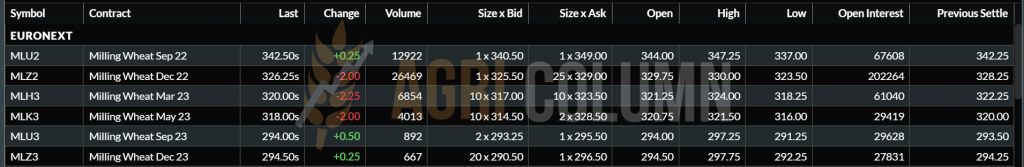
The indications of the port of Constanța remain anchored between 345-350 EUR/MT for milling quality. The present yo-yo effect on Euronext and the CBOT, an effect we predicted, is not being denied. The difference between milling and feed quality remains set at 20 EUR/MT.
The domestic market is generating competition and we are seeing offers between 345 EUR/MT and 375 EUR/MT (in some cases for wheat with special milling qualities). The formation of the price also includes 3 months of storage, that is why we see the difference compared to the indication of Port Constanța much higher in some cases.
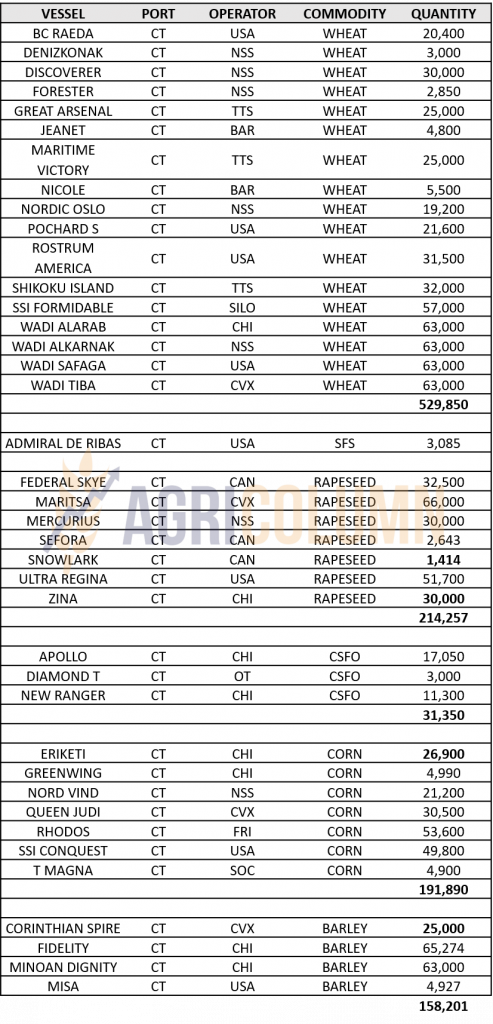
Still, farmers practice retention for wheat. The good news is that there is enough wheat harvested and stored to cover domestic consumption, but also to generate exports. Moreover, Romania’s YTD export level amounts to 475,000 tons. These figures are valid for the period 1-31 July 2022.
CAUSES AND EFFECTS
Romania is solidly anchored in the global wheat trade and any wave of change boosts it, but also impacts it accordingly. As we stated in previous reports, we will see the tempering generated by the FED and it is materializing at this time.
Also, the influence of the agreement signed by Russia with the UN, brokered by Turkey, is felt very strongly in the market. What we’re saying, in other words, is just that today, unless the WASDE August 12, 2022 produces massive changes (and we don’t think it will), we don’t see any escalation in wheat prices, at least until the September 15-30, 2022. There is no reason to see increases. Let’s not forget that today’s levels are pre-conflict Russia-Ukraine trading.
And this scenario is one that I have predicted and stated since May 15, 2022, so for about three months.
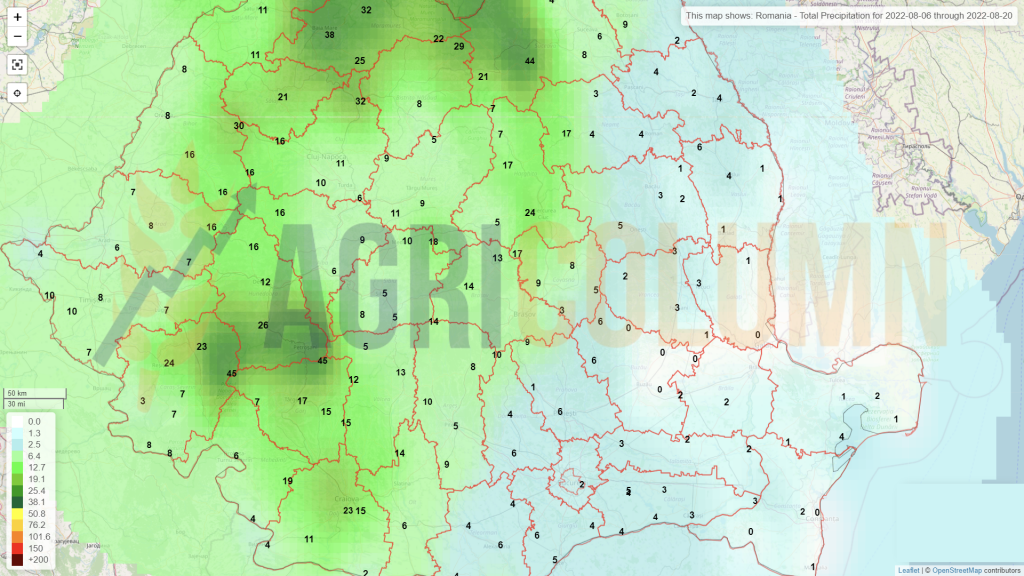
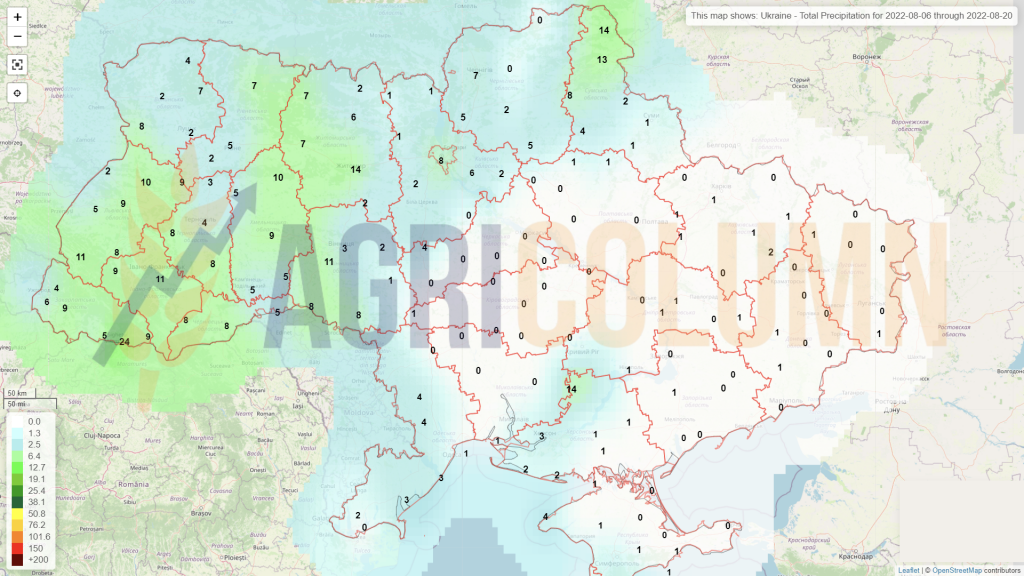
An extremely serious problem is taking shape in Romania, however, and it is about the autumn sowing campaign, which is endangered. The severe drought calls into question the ability to carry out this operation. The lack of water in the soil will generate a delay in the sowing campaign, an unnatural extension of it until around November 15-20, 2022.
And the results will not be the best. We will most likely have uneven emergence, non-emergence and underdeveloped plants in the winter of 2023. This ratio could only change if precipitation arrives, but August is forecast to be a precipitation-free month, at least until the 20th.
REGIONAL STATUS
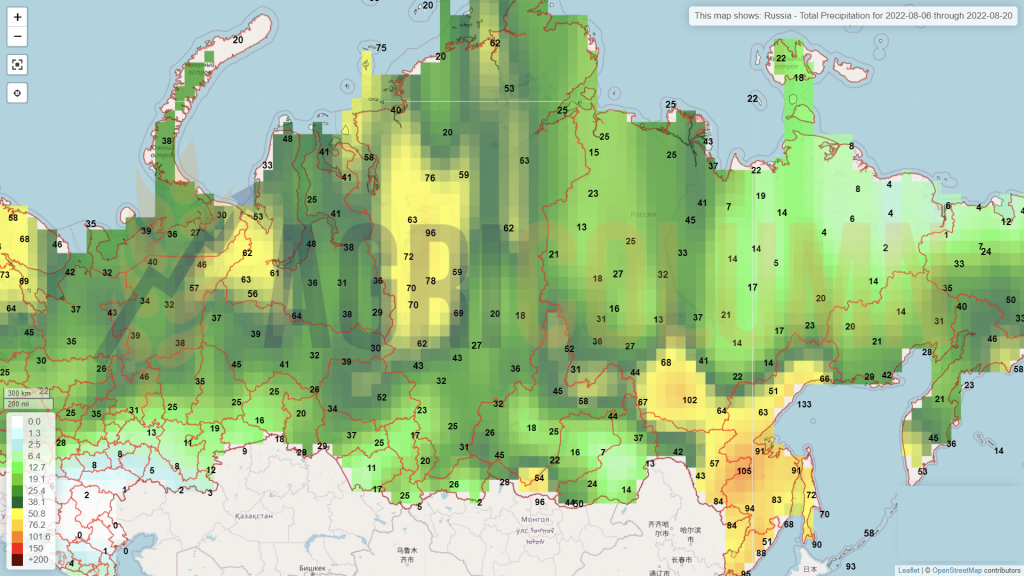
RUSSIA is exacerbating, through declarations and reports, harvest levels not seen to date. If we take the history of Russian wheat crops, we see that they have never harvested more than 85 million tons, and even these peaks were reached in the 2017-2018 seasons, as well as in 2020-2021.
And now the local analysis houses are competing in unreal numbers, over 96 million tons of wheat. We are rightly inclined to believe that these proportions are calculated with wheat from Ukraine, from the Donbas region. But from the information we have, Russian farmers will face a major problem. Just as we predicted in May, the genetics will create an asymmetry in the game and its availability will cause problems in the fall sowing campaign in Russia. Russian farmers are told that they will receive reduced amounts of wheat seed for sowing, and this will translate into a potentially reduced 2023 crop, amid a lack of primary genetic material. Data source: USDA
Besides, Russia did its job in its own right, just as it taught us, two moves before. The Istanbul agreement allowed Russian ships to sail and dock where they needed to export. Russia’s moves are much more consistent than what Ukraine has won. In previous issues I emphasized the pressure of the Russian crops and the fact that they must necessarily sell the goods, but they did not have the right to generate transport.
Today the world has lifted these sanctions, and Russia is roaming free with its ships. Moreover, banking entities in Switzerland say they will also facilitate transactions with Russian wheat.
Russia needed this agreement like air, Turkey being a reliable ally in this regard. Why? Simple, because Turkey needs Russian wheat for processing, and the proximity and price level point to Russia as the only potential.
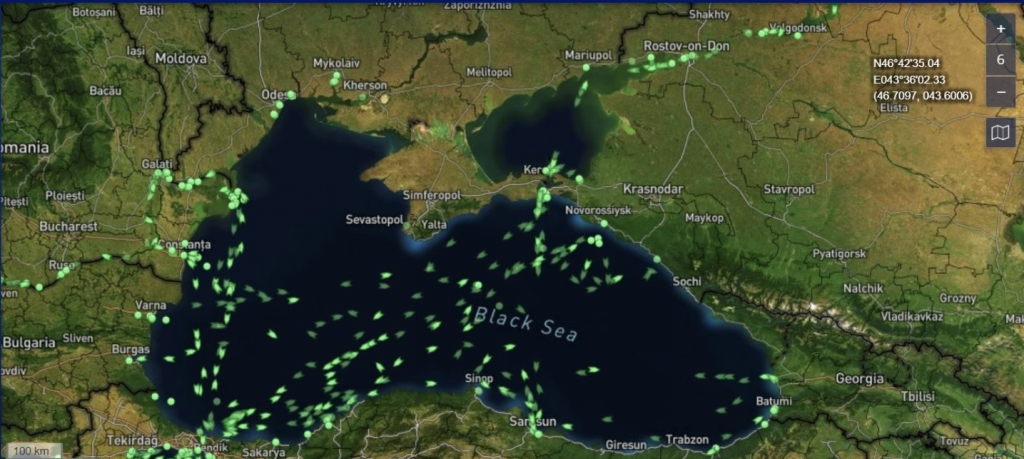
And this is how the Black Sea becomes a Russian operational theater, with a flurry of ships leaving the Sea of Azov finding their way to Turkey or passing through the Bosphorus. Here is a live representation on Marine Traffic of what the Black Sea looks like live. You can see the Russian flows actually furrowing the Black Sea, starting from the Rostov-on-Don channel, from where they carry goods to the ports of the Sea of Azov. The flow from Novorossisk is clearly visible, as well as destinations from Turkey. You can see the thickened stream looking for a way through the Bosphorus, a sign of effervescent activity.
UKRAINE is harvesting wheat and production indications are not bright at the moment. 3.6 tons per hectare is a reduced level compared to last year. Moreover, Russia has seized a large part of their wheat crop, and liquidity is a vulnerable point for Ukrainian farmers at this time. Hopes for a wheat crop close to the 18.5 million tons level are still valid and we will see the evolution of the Ukrainian harvest in the period ahead.
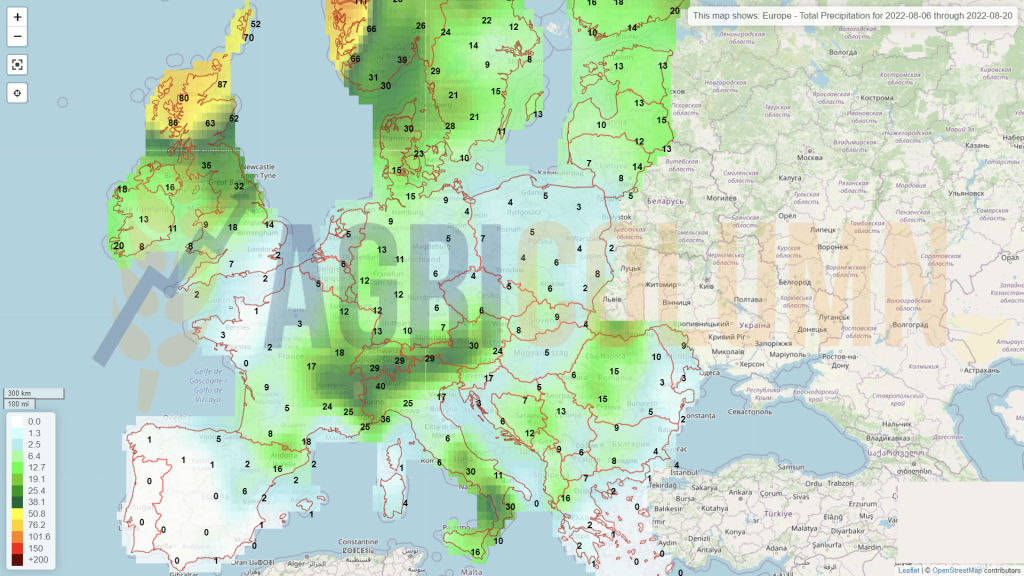
The EUROPEAN UNION maintains the same crop level, but we highlight France, which positively revises the wheat crop level by 1 million tons, up to 33.9 million tons. This fact contributes to the stagnation effect on Euronext, more means less worries about volumes.
In fact, the volume indications exported by France in July 2022 amount to 455,000 tons, the following positions being occupied by Poland with 350,000 tons, Bulgaria with 290,000 tons and the Baltic States with a cumulative 110,000 tons. In total, the level of export from the European Union for the month of July 2022 is located at 1.77 million tons.
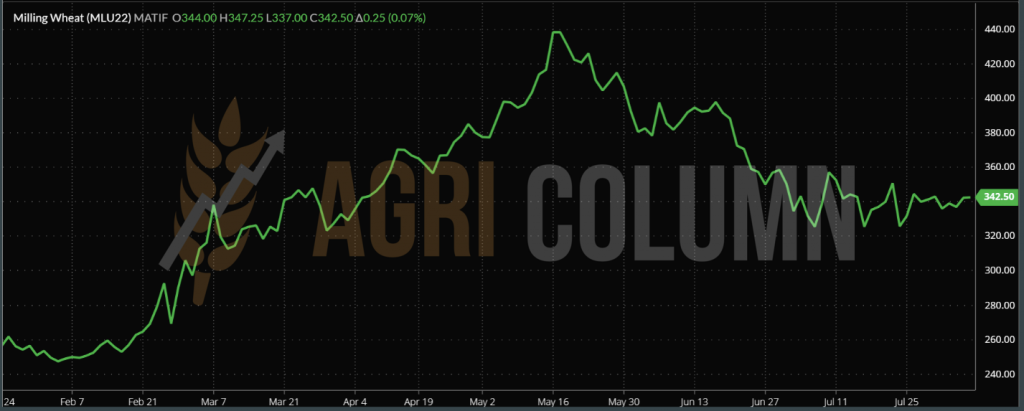
EURONEXT MLU22 SEP22 – 342. EUR 5 (+0.25 EUR)
EURONEXT WHEAT TREND CHART – MLU22 SEP22
TENDERS
ODC TUNISIA has purchased 100,000 tons from Viterra at an average price of 390 USD/MT CIF.
OAIC ALGERIA purchased over 660,000 tons of wheat. Main sellers: Dreyfus 180,000 tons, Lecureur 120,000 tons, Viterra 90,000 tons, Olam 60,000 tons, Cam Negoce 60,000 tons, Bunge 60,000 tons, Sierentz 30,000 tons. The average purchase price is 384 USD/MT CIF.
The previous tender concluded on June 21 generated a volume of 660,000 tons at a price of 445 USD/MT CFR. It is a minus of 61 USD/MT compared to the previous purchase.
MIT JORDAN purchased 60,000 tons at 404 USD/MT CFR Aqaba, with delivery January 1-15, 2023, seller Ameropa.
GLOBAL STATUS
The US is reporting its spring wheat crop in 70% good to excellent condition. It is a 60% jump from last year, when at the same time the good to excellent level was just 10%. The US winter wheat harvest level stands at 84% harvested, up from 85% a year ago. There are therefore no good reasons to change the forecast of 48 million tons, cumulative winter-spring.
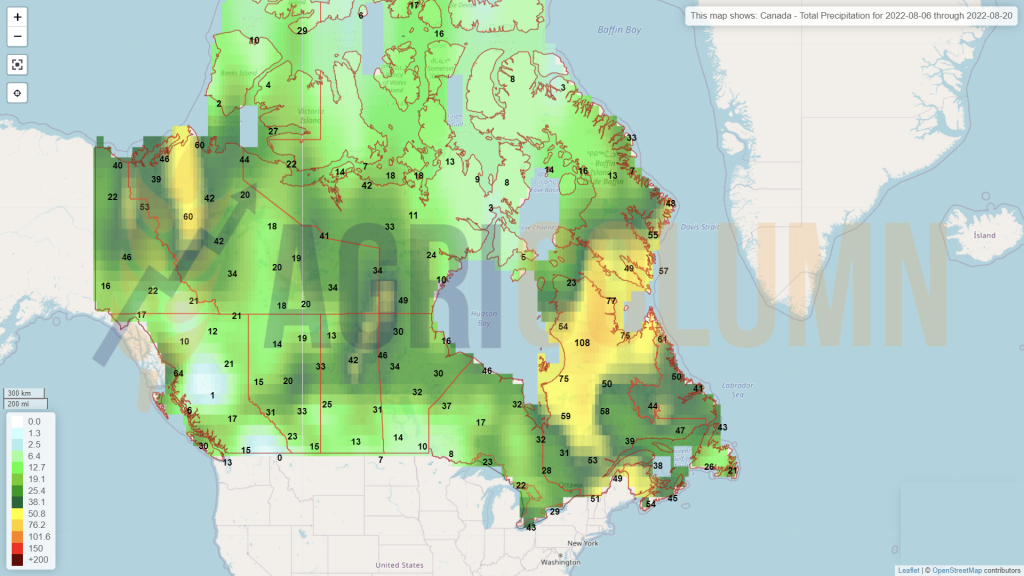
CANADA. Over the past 30 days, temperatures have been above average across the entire spring wheat area, causing occasional crop stress and a potentially unfavorable acceleration of the crop cycle. Temperatures will remain high to very high in the coming days, especially in Saskatchewan. In eastern Alberta and western Saskatchewan, vegetation indices are below average with a rapidly declining NDVI curve for several days. Precipitation does not seem particularly unfavorable; the acceleration of the cycle is therefore certainly comparable to the high temperatures of July and early August. In other words, Canada needs to be watched closely.
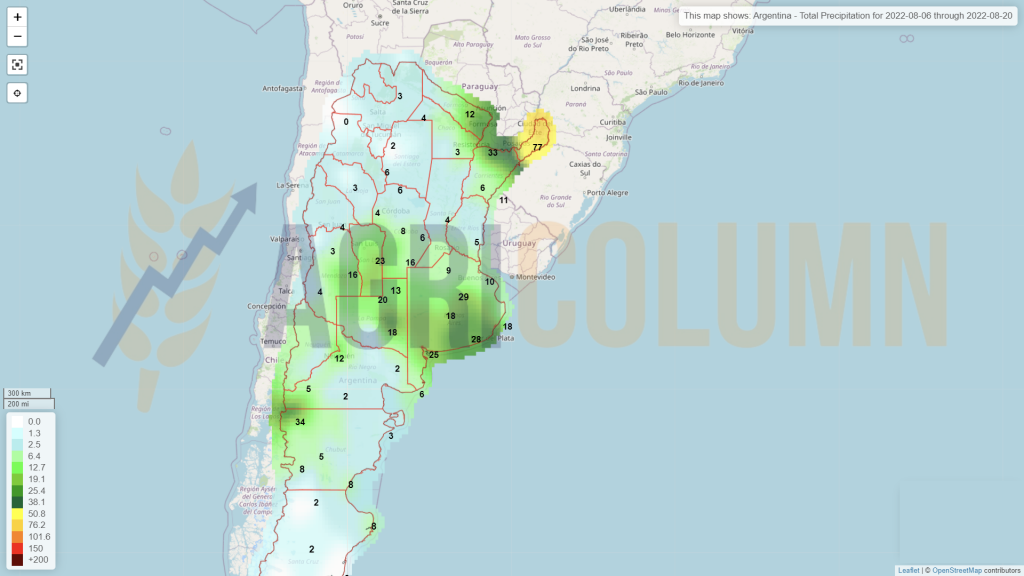
ARGENTINA. Vegetation indices in southern Cordoba province, southern Santa Fe province and northern Buenos Aires province remain generally disappointing, with an NDVI curve showing very weak, very insufficient dynamics at this stage. Rainfall accumulation remains low despite the rainfall received, and the analogy with the bad year 2020 remains worrying.
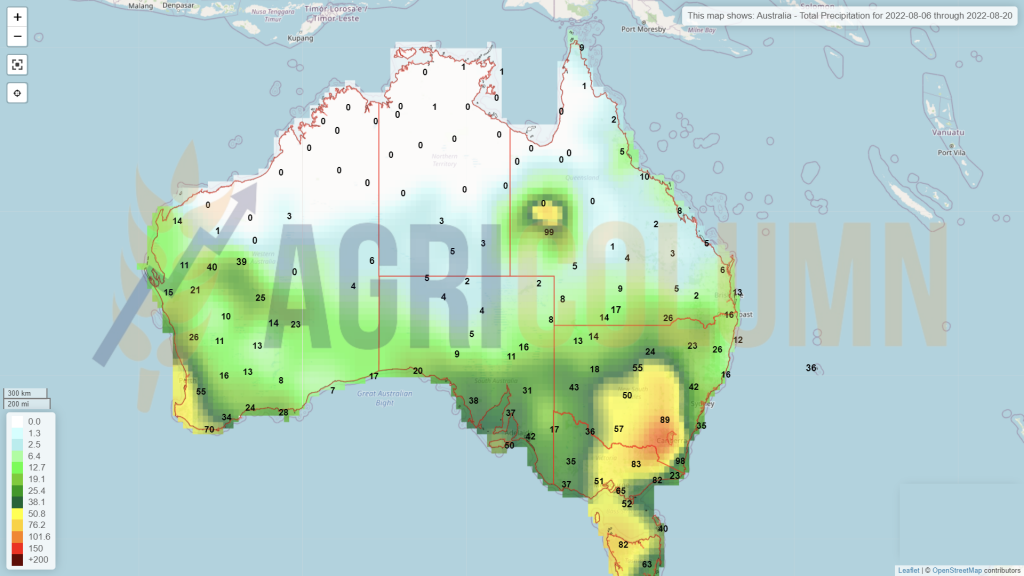
AUSTRALIA. Very late dynamics of vegetation indices in northern New South Wales continue. Vegetation indices in northern New South Wales remain well below average, but the NDVI curve is showing some momentum in recent days, allowing this stage to be slightly different from the lackluster 2017.
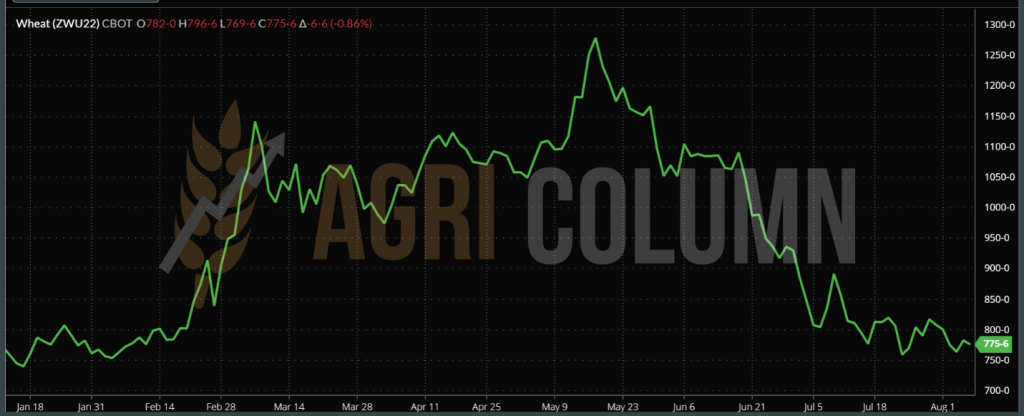
CBOT ZWU22 SEP22 – 775 c/bu (-6 c/bu = -USD2.2)
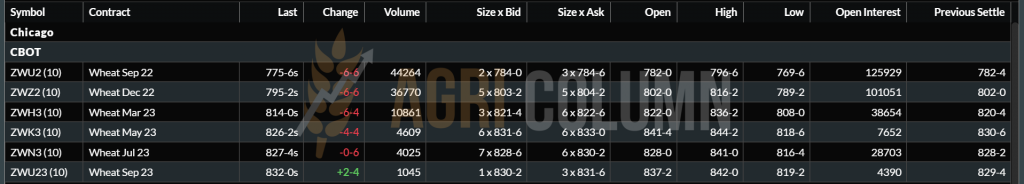
CBOT WHEAT CHART TREND – ZWU22 SEP22
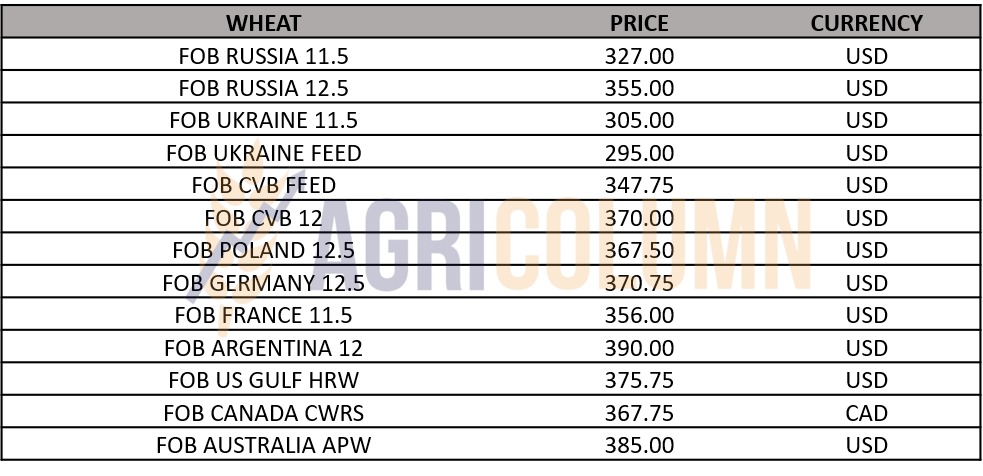
WHEAT PRICE INDICATIONS IN MAIN ORIGINS
CAUSES AND EFFECTS
As I argued in previous reports, it’s easy to talk about principles on a full stomach. And the error committed by the EU and the US in thinking that the world is all about themselves translates today into the fact that Russia has shown that it cannot be ignored, and the world needs Russian wheat.
Thus, Russia is regaining its wheat supply routes through what the Istanbul agreement generated. It will also take advantage and extract a significant amount of wheat from Ukraine, more precisely from the Southeast, while the conflict will not stop.
At the same time, Russia seems to be bothered by low wheat prices. It is a logical and normal effect, because they had to export volume and they changed the way of calculating the tax. Black Sea Wheat indicates 348 USD FOB Black Sea, which creates a price reference. Normally, you can’t sell expensive and high volumes. It is always a law of compensation that regulates supply and demand.
Also in the transactions chapter, we have information about a Russian transaction with Iran of about 100,000 tons of wheat at levels of 448 USD/MT. I did not present it in the tenders’ chapter because this transaction is governed by other socio-political factors. First of all, it takes place via the Caspian Sea, and there the logistics costs are much higher. Second, it is carried out in a barter system, that is, Iran will supply Renault auto parts and components in a barter system. So there we have other performance parameters, which are not related to the classical supply and demand market, but to the compensation of the needs of both countries.
What we are seeing unfolding in the market today is a relaxation and easing of wheat prices globally. This is not at all an unexpected fact. Only those who did not want to see it did not see it coming. The price gouging had to start coming to an end. The artificial growth generated by investment funds had to stop.
Things are extremely simple. The threshold of pain, as I called it, was reached a long time ago. In other words, hunger also has a tolerability level that makes consumption fall, against the backdrop of high prices. The rhetoric and the narrative that we see unfolding daily regarding the poor African peoples who have nothing to eat should not be taken literally.
Food exists, but it is extremely expensive. African dictatorships that keep their own peoples underdeveloped and do not allow economic and cultural development are the main culprits of the standard of living, where the daily income of these peoples cannot keep up with global price increases. When you have daily 1-2 USD, it makes sense not to afford 400 USD/MT wheat.
And hence the narrative that African peoples are leaving in uncontrolled migration. We are not talking about eradicating poverty here, but about the fact that they can no longer afford bread. Wheat exists globally, and in one way or another, production, trade, consumption and stocks balance.
But the profit-making scheme by hedge funds, mostly connected to the big global players in the trade, caused prices to literally explode. Now we return to the origins, because the market is weak and can no longer support this price artificiality in any way.

LOCAL STATUS
Barley price indications in CPT parity fluctuate between 290-295 EUR/MT. It all depends on the current interests of the buyer.
In the local market, as in the case of wheat, we see on the horizon the problems evoked in wheat, namely the extension of the sowing window due to the lack of precipitation.
REGIONAL STATUS
Here we record two auctions completed in the past week. MIT JORDAN purchased 60,000 tons of barley at the price of 336 USD/MT CFR Aqaba, with delivery in the first half of January 2023, seller Viterra.
ODC TUNISIA purchased 50,000 tons of barley at 349 USD/MT, seller also Viterra.
PRICE INDICATIONS FOB RUSSIA AND AUSTRALIA


LOCAL STATUS
The indications of the port of Constanța are still set at the level of 297-300 EUR/MT for new crop corn from Romania.
Which corn, we might say with maximum disappointment? Our corn crop is effectively collapsed, disarmed and on its knees before the almighty drought. No one and nothing can help it anymore. Like a sea of kneeling soldiers, the stalks of the Romanian corn are bent towards the ground, as if begging for a sip of life-giving water, while the spines are burned by the merciless sun. The silence dries up on the plains, undisturbed except by the scorching heat waves, which distort the image of the horizon, the silent witness of the drama of the Romanian corn crop, which cannot be saved.
CAUSES AND EFFECTS
We are at a critical point, at a crossroads, to act to save Romanian agriculture or to accept its slow but certain end. We arrived here fueled by the ephemeral illusion that maybe next year will be better. Every year, we thought it would get better, every year we consoled ourselves that it would get better. The mentality of us, of everyone, of the population, of the farmers, of the governors, of “let it be better next year”, has brought us to this point of no return. Why? Why this mentality of the Romanian people, based on tolerance and self-assurance?
It’s simple, fate has gifted us with a fertile area, where the earth has been kind to us. Without superhuman effort, we generated food. Without very big investments, we were rewarded by nature. It seems that our way of being springs from these gifts of nature. We have self- \soothing deeply imprinted in our DNA because we were gifted with this good earth.
Other peoples were not so lucky and the need pushed them towards unity and finding solutions. Need snapped him out of his composure, survival was stronger than any instinct.
I give you only two examples. The Israeli people have learned to turn the desert into a fertile plain, with an emphasis on the lack of energy and water waste.
Switzerland was nothing more than a people raising goats on rocks. But they learned that they had to do something else to develop. And they created cheeses as well as the art of fine mechanics through the manufacture of Swiss watches. They developed the banking industry through principles of neutrality and banking secrecy.
Dear readers, I think we have reached the crossroads moment where we no longer need to complain about mercy, but to ask ourselves what to do and how to do it. The government indicates the approval of very important sums of money for IRRIGATION, which we have supported for about 2 years. Water is the vital element that generates life. It’s that simple.
We just need this money to be spent effectively, with groups of specialists and technicians from countries that have developed energy-efficient systems with low water consumption. Farmers’ associations must rally around this national survival project. The government and the responsible factors should constantly consult with the farmer associations to generate the best options and solutions. This is not a unilateral project, but a national one, in which the farmers, the factors governing the country, technicians, consultants, as well as audit firms should be engaged to generate the best results, even in 4-5 years. But let’s leave for once on this road, a road of the effective survival of Romanian agribusiness and of Romania implicitly.
REGIONAL STATUS
In RUSSIA, initially very low vegetation indices in the maize zone show recent improvement, especially in the southern district and the Caucasus district. We maintain the forecast of 14.5 million tons as the volume level of the Russian crop.
UKRAINE. The comparison of the vegetation indices between 23 July and 3 August shows that the high values are still present in the corn zone of Ukraine, even if a slight deterioration is observed in the western part. We maintain Ukraine’s crop volume of 25.5 million tons of corn, to which we add at least 6 million tons of the crop left unexported due to the Russian invasion.
FRANCE. In most corn production areas in Europe, vegetation indices are below average. In the south-west of France, for example, there has been a significant decrease in the NDVI in recent days, which can certainly be related to the catastrophic values of the precipitation- evapotranspiration balance. Here we remain anchored in a maximum of 10.5 million tons for now. Indications of 12.7 million tons are not to be taken into account. They are simple numbers that want to hide the scale of the disaster generated by the drought. And it should not come below 10.5 million tons, because we see the level of the European crop at only 55 million tons, compared to the initial estimate of 68.5 million tons. It’s just the beginning, but as we’ll see, everything rests on two pillars.
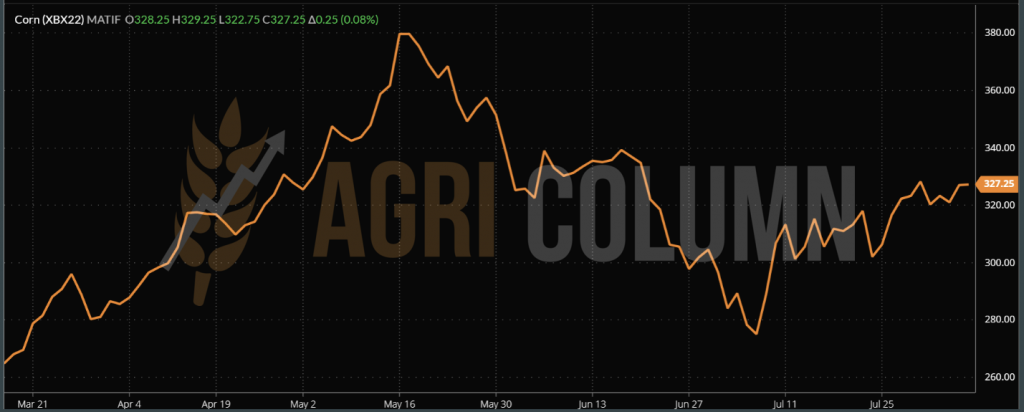
EURONEXT CORN – XBX22 NOV22 – 327.25 EUR
EURONEXT CORN CHART TREND – XBX22 NOV22
GLOBAL STATUS
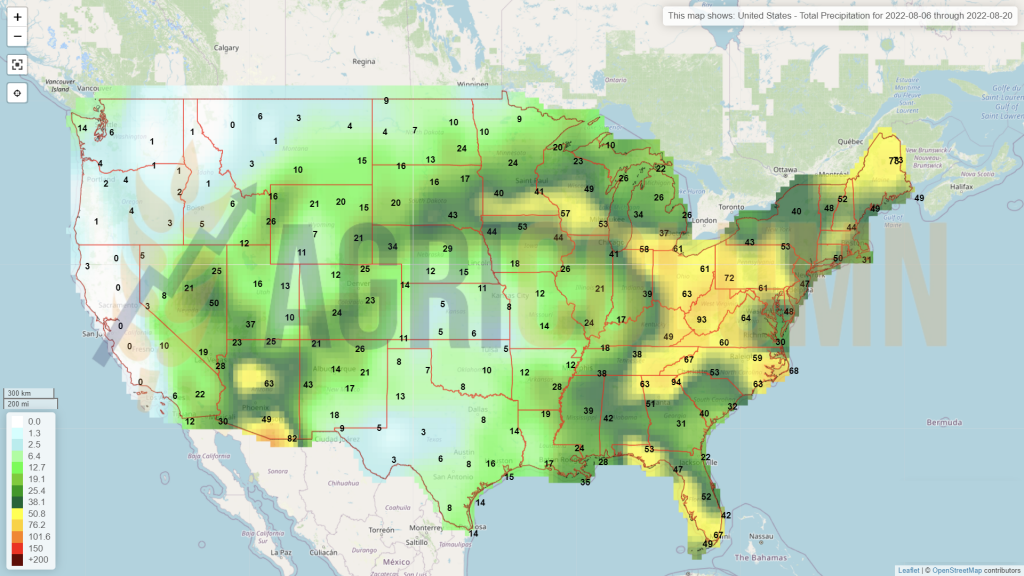
USA. Rainfall over the next few days is forecast to be below average across most of the Corn Belt, so hydrological stress is expected to continue, with soil moisture levels still low. In addition, a heatwave trend is forecast in the coming days, which may be unfavorable for crops in various stages of vegetation.
Despite the difficult weather conditions, vegetation indices remain near or above average in most of the Corn Belt, with high NDVI values in the central part of the territory. However, the water balance is very worrying. How long can crops last?
While most of the Corn Belt is holding up well, there are a few areas with below-average values, including Nebraska, Indiana and Iowa. In southern Iowa, vegetation indices have declined since mid-July, likely due to the heat and lack of precipitation in the area. At this stage, this situation is in the minority in the state, but this could change quickly.
The good-to-excellent grade for the US corn crop is at 61%, down from last year. The forecast remains, at least until WASDE in August, at the level of 373 million tons.
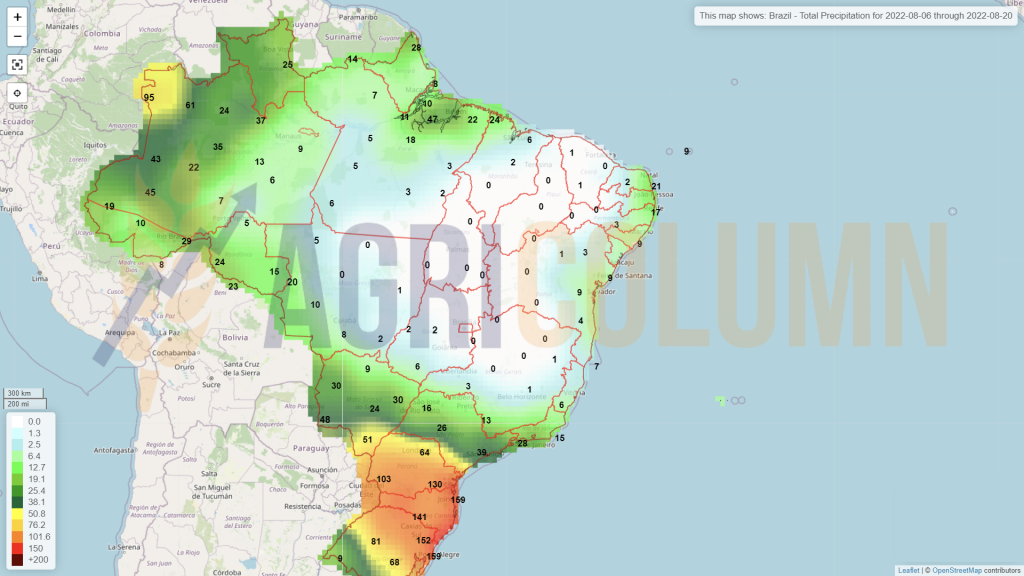
BRAZIL and ARGENTINA are outside harvest windows (maybe 5% left in Brazil). What is noteworthy here is the Brazilian corn export advance, which is notable at the expense of the North American one.
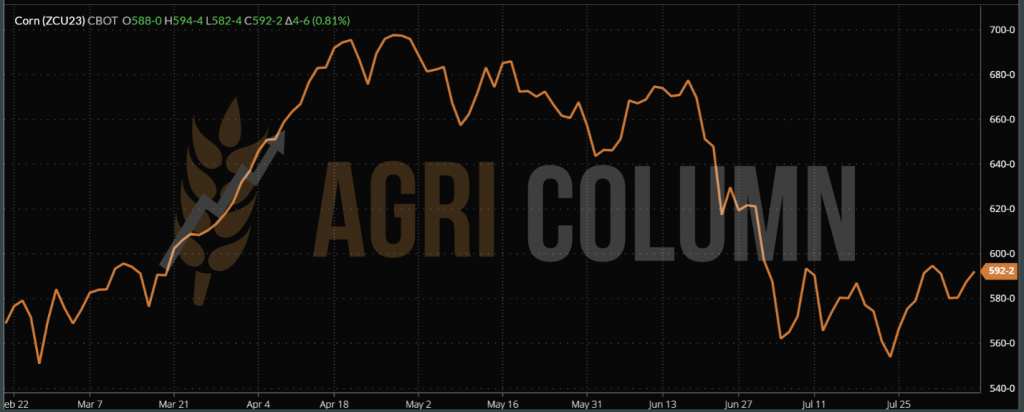
CBOT ZCZ22 DEC22 – 610 c/bu (+3 c/bu = +1.18 USD)
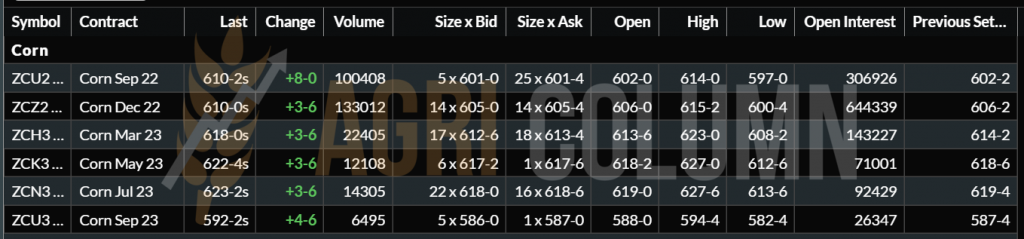
CBOT CORN TREND CHART – ZCZ22 DEC22
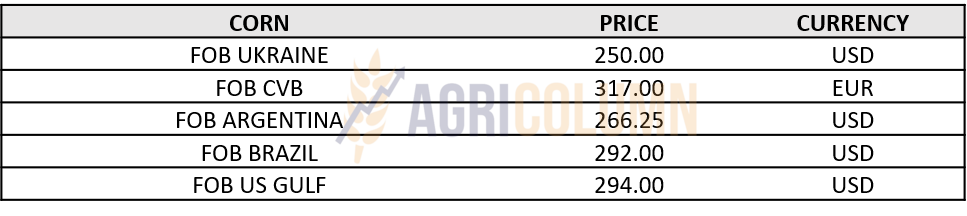
CORN INDICATIONS IN MAIN ORIGINS
CAUSES AND EFFECTS
We have a Europe destroyed by drought, with a potential reduced by at least 13 million tons, in the condition that Europe imported 15-17 million tons of corn every year. These conditions will require a doubling of import figures. How will this happen?
We have two pillars of support: the one in Ukraine, which will generate enough raw material, and the North American one, which will also generate support in the Iberian Peninsula.
Ukraine is slightly opening the doors to sea trade and we see how 4 ships left Odessa. All with corn, an area where Russia does not excel. And the game seems to be split between Turkey and the EU, as out of the convoy of 3 ships, 2 went to UK and Ireland and one to Turkey. So the EU is clearly a beneficiary of Ukrainian goods. Russia wins fertilizer trade. It’s another inspired move by Russia. Fertilizers are necessary and vital for the European Union.
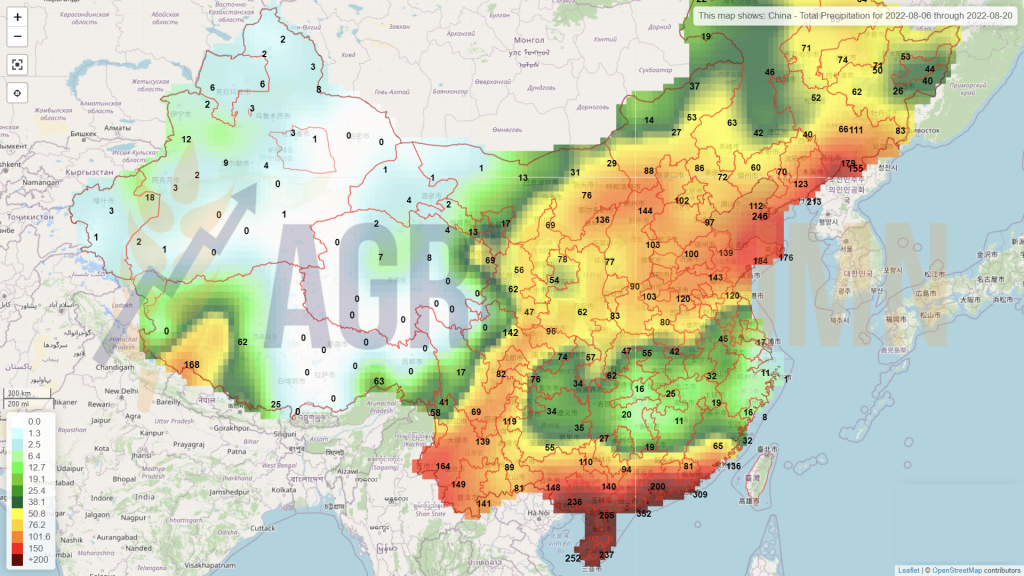
That’s why the price of corn is still not rising to the extent of the European drought. It has two pillars of support, Ukraine to the east and the American continent to the west. That’s why we don’t see price exacerbation in the context, for now. Until China comes shopping. Then things will change.
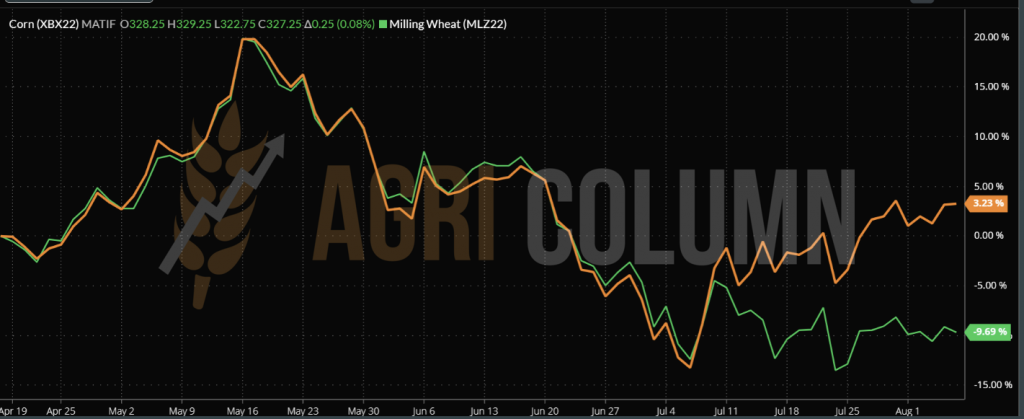
And we have another extremely important landmark. On August 15, the SEP22 indication on European and US wheat expires, so we will report on DEC22 on Euronext and CBOT. If today we have a spread of 15 EUR between wheat and maize on EURONEXT, when the benchmark changes in DEC22 we will have, looking at this moment, an advance of 1 EUR of maize against wheat!!!
CHART XBX22 DEC22 CORN (orange) vs. MLZ22 DEC22 WHEAT (green)

LOCAL STATUS
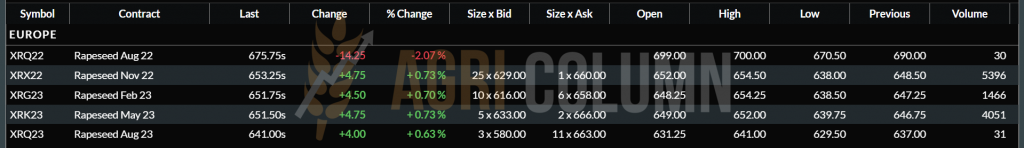
The indications of the port of Constanța follow the same trajectory as last week. We have price variations between XRX22 NOV22 minus 10 and XRX22 plus 10 EUR/MT. The difference is the buyer’s supply need.
In the country, processors post the same level as before, NOV22 minus 20-30 EUR/MT. The retention, however, exists at the level of farmers.
CAUSES AND EFFECTS
Lots are not released. The hope of past times that want to be rematerialized is the main engine. And we say it clearly, the levels of 850-900 EUR/MT will not return. The global balance sheet is balanced and there is no cause for concern at this stage. The month of November is another milestone, but there is still time until then. There are effectively 3 months left, in which many collateral things can adjust the price level of European rapeseed positively or negatively.
And the premises of 2023 are not shaping up well at all. Drought will prevent, delay the autumn seeding of rapeseed. And we will certainly have problems. Rapeseed can rot in the ground, if it does not germinate due to lack of water, how can it resist germination at the first rainfall. It is an insecurity that we will face and we will not know how it will be resolved.
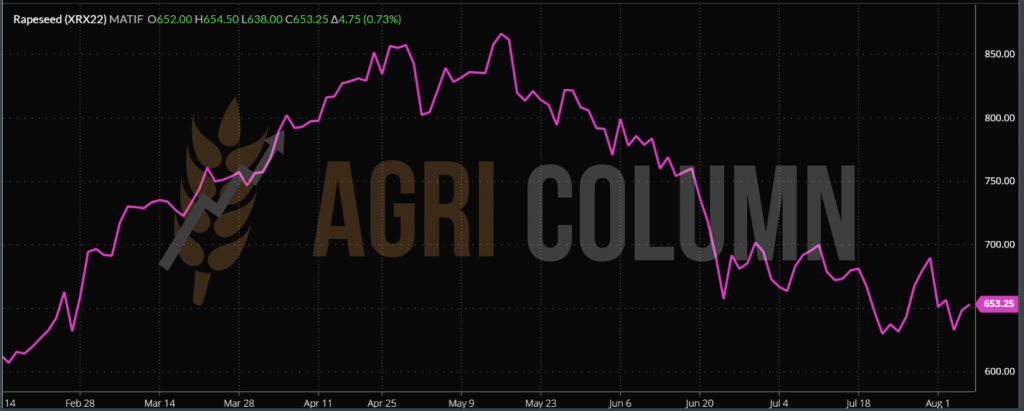
EURONEXT XRX22 NOV22 – 653.25 EUR
RAPESEED TREND CHART– XRX22 NOV22
CAUSES AND EFFECTS
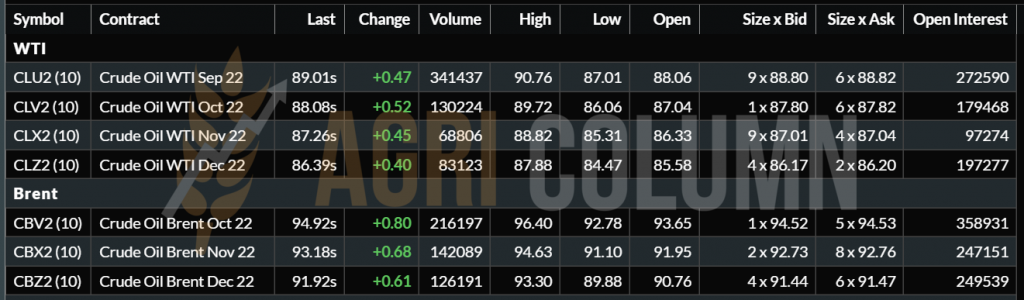
- Oil is no longer the ally of rapeseed these days, with the drop to 95 USD/barrel contributing to rapeseed’s low level.
- Soybeans provided support to the canola after damage, their levels rising and helping the canola in the complex.
- Palm oil is another factor that led to the drop in the price of rapeseed. The VEGOIL complex acted correctively to the decrease in the price of palm oil. Indonesia simply removes export taxes to be able to sell.
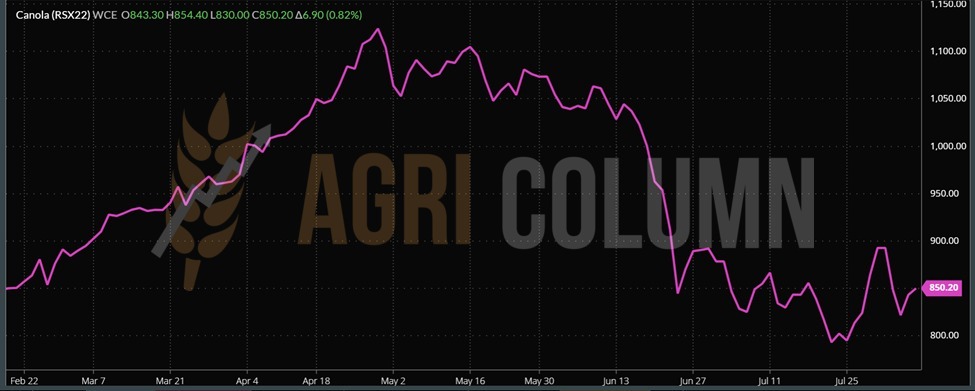
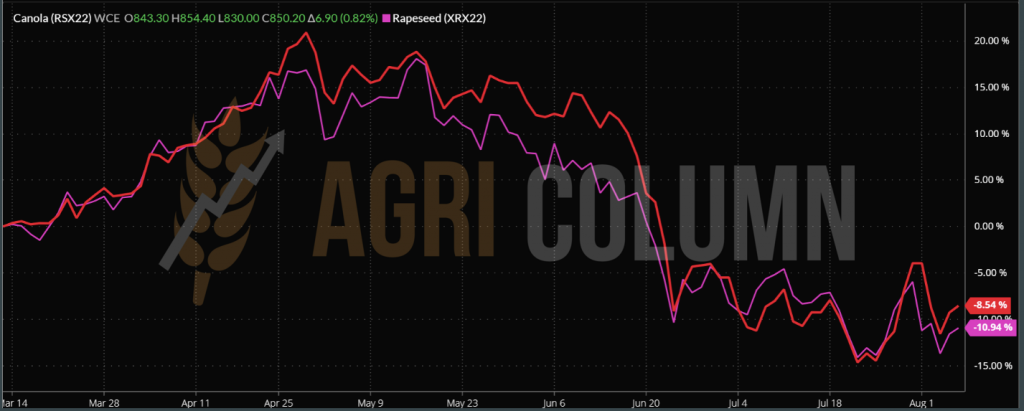
ICE CANOLA RSX22 NOV22 – 850 CAD (+6.9 CAD)
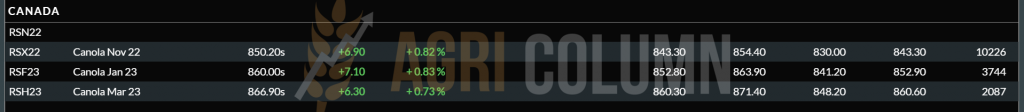
ICE CANOLA RSX22 TREND
COMPARATIVE ICE CANOLA vs. EUROPEAN RAPESEED (head to head)

LOCAL STATUS
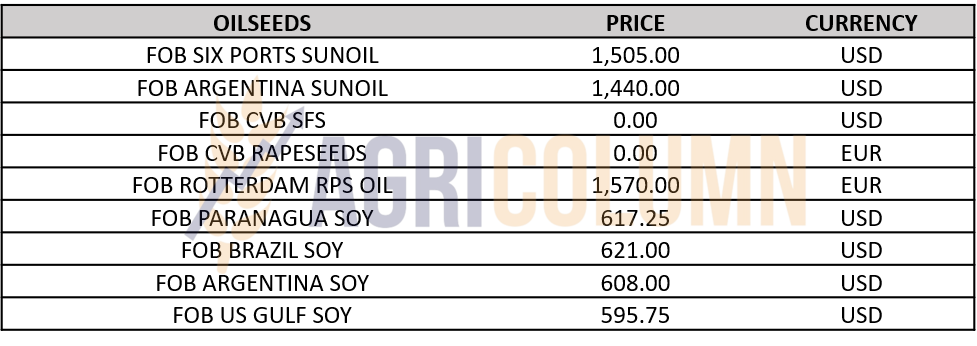
The port of Constanța and local processors are starting to quote the sunflower seed crop much higher. We see indications of 560-570 USD/MT in the same directions, DAP Procesator and CPT Constanța.
The size of the sunflower crop can already be seen with the naked eye, and buyers more or less understand the reduction in the size of the volume to which the Romanian harvest was subjected. Some areas in the country started harvesting from the first days of August, and first cuts indicate moisture between 6 and 8%, with a percentage of foreign bodies of 2 and 4.4%.
Competition is starting to heat up and we are seeing buyers from Bulgaria with much stronger indications than local ones. For example, the processor in Popovo indicates 600 USD/MT in DAP parity. It’s very simple, Bulgarian processing needs 1 million tons over local production, and Bulgaria’s local production of 900,000 ha is not brilliant, for sure.
We also see how the Hungarian units of Martfu and Fokto are extremely competitive, especially for seeds with high Oleic Acid content. Martfu pays a bonus of 100-130 USD/MT, a sign that the HoReCa industry has recovered from the pandemic and is demanding this oil, although in Europe Nestle has changed its recipes from using sunflower oil to using hydrogen palm oil.
REGIONAL STATUS
RUSSIA is still indicating a level of 14-14.5 million tons of sunflower seed production, and they will certainly meet it. But the sunflower oil export tax remains a penalizing factor for Russian crude oil exports.
UKRAINE decelerates in the sale of raw materials. The hope of deliveries through Chornomorsk makes processing raise its level and transfer part of the flows that were going out by car to internal processing. 9-9.5 million tons remains the Ukrainian crop forecast, with a remainder of 3-4 million tons unprocessed from last season.
The EUROPEAN UNION is also degrading and the figures are not yet edited. But how can it be otherwise, given the severe drought this summer? We are also waiting to see how the European numbers degrade. France, Spain, Germany, Hungary, all countries suffer from drought and the harvest volume remains at 10.2 million tons?
CSFO AND OILSEEDS INDICATIONS IN MAIN ORIGINS
CAUSES AND EFFECTS
The price of sunflower seeds will increase according to the harvest. It is a fact that will be fulfilled. Volumes will drop and buyers will realize the reduced size. Our estimates place 640-650 USD/MT as the price level in the period to September 10, 2022.
Ukraine will carry out retention on the raw material, the aim being to bring added value, not to export raw material.
In Romania, we estimate a maximum of September 5 for the sunflower harvest to be gathered from the fields, although with this drought, we may not reach the end of August 2022.

LOCAL STATUS
We do not register significant changes at the local level regarding the Romanian soybean crop. The crop follows its vegetation stage, and the irrigated areas are the most profitable in front of those that do not benefit from irrigation. The latter have no chance of reaching maturity.
GLOBAL STATUS
The U.S. is almost in line with last year in soybean sales, with an 8 percent difference. As for the new American crop, 80% have flowered and 60% are in good to excellent condition, in line with last season at the same time.
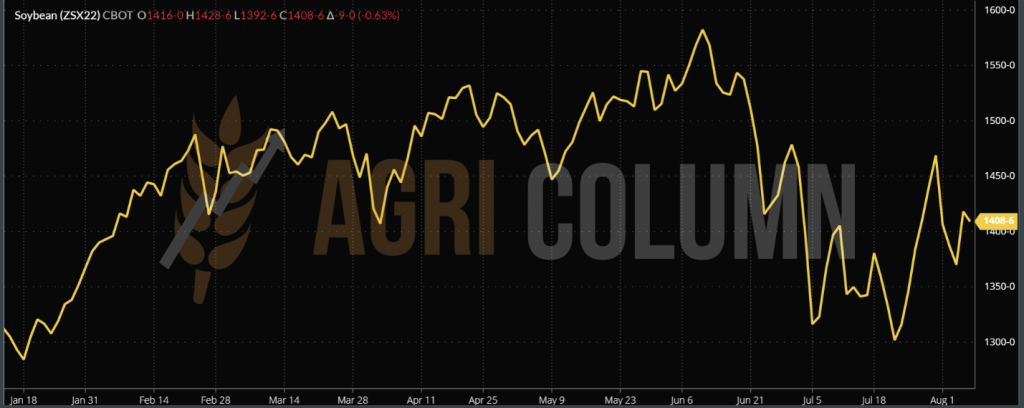
Plains in the US Midwest created concern, which led to increases in the soybean indication on the CBOT, after prices initially fell below 1,400 c/bu, NOV22.
BRAZIL and ARGENTINA are out of season. But Brazil has extremely good soybean sales. Argentina, as we well know, processes and sells scrap for export.
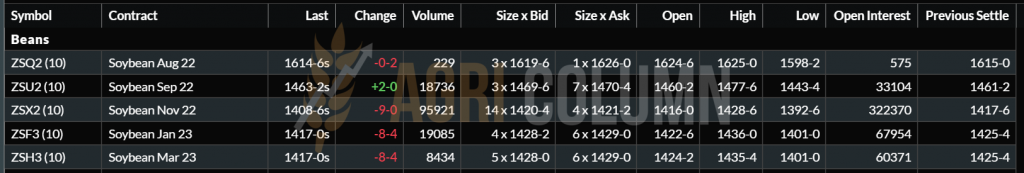
CBOT ZSX22 NOV22 – 1,408 c/bu (-9 c/bu = -3.3 USD)
SOYBEAN TREND CHART – ZSX22 NOV22


6-20 August 2022
Romania
Europe
Ukraine
Russia
Canada
USA
Brazil
Argentina
China
Australia