This week’s market report provides information on:

LOCAL STATUS
Indications of the Port of Constanța lost traction even further in the previous week, being around the value of 230 EUR/MT in CPT parity. A boost from Russia’s attempt to boost the market could bring it back up around 7-9 EUR/MT in the opening of the week starting today.
New crop has an inverse of 5 EUR/MT and by default is quoted at 225 EUR/MT. As with the new crop, we see an upgrade of 7-9 EUR/MT at the start of the week.
CAUSES AND EFFECTS
Romania does not generate strong enough exports and we have an aggregated volume of 2.77 million tons up to the 38th week of the season. The slowdown in wheat exports will generate the surplus with which we will move into the new crop.
With a summary calculation, we can generate the following formula: out of 9 million tons of wheat produced locally, 2.77 million took the export route, about 0.4 million tons went west to the European Union, which leads us to a volume of 3.2 million tons export and intra-community trade.
Local consumption should cover a level of 3.5 million tons, which would generate a total of 6.7 million tons. Under these conditions, a surplus of 2.3 million tons would remain. But this surplus is not real. Because, in local consumption, about 0.84 million tons came from Ukraine, so the correct figure at the moment is 3.15 million tons calculated as a plus in Romania. Practically, in local consumption, 0.84 million tons took the place of Romanian goods.
The direct beneficiaries of these volumes are processing units and local traders, as exporters transit and then export the Ukrainian flows. It is possible, however, that smaller volumes are traded on the domestic market also by exporters, but their share is not as high as that of local processors and traders.
REGIONAL STATUS
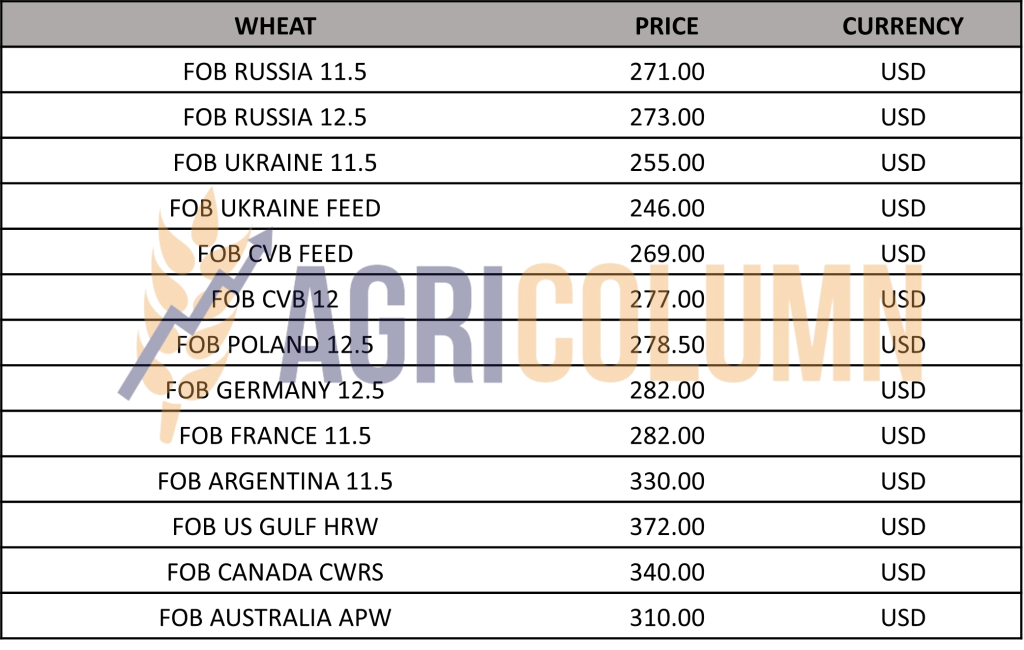
RUSSIA. Russian wheat is losing speed and suffering from competition. Russia is trying by well-known means to influence the market. If it didn’t work with the negotiations on the Corridor, now they are straining again by saying that they will curtail exports, because of the reduced price. In Russian FOB quotations, the price instantly rose by 7 USD/MT. It remains to be seen how competitive they will be in the run-up to the next tender in Turkey on March 28, as well as in Jordan at the same time.
Russian wheat indicates a good state of vegetation at the exit of winter, serious problems are not observed.
UKRAINE continues the spring sowing campaign. Their wheat is still competitive, but in the previous week, it had no arena of expression, that is, tenders for large quantities, only volumes allocated to spot sales to destinations such as Turkey, Italy and overland to other states in the European Union.
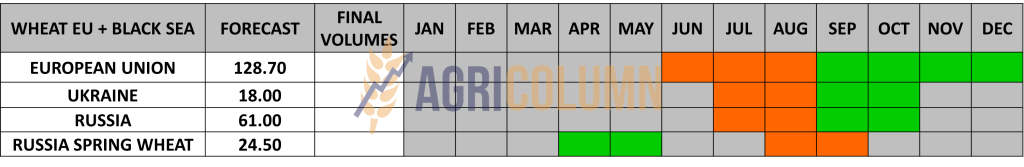
The EUROPEAN UNION indicates a very good vegetative state for wheat, especially in France, where conditions are optimal. In terms of volume forecasts, they remain at the same level of 128.7 million tons of milling wheat.
In terms of exports, the Union continues at a good pace, capitalizing on a level of 22.15 million tons of exported milling wheat and an import of 6.54 million tons. Cumulating durum wheat as well as flour calculated in tons of wheat, the Union is positioned with a total of 23.25 million tons, having an increase of 1.5 million tons in export volume compared to the same period last year.

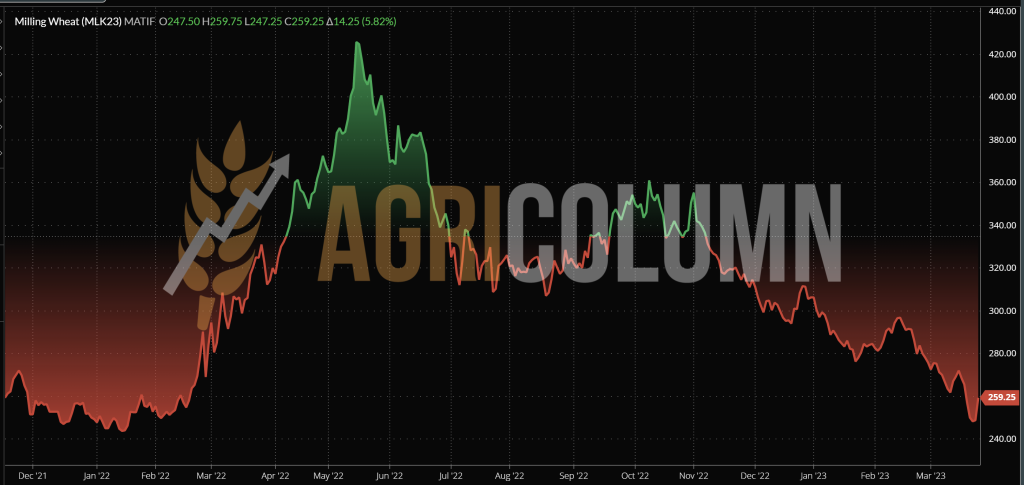
EURONEXT – MLK2323 MAY23 – 259.25 EUR (-6 EUR vs. previous week)
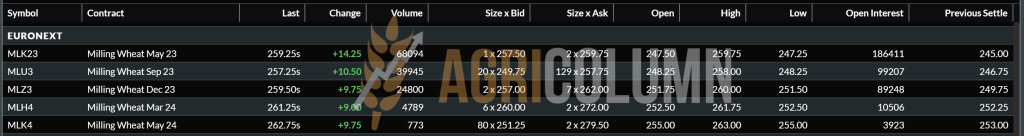
EURONEXT WHEAT TREND CHART – MLK2323 MAY23
GLOBAL STATUS
USA. American wheat falls into many categories at this time. Areas are either in high or moderate drought, or under snow that is no longer melting due to low temperatures. So we are in the same mixed state, but soon, the positive temperatures will generate the necessary level of water through the melt, and American farmers will be able to plant spring wheat.
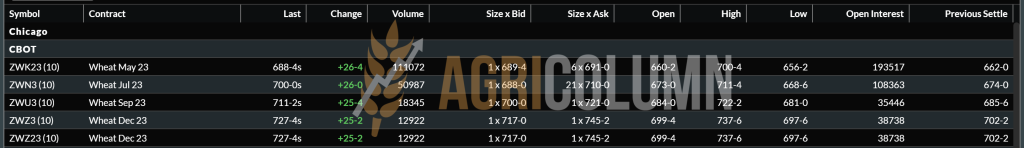
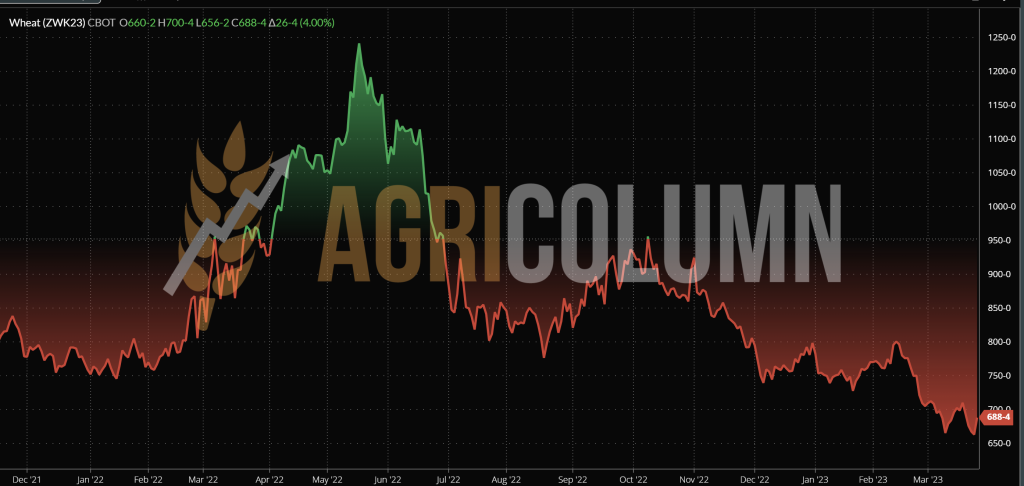
CBOT WHEAT – ZWK23 MAY23 – 688 c/bu (-22 c/bu = -8 USD vs last week)
CBOT WHEAT TREND CHART – ZWK23 MAY23
WHEAT PRICE INDICATIONS IN MAIN ORIGINS
CAUSES AND EFFECTS
Russia practices the same Maskirovka. Their eyes are set on the price, as are those of the other sellers in Origins. And seeing that the price is falling day by day, they thought to influence the trading algorithms. Blackmail on the Corridor did not work, so the relevant Ministry of Russia thought of something else – to launch a news in the media that Russia plans to reduce the level of wheat exports and strengthen its own reserve to the level of 10 million tons.
Trading algorithms reacted as reputable sources shared the news and boosted the CBOT, with the reflection being visible on Euronext as well. Funds found this news a very interesting reason to re-enter positions after the previous week’s massive liquidations and take profits on this commodity. So we saw spectacular increases of 25-30 c/bu (8-11 USD/MT) on CBOT and 8-10 EUR on Euronext.
Later, the Russians came back and emphasized that they are not actually stopping exports, but they want to value wheat in FOB parity at a level between 275 and 280 USD/MT. What we all need to understand is that this game suits many, not only the Russian Federation. All the sellers are the beneficiaries of this attempted manipulation, all the stock market players (the hedge funds), all the farmers in the Origin countries, absolutely the entire spectrum is the beneficiary and tacitly enjoying the short-lived fruits of the Russian manipulation actions.
On this path, as a neutral organism, I wish them much success. The market is composed of Sellers and Buyers, and very close to us is a tender in Turkey of about 700,000 tons of wheat, more precisely on March 28, 2023, which will be seconded by the one in Jordan. The market being free, the final decision will be the Buyer’s to choose the Origin, i.e. the most competitive product in terms of price and quality.
The world closes its eyes knowingly and has a very well developed sense of forgetfulness. Why do we say this? Because, if we take the numbers and judge them as a whole, we see that, in fact, the ratio between 7 days, that is, the previous ratio and the one today, indicates a decrease in wheat and not an increase:
- The CBOT, on March 25, 2023, indicated an 8 USD lower level than the previous week.
- EURONEXT, on March 25, 2023, indicated a lower level of 6 EUR compared to last week.
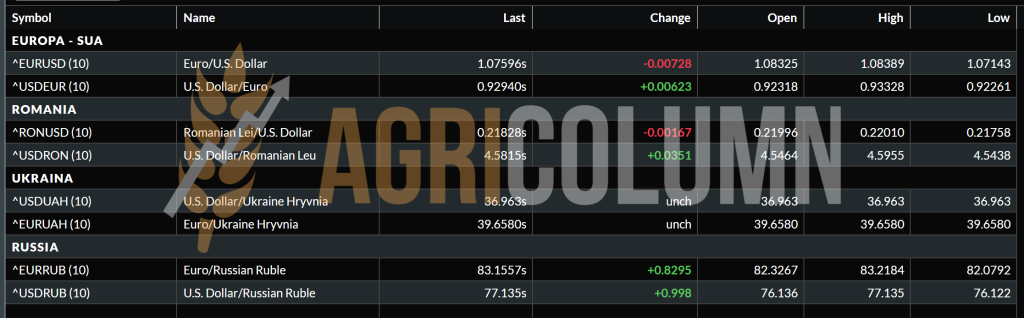
Here we have to look and judge. We had a red week, so to speak, with liquidations of positions almost every day, with a FED that increased the interest rate by 0.25%, with an ECB that increased the interest rate by 0.5%. And the amount of the previous week’s game is, in fact, minus 8 USD, under the condition that the American dollar depreciates against the euro currency having a parity of 1:1.076.
It is a simple game with smoke screens to distract us. It is a fog curtain generated to facilitate the access of hedge funds back into positions after successive liquidations and the action Maskirovka, which coupled interest with the desire of funds.
The fundamentals of the physical market, however, remain identical. The productions are visible and, leaving aside the chorus of servants of group interests, who argue from many parts of the world that there is not enough wheat to alert the market, I will tell you only this: there are only 3 months left until the new crop, from which one month is occupied with the celebration of Ramadan, and another month is intended for the Christian, Catholic and Orthodox Easter holidays.
However, we still have one parameter that we must bring into discussion, namely the cost of establishing crops. We are talking here about the European Union and the USA, as well as the rest of the countries affected by the global energy crisis produced by Russia. Crop establishment costs were extremely high in the fall of 2022, and they act as a long-term hitter.
These costs must be dissipated. But with these prices that have effectively fallen from above, over a period of time, let’s call it average, their dissipation in a system cannot be carried out lightly. That is why we anticipate that, in any conclusion, the establishment costs must be taken into account, wherever these costs are located on the globe, whether we are talking about the northern hemisphere, whether we are talking about Asia or South America or Australia. We thus have a landmark that must be taken into account, because otherwise, bankruptcies among farmers, globally, could turn out to be a snowball that will roll downhill, becoming a problem in the world supply of agricultural raw materials.

LOCAL STATUS
Price indications of feed barley are around 195 EUR/MT, CPT Constanța. It is a decrease granted with that of wheat. And the new crop has an indication of 190 EUR/MT, CPT Constanța.
Given the Euronext action, we should see a boost of at least 7 EUR/t reflected in barley prices early this week for both the old and the new crop.
REGIONAL STATUS
UKRAINE. Farmers in Ukraine have started sowing spring barley.
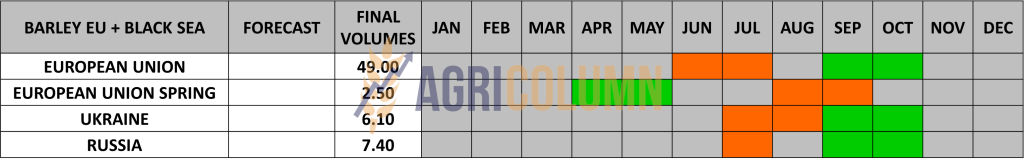
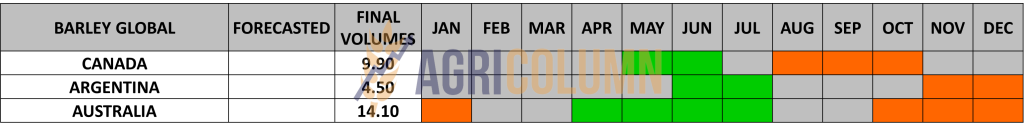
The EUROPEAN UNION accumulated an export level of 4.33 million tons and an import of 1.65 million tons of barley. The previous season, the export was set for the same period at the value of 6.2 million tons, while the import was valued at only 0.7 million tons. The direct consequence of the 2022 drought combined with the flow of Ukrainian goods add up to a reversal of this trend. EU-27 + UK barley production in 2023 is forecast at 59.6 million tons, down slightly from the previous forecast of 60 million and up slightly from 58.8 million in 2022.
TENDERS AND TRANSACTIONS
MIT JORDAN purchased 110,000 tons of barley with August FH and SH delivery (FH = first half; SH = second half), as follows:
- 50,000 tons Ameropa at 267 USD/MT, CFR Aqaba, FH
- 60,000 tons Viterra at 267 USD/MT, CFR Aqaba, SH
It is 17 USD/MT lower than the previous tender.
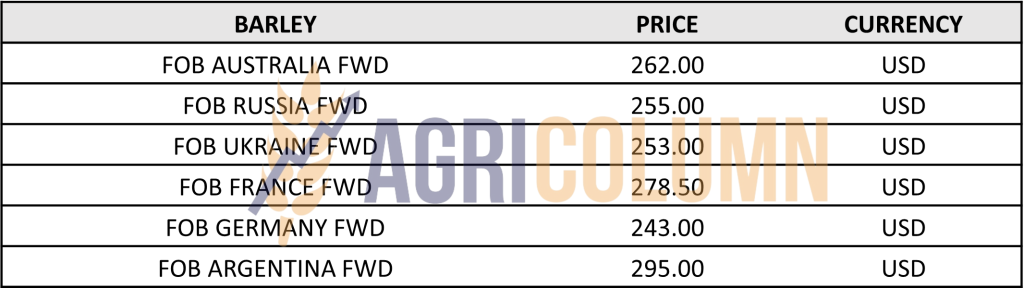
BARLEY PRICE INDICATIONS IN MAIN ORIGINS
GLOBAL STATUS
No essential changes.

LOCAL STATUS
Corn indications in the port of Constanța drop to the level of 225 EUR/MT.
The new corn crop is valued at 215 EUR/MT, in the same parity, CPT Constanța. So we see a reduction in the crop inverse, which is a sign of crossing into another life cycle of corn.
CAUSES AND EFFECTS
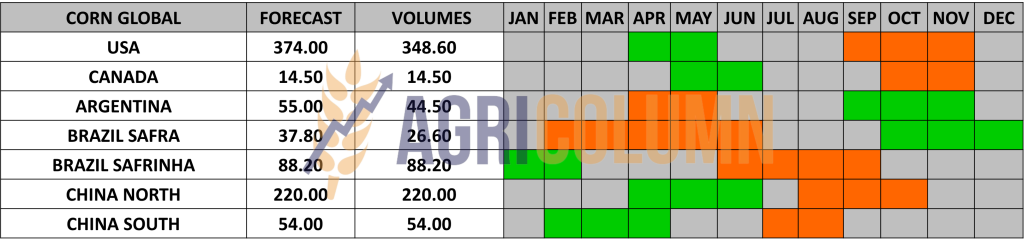
As for the old corn crop, the status of export versus import remains within the same parameters. Romania, in the drought conditions of the 2022 season, had a crop of 8 million tons.
In the period March 2022-June 2023, the volume of corn imports reached 253,000 tons, and in the period July 2022 – March 19, 2023, we have an import volume of 1,145,000 tons. Cumulatively, Romania’s import is 1,400,000 tons. Export to third countries is at the level of 900,000 tons, according to DG AGRI.
What do these numbers tell us? A level of corn import from Ukraine affected Romania’s domestic consumption. Let’s just think that in the spring of 2022, Romania was coming off an exceptional season. And the question that arises is the following: Did Romania need corn imports until the new crop, which arrived no later than mid-September 2022? The answer would be, of course not. As it was decimated by drought and heat, the internal needs were still provided. What driver then conditioned the import into Romania of the 1.4 million tons for consumption in the domestic market?
The answer is only one, namely the price. Because in the hysteria created by that period, the Ukrainian goods had a substantial price discount compared to the Romanian ones, and the processors, the feed industry, the local traders, benefited from these things, effectively excluding the Romanian goods from domestic consumption. Same as wheat, same as sunflower and rapeseed. Thus, it was the price that dictated and created the immeasurable problems of Romanian farmers.
Returning to the present, corn has the same trajectory as wheat and the start of the spring sowing campaign will generate for Romania a level of 2.45 million hectares which we hope to convert into an average harvest volume of around 14 million tons, +/-2%.
REGIONAL STATUS
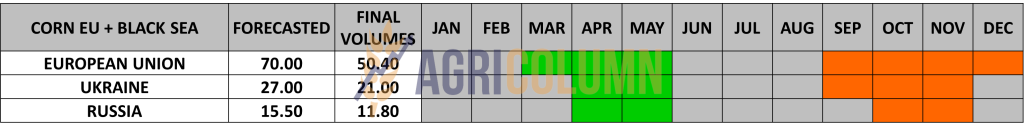
EUROPEAN UNION. As we said in the previous issue, the Union is slowing down the pace of Ukrainian corn imports and is currently at the level of 19.73 million tons. The origins that make up this figure belong to Ukraine, with a volume of 10.15 million tons, and Brazil, with a volume of 7.8 million tons.
The sowing season will start soon at the Union level as well and so we will have a complete picture in the immediate period.
UKRAINE still has a volume of about 6 million tons to export. The Corridor extension positions it as a favorite in sales to China, but due to the 20-30 day wait for JCC inspection in Istanbul, the origin price is penalized to 200 USD/MT.
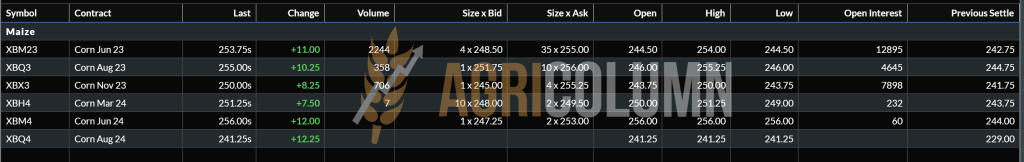
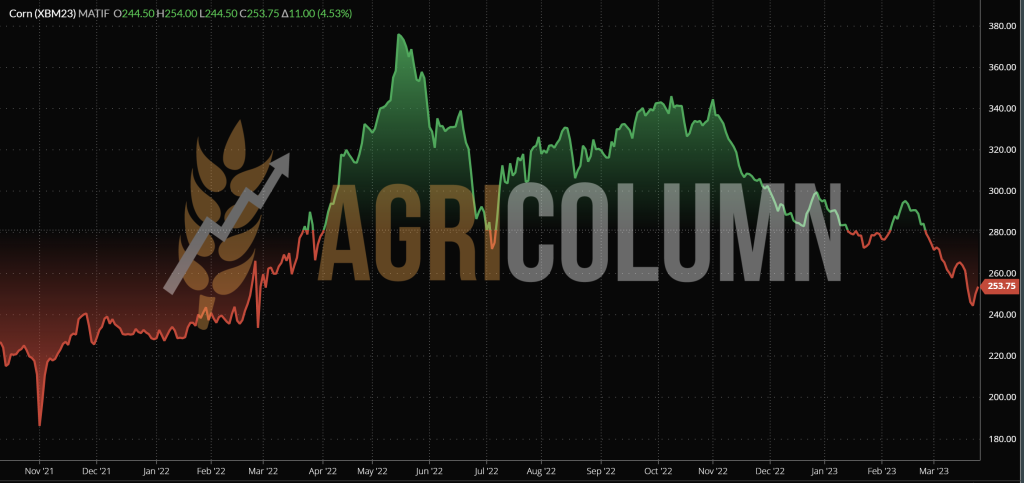
EURONEXT CORN – XBM23 JUN23 – 253.75 EUR (-7.75 EUR vs last week)
EURONEXT CORN TREND CHART – XBM23 JUN23
GLOBAL STATUS
ARGENTINA is in the same state we have known for a very long time – drought and degraded crops.
BRAZIL remains a major competitor for the US in terms of corn exports, but will face resistance from Ukraine, which is logistically better positioned towards China.
USA. With the huge volume of corn sold last week, total export sales for 2022/23 covered 74% of USDA’s full-year forecast as of mid-March, below the average of about 80% but up from 68% the previous week.
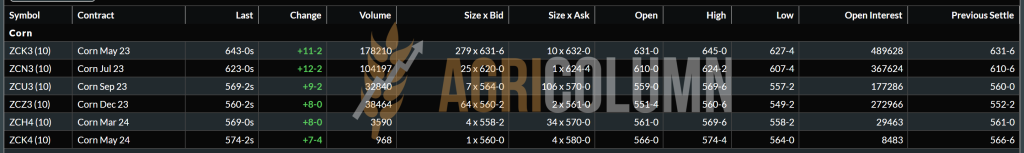
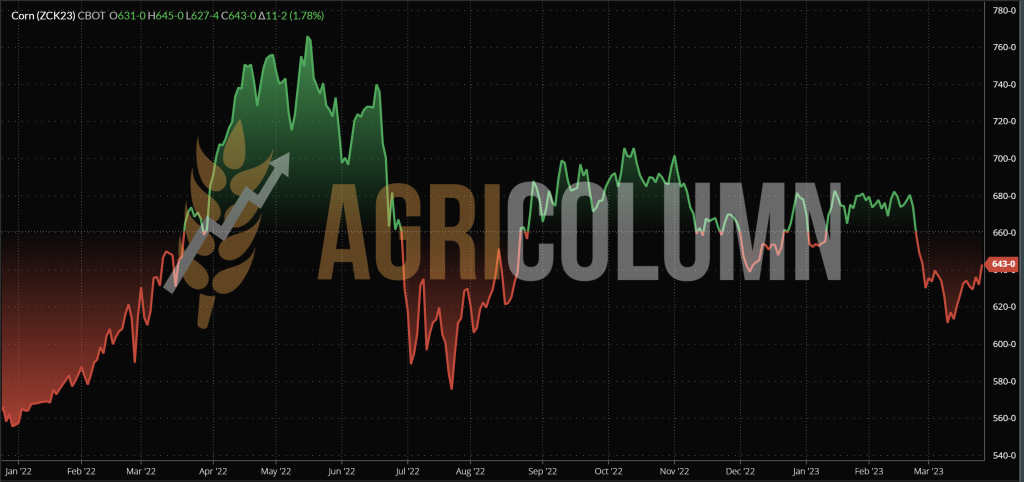
CBOT CORN ZCK23 MAY23 – 643 c/bu (+26 c/bu = +10 USD/MT from last week)
CBOT CORN TREND CHART – ZCK23 MAY23
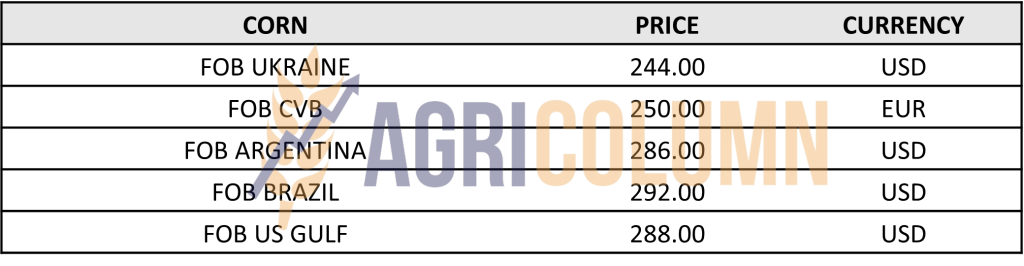
CORN PRICE INDICATIONS IN MAIN ORIGINS
CAUSES AND EFFECTS
US export volumes boosted the CBOT at the end of the week, after initially bleeding through position liquidations. On March 21, we had an indication of 629 c/bu, and at the close of Friday, March 24, the wheat traction, due to the Russian headlines, increased the level to 643 c/bu. But we have to understand that here we have two factors, described above: Sales + Headline.
And March 31, 2023 is very close. That’s when we’ll find out the projected U.S. seeding acreage.
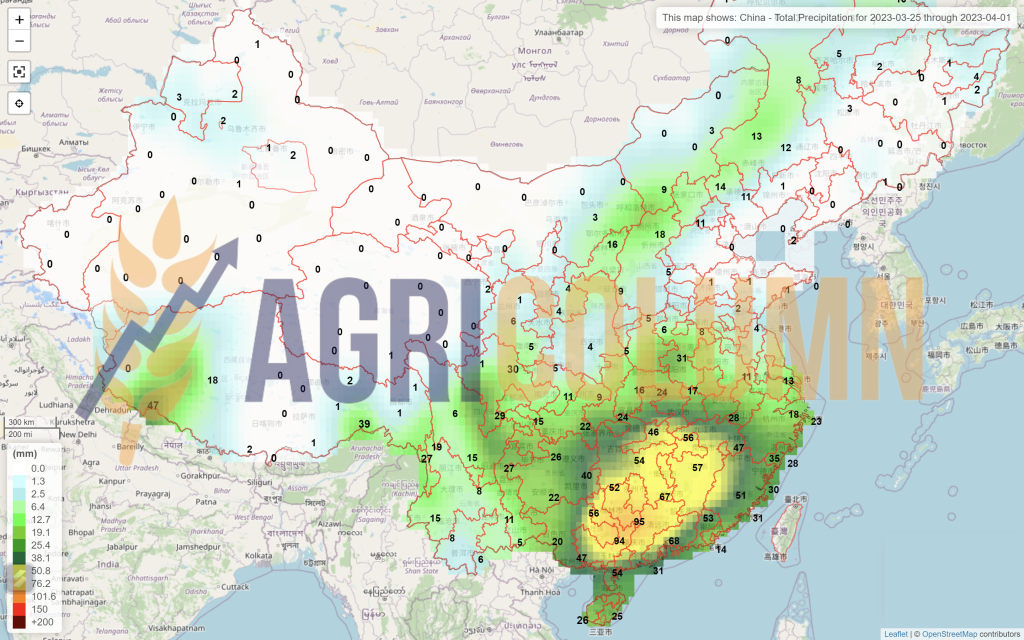
Globally, China buys a lot of corn. It is the direct effect of the Zero Covid policy, and the sales growth predicted by reputable analysts (Q2-2023) is happening exactly.
According to the customs service of the People’s Republic of China, in February, compared to January, the import of corn increased by 41% to 3.1 million tons, and in the first two months of the new year, in total, it amounted to 5.3 million tons, which is 14% higher than the corresponding figure last year.
We therefore have an expectation for the corn product, which will be augmented by the NASS report. If the NASS report indicates an increase in North American acreage, price indications will be penalized on the CBOT and subsequently on Euronext. Corn support is given by China, which buys at this level (apparently it suits them) and diversifies as it wants the origins. In addition, support also comes from the already known Argentine disaster.
Assumptions lead to a brake on corn as well. The spread to wheat is very narrow in terms of price (physical market) and is supported by China’s purchases. But, once the acreage related to the crop is known, we could see a brake and a reset on another level of corn, especially in relation to wheat.

LOCAL STATUS
The quotations of old-crop rapeseed in the CPT Constanța parity are at the level of 415 EUR/MT.
The new crop is indicated at a discount of 35 EUR/MT compared to the AUG23 reference, in CPT Constanța parity and minus 45 EUR/MT compared to the AUG23 reference for delivery to processing units.
CAUSES AND EFFECTS
The spike we saw on Euronext at the end of the week is but a pale consolation for what was. Funds, fueled by Russian manipulations, found it an opportune time to speculate and, by implication, profit from future entries and exits from the position.
And the approximately 20 EUR won by rapeseed on Friday, March 24, 2023, we have to settle with another formula, namely: February 17, 2023 vs. March 24, 2023, i.e. 563 EUR vs. 458 EUR. And the result is minus 105 EUR/MT. This is where we need to look to understand why the 20 EUR is just a temporary patch generated by a spike. Otherwise, in the physical market, rapeseed continues to perform the same, and new crop indications can also position it at 390 EUR/MT.
Why? Simple, the Ukrainian crop will keep coming and local processors and traders will import it, removing the local crop from consumption.
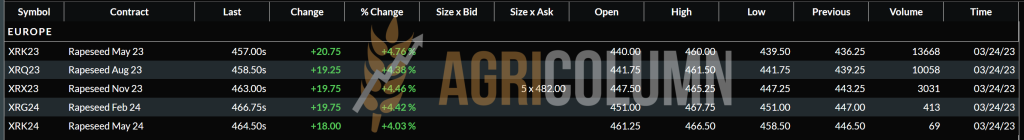
EURONEXT RAPESEED – XRK23 MAY23 – 457 EUR (-10 EUR vs last week)
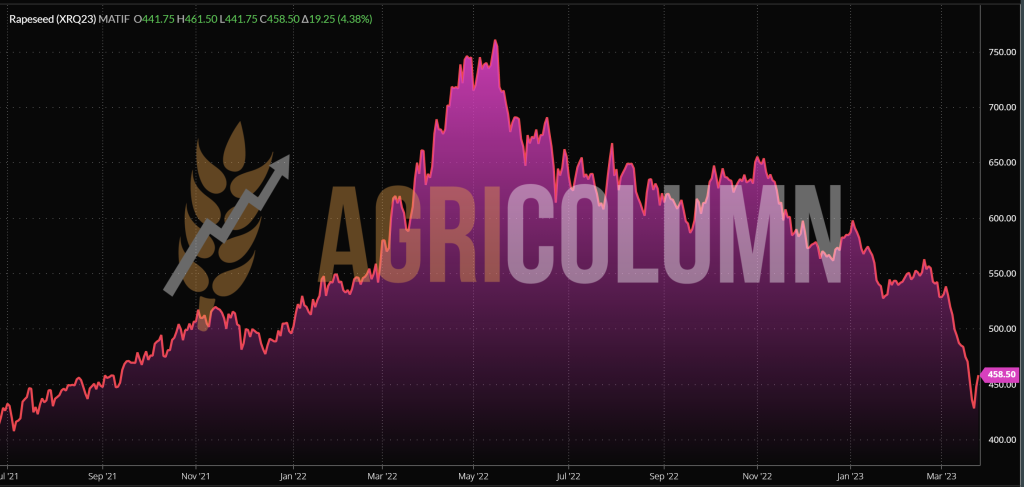
EURONEXT RAPESEED TREND CHART – XRK23 MAY23
REGIONAL STATUS
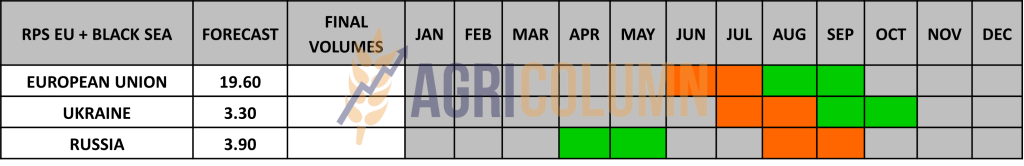
The EUROPEAN UNION raises the crop forecast once again. Coceral sees the volume sustained at around 20.5 million tons, against the European Commission’s forecast of 19.6 million tons. It is a significant difference at the moment and it all depends on the rest of the market participants, referring to the origins.
GLOBAL STATUS
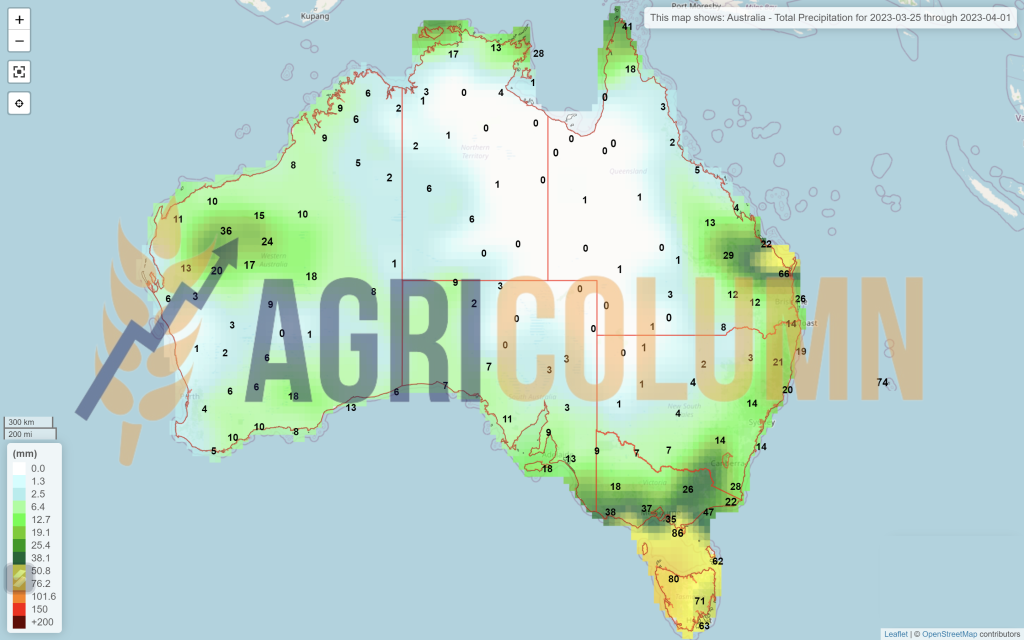
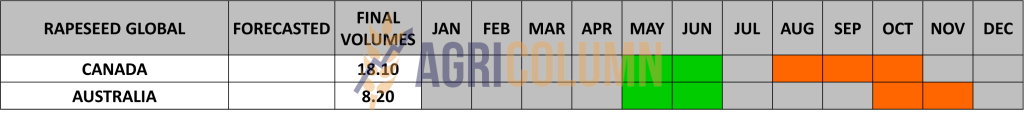
In the off-season, however, it should be noted that Australia will no longer see 8.2 million tons. Given El Nino, they will experience problems with rainfall and this will position their crop at a maximum of 5.7 million tons. Canada, however, remains in play as an Origin and their volume will influence the canola price trend.
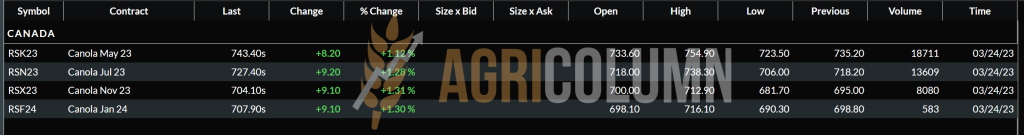
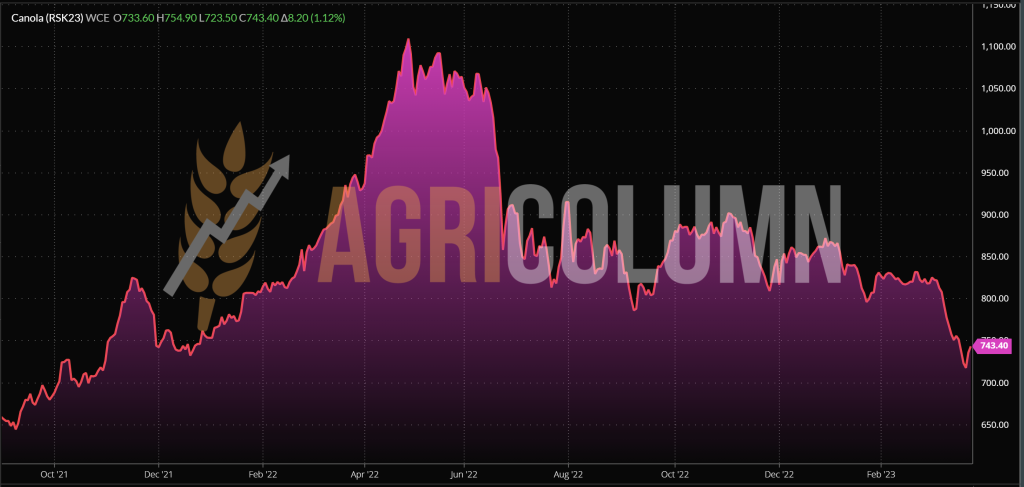
ICE CANOLA RSK23 MAY23 – 743.4 CAD (-8.2 CAD vs. last week)
ICE CANOLA TREND CHART – RSK23 MAY23
COMPARATIVE GRAPH. PETROL-RAPESEED-CANOLA CORRELATION
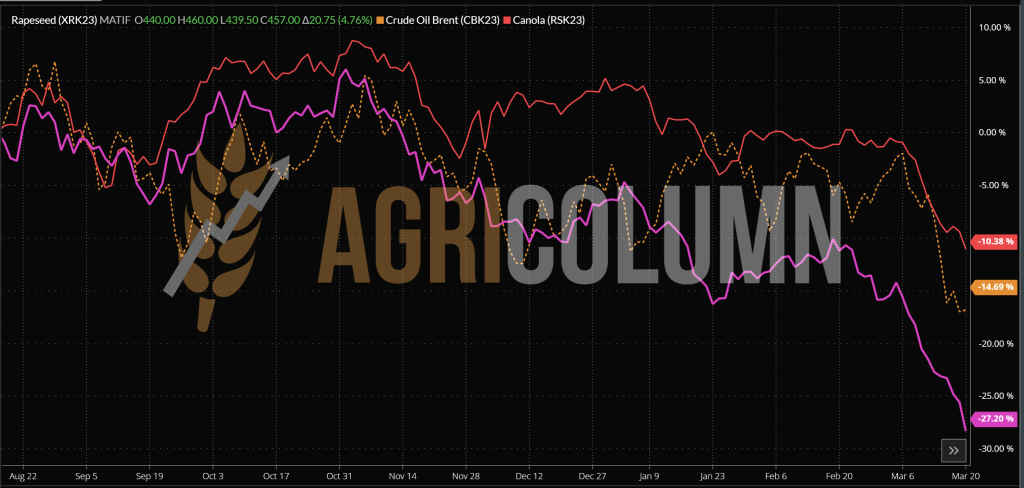
CAUSES AND EFFECTS
EXCERPT FROM THE PREVIOUS ISSUE: “What’s next? A future erosion is possible, and only if the economic premises take into account the costs of establishing crops will we be able to see a brake and a stabilization. That’s how it should be. Across the globe, start-up costs have been impacted by Russia’s intervention in Ukraine. We believe that there will certainly be a maximum downside threshold, driven by costs. Because otherwise no farm will be profitable anymore and the road to a demand generated by a reduced supply will be paved again.”
Now, in retrospect, this growth is on a false term. The reality indicates something else in numbers, namely:
- EURONEXT March 17 vs March 24 = 467 vs 457, i.e. a minus of 10 EUR.
- ICE CANOLA March 17 vs March 24 = 751 vs 743 i.e. a minus of 8 CAD.
Support comes from very tight Canadian stocks. Let’s not forget that in September 2022 they were forecasting 19.5 million tons and in November 2022 they were lowering the harvest volume level by 1 million tons.
Otherwise, we see a leveling off around 440-445 EUR/MT in the period ahead. Everyone will be paying attention to Australian exports, and in April to sowing in Antipodes.
The European market is saturated, although the price level of rapeseed oil FOB Rotterdam has reduced further from the loss suffered the previous week, returning to an “edible” level, so to speak, of 875 EUR.
But a demand growth factor could come from the East. China in Q2 should increase transport-based consumption. This aspect means bio -fuel.

LOCAL STATUS
Port Constanța effectively collapses the price of sunflower seeds to the level of 395-400 USD/MT. Indications are disproportionate among harbor buyers, who probably do not understand where the market is moving. And we’re seeing indications going as low as 380 USD/MT in some cases. All in CPT Constanța parity.
CAUSES AND EFFECTS
EXCERPT FROM ISSUE 10: “Farmers must sell the goods. The price of oil is low and the coverage is there. We are only 3 months away from processing until the annual reviews.”
What we have argued for two report issues so far is coming true, unfortunately for farmers. Processors are hedging and bidding at 360-370 USD/MT, which is a sign that our forecasts were based on correct data. But at this level, if liquidity is no longer needed, stocks can be kept in warehouses because the new crop will be valued at about the same parameters as today.
REGIONAL STATUS
UKRAINE. We are in the same situation where there are no offers to buy oil. Ukrainian processors are reducing feedstock purchase prices to levels between 325-380 USD/MT DAP processing units. These prices include VAT, for your information. So we have another drop of 20-35 USD/MT from the previous week.
RUSSIA practiced Maskirovka again, announcing that it would curb the export of sunflower oil, but it did not achieve the intended effect. It is extremely simple. There is not enough demand and it automatically smooths the way for Ukrainian sunflower oil export.
TURKEY is getting the game, albeit late, and is removing any restrictions on the export of sunflower oil, thereby nullifying all potential effect of Russia’s move.
GLOBAL STATUS
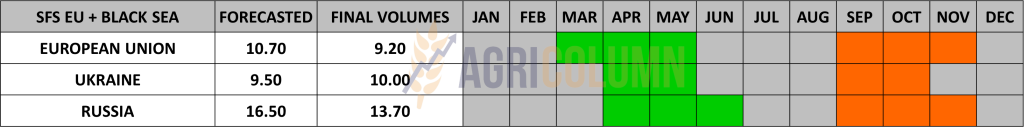
ARGENTINA has reached a harvest level of 63% and they have a harvest volume to date of 2.3 million tons. So, it is heading, as we predicted, to 3.5-3.6 million tons.

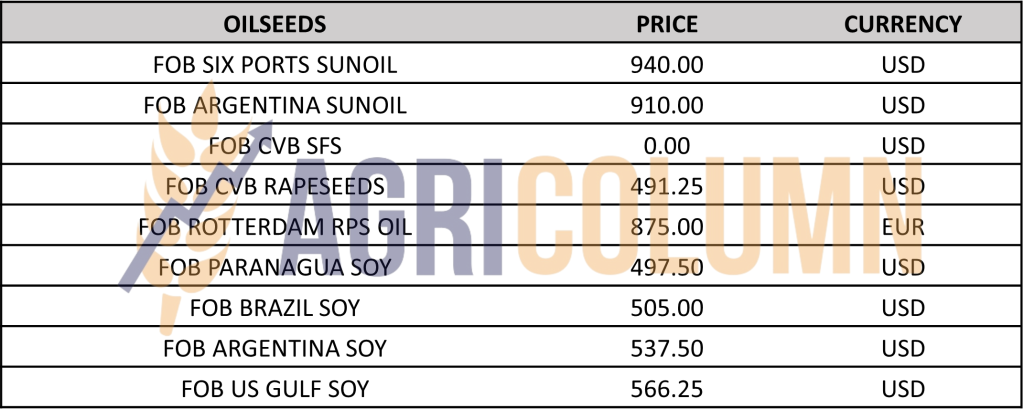
PRICE INDICATIONS FOR OILSEEDS AND CSFO IN MAIN ORIGINS
CAUSES AND EFFECTS
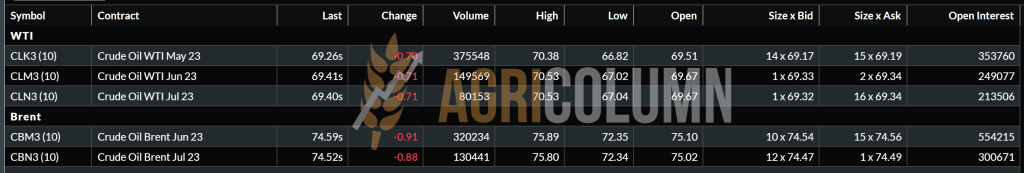
Nothing positive about sunflower seeds. The only positive note can be given to crude oil in the SIX Ports parity, which recovered 25 USD/MT to 940 USD/MT. But this growth is not felt all the way to the Black Sea basin.
As I said, the coverage is sufficient and no improvement is on the horizon today. At today’s price level, it is better to keep stocks. Of course, if liquidity allows it. The crop inverse is almost non-existent and I predict an entry into the new crop at the same level as today, ie 370 USD/MT maximum. And this estimate is valid for the next period, because there will be a time when farmers will be busy with sowing, religious holidays will occupy the space in the next month, and therefore we will find ourselves at the end of April – beginning of May, when traditionally they are waiting for the new crop, and autumn crops no longer have liquidity in demand or supply.
Russia tried to manipulate the market by claiming that it no longer wanted to export so much sunflower oil. But the attempt was doomed to failure. There was no way to resist this manipulation in a saturated market, which no longer emits much demand. Ukraine would have taken Russia’s place instantly, and Turkey has permanently stopped this manipulation by lifting any export restrictions on sunflower oil.
What’s next? We expect a float in the market of the trend, that is, the price will go up and down according to small spikes, without any immediate perspective.
A year out, we have a 780 USD/MT difference in the raw material price at DAP Processor parity. And when I remember the arrogance of some processors in Turkey who said matter-of-factly: “For any figure below 3,000 USD/MT of crude oil, I don’t even pick up the phone…”

LOCAL STATUS
In Romania, the price indications for soybeans are at the level of 490-500 USD/MT, DAP processing units for non-GMO soybeans.
REGIONAL STATUS
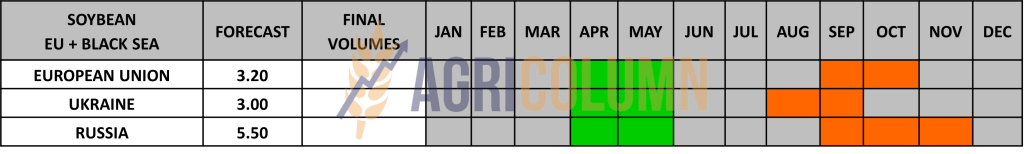
The EUROPEAN UNION reached an import level of 8.5 million tons. The previous season, in the same period, the level of import of the European Union was 9.9 million tons.
GLOBAL STATUS
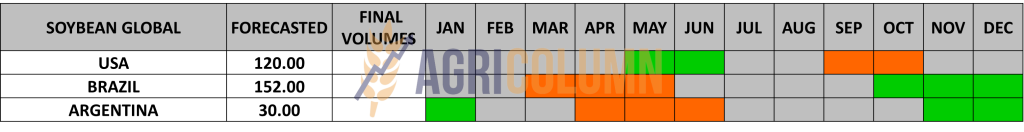
ARGENTINA is in the same dire situation. 25 million tons is their realistic target, with an import level of 8-9 million tons.
BRAZIL, through the local analysis house Agroconsult, increases the volume forecast to the level of 155 million tons. We see an additional 2 million tons coming from field estimates by this consulting firm.
CBOT SOYBEAN ZSK23 MAY23 – 1,428 c/bu (-48 c/bu = -17.6 USD/MT from last week)
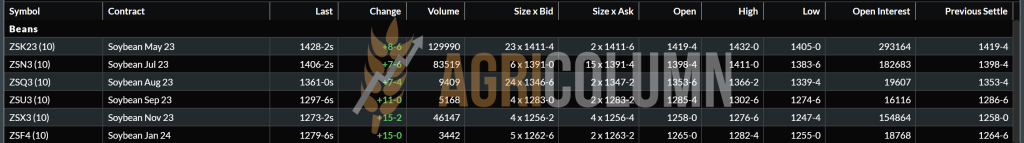
SOY TREND GRAPH – ZSK23 MAY23
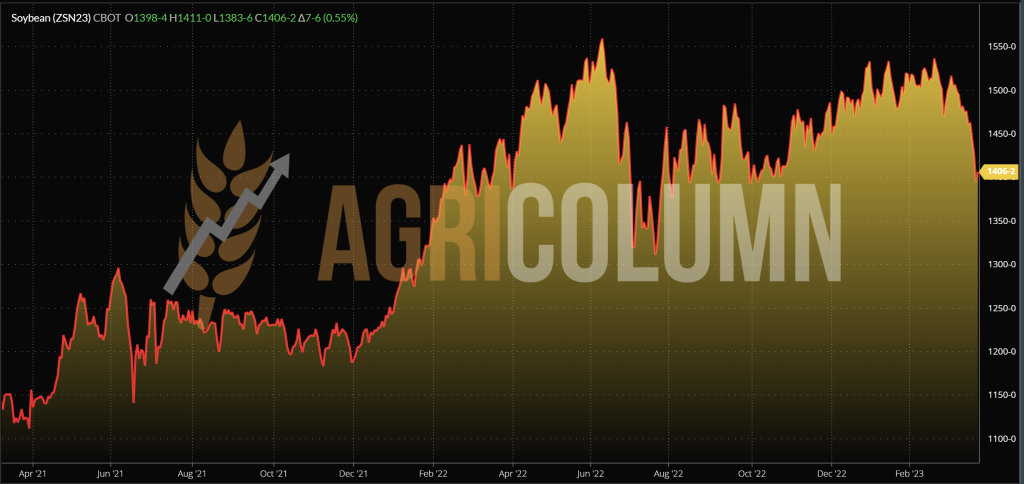
CAUSES AND EFFECTS
Soybeans, in turn, lost ground in the previous week. A level of $17 is not negligible, but support for soybeans remains the mix of factors:
- Argentina’s disastrous crop;
- Demand from China.
These two factors will also have the opposite effect:
- When the US will go into seeding and the acreage forecast to be revealed on March 31, 2023;
- Partially Brazil, through the excellent volume forecast.
However, if we look at soybean levels in the CBOT and cross over to the new North American crop and also factor in El Nino, we have to agree that these price peaks will end in 2 months.


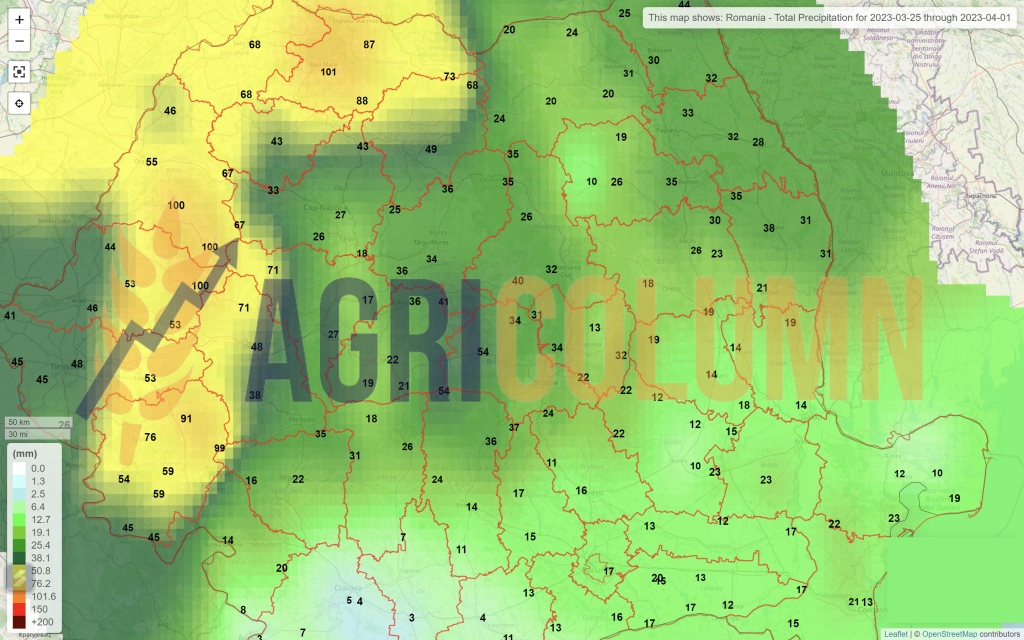
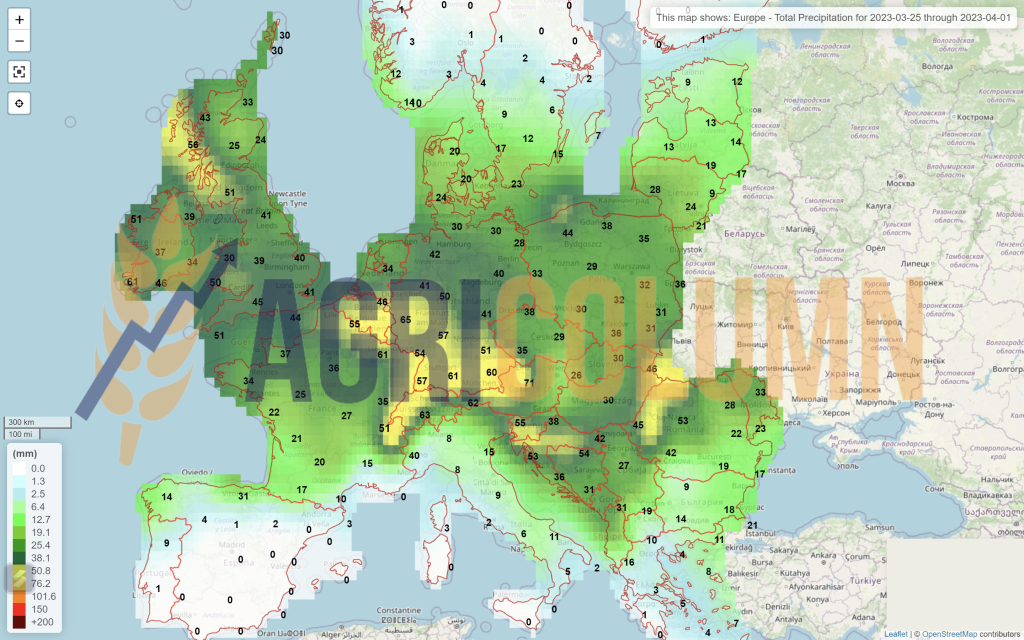
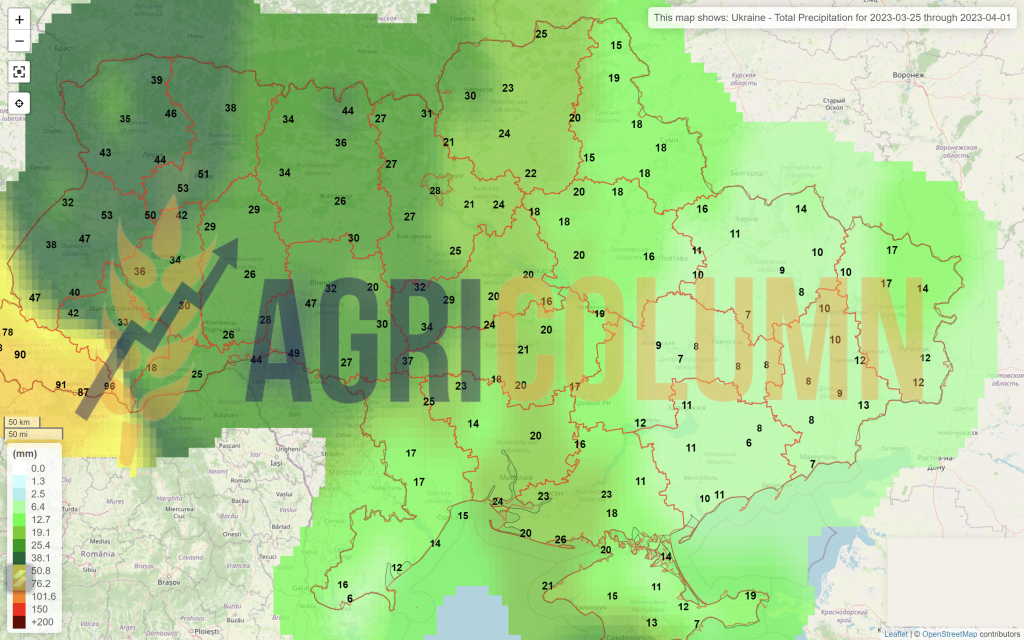
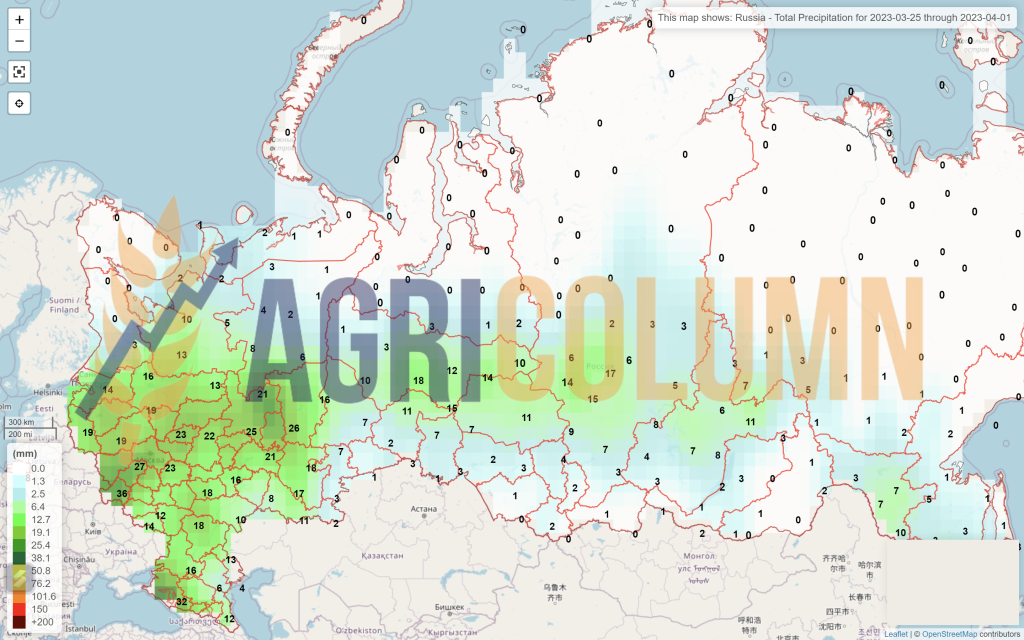
25 March – 1 April 2023
Romania
Europe
Ukraine
Russia
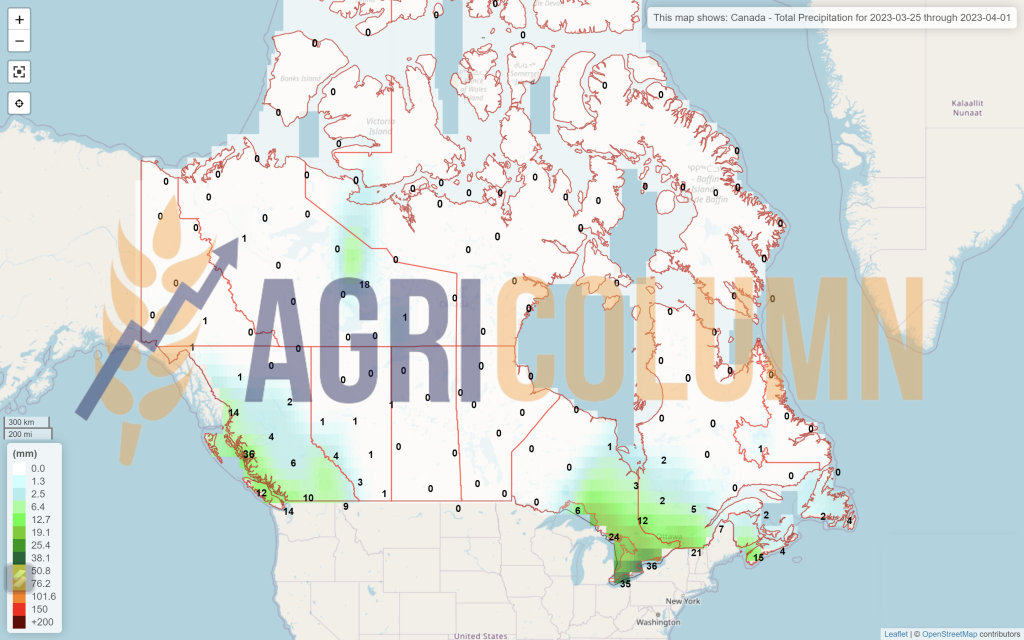
Canada
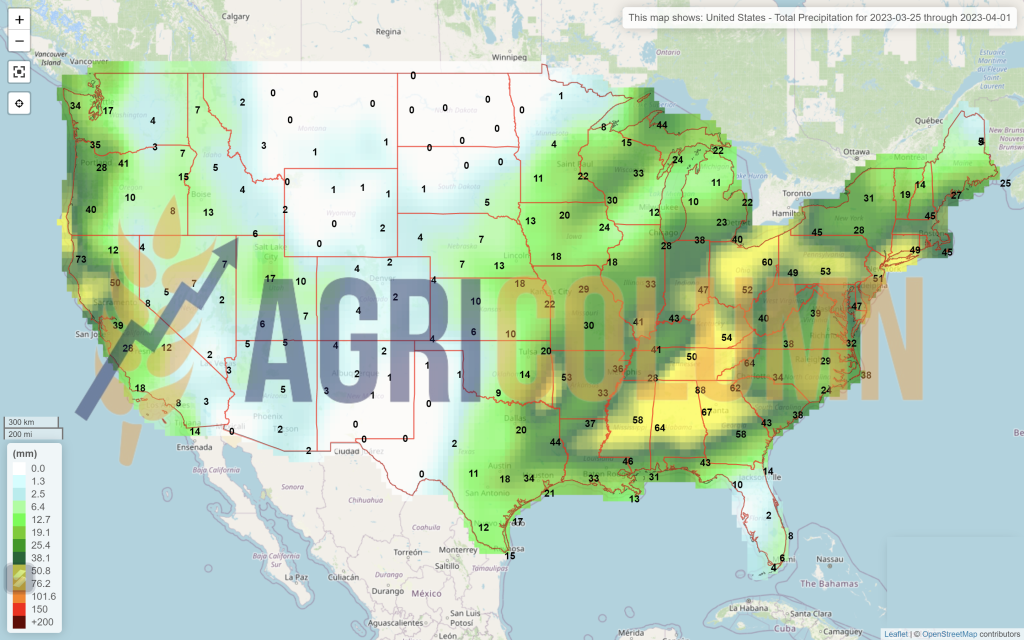
USA
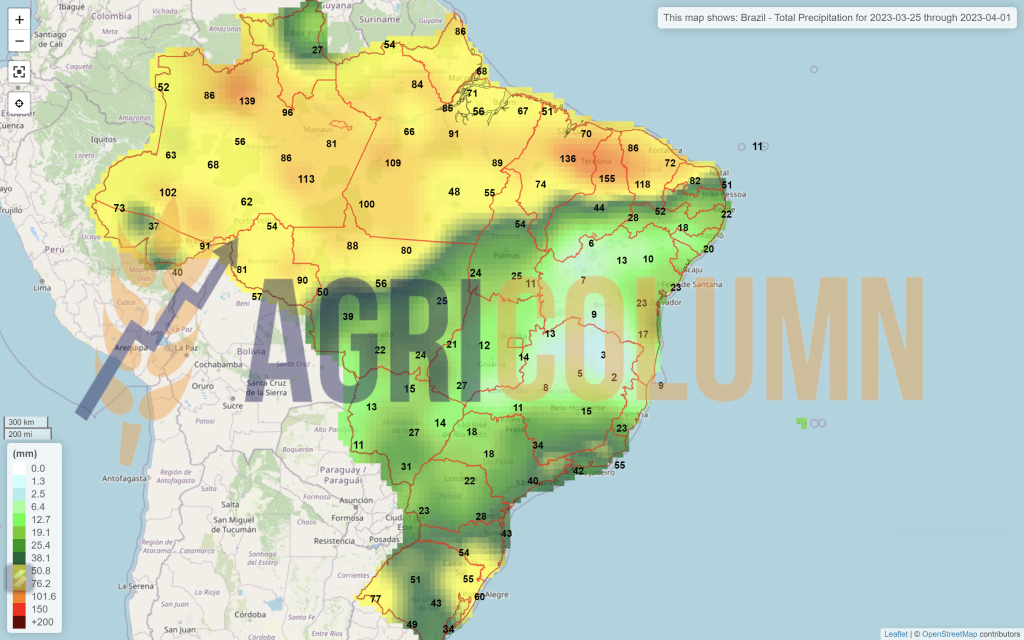
Brazil
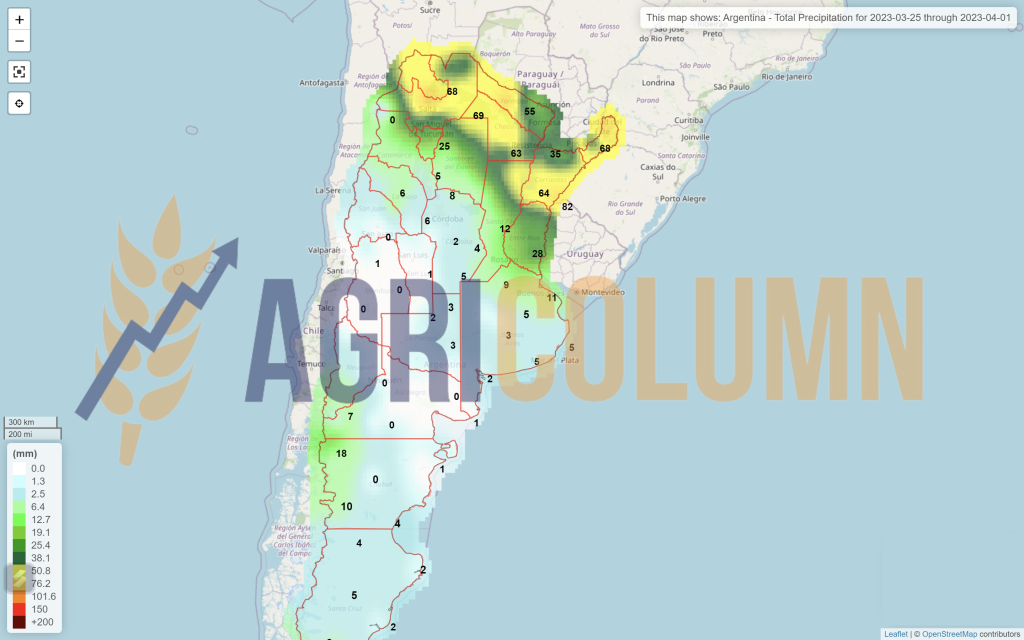
Argentina
China
Australia