This week’s market report provides information on:

LOCAL STATUS
The indications of the Port of Constanța anchor around the value of 248 EUR/MT. The drop was dramatic, from the level of 260 EUR/MT. Some buyers have quoted as much as 246 EUR/MT.
CAUSES AND EFFECTS
The erosion of the price of wheat is being felt in full. Unfortunately, it is also felt in the farmers’ accounts. Those hopes fueled by assumptions that had virtually no support are now, quite literally, dashed. The last few days have generated discussions in which the main theme was: “But we have established the wheat culture at very high costs.” And the natural guidelines we offered were: “We must behave like entrepreneurs”.
In other words, if we have not exploited the potential offered starting from May 2022, we must not look for explanations in the past, but only see with business clarity what we can do from now on. And the main condition is clearly the decision to sell. Every passing day adds up costs on freight, storage, financing and more.
It’s March 13th and things are going to start moving fast. The spring sowing, associated with the Easter holidays, will drive the passage of time with great rapidity. And the agribusiness market is not standing still. Primary markers work, secondary markers potentiate or degrade. The global agribusiness market doesn’t care about start-up costs, but only about Supply & Demand.
And one more very important thing. Logistics will generate a lot of problems in the upcoming season. Its availability and costs are the two variations that will once again impact the sales of Romanian farmers. And then, on the chain (the unloading flows), the port will certainly be extremely congested and not permissive with the Romanian farmers’ time.
Logistics already know a 60-65% increase in the quotations, in the contractual estimate of the cost level of the transport. And this lowers the price of goods at FCA Farm parity. The availability of storage space is not necessarily a solution. We saw this in 2022. It did not generate any profit, on the contrary. And the harvest pressure will be extremely high.
The only advantage of Romania is that it harvests the first, but this too can evaporate, because the flows from Ukraine will supply with goods from the past crop and thus can cancel the condition of the first country to enter the harvest.
REGIONAL STATUS
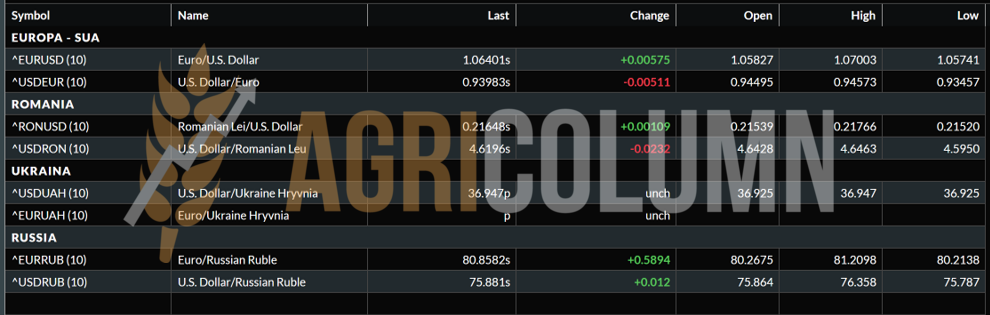
RUSSIA, as we have seen, has received 1 million tons in the 2022 crop estimate to 92 million tons and, by implication, a higher export level. The development of Russian exports must exceed the conditions of the time. The problems caused by the latter generated major delays in shipping the contracted volumes. On the other hand, confidence and optimism are at normal levels in the Russian Federation. It is still focused on reaching the assumed export potential. The floating export tax remains set as a benchmark: 70% tax level for the difference between the price base and the indicative price. Today, the export duty on wheat is 70.5 USD/MT.
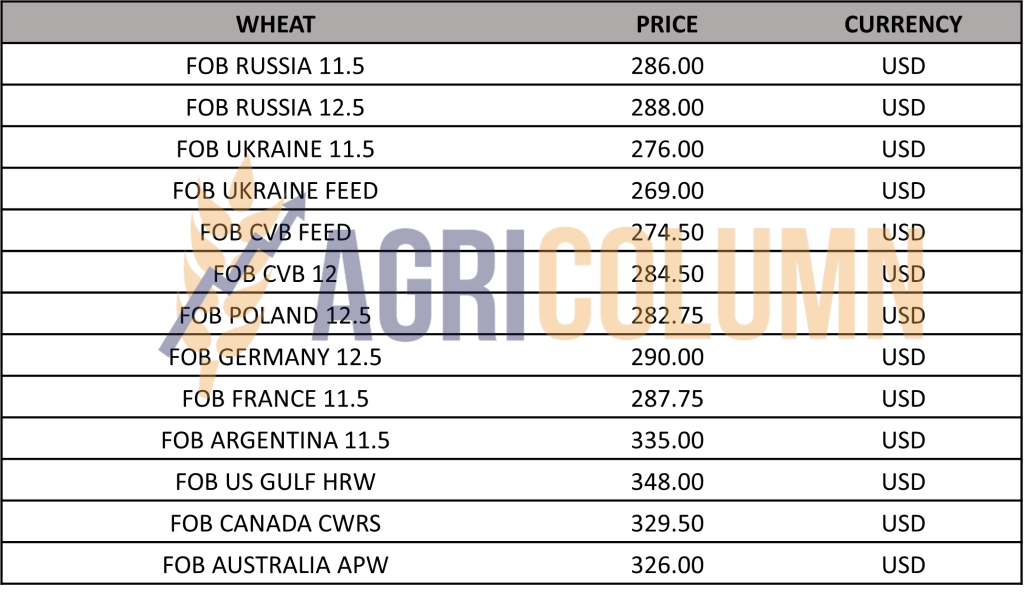
And, of course, there is also the issue of wheat stocks with which Russia will go into the 2023 harvest. We have an estimate of over 15 million tons and there is no other option than an accelerated sale. But, at this moment, Russia is no longer competitive in the basin as it was, with those discounts of 10-15 USD/MT compared to the Romanian origin. The indication for these days is 288 USD/MT FOB Russia, compared to 284-285 USD/MT FOB Constanta.
The new Russian crop is again fueled by contradictory moods. Some of them say they have problems, others that the drought will ruin the crop. But we know these moments too well, they are only elements of self-interest to generate a possible price increase, betting on headlines. All in all, Russia will generate a volume of its own cargo of 85-85 million tons. We say “own” because they will certainly be fed from the occupied territories in Ukraine, as they have done in the past. To this volume we will also add the one with which they will move into the new crop (bumper crop).
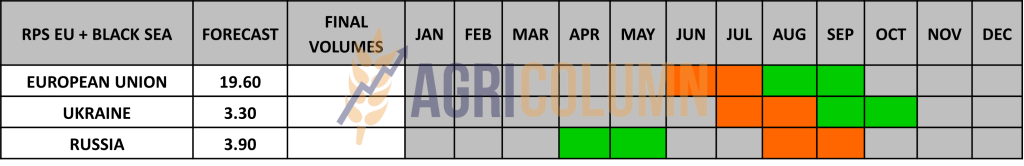
UKRAINE indicates a vegetation status under observation. Precipitation is needed and it will come, perhaps timidly at first, but surely the Ukrainian plains will be watered. Their crop forecast therefore remains at the level of 18 million tons, increasing due to the areas that increased from 3.7 million hectares to over 4 million hectares. Unsold stocks are naturally added to these 18 million, which could be around 10 million tons. Thus, they will have an export level of 20 million tons, very close to the normality of pre-war times.
And over Ukraine we see prices weakening and trading levels for FOB POC parity at 275 USD/MT for 11.5% PRO quality. In CPT Izmail, Reni parity, prices are at the level of 196 USD/MT. The volumes of Ukrainians crossing through this area, as well as the traffic generated, show us once again that it is much easier via Romania than via the Corridor to Istanbul. It is easy and cheap for the reasons we know all too well, namely: there is no waiting time, there is a dispersion of volumes and, implicitly, a richer offer in terms of destination.
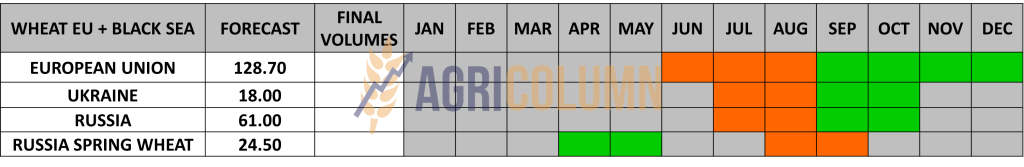
The EUROPEAN UNION indicates a common wheat export level of over 21 million tons, including durum wheat, as well as other derivatives such as flour, but in equivalent tons of wheat, we reach a level of 22 million tons. Cumulatively, imports are at the level of 6 million tons, the origin of Ukraine being by far the most representative, with a level of almost 4 million tons. The previous year, on the same date, the European Union had an export level of 20.7 million tons, and imports were at the level of 1.9 million tons. The figures show once again the appetite of European processors for discounted goods of Ukrainian origin. The condition of crops is in the same favorable parameters. Rainfall has arrived on the old continent and is drenching the heavily cultivated areas.

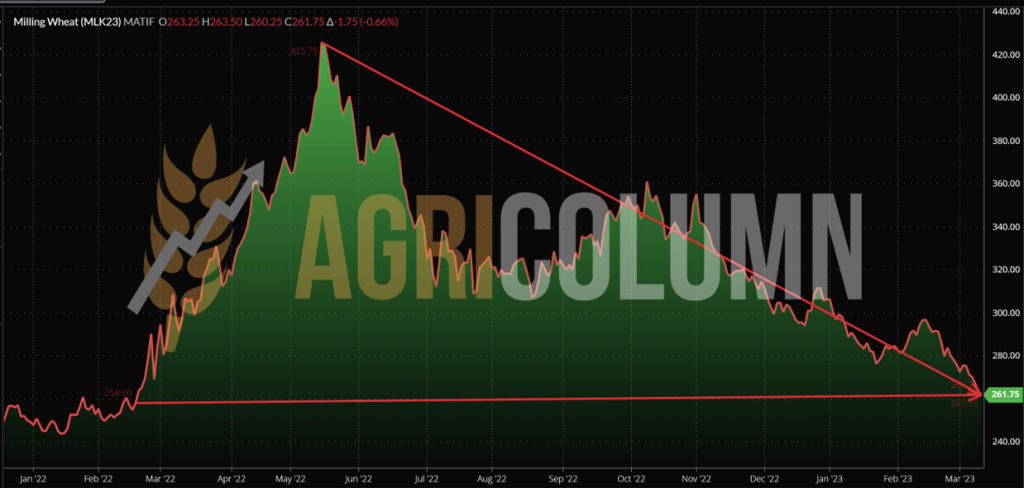
EURONEXT – MLK2323 MAY23 – 261.75 EUR (-13.5 EUR vs. previous week)
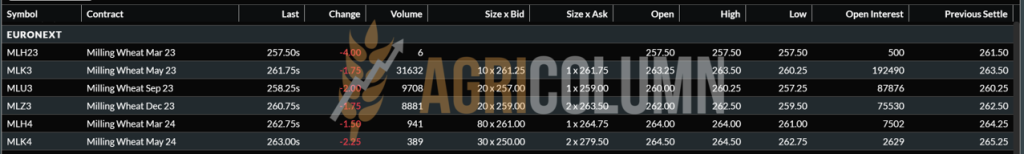
EURONEXT WHEAT TREND CHART – MLK2323 MAY23.
From Zero to Hero and back to Zero | MAY22 – MARCH23 (-164 EUR)
GLOBAL STATUS
USA: No significant changes from the previous week. The condition of the crops remains in the same norm.
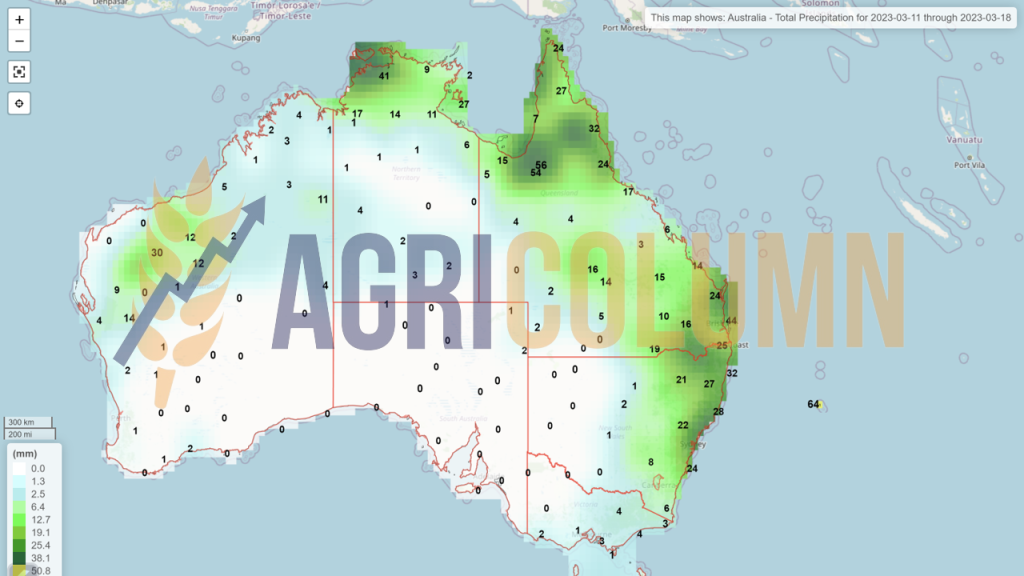
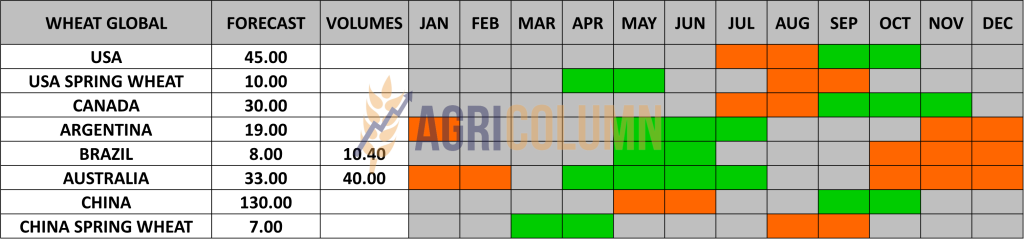
AUSTRALIA is recognized by ABARES and by implication USDA with a 39.2-million-ton harvest volume and this recognition is a late one as traders have already been factoring in these volume increases for much longer. The general view is that Australia actually generated over 40 million tons of the crop. And if we take the comparison further, 33 million tons of the initial forecast versus today’s, it indicates an increase of 7 million tons, which creates discomfort for the other origins. But next season, with the disappearance of La Niña and the return to El Niño, Australia will return to the average of 32-33 million tons.
BRAZIL, in turn, gets a boost from 9.9 million tons to 10.4 million tons, which is 0.5 million tons, which may seem small, but it affects global trade as well as prices in other origins.
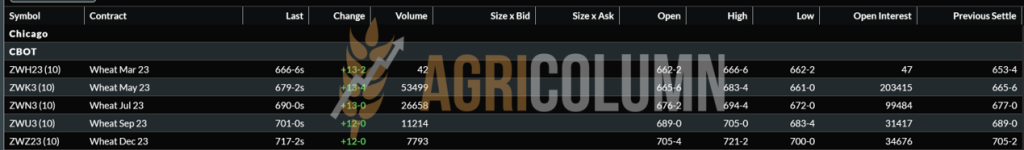
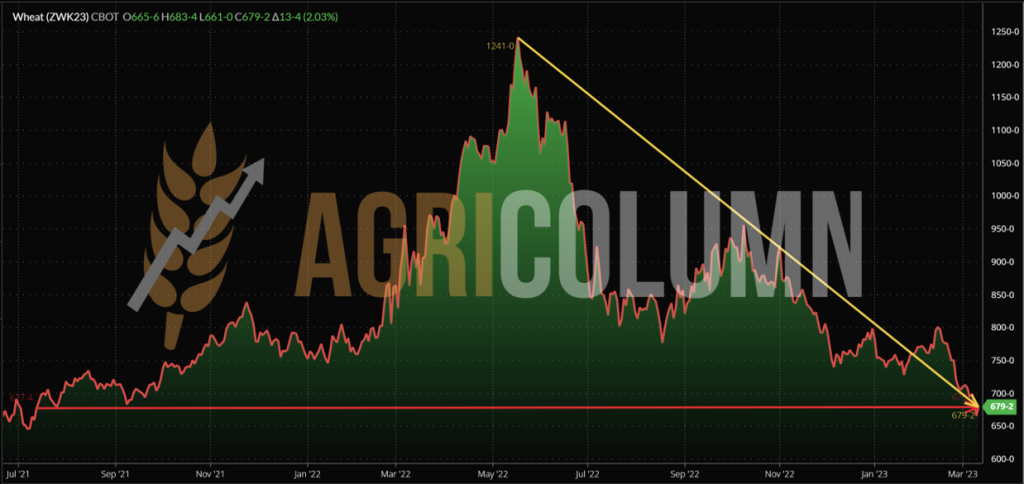
CBOT WHEAT – ZWK23 MAY23 – 679 c/ bu (-29 c/ bu = -$10.7 vs last week)
CBOT WHEAT TREND CHART – ZWK23 MAY23.
From Zero to Hero and back to Zero | MAY22 – MARCH23 (-207 USD)
WHEAT PRICE INDICATIONS IN MAIN ORIGINS
TENDERS AND TRANSACTIONS
MIT JORDAN purchased 120,000 tons of wheat at 315.3 USD/MT CFR Aqaba for delivery in the first half of August 2023. The previous tender on February 21, 2023, generated a price of 333 USD/MT CFR Aqaba. So, we have a difference of 17.7 USD/MT in the negative sense.
MIT JORDAN is organizing a new wheat tender on March 14, 2023, with delivery periods in August and September 2023.
ODC TUNISIA purchased 100,000 tons of C&F durum wheat as follows:
- P1 Viterra at 458.01 USD/MT;
- P2-P3 from Casillo at 458.69 USD/MT and 456.89 USD/MT.
CAUSES AND EFFECTS
TECHNICALLY, THE MAR23 INDICATION HAS TAKEN ITS PROFIT. Through the CBOT and EUROENX, the funds took profit and exited. It was a very vigorous decline, if we judge the moments from February 15 to March 10, 2023. I anticipated the way things were going and the downtrend was extremely steep.
- CBOT, on February 15, indicated MLH23 (March 2023) at 774 c/ bu, and in the evening of March 10, it indicated 666 c/ bu, representing a decrease of 108 c/ bu, equivalent to 40 USD/MT or 37.6 EUR/MT.
- EURONEXT indicated on February 15 MLH23 (March 2023) a level of 296 EUR, and on the evening of March 10, it indicated 257 EUR, representing a decrease of 39 EUR.
Effectively, of the 164 EUR gap between MAY22 and MAR23, 25% fell on the MAR23 liquidation.
What’s next? We have some milestones to follow, and we list them:
- The CEREAL CORRIDOR and its possible extension is the first factor to watch. But let’s not forget that this corridor, in fact, dissipates Ukrainian pressure on neighboring countries. Otherwise, if it closes, the countries in the vicinity will feel extreme pressure. This pressure will be compounded (and is today, but not so acute) from price discounting, from high logistics cost, from logistics availability and from extreme congestion at unloading (port or domestic market-processors).
- WEATHER is a second factor to watch. Its enhancement in the sense of precipitation will naturally induce a decrease in prices by relaxing destinations. It will also allow Russian export to be expedited or not.
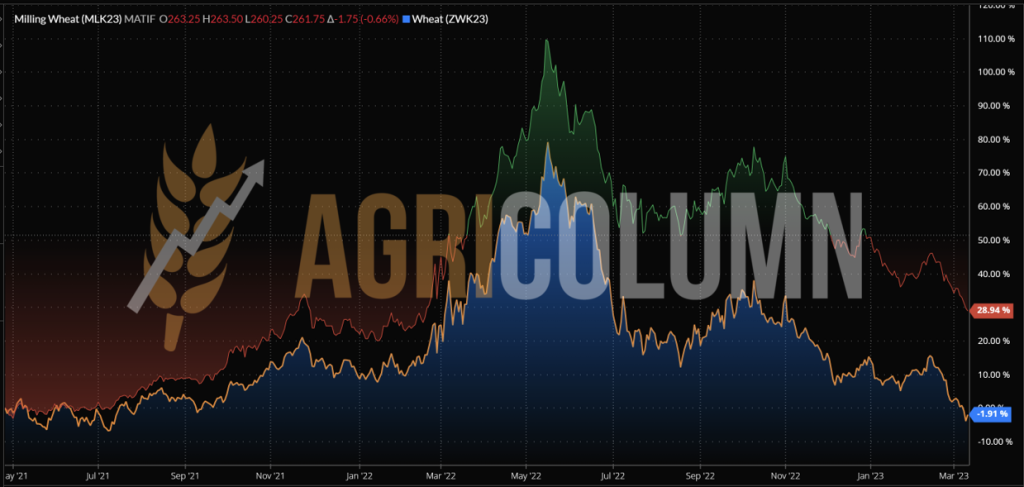
- EURONEXT vs. CBOT is another factor to watch. CBOT reached the level of July 14, 2021. Euronext reached the level of February 2022, before the war. So, there is still enough room for Euronext to fall. We insert the comparative chart between Euronext (back area marked in black and the red-black trend) and CBOT (foreground area in blue marked by the orange trend line).
RUSSIA and its unmistakable style. We are used to Russian bravado, we are used to uttering threats and beautifully told stories about powder kegs. What Russia does not understand is that they are condemned to sell wheat, to sell what they have as raw material, which is oil and gas. One wrong move and they shut themselves down.
Turkey has already suspended shipments from the EU through the Bosphorus to Russia. The moment they blink wrong, it’s all over for them. I think it is clear to everyone that this Maskirovka is already taken into account. Why do they claim that they cannot export agricultural raw materials? No one is stopping them. They want to export the oligarchs’ fertilizers to feed the killing machine in Ukraine. Barring this, of course. Erdogan proceeded according to what Blinken told, in order to create a negotiating lever, an element of retaliation against Russia.
Moreover, Russia’s attention has been diverted behind the scenes, where Georgia is rocked by pro-European protests. Russia responds hybridly, trying to destabilize Moldova.
Things are extremely complex, but the Black Sea is a free sea and by no means a Russian possession.
CONCLUSIONS:
- A plateau phase will follow for wheat, a stabilization of prices around today’s values.
- Future tenders will set new price markers and thus cement harvest price values.
- But harvest pressure associated with flows from Ukraine will again drive price declines.
- Russia will also impose a pressure on the price because it must export, in turn.
- To watch the weather, for the consolidation of the volumes in Origins.

LOCAL STATUS
The price indications of feed barley decrease, in turn, to values of 220-222 EUR/MT in the CPT Constanța parity.
The new crop is indicated at 212 EUR/MT, CPT Constanța, so a level of 8-10 EUR/MT lower than today.
REGIONAL STATUS
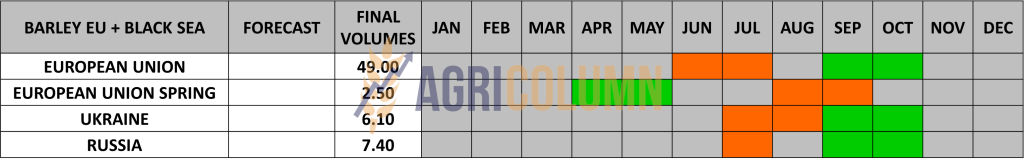
THE EUROPEAN UNION maintains its level of 51.45 million tons of barley production. On the other hand, in the export chapter, it has a level of just over 4 million tons, compared to 5.8 million in the same period of the previous year. In contrast, the import level increased to the value of 1.6 million tons, compared to 0.66 million tons the previous season in the same period. The effect of Ukrainian goods speaks for itself and thus the Union’s import is well over double compared to last year.
TENDERS AND TRANSACTIONS
MIT JORDAN purchased 50,000 tons of barley for June 16-30 delivery at 279.50 USD/MT, CFR AQABA, from CHS. The other bids were 6-22 USD/MT higher.
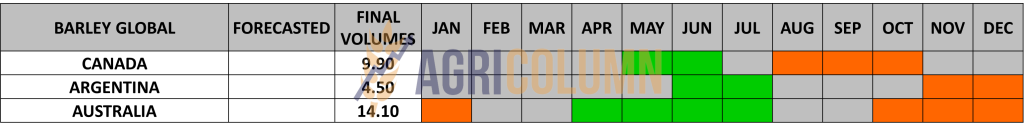
BARLEY PRICE INDICATIONS IN MAIN ORIGINS

GLOBAL STATUS
AUSTRALIA gets a crop boost that takes it from 13.7 to 14.1 million tons.
KAZAKHSTAN receives an upgrade of 0.6 million tons, up to the level of 3.3 million tons.

LOCAL STATUS
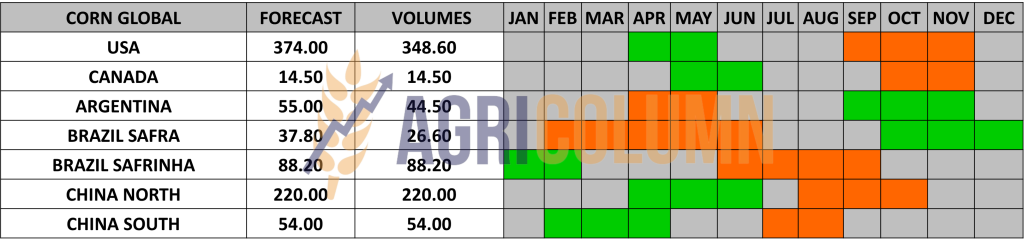
Corn indications in the port of Constanța decrease following the trajectory of other raw materials and we note a level of 245-248 EUR/MT, CPT. The fobbing cost in Constanța Port is 10 EUR/MT. The new corn crop is valued at 230 EUR/MT, in the same parity, CPT Constanța.
CAUSES AND EFFECTS
Our reasoning was accurate and today we see corn at a level of 245 EU/MT. It was logical and normal for this to happen, and this is how 20 EUR/MT evaporates in a period of 2-3 weeks. And from now on, positive things are not on the horizon.
The weather and the Corridor are taken into account and the movement to the new crop is already happening by the start of spring sowing. New crop corn has not entered the price life cycle. But its trend will be 70% determined by the driver called wheat.
REGIONAL STATUS
UKRAINE is out of season, but its exports continue on the flows crossing the European Union.
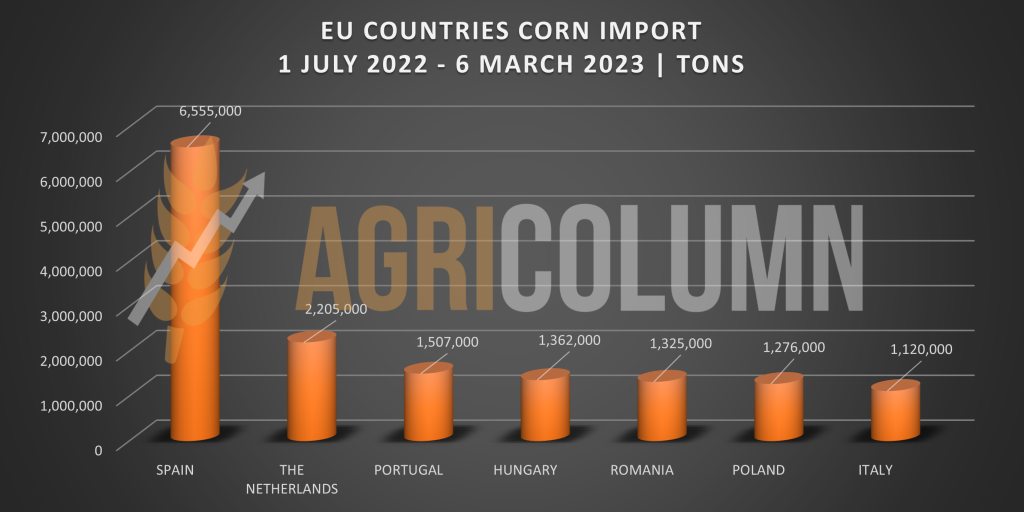
The EUROPEAN UNION imported a level of 18.6 million tons, with an intake of 9.35 million tons originating in Ukraine and 7.65 million from Brazil. Separating by beneficiary countries, we have the following situation, through the graph we insert.
The European Union went through an extremely dry season in 2022 and we all know how the harvest volume dropped dramatically, we might say, from 69 million tons to a maximum of 50.5 million tons.
Ukrainian goods served the interests of the European processing industry like a glove, cheap and abundant. Coceral’s pressure on the European Commission to speed up the passage of Ukrainian goods was not motivated by feeding “poor African countries”, but by the material interest generated by trading and processing.
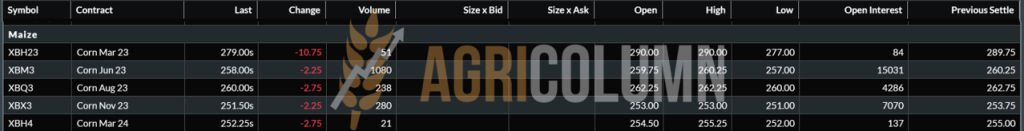
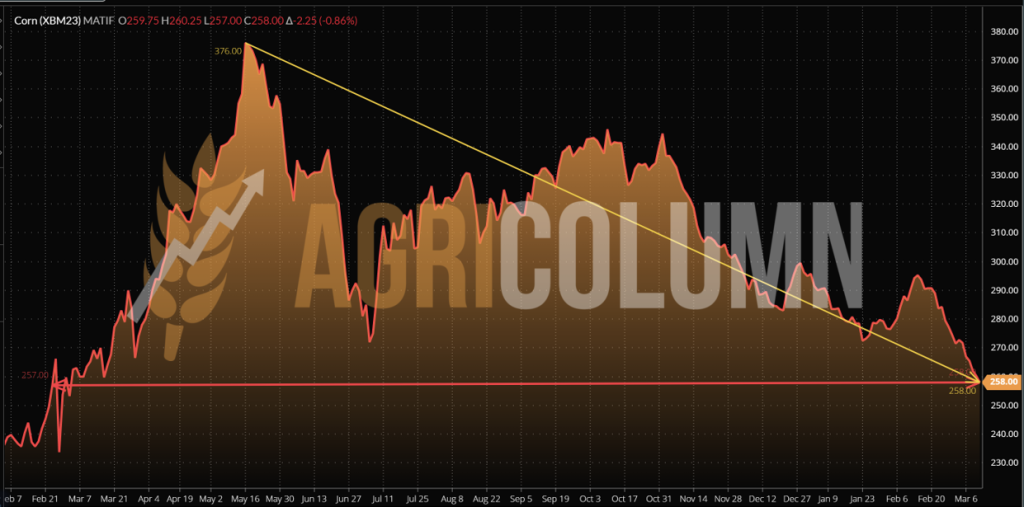
EURONEXT CORN – XBM23 JUN23 – 258 EUR (-13.25 EUR vs last week)
EURONEXT CORN TREND CHART – XBM23 JUN23
Again, “from Zero to Hero and back to Zero”. We are at the moment of February 23, 2022, reflected in the inflection of February 10, 2023. We look back to the peak of 376 EUR from MAY 2022 and there is no less than a 118 EUR difference.
GLOBAL STATUS
ARGENTINA receives shock after shock due to drought and heat. Rosario Grain Exchange forecasts a maximum of 35 million tons of corn, a decrease of 5 million tons from what WASDE released in the March 8, 2023 report (40 million tons vs. 47 million tons, WASDE February). And we started from 52 million tons.
BRAZIL did not budge, remaining at 125 million tons, according to the March 2023 WASDE. And in the Mato Grosso region, the recovery of the Safrinha sowing delay is like a race against time. Brazilian farmers are running at full capacity for seeding and we believe they will be able to finish.
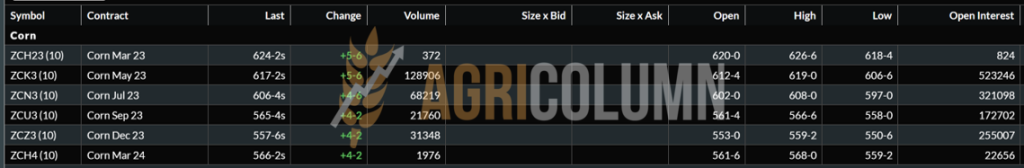
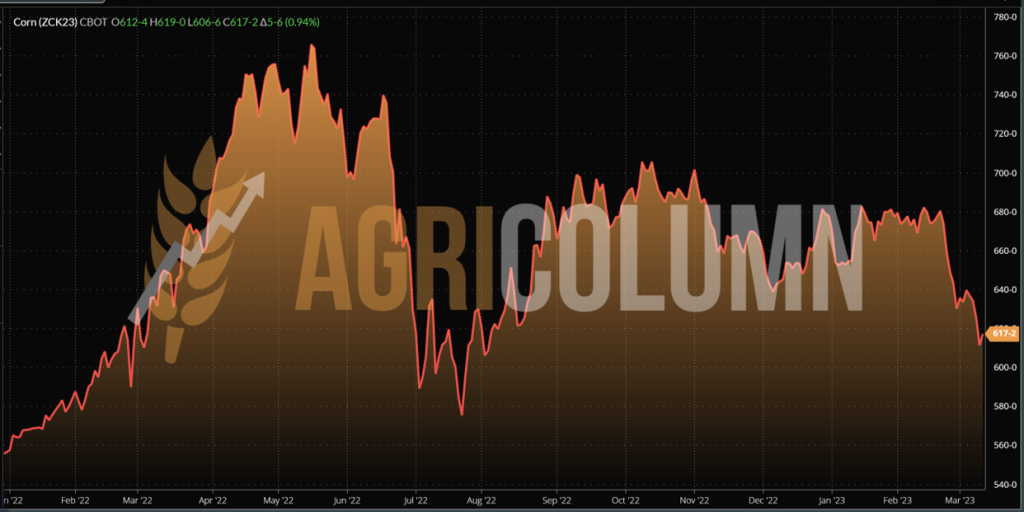
CBOT CORN ZCK23 MAY23 – 617 c/ bu (-22 c/ bu = -8.7 USD/MT from last week)
CBOT CORN TREND CHART – ZCK23 MAY23
CORN PRICE INDICATIONS IN MAIN ORIGINS

CAUSES AND EFFECTS
PROFIT TAKING from the March 2023 liquidation, Euronext and CBOT is clearly affecting corn as well. Inevitably, the correction had to follow, tangentially with that of wheat. Funds liquidated through sell-off and timidly started to enter again. But positive corrections are vague.
It is clearly a canceling effect of causes in the physical market. On the one hand, the Argentinian disaster that is partially compensated by the vigor shown by Brazil and the support given by the USA which does not have brilliant sales volumes (so it can compensate). On the other hand, we have the volumes from Ukraine that provide support to the European Union, at much reduced prices compared to normal, and that, in turn, compensate for the problems in Argentina. And let’s not forget Brazil, which has a lead over the US in terms of corn exports. And Brazil successfully supplies the European Union.
What’s next? A calm period in the corn price market. Calm will be generated by the fact that we have factors that are taken into account, namely:
- The Argentinian disaster is being factored in by CBOT traders and algorithms.
- The wait for the corridor extension will be short. The current period closes on the 18th, but today, as you read the report, a Russian delegation will go to Geneva for a discussion with the UN. Great attention to detail, Turkey no longer appears as a broker! We know why. Because it closed the passage to Russia through the Bosphorus for goods. And here we are talking about semiconductors and chips.
- Corn seeding will begin in the Northern Hemisphere and attention will be shifted to “standby” mode to assess seeding rates and areas related to the Northern Hemisphere (of which we list: USA, European Union, Ukraine and Russia) while observing the Hemisphere southern (double tango: Brazil and Argentina).
- The weather will weigh with its effects or potentiate if it is not generous with precipitation. But La Nina is over, so La Nino has its role from now on. And he is generally generous with those whom La Nina has been unkind to.

LOCAL STATUS
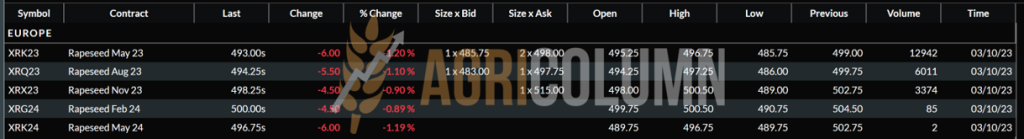
Rapeseed quotations in CPT Constanța parity reached the level of 460 EUR/MT, according to the calculation formula, AUG23 minus 30-35 EUR/MT. The new crop has the same way of calculation in the account of the processing units, namely the level of AUG23 minus 35 EUR/MT.
CAUSES AND EFFECTS
Excerpt from the previous report: “Time is not turning back, and the months of May and June 2022, even less so. But this level of stocks will, in turn, make future sales difficult. Hopes can live a maximum of 1-2 months. Everything depends on what happens in Ukraine. But after we passed the 24th of February and started to enter the month of March, we can say that nothing extraordinary will happen, and the price will not be able to go up.”
Rapeseed jumps right into the abyss. The image is perhaps too harsh, but this way we can assimilate everything that happened in the last week. With a dramatic drop of 44 EUR/MT from the previous week, it is a victim of its own success.
Always what goes up comes down. Always what inflates, deflates. And rapeseed was no exception. The phrase “Nothing lasts forever” has coverage. European crops look favorable, Ukrainian crops as well, and the volumes stored in the hope of a dizzying growth have made Romanian farmers not sell rapeseed.
And for the premium to narrow and see AUG23 minus 10 or minus 5 EUR/MT at this point, there is little hope. The coverage is there until the new crop, the stocks will probably move towards the new crop, so there are no supply problems. One problem exists and, unfortunately, it is also in the farmer’s yard – its logistics and availability. The high costs will, in turn, penalize the price of rapeseed, and the excessive storage of the old crop has already generated in many farms the depreciation of the goods, which cannot be marketed.
And, dear farmers, don’t forget that what hurts today may be a lesson well learned tomorrow.
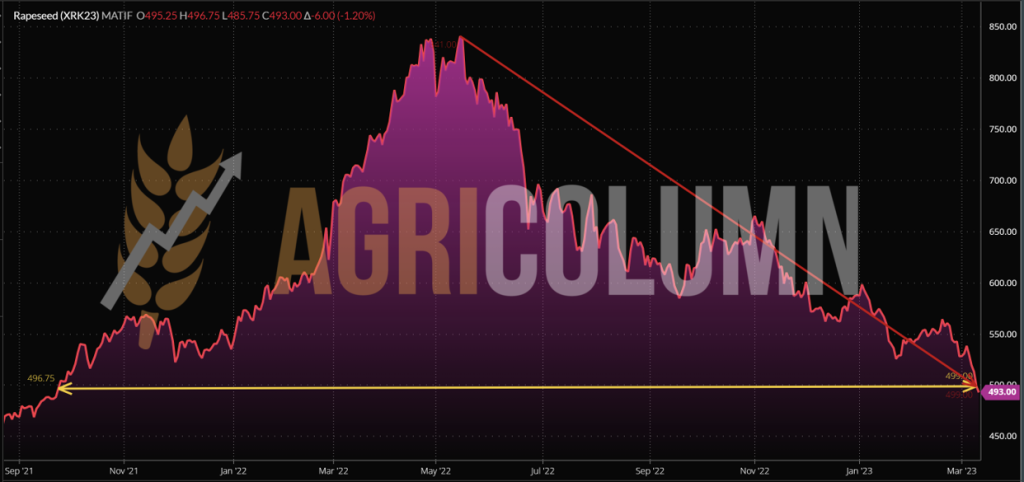
From the peak of 841 EUR, in MAY22, today we have a mind-blowing drop of 348 EUR. 70% of the value of rapeseed related to the month of MAY22 is gone. As always, the highest price is known after it has passed, unless you believe the correct information generated by our report. And the last week, with the decrease of 45 EUR, reinforced what we said in the last report. Nothing will change the trajectory of the rapeseed price.
EURONEXT RAPID – XRK23 MAY23 – 493 EUR (-45 EUR vs last week)
EURONEXT RAPID TREND CHART – XRK23 MAY23
Likewise: From Zero to Hero and back to Zero. We are back to the September 22, 2021 level, down from the May peak of 348 EUR. Absolutely unbelievable.
REGIONAL STATUS
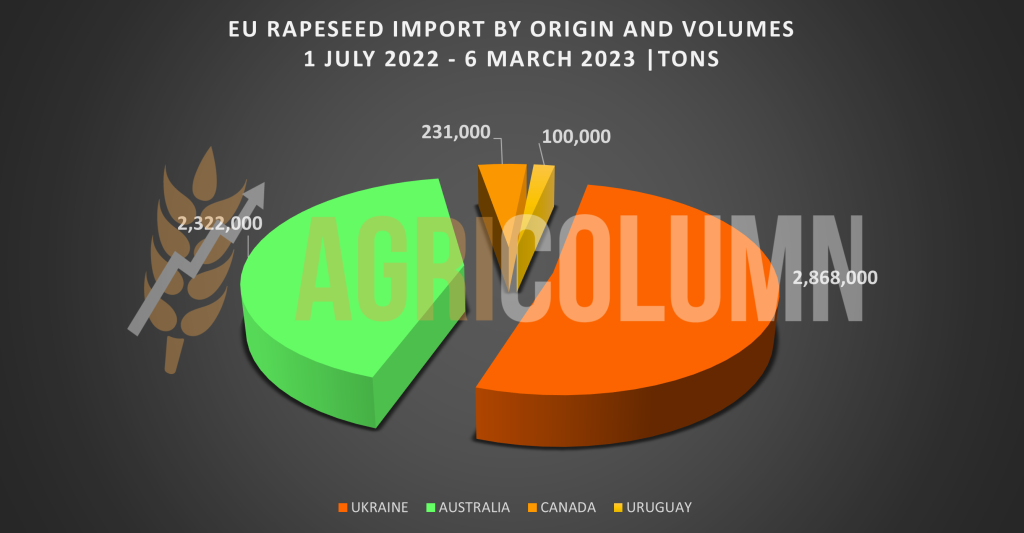
EUROPEAN UNION and rapeseed imports. Our chart will speak better than anything.
GLOBAL STATUS
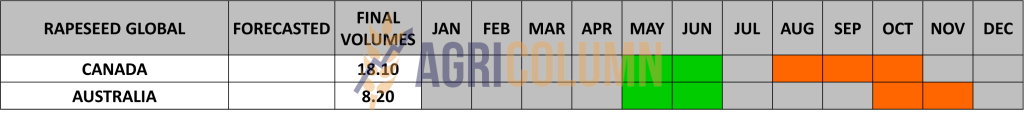
AUSTRALIA gets a 1 mil. ton crop upgrade, from 7.2 to 8.2 mil. tons. At the same time, however, the return of El Nino will restore Australia’s production next season to 5.7 million tons.
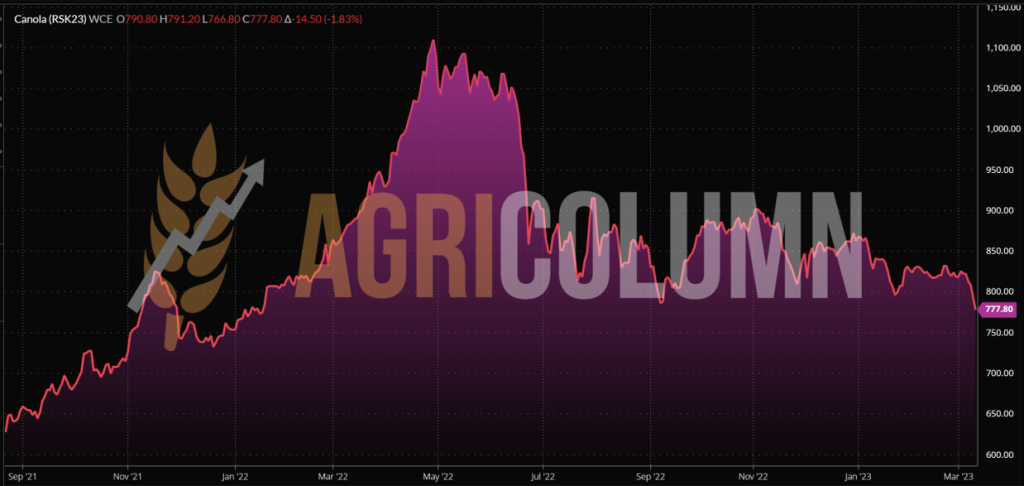
ICE CANOLA RSK23 MAY23 –777.8 CAD (-44 CAD vs last week)
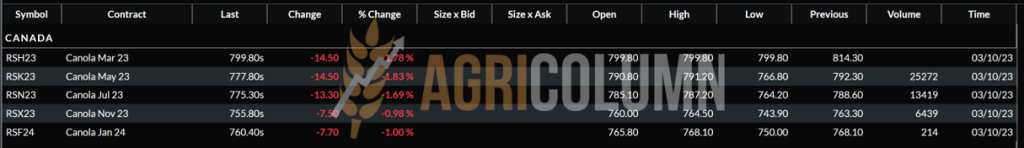
CANOLA ICE TREND CHART – RSK23 MAY23
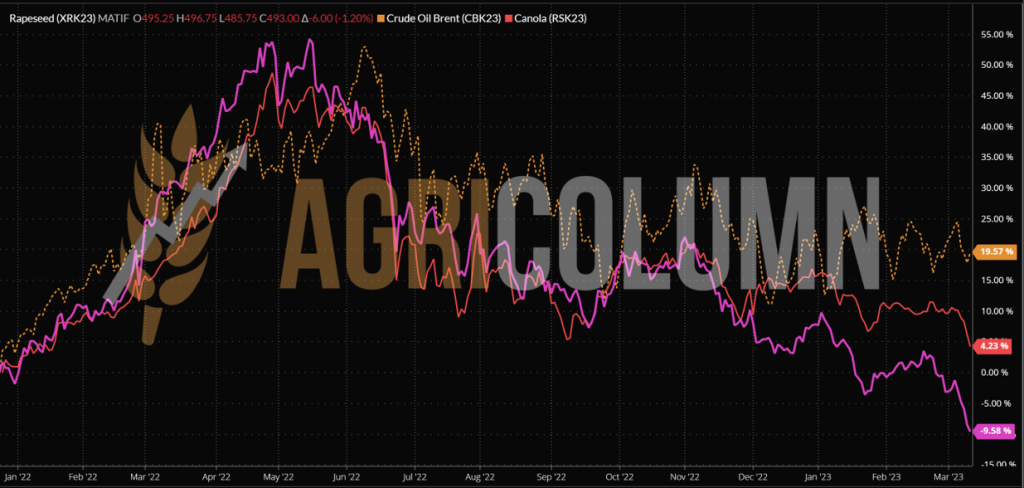
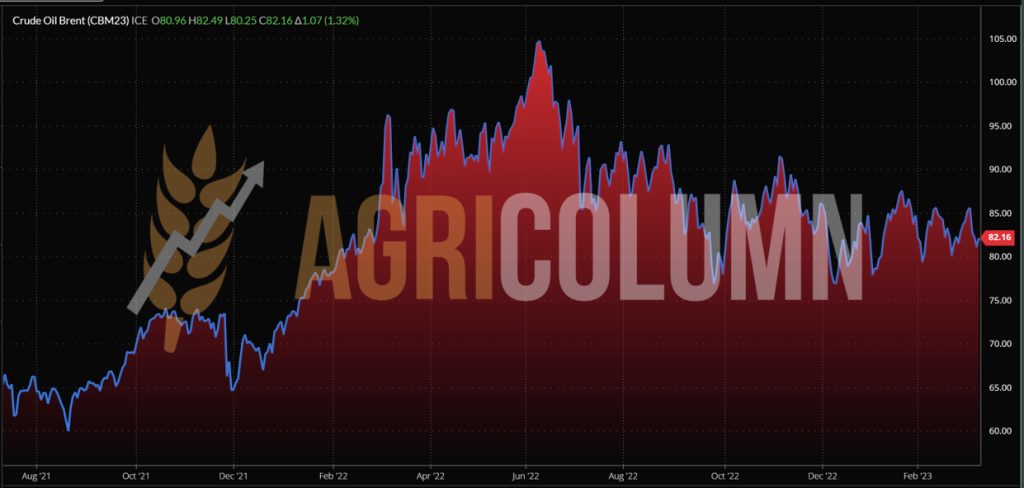
COMPARATIVE GRAPH. PETROL-RAPESEED-CANOLA CORRELATION
The fall without noise of rapeseed.
CAUSES AND EFFECTS
EXTRACT FROM THE PREVIOUS ISSUE: “The abundance of raw material, the imports from Australia that have passed 2 million tons to the European Union, the future crop forecast of 19.6 million tons lead to the unique conclusion that rapeseed cannot generate future spikes. Russia will go into seeding in April, identical to Australia and Canada. India will produce below the level of last season, but enough. Australia will no longer generate 7.2 million tons as La Nina ends and goes into ENSO, so we’re looking at close to the multi-year average of 5.7 million tons in that area.”
And we got here. I wrote about this moment; I predicted the decline of rapeseed. What’s next now?
Australia will export massively to the European Union to the level of 3.3-3.5 million tons this season. European Union processing is covered. Ukraine exports rapeseed at the same rate.
Crops look good in the European Union; the situation also looks good in Ukraine and Russia.
Will we see rapeseed at the level of 470 EUR in the Euronext indication? Certainly, there is a high chance that this will happen. The golden age of rapeseed is over. The existing cover is sufficient, and the local stocks penalize it drastically in the perspective of the new crop.
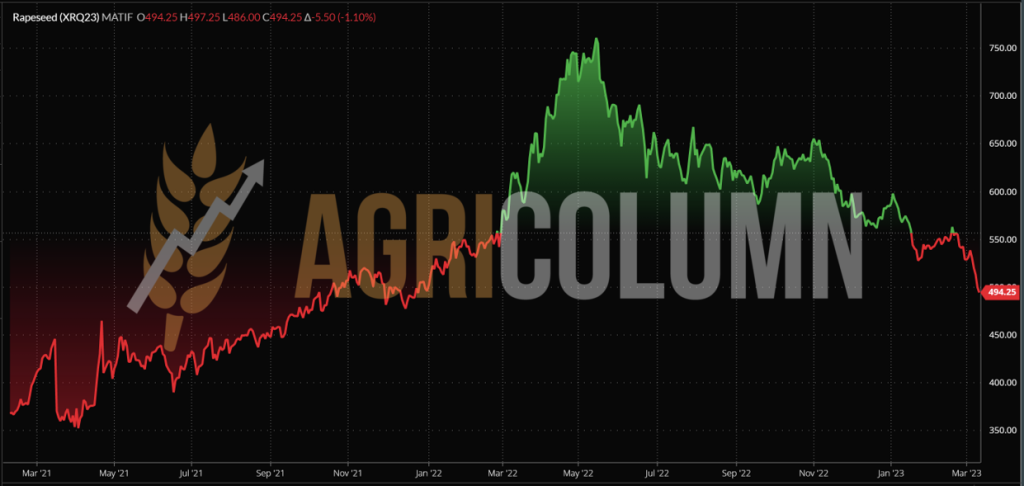
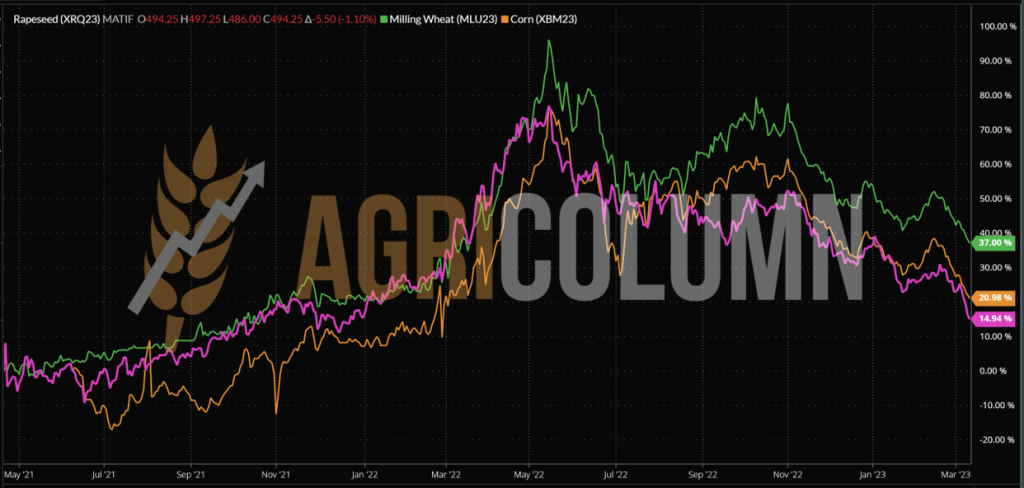
Please just look at this chart and the answer regarding rapeseed will come by itself. We measure MAR21 with MAR23!
Before moving on to sunflower seeds, please view the composition of the associated trend: wheat (green), corn (orange), rapeseed (magenta). And I think anyone can see with a clear mind all that was and all that will be.

LOCAL STATUS
Constanța port quotes sunflower seeds at values between 480-490 USD/MT. The effect of the other raw materials also arrived without delay on the sunflower seeds.
CAUSES AND EFFECTS
Nothing changed locally. The same reluctance to sell the seeds. Unfortunately, the peak of 580-585 USD/MT has passed, and we have also crossed the barrier of March 10-13. This barrier was the maximum waiting time for demand to increase. But unsold oil stocks from Ukraine and the transfer of raw material through Romania did not cause this. Farmers have to sell the goods. The price of oil is low, and the coverage is there. We are only 3 months away from processing until the annual reviews. And we dare to see new crop sunflower seeds at 450-470 USD/MT.
REGIONAL STATUS
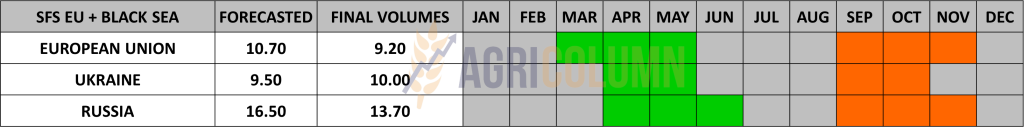
UKRAINE. We identify a persistent lack of buying interest in sunflower oil from the Black Sea region, which has led to low activity.
Sunflower oil spot volumes were offered at 1,140 USD/MT CIF Mersin, while buyers’ bids were heard at 1,100 USD/MT CIF Mersin. Buyer interest in ports stood at 950 USD/MT, CPT Pivdennyi, while the number of offers remained low.
Sunflower oil exports are low, terminals are flooded in Ukraine. Sunflower processor prices eased to 389-415 USD/MT, down 25-38 USD/MT from the previous week, amid slower farmer sales.
GLOBAL STATUS
INDIA imposes a 5.5% import duty on sunflower oil, which puts a final nail in Ukrainian crude oil exports from Pivny-Odessa-Chornomorsk to this destination. By doing this, India suggests that it wants to buy only raw materials, but this wish is far from being fulfilled.

PRICE INDICATIONS FOR OILSEEDS AND CSFO IN MAIN ORIGINS

CAUSES AND EFFECTS
EXCERPT FROM PREVIOUS REPORT: “Right now, amid the decline in the price of soybean oil in the complex, nothing can help sunflower seeds. I admit that technically the expected level of 575-580 USD/MT was reached some time ago and there is no longer any fundamental in the physical market on which a potential price increase depends.”
Indeed, prices are no longer supported. The collapse of all commodity prices generated by the MAR23 stock market liquidations subsequently caused seed prices to fall as well. According to WASDE, the level of sunflower seed production globally is down by 0.48 million tons. Argentina is quoted with a minus of 0.3-0.4 million tons, the rest are production relocations.
Processing remains flat at 48.97 million tons. Ending stocks fall as production declines from 4.85 to 4.37 million tons.
Sunflower oil production remains stable at 20.58 million tons. Everything seems to be in balance right now: productions, processing, oil production, raw material stocks, crude oil stocks, exports and consumption.
Sunflower seed stocks are currently unusually high in the European Union (especially in Bulgaria and Romania) and this will keep processing in the EU at a very high level throughout this season.
In the remaining time, not much can happen. A possible closure of the corridor would cause a much greater influx of raw material on the established channels and, implicitly, a much lower price, against the background of the much more generous offer.

LOCAL STATUS
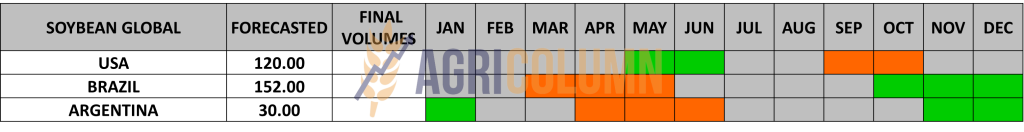
In Romania, the price indications for soybeans are at the level of 530 USD/MT, DAP processing units for non-GMO soybeans.
REGIONAL STATUS
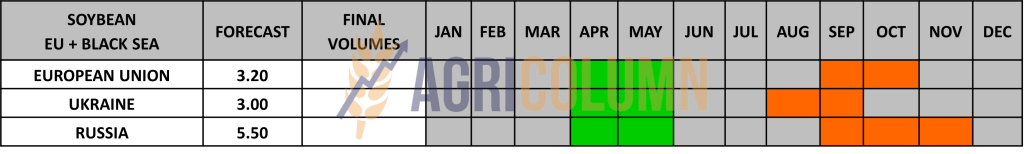
The EUROPEAN UNION has reached a level of more than 7 million tons of imported soybeans. The origin of imports is led by the USA with a level of 3.56 million tons, followed by Brazil with 1.92 million tons. The table is completed by Ukraine with 0.77 million tons, Canada with 0.6 million tons and Uruguay with 0.12 million tons. The European soybean production forecast is up 28% year-on-year to 3.2 million tons.
GLOBAL STATUS
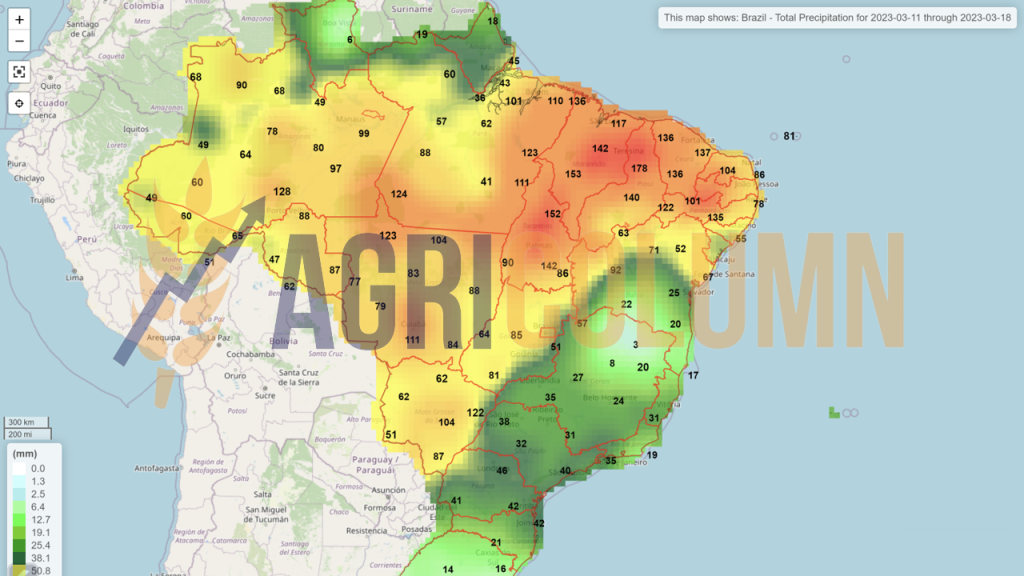
BRAZIL: The crop will be a record, even with some yield problems in the south.
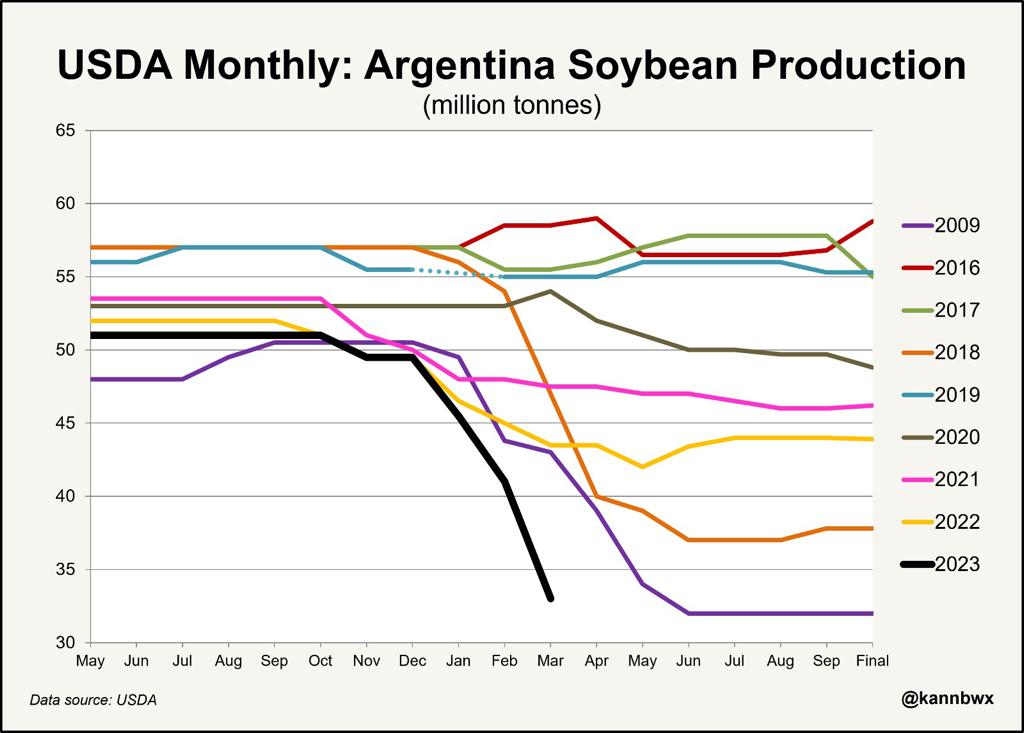
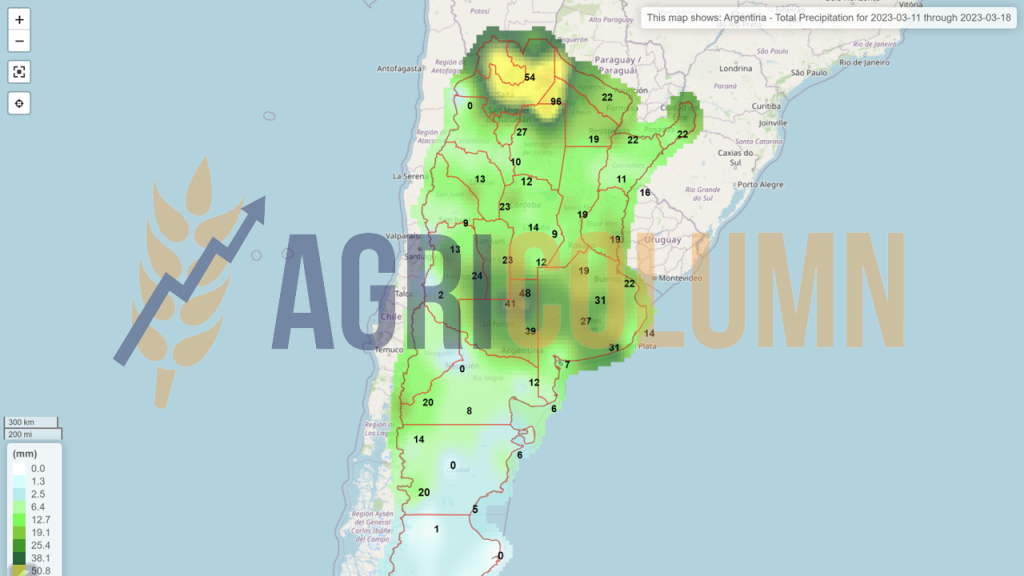
ARGENTINA: Volumes are low, but traders and analysts are reporting them as even lower than they actually are, having an interest in trading those markets and obviously influencing the price. It looks like the crop will be in the 30-million-ton range or higher, and that will require record soybean imports from Paraguay, Uruguay and Brazil to drive processing. Rosario Grain Exchange indicates 27 million tons of soy production in Argentina compared to 33 million estimated by WASDE.
Soybean production in Argentina is currently similar to the situation in 2009. Source: USDA via Karen Braun @kannbwx.
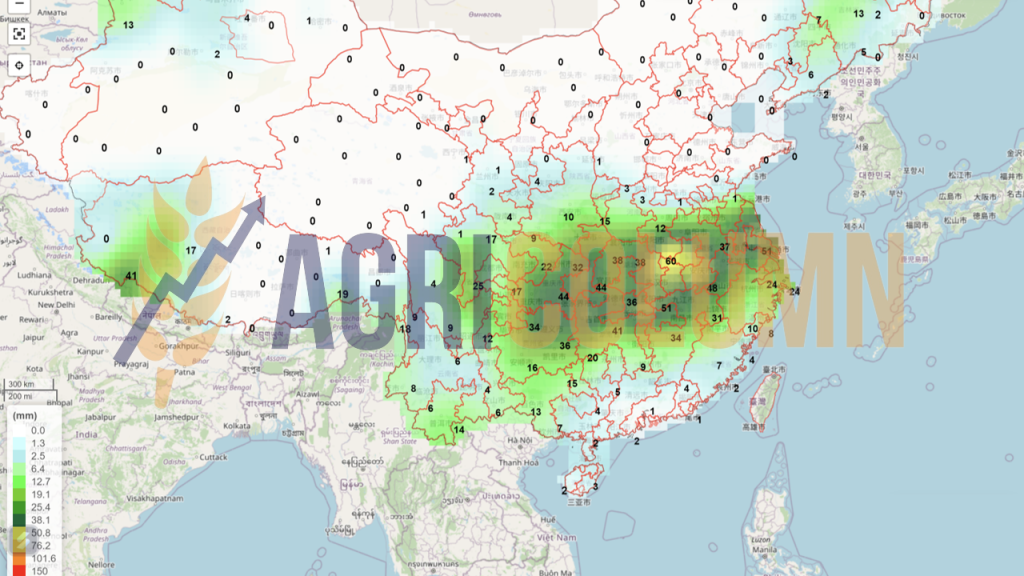
CHINA: China’s January/February soybean import volume was near a record with all the demand issues being talked about there and this puts them on pace to hit the current USDA estimate of 96m tons.
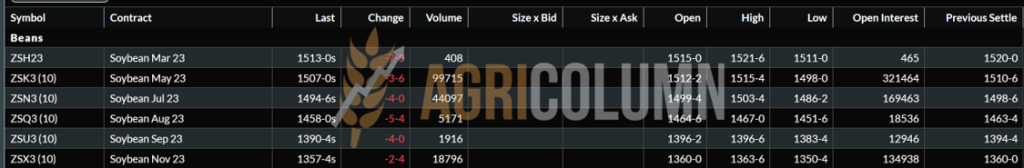
CBOT SOY ZSK23 MAY23 – 1,507 c/ bu (-11 c/ bu compared to last week)
SOY GRAPH TREND – ZSK23 MAY23
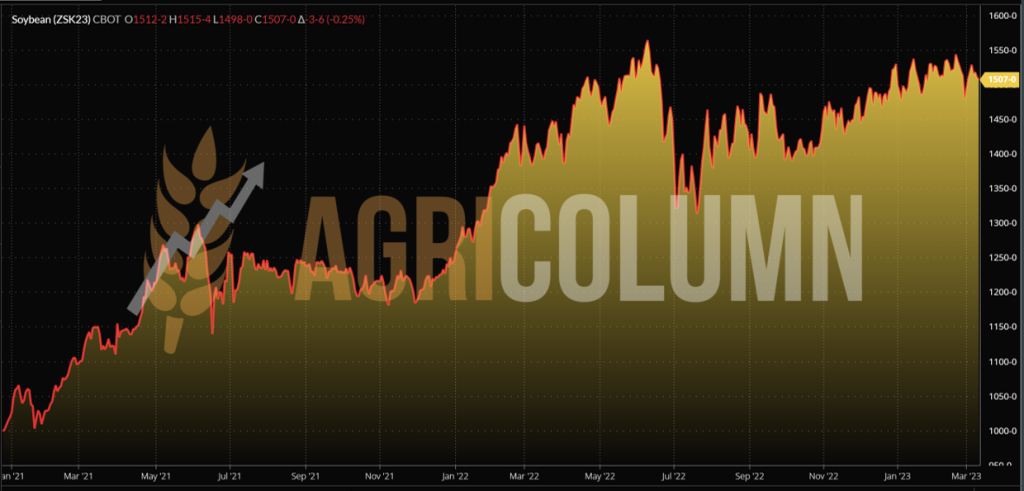
Soybeans are the only ones that didn’t suffer extremely in the March 2023 liquidation. It’s simple. The global production level is about 300 million tons, China buys about 33%, and thus, Argentina’s deficit of about 18-20 million tons cannot be covered by any other source. 20 million tons means 6.7% of global production. The difference between the two reporting weeks is negative, indeed, but only by 11 c/ bu, or 4 USD/MT.

THE PORT IS BUSY
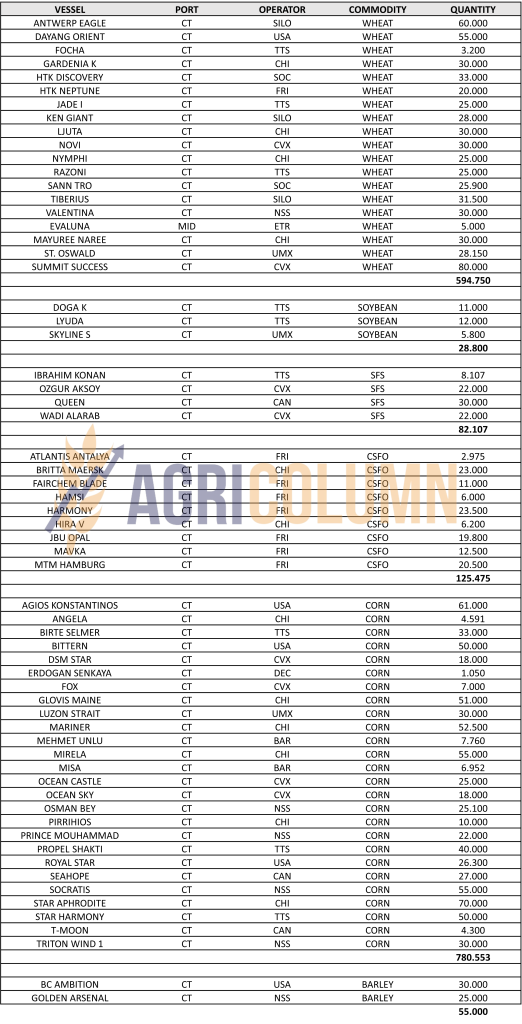


11-19 March 2023
Romania (rain)
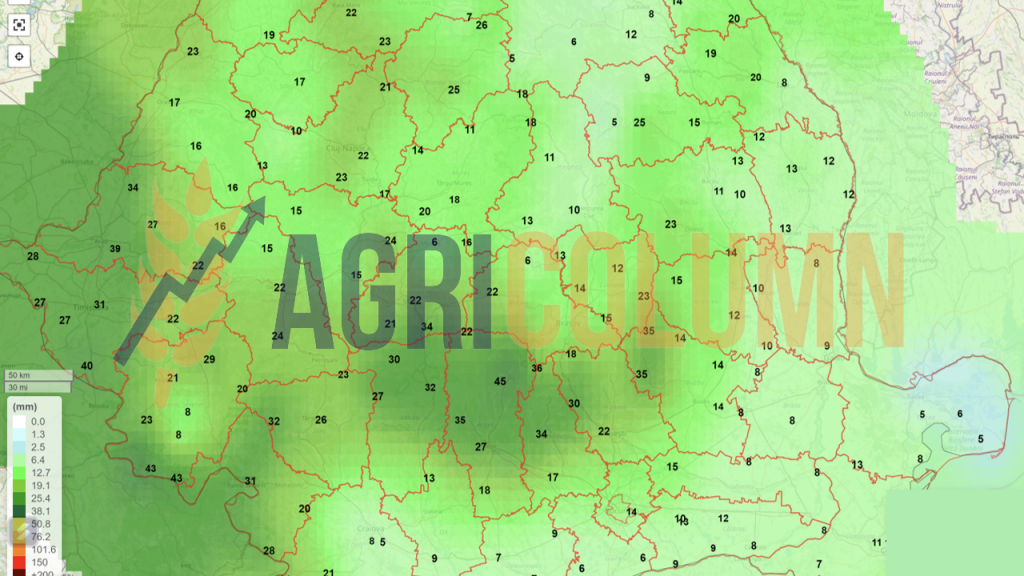
Romania (snow)
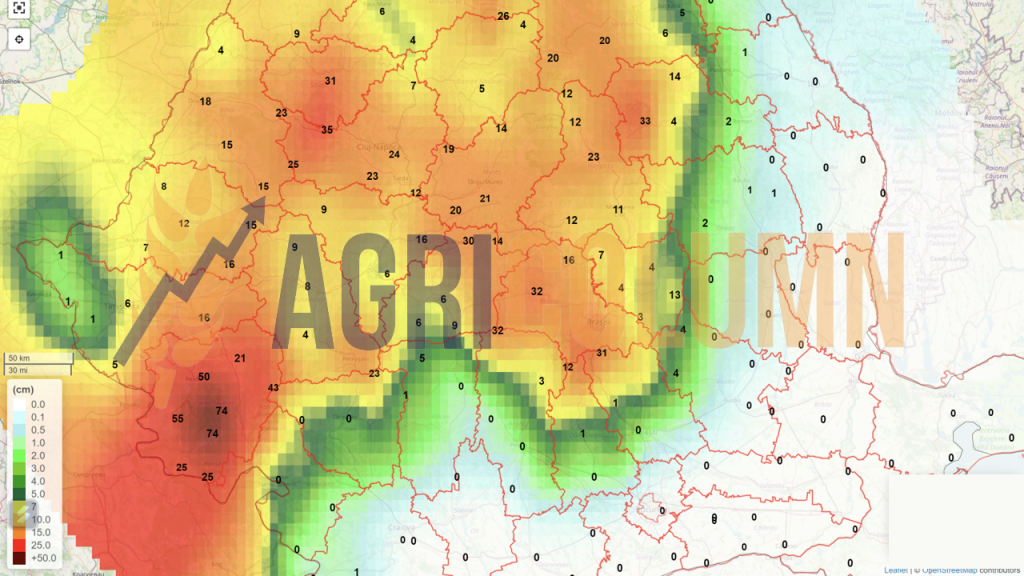
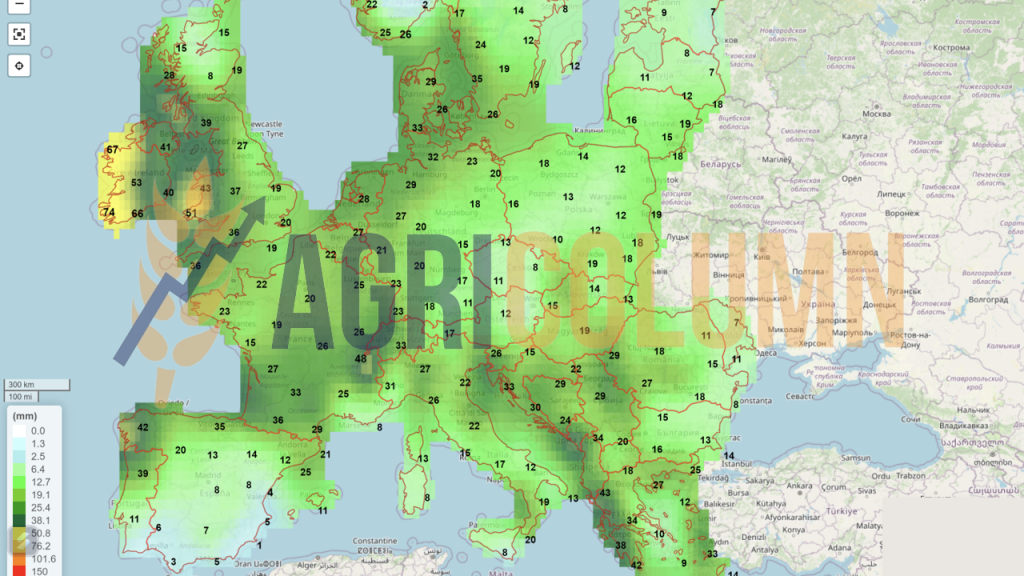
Europe (rain)
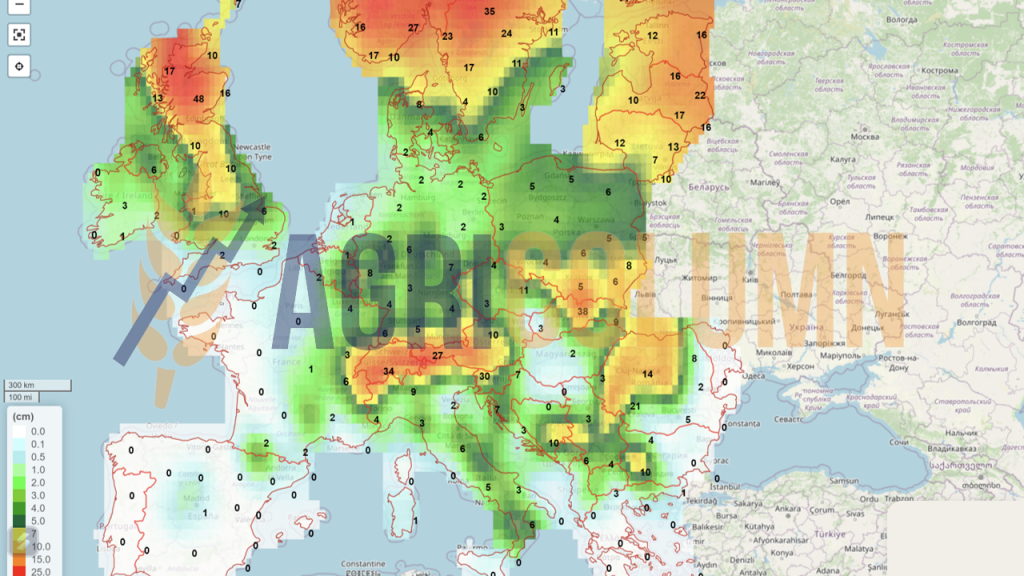
Europe (snow)
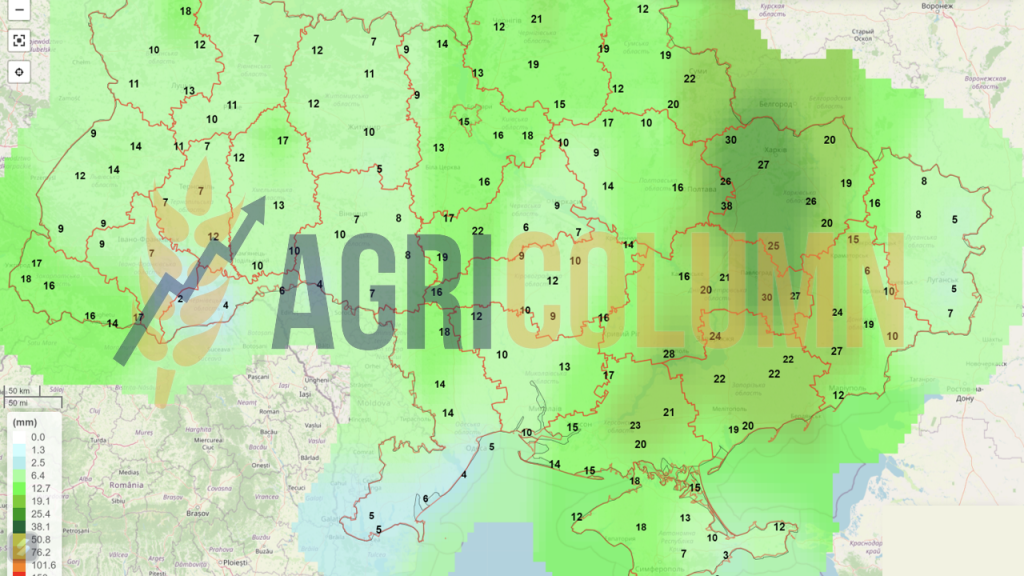
Ukraine (rain)
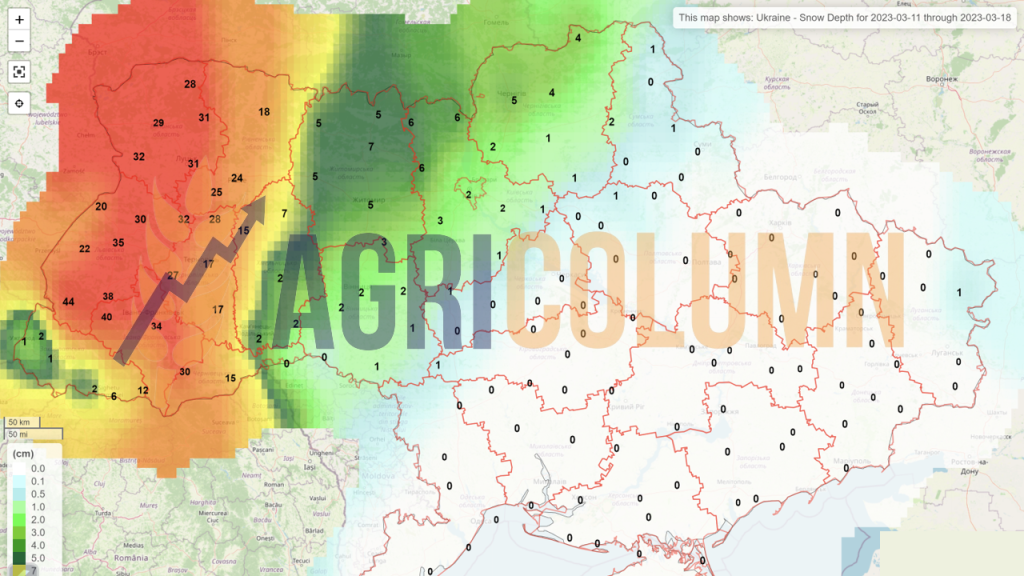
Ukraine (snow)
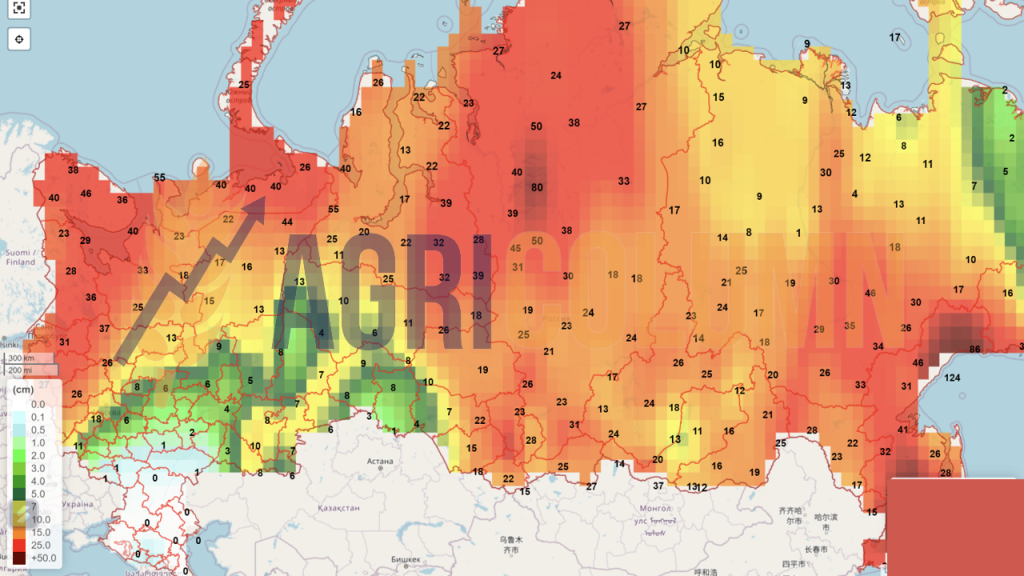
Russia (snow)
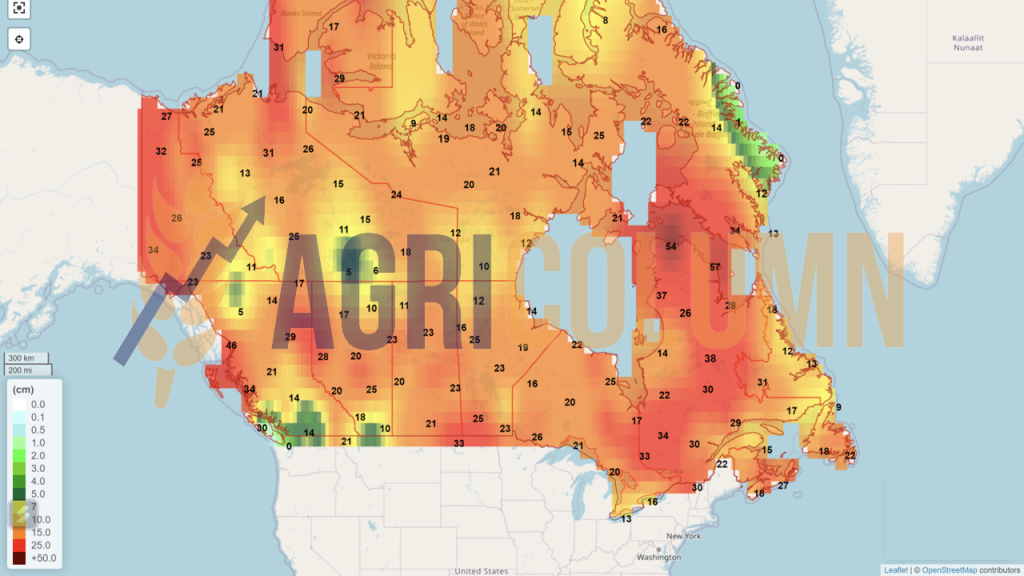
Canada (snow)
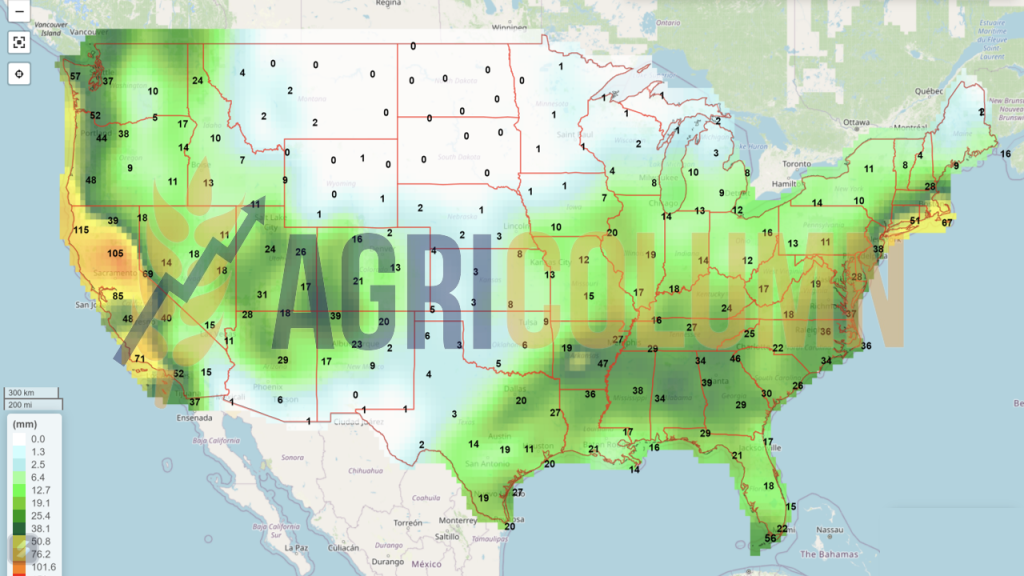
USA (rain)
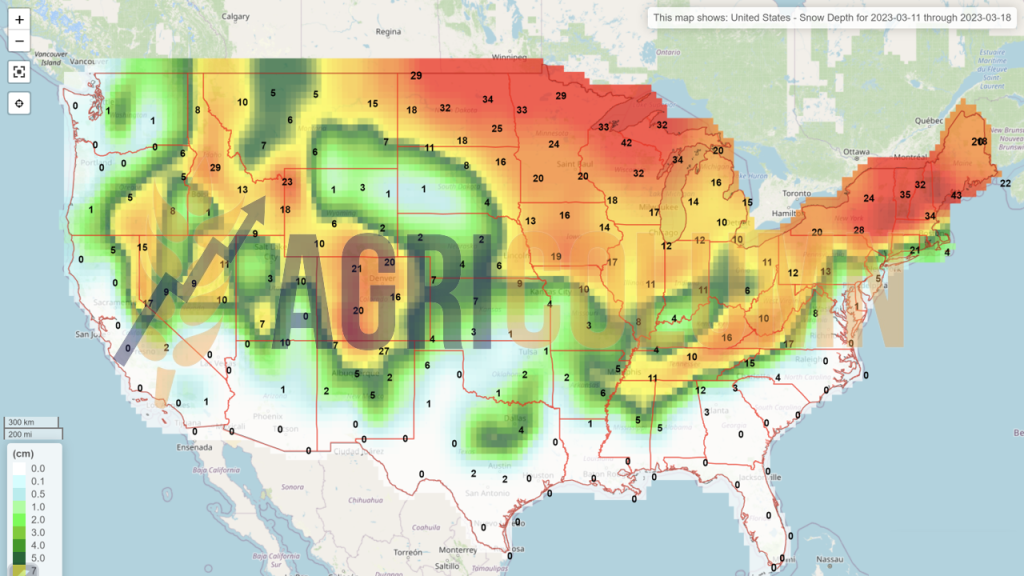
USA (snow)
Brazil
Argentina
China (rain)
Australia