This week’s market report provides information on:

LOCALLY
Locally, the price of wheat remained for a period of time around the level of 362 EUR/MT in the CPT Constanța parity, with a discount of 12 EUR/MT for the quality of feed (350 EUR/MT). Certainly, maintaining the state of war in the neighborhood has generated these levels, because the world has panicked. The flows in the basin have stopped and we are referring to the Ukrainian and Russian ones.
But as time went on, destinations made assessments of stocks as well as purchasing power, and timid attempts at a potential ceasefire agreement took a turn for the worse. First, the sellers who generated volumes in the market caused the exporters to lower the level. It is logical to lower the price level when you are assaulted by the goods because it comes naturally, so profit rates can be increased, by default.
And so we close the week at the level of 346 EUR/MT, with an impressive discount in the case of feed wheat, of 25 EUR/MT (331 EUR/MT). This indicator clearly generates the fact that the feed wheat can be calculated as comingle cargo. What does this thing mean? The discount of 25 euros generates, in fact, profit, for the simple fact that it can be mixed in the mass of milling product, thus increasing the volume of goods that will be sold expensively. Through this process called in the COGS finance department, i.e., cost of goods, higher quality goods are placed in the same basket with less qualitative goods, increasing the total purchase price in the mix.
The new crop has an indication that does not correlate at all with EURONEXT indications. What is indicative at the moment is the level of 290 EUR/MT, i.e., a discount of minus 33 EUR/MT compared to SEP22. The assumption of exporters is to calm the market and lower the level, but at the same time with a hedging operation if there are volumes purchased at this level. The price of feed wheat has a discount of 10 EUR, i.e., a new crop price level of 280 EUR/MT.
As a general rule, the crop inverse is currently set at -55 EUR/MT (the value of the new crop compared to the old crop). It is a very big upside, but as time goes on, it will fall out of the old crop. Let’s not forget that in 100 days from now we will start harvesting.
And one more thing to keep in mind. Farmers are entering the spring campaign and are no longer so interested in the commodity trade. Moreover, there will be a period between the Catholic and Orthodox Easter holidays in which business will not be conducted. Subsequently, May, traditionally, is one of waiting and reflection until the first combines arrive in the fields.
REGIONALLY
Ukraine is literally blocked. Farmers’ despair is visible. They cannot sell their goods and, moreover, they cannot actually enter the field for spring works. Fuel is directed at the war effort and its lack is acutely felt. Attempts to generate volumes are hampered by logistics.
The main problem is the one generated by the potential railway transport given by the width difference between rail lines compared to the European infrastructure, which makes it necessary to transboard the goods from the Ukrainian wagons to the Romanian ones at the border point in Dornești. But even so, it is about the tonnage of Ukrainian wagons of 70 tons compared to the European ones of maximum 50 tons. It’s really a logistical nightmare.
We insert a photo of a Ukrainian wagon from Dornești courtesy of a reader:
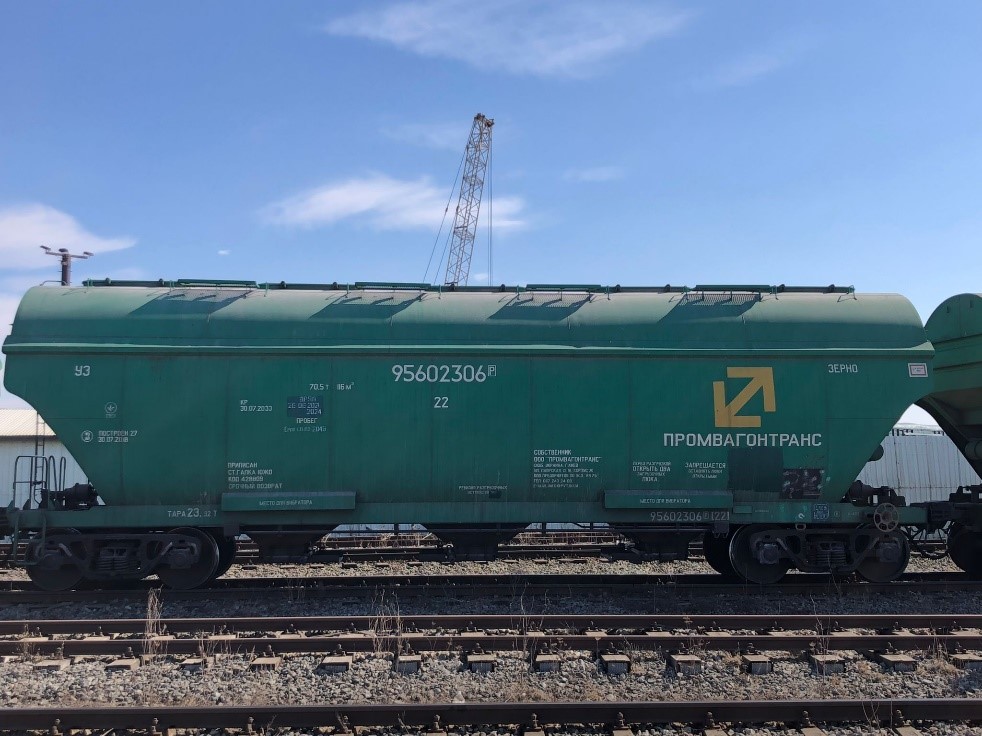
The Ukrainian farmers we came in contact with the previous week told us that the price didn’t matter, only that they could sell, because they desperately wanted to buy weapons to defend their land, otherwise next year they would have nothing to harvest.
It’s shocking, but that’s the reality. One of the largest farms in Ukraine reported that farm managers had been killed by the Russian army in the Sumy region in northern Ukraine and in the Kiev region. This is the UkrLand Farming.
Russia continues to deliver wheat through Russian ports to its destinations, crossing the Kerch Strait with small ships of 25,000 tons, but also with larger ships. In this context, we note the detention of 300 merchant ships by the Russian navy off the coast of Ukraine. Those ships had arrived to load or were loading when they were caught in the Russian assault. They are guarded by the Russian Navy and domestic consumption (maintenance) is carried out by each ship with its own resources.
We also note some events that led to escalating tensions, namely the sinking of a commercial transport ship and the damage of two others in the exclusion zone created by Russia. Our estimates are that Russia cannot afford to detain or cause damage to all 300 ships as a lever in future negotiations for the simple reason that, if this happens, no Russian ships will be received in any port in the free world anymore.
We remind you in passing of Romania, which delivers goods. The port of Constanța is very crowded during this period. The redirection from Ukraine makes the volumes very high. Also, the corridors that are trying to be created are intended for Ukrainian goods, on the one hand to extract the goods already contracted at much lower prices than before the conflict and thus to mark a higher level of profit. On the other hand, there is a permanent feeling that Romanian exports will also stop at some point due to the sustained pace of exports.
Bulgaria, Hungary and Serbia are under this ban, and we also note the possibility for Bulgaria to impose force majeure on previously concluded contracts, so that sellers are relieved of commercial liability. This opinion belongs to the Minister of Economy, Ninova, and we believe that it is an exaggerated measure, without a real economic and commercial basis.
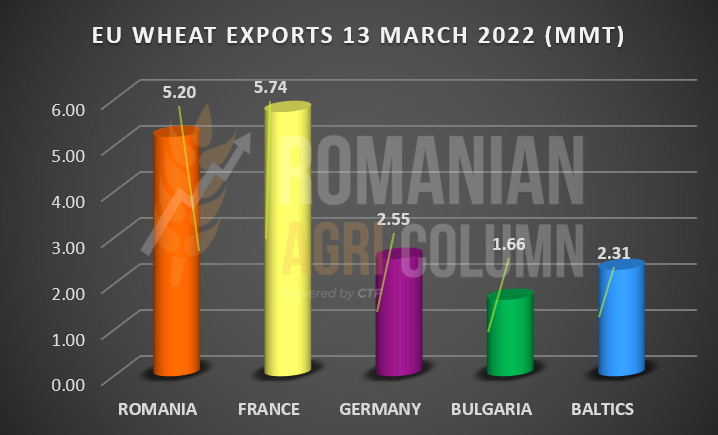
France continues to export at a higher level than originally estimated, and we are also looking at Germany and the Baltic countries. According to the latest export calculations, we have the following situation in figures at this time, subject to quantities shipped in the last week and not yet registered. In total, the European Union’s exports amount to 19.1 million tons.
In a preview of the new crop, we see improvements in the European Union. Germany is estimated to grow by 5.8% year-on-year to 22.6 million tons. Romania has benefited from rainfall and we see the crop level rising from 8.4 to 8.8 million tons at this time.
In terms of the stock market, we see how the slightest improvement in the talks between Ukraine and Russia is immediately integrated by the market as a possible progress and a step towards a solution, despite the military operations still in progress. At the end of the day, the European wheat market declined sharply, in a context in which the amplitude of the daily variation remains important for several weeks.
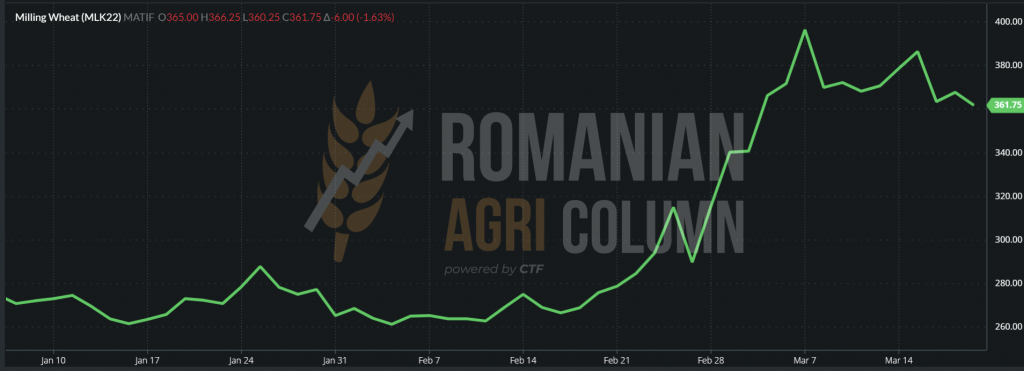
EURONEXT WHEAT – MLK22 MAY22 – 361.75 EUR (-6 EUR) at the end of March 18, 2022
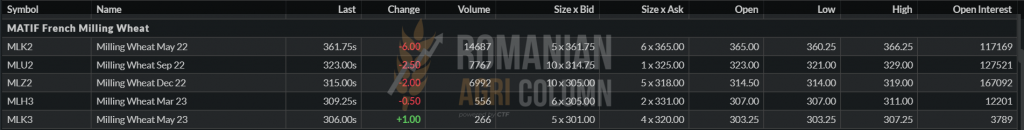
After reaching a resistance zone the day before, the May 2022 closure of Euronext is now testing a support zone at the level of 360 EUR.
EURONEXT TREND GRAPHIC – MLK22 MAY22
TENDERS
TMO Turkey has purchased 430,000 tons of wheat in batches of 5,000-25,000 tons, due to the large number of ports it owns, as well as their small operating size. The purchase prices, in which the main component was the logistics, were in a range that started from 410 USD/MT and reached the level of 449.8 USD/MT. About 100,000 tons that exceeded the level of 450 USD/MT were rejected from the tender.
GLOBALLY
In a brief review of some figures from the last issue, we notice that the European Union has raised concerns about the potential for reduced supply and demand, and more and more voices within the EU indicate a world hunger that will set in.
We have mentioned this since the last issue, and a year or so ago we mentioned the potential for globalized hunger. The words are very harsh and create a sense of insecurity, but our readers must understand that this phenomenon will be applicable in the very poor regions of the world – Southeast Asia, the Middle East, Sub-Saharan Africa and North Africa.
If you actually reduce the numbers that make up the 200 million tons of global wheat trade and indicate an increase in demand from at least 2 major sources, the puzzle will begin to take shape. As a simple recap, global trade will suffer, as about half of a potential aggregate of 62 million tons will disappear (Ukraine and Russia). Then China suffered a major deterioration in the wheat crop and will generate an additional demand of at least 27 million tons. To all this we add the growing demand of about 30-35% of the Middle East, North Africa and Sub-Saharan Africa estimated at 17 million tons. In other words, about 31 million tons are lost from the commercial potential, and the demand increases by 44 million tons. This is what the global shortage looks like today and that is why the estimate of world hunger is correct in 2022-2023. A decrease of 31 million tons in the volume of 200 million commercial tons and an increase in demand by 44 million tons is the image that should be studied in the next period. Of course, solutions can be found so that the global wheat supply does not become a food battle and the world’s population resists.
One of the solutions is totally unpopular and contrary to market and trade rules, such as quota allocation and price freezing. But we do not believe that it is viable because of the global actors that make it up and who do not want a regiment in such a complex.

FAO index
The FAO Food Price Index (FFPI) averaged 140.7 points in February 2022, up 5.3 points (3.9%) from January and up 24.1 points (20.7%) above the level of a year ago. This is a new historical record, surpassing the previous peak of 3.1 points in February 2011. Cereal and meat prices also rose, while the sugar price sub-index fell for the third month in a row.
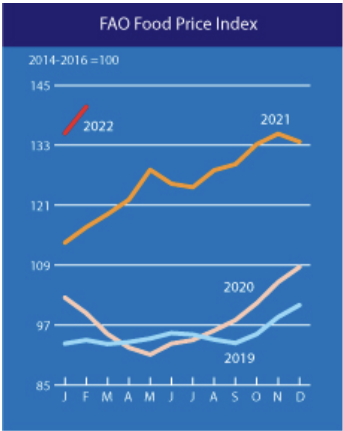
The FAO cereal price index averaged 144.8 points in February, up 4.2 points (3%) from January and 18.7 points (14.8%) from a year ago. In February, the prices of all major cereals rose from those values the previous month. World wheat prices rose 2.1%, largely reflecting new uncertainties over global supply amid disruptions in the Black Sea region, which could hamper exports from Ukraine and the Russian Federation, two major wheat exporters. Export prices also increased by 4.7%. World maize prices rose 5.1% from last month, supported by a combination of continuing concerns about the state of crops in Argentina and Brazil, rising wheat prices and uncertainty over exports of corn from Ukraine, a major exporter.
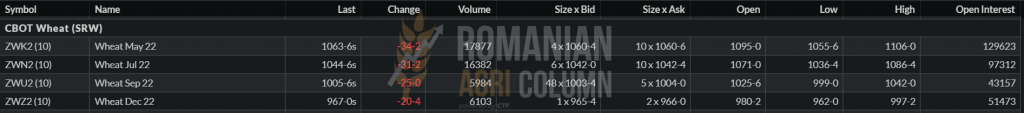
CBOT has been in line with the trend set by the events in the Black Sea basin. The reaction through the main players, the investment funds, was one in agreement with EURONEXT. News of the potential of a Ukrainian deal with Russia has led to declining prices, with funds making exits through trading algorithms in just a few days.
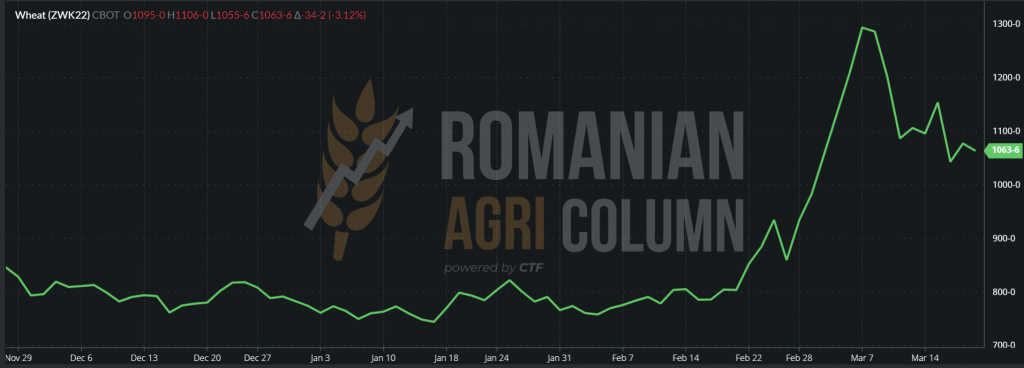
CBOT WHEAT – ZWK22 MAY22 – 1,034 c/bu (-34 c/bu) | We notice the American crop inverse of only 21 USD/MT (comparison ZWK22 vs ZWU22 SEP22)
CBOT – ZWK22 WHEAT TREND GRAPHIC
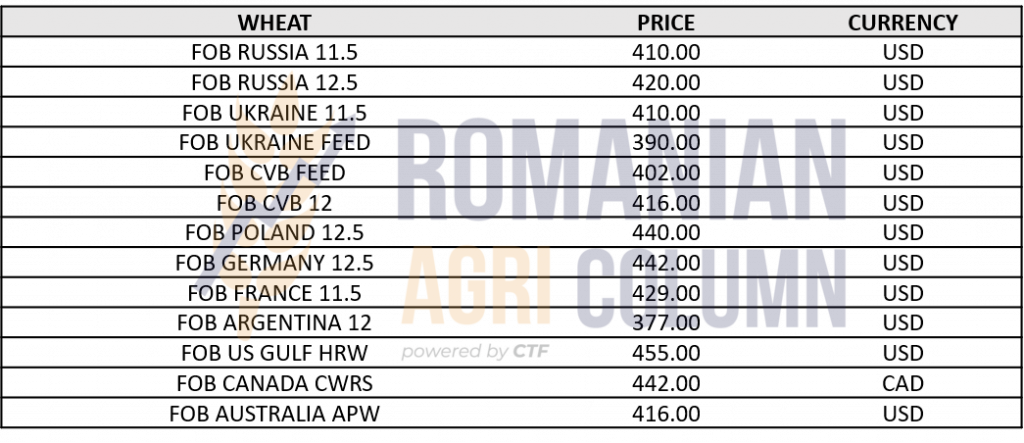
WHEAT PRICE INDICATIONS IN VARIOUS ORIGINS
ANALYSIS
- Information leading to a written agreement and agreement between Russia and Ukraine lowers emotions, which subsequently lowers the price of wheat as an indication in the physical and stock market.
- Destinations are looking for solutions to preserve their own reserves and are looking at the new crop. A cessation of hostilities in the basin would greatly calm things down and leave time for demand, especially for the new crop.
- According to our calculations, with China having major wheat problems (minus 27 million tons), with additional demand from the world’s poorest areas (+17 million tons), a deficit may set in in underdeveloped areas, with or without conflict. This is called hunger.
- The surplus volume in the unshipped Black Sea basin cannot compensate for the deficit, as Ukraine and Russia will also have production deficits in the new crop.
- In the same context, Russia also collects a 35% payment note in the UK for cereals and oilseeds.

Nothing remarkable, apart from a price level set around 285 EUR/MT in the CPT Constanța parity. The indicative volume level of the Romanian crop remains stable, according to the latest COCERAL report. The European Union shows the same force for future volumes of barley.

LOCALLY
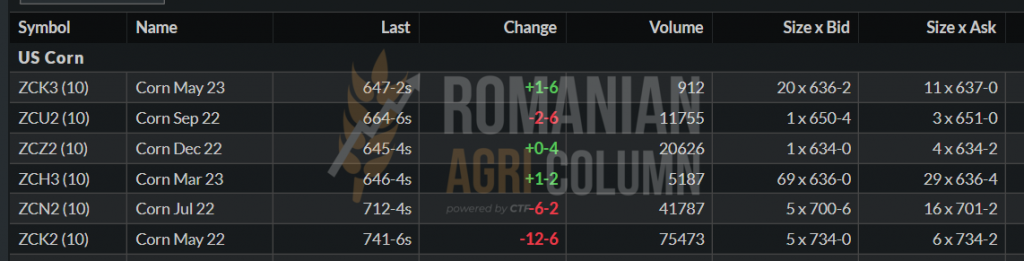
The indications of corn in the CPT Constanța parity weakened in intensity, starting from a level of 350 EUR/MT and ending on Friday at 343 EUR/MT. The reaction to the potential for an agreement between Ukraine and Russia is the same as for wheat. In the meantime, however, the port of Constanța is actually suffocated by goods, and many buyers reduce their prices or actually no longer quote.
The vessels are lined up waiting for the maize to be loaded. Romania has actually taken over the weight at this time in the Black Sea basin. As an export level registered until March 13, Romania’s corn export indication amounts to about 3.3 million tons. However, there are certainly exports that are not yet registered as being shipped.
REGIONALLY
Ukraine is trying hard to build logistics bridges with Romania and Poland for the transfer of corn. Optimistic estimates give 300,000 tons of cargo already in transit, but realistically speaking, 150 wagons a day to Romania does not mean more than 10,500 tons. In a complex of time (shipping, transboarding and reception in the port of Constanța) we are talking about a minimum of 5-7 days, taking into account that the port of Constanța is very crowded. So getting out is very difficult.
Moreover, exporters with operations in Ukraine have a very well-defined focus on goods purchased before the Russian invasion. Logically, the goods are signed at low prices and, in turn, are exposed because they sold it at lower prices than today’s levels, without taking into account any insurance purchased on the stock exchanges.
New crop forecasts are optimistic for the European Union. France and Romania are credited with a higher level than last year, but without generating too many figures. We are still cautious because sowing has not yet begun.
In Ukraine, on the other hand, the uncertainty is quite high. The first estimates show a 50% decrease in the maize crop, but of the 50% still certain, 20% are under observation. There are things that we did not take into account, namely the effect of the war, which will influence the pace of sowing. Here things are clearly complicated.
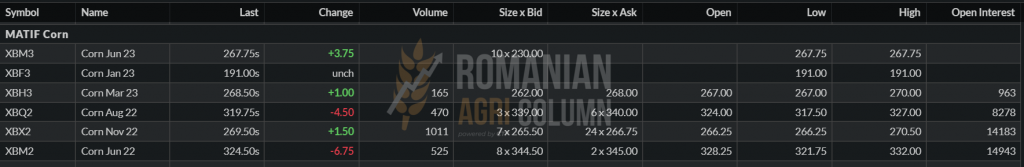
EURONEXT is reacting accordingly to the potential of an agreement between Ukraine and Russia and we have the following indications at the end of March 18:
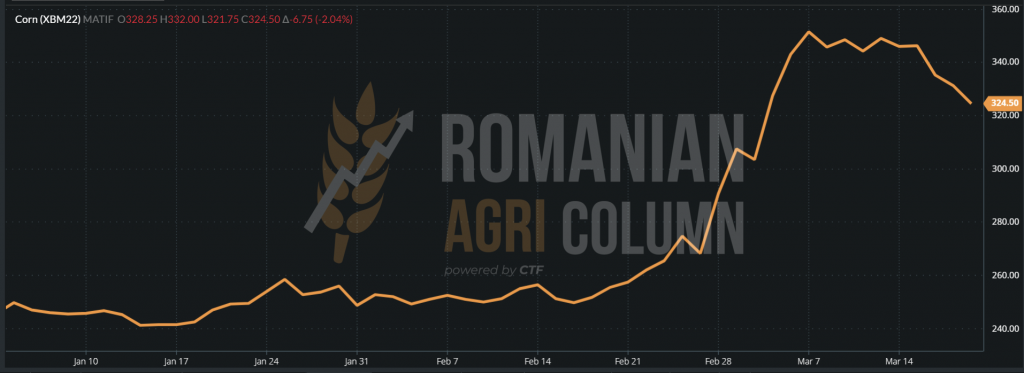
EURONEXT CORN – XBM22 JUN22 – 324.5 EUR (-6.75 EUR)
EURONEXT TREND GRAPHIC – XBM22 JUN22
GLOBALLY
The United States is effectively marching on corn sales. China is currently focused on the purchase of corn and the US is a reservoir in this regard. Last week alone there were sales of 200,000 tons to this destination, a sign that the stock piling process is ongoing in China.
Brazil estimates a very good production of Safrina, the second crop, which will compensate about 1.8 -2 million tons of the loss from Safra, the first crop. This is a good signal for the market and, implicitly, for stock markets.
Argentina has been watered these days and the benefits should be seen. However, the level of 52-53 million tons production estimate is maintained for the time being.
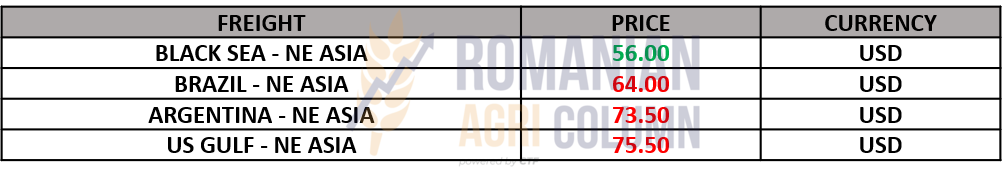
However, another factor entered the scene and impacted the global scenario. These are the logistics costs that generate a higher level in the relationship between Argentina/Brazil and NE Asia versus the Black Sea basin. We thus see a shift in transportation costs to the following levels, which further creates a much greater focus on the Black Sea basin:
CBOT is reacting to the news of the potential of a deal, and as usual, the funds are coming out of position transferring the profit. The problem of funds is beginning to be one of cash flow, as guarantees have increased exponentially with the price of goods. And they are trying to cover unionized through banking groups.
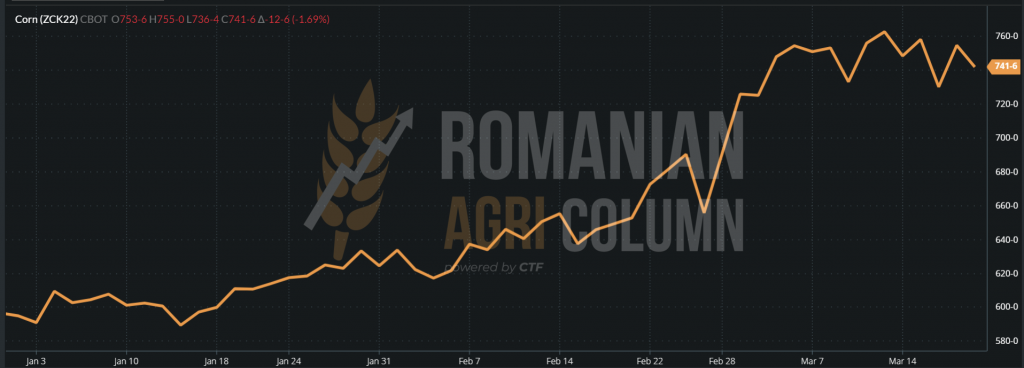
CBOT ZCK22 MAY22 – 741 c/bu (-12 c/bu)
CBOT TREND GRAPHIC – ZCK22 MAY22
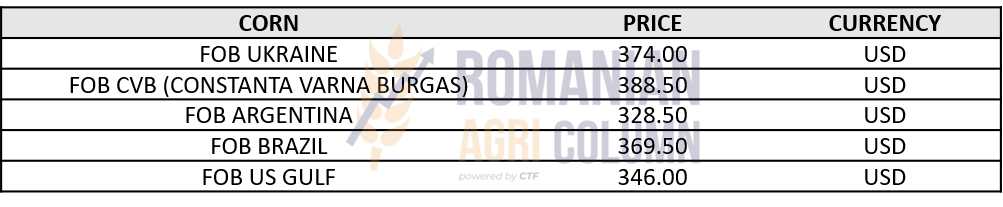
CORN INDICATIONS IN MAIN ORIGINS
ANALYSIS
- The Black Sea basin remains the most competitive compared to the rest of the origins. The net superior logistics in the basin for the destination of NE Asia is the defining factor.
- Corn maintains its interest. Its price has not been degraded as much as that of wheat, but the time will come when South American crops will take over transactional control.
- The European crop inverse is 55 EUR/MT, which clearly shows the downward path in the price of maize. The impact of the war is great, but global corn production is in the United States and South America.

LOCALLY
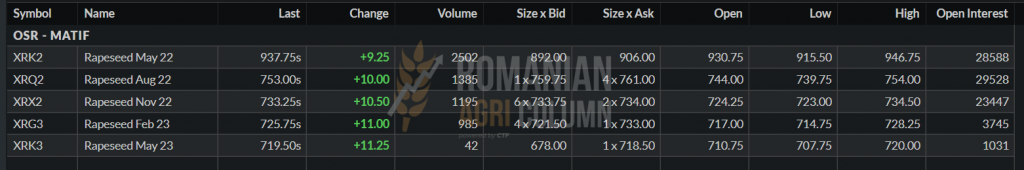
Local indications for old rapeseed crop are XRK22 MAY22 (937.75 EUR) minus 50 EUR/MT. This indicates that volumes exist only in very small quantities and that interest is no longer predominant these days. Only two buyers expressed interest in purchasing the old rapeseed crop.
The new crop is unchanged as a mechanism level – indication XRQ22 AUG22 minus 15-20 EUR/MT. The only variable remains the AUG22 quotation, which is currently fluctuating only given the price of oil.
REGIONALLY
We are still under the spectrum of factors in the Black Sea basin and we see how the talks on an agreement between the two parties, Russia and Ukraine, aggregated with a decrease in oil prices to 100 USD/barrel, led to a decrease in stock market indications for rapeseed. However, these quotations increased again, thanks to the oil that rose again to the quota of 108 USD/barrel, BRENT.
We are still looking at what can lower the price of rapeseed at this time and we have the first risk factor – the possible agreement between Russia and Ukraine, which would lead to a decrease in the price of rapeseed. Ukraine has a harvest volume potential of 3 million tons, and Russia of about 3 million tons. Basically, a volume of 6 million tons would return to the commercial circuit.
The European Union sees an aggregate level (together with the UK) at 19 million tons, with Germany showing an increase in production of 11.6% to 3.9 million tons due to a larger area sown in autumn (with 8.6% higher than last year).
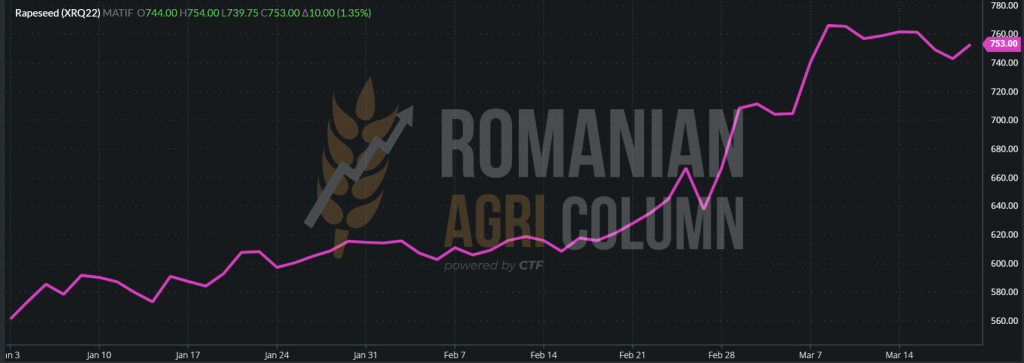
EURONEXT XRQ22 AUG22 – 753 EUR (+10 EUR) at the close of March 18, 2022
RAPESEED – EURONEXT TREND GRAPHIC – XRQ22 AUG22
GLOBALLY
The price route for the 2022 crop goes through many factors. The first and most important is the regional political one, i.e., the war that lasts for over 23 days. This factor can extract from the trade circuit 6 million tons of rapeseed related to the two countries in the Black Sea basin.
Then we have the unknown of the Canadian crop, which will be sown soon, in April to be precise, and it remains to be seen how it will evolve over the summer. It will be followed by Australia with its 4.85 million tons and, of course, India with its domestic market volumes of around 8.8 million tons. So the weather factor will be essential in the price of rapeseed.
The final correlation is the price of oil, which, as we have seen, moves up and down the price levels in rapeseed quotations.
ANALYSIS
- Global levels of rapeseed oil (biodiesel) are very tight and even in deficit.
- The recovery will take place in at least 2 years, provided that the Weather and Politics factors are favorable.
- Rapeseed is therefore dependent on weather and politics, correlated with oil.

LOCALLY
Locally, sunflower seeds have experienced profound degradation. Thus, we see levels of 850-860 USD/MT CPT Constanța or DAP Processors. Why is this happening? The explanation is quite simple – the potential for a ceasefire agreement in Ukraine and thus the resumption of crude oil exports so necessary to the European Union, as well as other countries such as Turkey and India. Practically, having the necessary coverage on JFM (January-February-March) and a good part of AMJ (April-May-June), the processors are waiting. It is a general movement, at the level of Romania and Bulgaria. The stockholders did not exploit the price peak and missed a moment that we honestly don’t think will come back.
Why do we say it won’t come back? Simple, because the governments of the panic-stricken countries have already assessed the state-guaranteed oil reserves and will intervene in the market with volumes. Moreover, the chain intervened at distributors and retailers to calm the prices that were raised by them instantly, absolutely for no reason.
We repeat once more. The processors have the stocks insured and on the 3-month processing band they have included in the price of the final goods the cost of the raw material. Moreover, a processor has supply contracts, which means that the price is fixed. Distributors and retailers, on the other hand, tried to exploit the moment and artificially raised prices. One distributor, for example, had raised the price from the level of 2.22 EUR/liter shelf price to the level of 3.64 EUR/liter, which is entirely speculative.
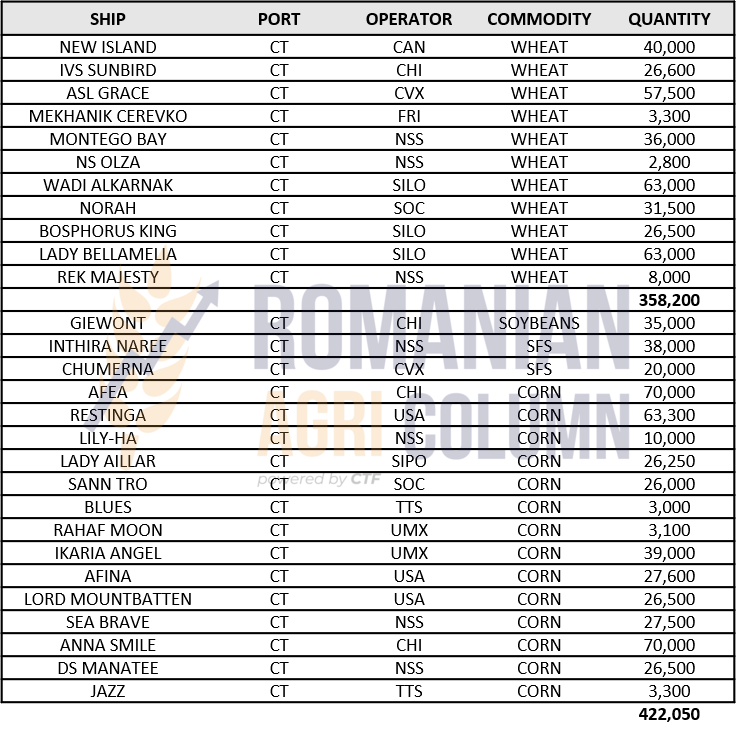
At the same time, we notice another volume of raw materials that is exported from Romania or has an intra-community destination. We see a level of 38,000 tons noted on the ship Inthira Nahre under operation in the port of Constanța, a volume of 20,000 tons to be loaded on the ship Chumerna, a volume of 18,000 tons on the ship Dobrota which left with another ship Meghna Fortune with another volume of 16,500 tons. In total, there are 92,500 tons of sunflower seeds.
Romania will generate a much larger area of sunflower in 2022. All indications and discussions with farmers lead to the certainty that they increase the area of sunflower in the crop rotation allocated to spring crops. Last year we had a level of 1.2 million hectares. In 2022 we will reach or exceed 1.4 million hectares. The question is whether to allow the crop to move to sunflower, as moving too quickly can cause crop problems caused by disease, which would lead to a much lower yield per hectare.
REGIONALLY
Turkey sets up oil ration – 2 liters of family per month. Bulgaria is silent and quiet. Processors do not offer the raw material, in the same context in which it is expected to be released in Ukraine, because if it is released, it will be like a plug from a pipeline and the price of raw material and oil will fall sharply.
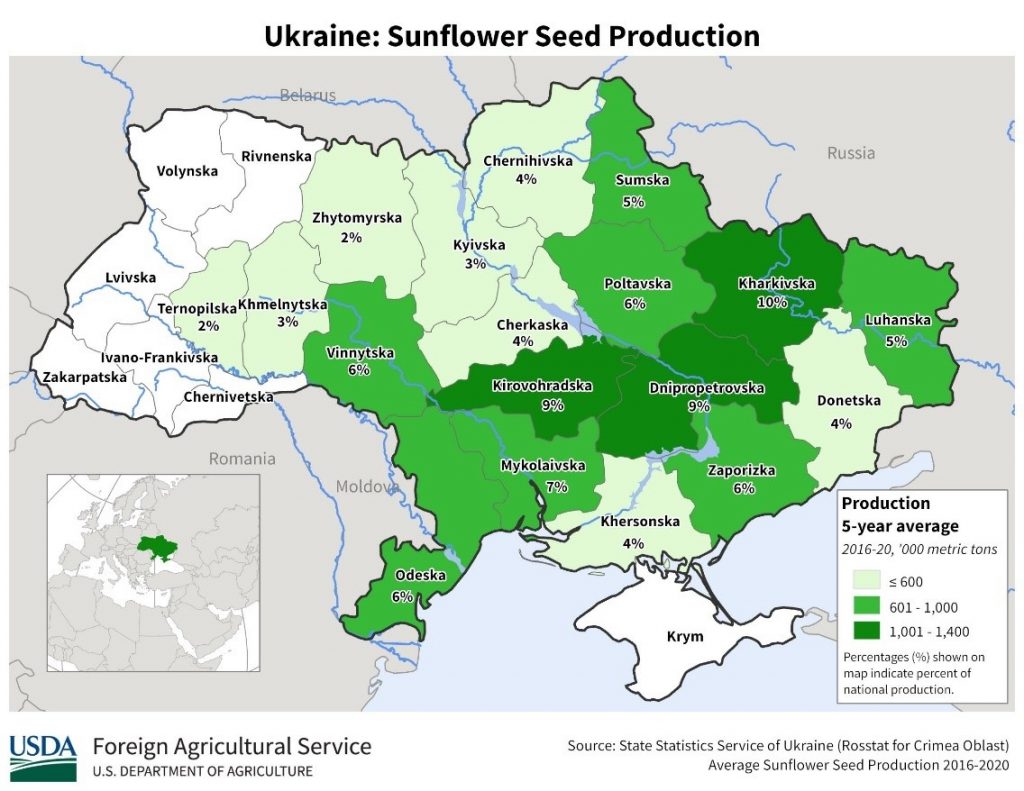
In Ukraine, planting estimates are extremely uncertain. The most credible are those that indicate 50-60% of the areas to be sown with sunflower, i.e., a level of 4 million hectares of the 7 forecast. And because we have to exemplify, look in the picture below at what the areas with the highest share of sunflower seed production mean, exactly in the areas controlled by Russia. Moreover, in the Crimea, there are about 400,000 hectares of sunflower seeds each year.
Thus, given the conditions below, in which Russian soldiers destroy agricultural equipment in the areas they control, it is difficult to accept a production higher than 60% compared to last year’s level. We will therefore move an issue for the 2022 season, the compensation of which can be found in the sale of Ukraine’s crude oil export channels, which will thus cover the lack of this season in the 2022-2023 season.
Don’t worry about Russia. They have other trade channels with states that have not sanctioned them and are considering food security. As for payments, there are Yuani and Crypto as payment methods, as well as states that are not subject to the rules of the international community and, implicitly, not to US control, so payments will be made via these locations.
GLOBALLY
Argentina is lowering its crop forecast due to vegetation problems and plant disease with Phomopsis. The reduction so far is 0.2 million tons, but as the harvest progresses, we will be able to see more than that in terms of lowering the forecast. We remind you that the initial forecast was 3.3 million tons, now it drops to 3.1 million tons. Moreover, there is a trend of Argentine protectionism with regard to the export regime of certain goods, but we will return to this subject in soybeans chapter.
FAO index
The FAO index of vegetable oil prices averaged 201.7 points in February, up 15.8 points (8.5%) from last month and setting a new record. The continued strength of prices was mainly due to rising prices for palm oil, soybeans and sunflower oil. In February, international palm oil prices rose for the second month in a row due to sustained global import demand, which coincided with low export availability from Indonesia, the world’s largest exporter of palm oil. Meanwhile, world soybean oil values continued to rise due to deteriorating soybean production prospects in South America. International prices of sunflower oil have also risen sharply, supported by concerns about disruptions in the Black Sea region, which could reduce exports. The rise in crude oil prices has also supported the vegetable oil complex.
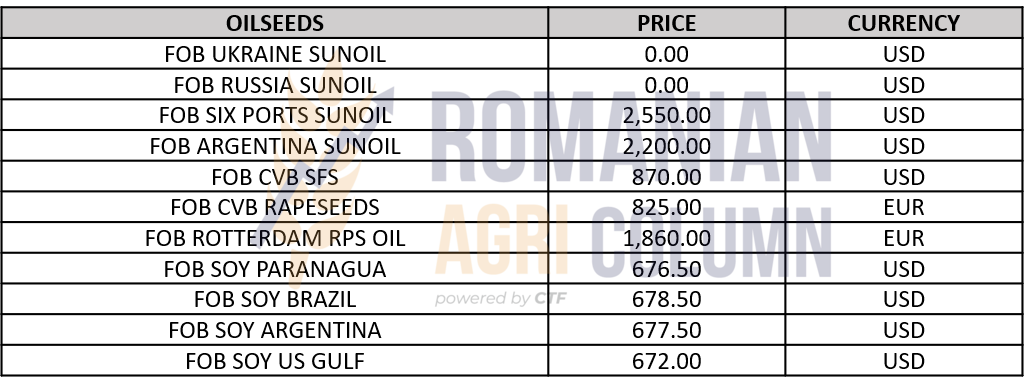
INDICATIONS OILSEEDS, CSFO AND RAPESEED OIL IN VARIOUS ORIGINS
ANALYSIS
- The apparent calm and narrowing of the price level of sunflower seeds are given by the potential to stop the conflict and thus resume the export of Ukrainian crude oil.
- In any case, the price of the final product will change in 4-6 weeks. The imprint will be placed on expensive commodities bought by processors, to which will be invariably added the cost of electricity and fossil energy.
- We have two scenarios: the first positive, in which the situation will normalize and the Ukrainian flows will resume their natural course: and a second, in which it will not normalize and we will be able to see again high levels of sunflower seeds.

LOCALLY
The local market generates levels of 650-660 USD/MT for the lots still available for sale under DAP Processors. The Hungarian market still indicates levels of 650 EUR/MT DAP Processors.
REGIONALLY + GLOBALLY
The US is picking up sales. Last week, about 800,000 tons were recorded as sales to China and other buyers. China indicates a growing demand due to problems with the future wheat crop and all appearances are leading to the level of 100 million tons as a final benchmark in imports.
But we may see this level exceeded because of the problems they will face in trying to replace the wheat, which is degraded (own production), with Russian wheat. Logistics is a real challenge. How do you transport 27 million tons from Russia? VTB, which owns RusAgroTrans, the largest railway transport company in Russia, has 25,000 wagons. In a nutshell, 25,000 wagons with a capacity of 70 tons means 1,750,000 tons. Which must be loaded, delivered, arrived, unloaded and then returned to the Origin. Is very difficult…
South America remains below the spectrum of the future reduction in Argentina, and Brazil remains at 124.8 million tons. In other words, we will see the end soon, but already after the WASDE report we know for sure that 10 million tons of production have disappeared.
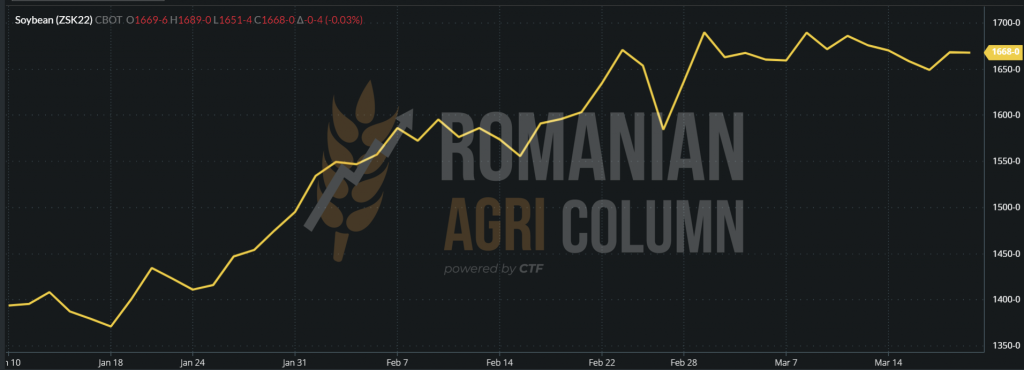
Moreover, Argentina is entering pure protectionism. Knowing that they process a lot of soy and sell soybean meal and soybean oil, they announced an export restriction for soybean oil and soybean meal. It is a measure that seeks to temper domestic inflation. In a statement a few hours ago, however, they announced that they would allow the export of soybean oil and grit, but with an export tax rate of 34% of the value of one ton (oil or meal). In other words, the goods must remain in the country in order to control the prices. CBOT reduced the engines to soy and soybean oil by default. CBOT ZSK22 MAY22 – 1,668 c/bu (static, we could say).
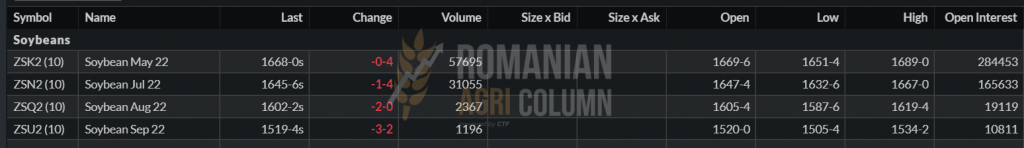
CBOT TREND GRAPHIC – ZSK22 MAY22


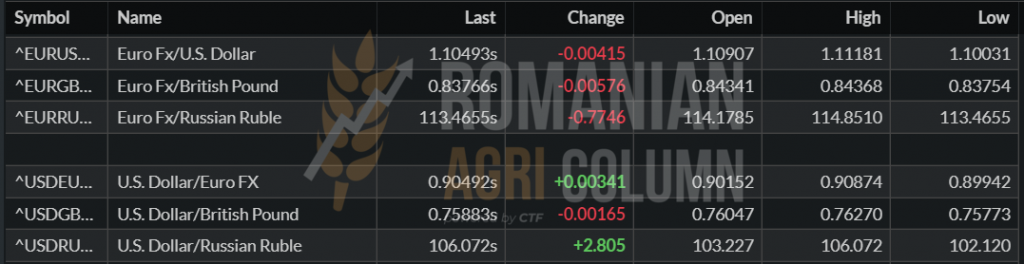
EUR/USD 1:1.10

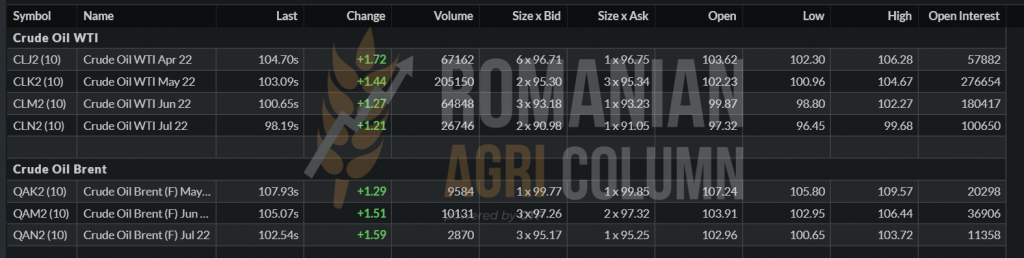
BRENT 108 USD/barrel

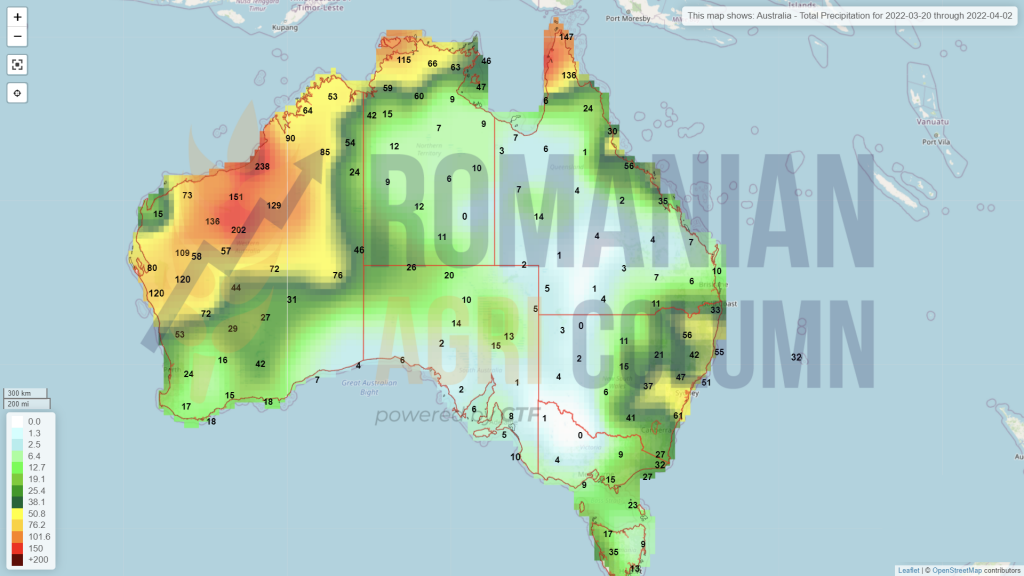
March 20 – April 4, 2022
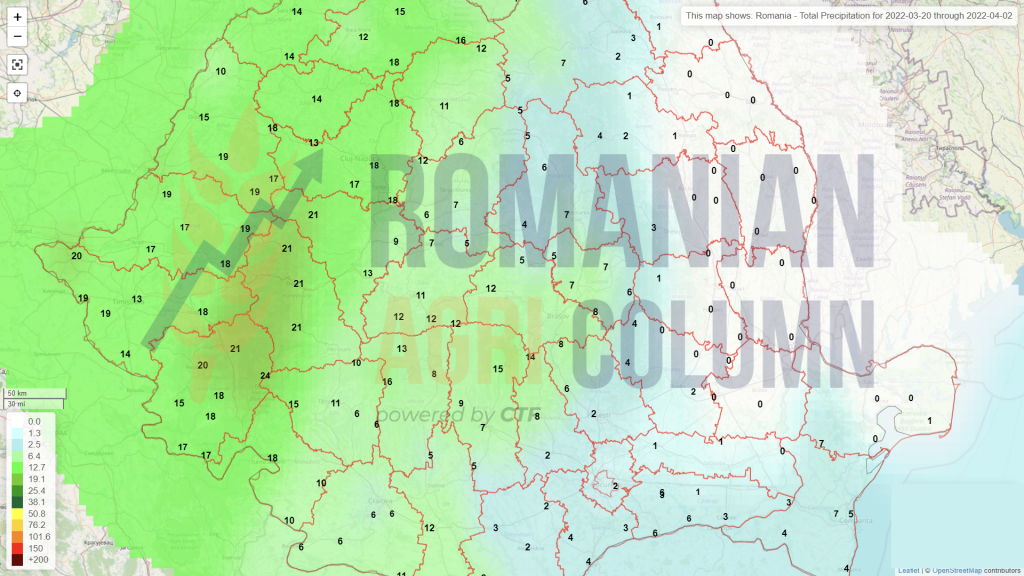
Romania (rain)
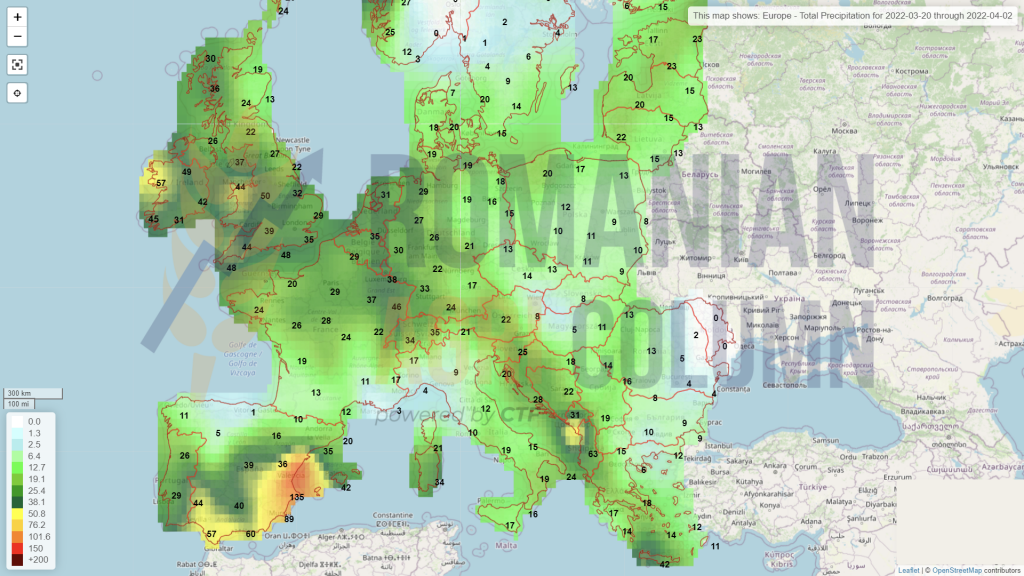
Europe (rain)
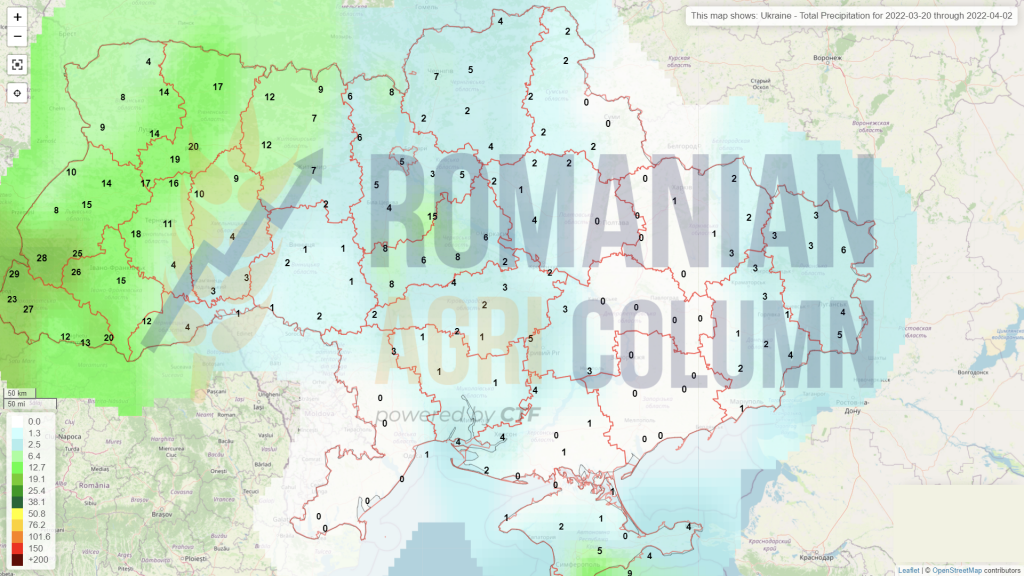
Ukraine (rain)
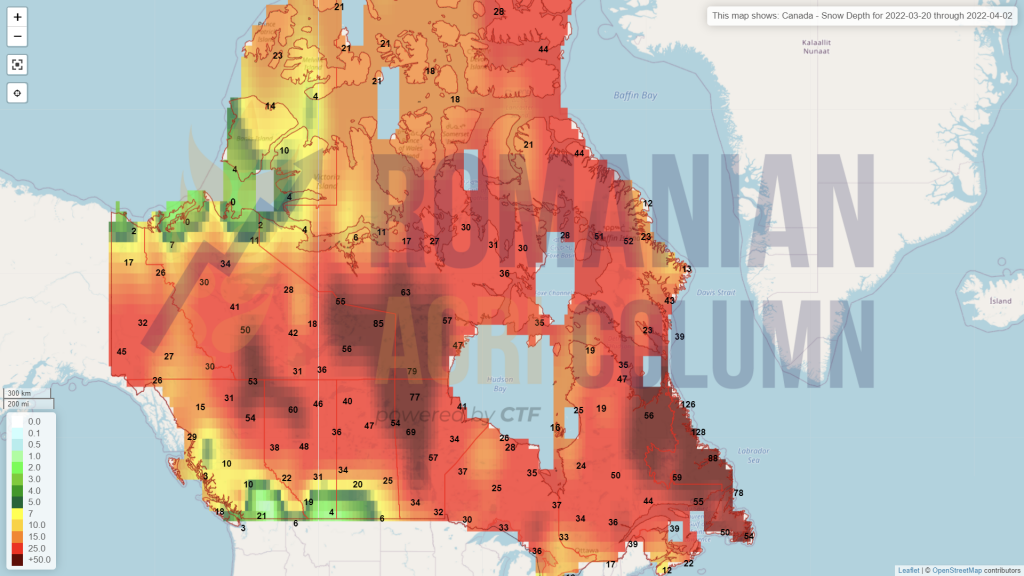
Canada (snow)
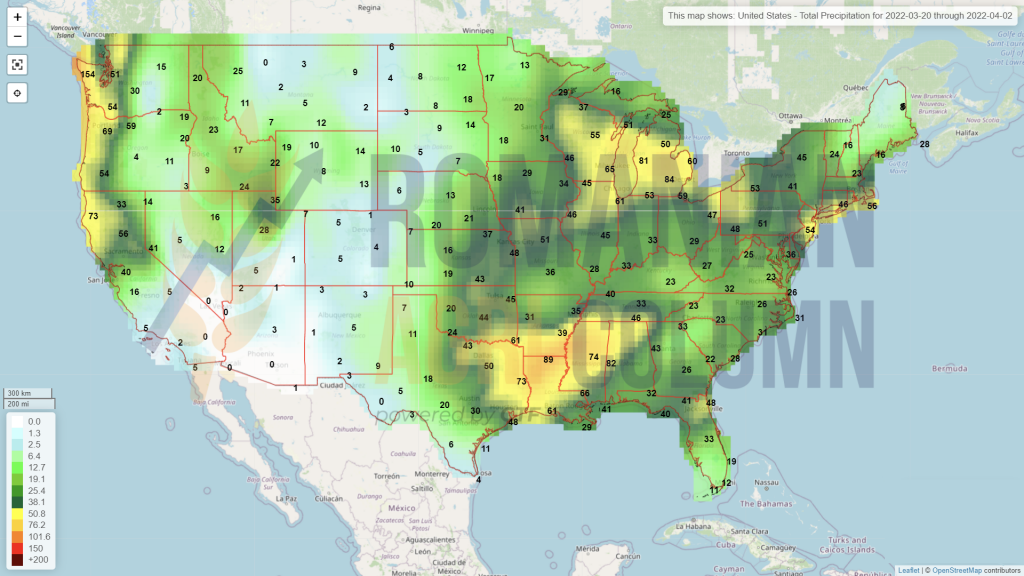
USA (rain)
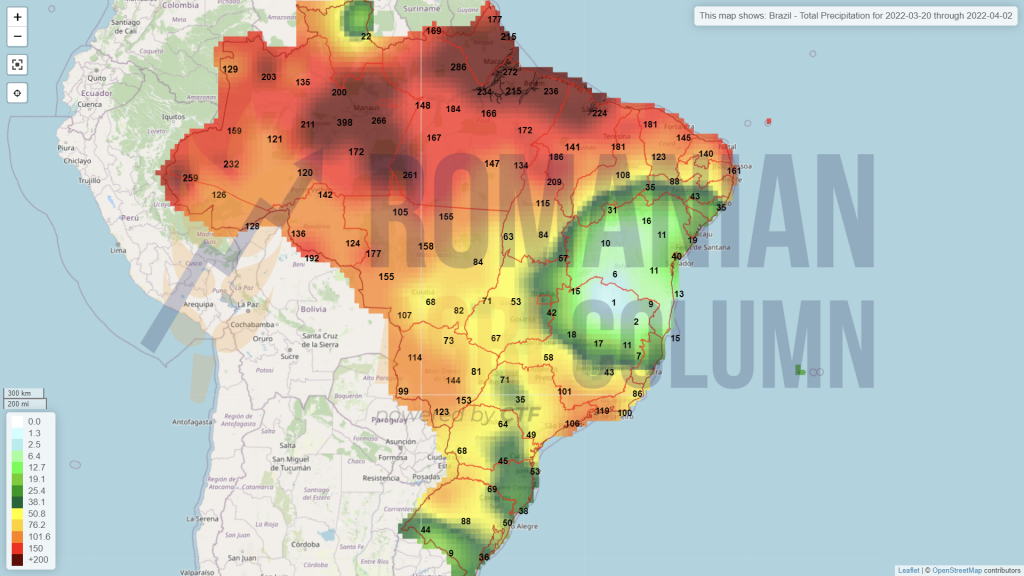
Brazil (rains)
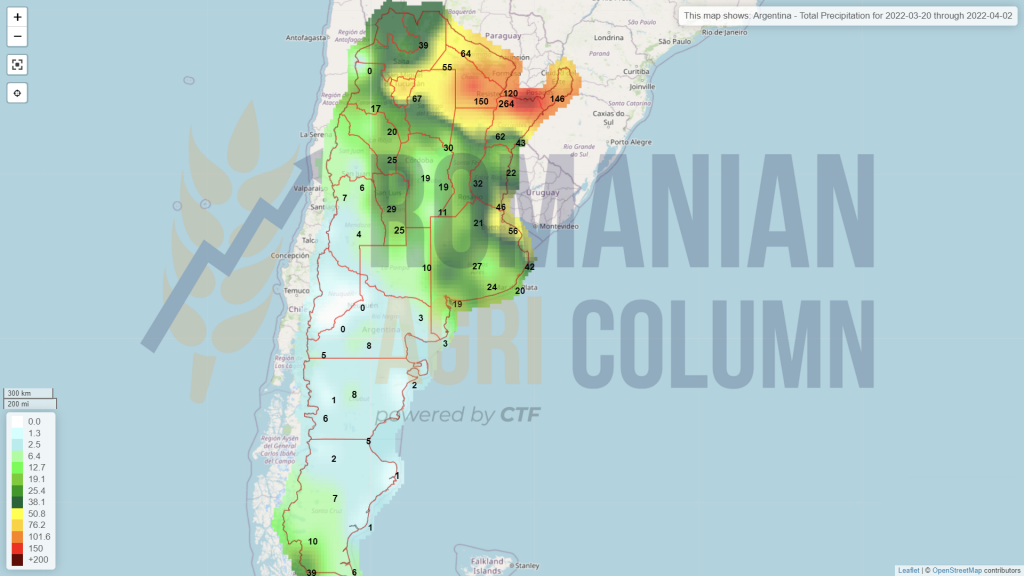
Argentina (rains)
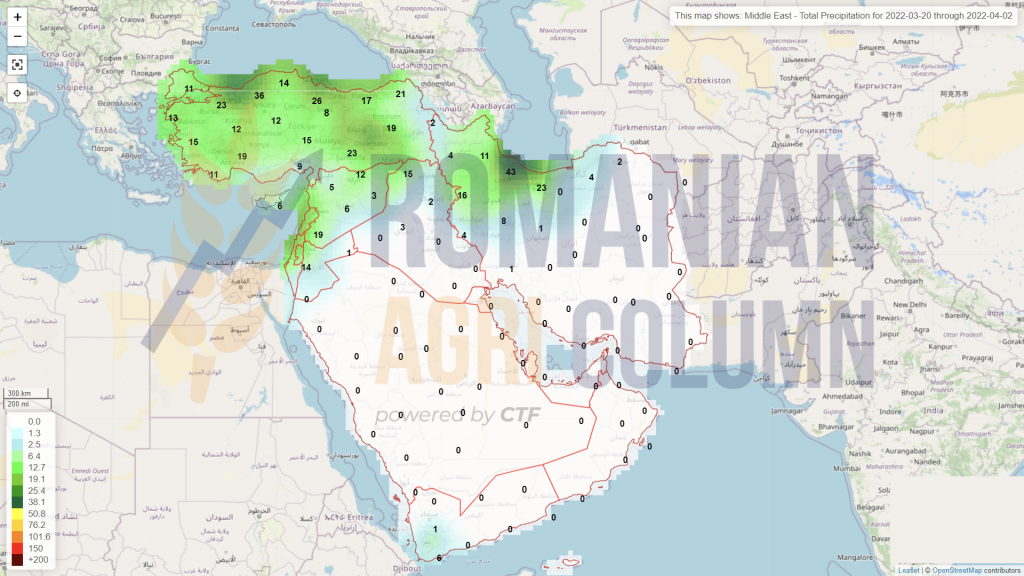
Middle East (rains)
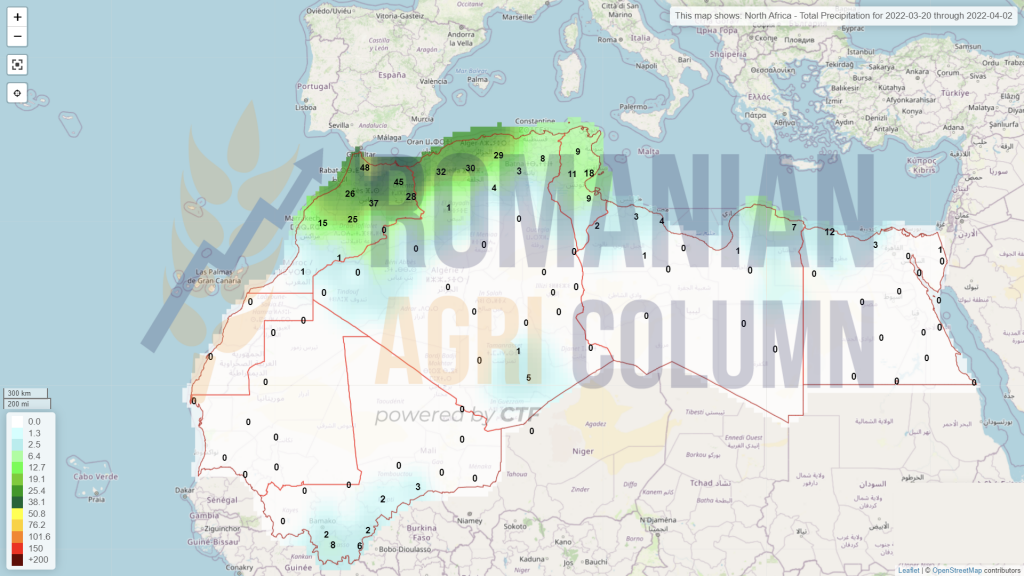
Northern Africa (rains)
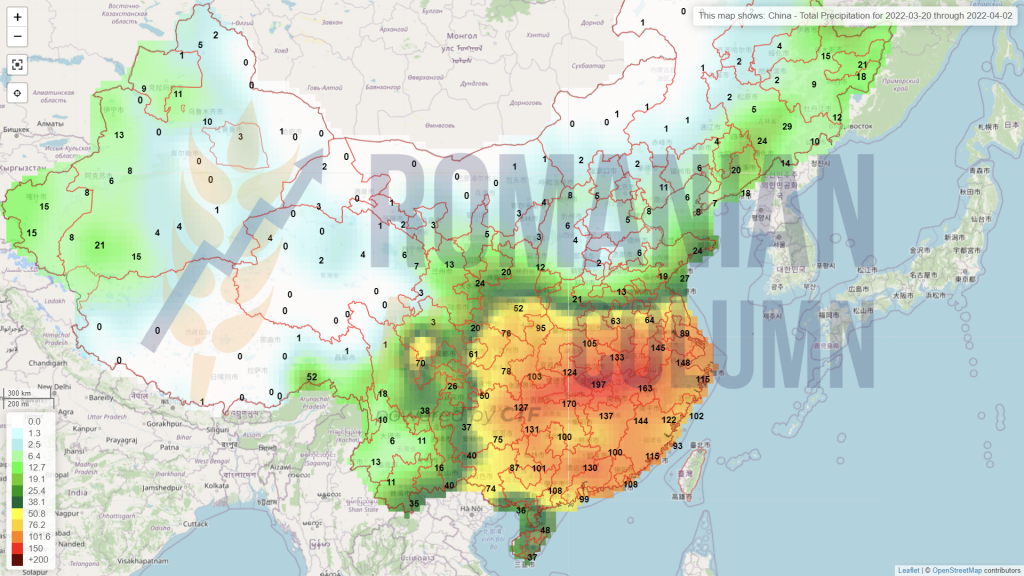
China (rains)
Australia (rains)