This week’s market report provides information on:
FAO APRIL 2023
FAO CEREALS
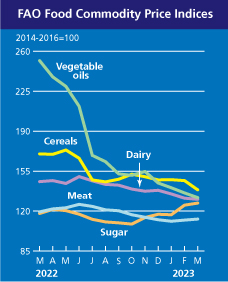
The FAO Cereal Price Index averaged 138.6 points in March, down 8.2 points (5.6%) from February and 31.6 points (18.6%) below today’s level one year. This month’s decline reflects a decline in international prices for all major grains. International wheat prices fell the most, 7.1%, on the back of ample global supplies and strong competition among exporters. The extension of the Black Sea Grains Initiative, which allows Ukraine to continue exporting from its Black Sea ports, also contributed to this decline. Higher estimates for Australian production, along with improved crop conditions in the European Union this month, further boosted the global supply outlook. Strong competition from the Russian Federation, where high bids continue to support competitive prices, also supported downward pressure on markets. World corn prices also fell 4.6% in March, pressured by seasonal availabilities from South American crops, expectations of a record production in Brazil and the extension of the Black Sea Grains Initiative. Among other coarse grains, world prices of barley and sorghum fell by 6.7% and 5.7%, respectively, influenced by the spillover effects of the decline in international maize and wheat markets.
FAO VEGETABLE OILS
The FAO vegetable oil price index averaged 131.8 points in March, down 4.1 points (3.0%) from February and 47.7% below a year ago. The decline in the index was the net result of lower quotations for soybean, rapeseed and sunflower oils, which more than offset the rise in global palm oil prices. After falling for three consecutive months, international palm oil prices recovered in March. In addition to lower production levels in Southeast Asia due to adverse weather and flooding in some crop regions, palm oil prices received additional support amid limited global exportable supplies amid temporary export restrictions imposed by Indonesia. In contrast, world soybean oil prices continued to fall, following the downward trend in international soybean quotes. Meanwhile, canola and sunflower oil prices also continued to decline, supported by abundant global supplies and subdued global import demand, respectively.
FAO FOOD
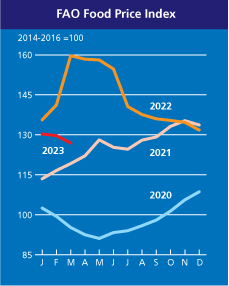
The FAO Food Price Index (FFPI) averaged 126.9 points in March 2023, down 2.8 points (2.1%) from February, marking the twelfth consecutive monthly decline since the peak his a year ago. In the last 12 months, starting in March 2022, the index has fallen by as much as 32.8 points (20.5%). The decline in the index in March was led by declines in the price indices for cereals, vegetable oil and dairy products, while those for sugar and meat rose.

LOCAL STATUS
The indications of the Port of Constanța are, depending on the buyer, in a margin of 233-235 EUR/MT in CPT parity. The discount for feed quality is 7-8 EUR/MT.
The new wheat crop is valued around the same price level, with an upper limit set at 230 EUR/MT, with a discount of 6 EUR/MT for feed wheat, both indications having the CPT Constanța parity as a reference.
CAUSES AND EFFECTS
We have entered the period of the Easter Holidays, and what we note in the market is that relaxation we were talking about. Quotations are falling, and farmers are preoccupied these days with the sowing of spring crops.
We note a protest by Romanian farmers that took place on April 7, 2023. It took place at the national level and marked their revolt against the flow of goods from Ukraine. The revolt of Romanian farmers specifically targets imports of Ukrainian goods that have distorted the market and generated a lack of attention from local processors. Summarizing the numbers, we can state that 3.5 million tons of discounted goods from Ukraine took the place of 3.5 million tons of Romanian goods in the local market. In addition to this aspect, the increase in the logistics cost has, in turn, impacted the competitiveness of the flows of goods produced in Romania. A high cost of 65-70% generated an even greater loss in the income of the farms, which, in addition to the costs of storage and keeping the identity of the products, also received the logistical shock.
The solutions are extremely simple, namely:
- the prohibition of imports of Ukrainian goods on the territory of Romania and
- allowing the transit of goods only with their segregation from Romanian goods, i.e., a percentage share in the access to the port of Constanța.
Which, in turn, could operate both flows, but access to the terminals is extremely difficult, due to the lack of an IT system and the control of the transport units, which crowd and interfere in the attempt to access the destination terminals.
Poland has already announced that it is taking the risk of banning the import of Ukrainian goods and will only allow their transit to ports that facilitate export. There have also been some political movements and we note that the Minister of Agriculture has resigned precisely because of these reasons of tension regarding the access of Ukrainian goods. But, according to our information, the minister was withdrawn due to some moves on the political scene; he will have the portfolio of vice-premier.
Coming back to the local market, old crop prices are not a happy parameter today, but these stocks have to find their way. Soon we will be crossing into May and they are doing nothing but creating bottlenecks in local storage space as well as more volume to be sold. But as a neutral opinion we share here, we think it’s already too late. The crop inverse is 3-5 EUR/MT and this will be valid for a maximum of 2 weeks from now.
REGIONAL STATUS
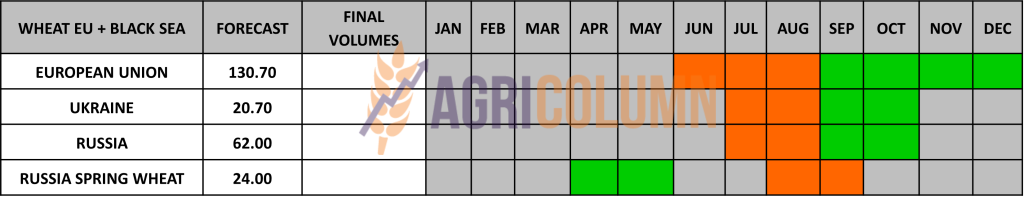
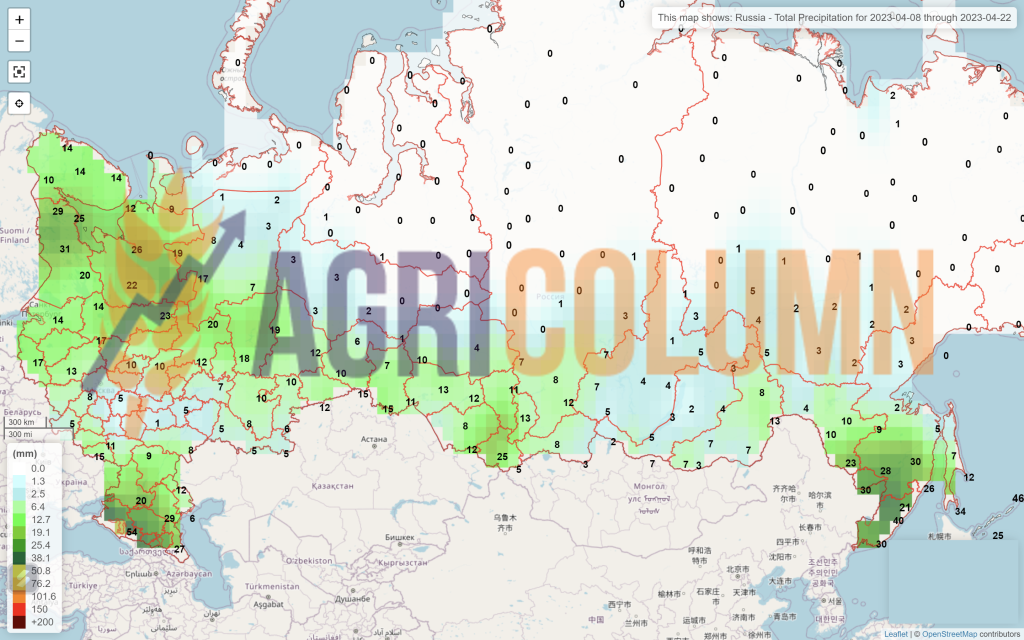
RUSSIA indicates through IKAR a much larger harvest volume, namely 86.5 million tons. Other local analysts indicate, in turn, volume upgrades, but only from 81 to 82.5 million tons. If we combine the stocks of Russian farms and those of Russian intermediate trading companies, i.e., about 17.5 million tons, we will certainly have a cargo volume that will be grouped around the value of 92-94 million tons. This volume of 17.5 million tons is higher at this time of the year by 85% compared to the average of the last 5 years, which is a big handicap for Russia in that the volume will penalize the selling price.
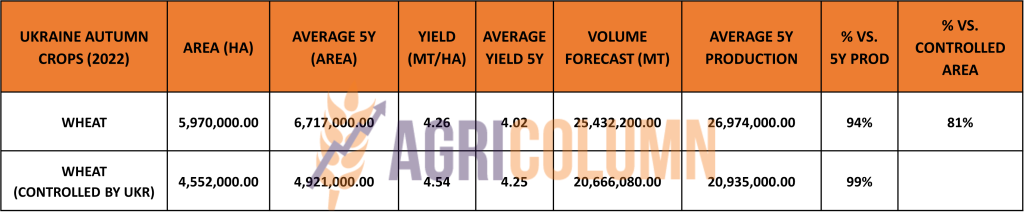
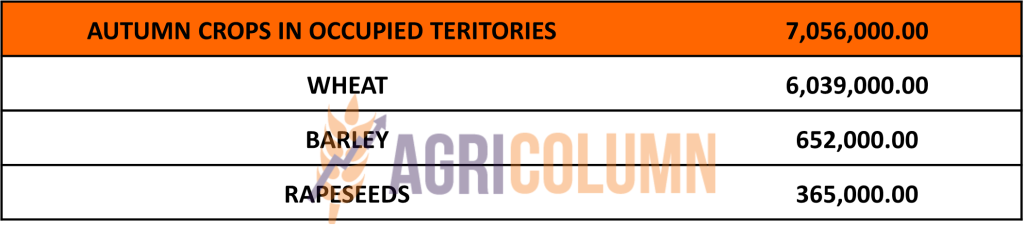
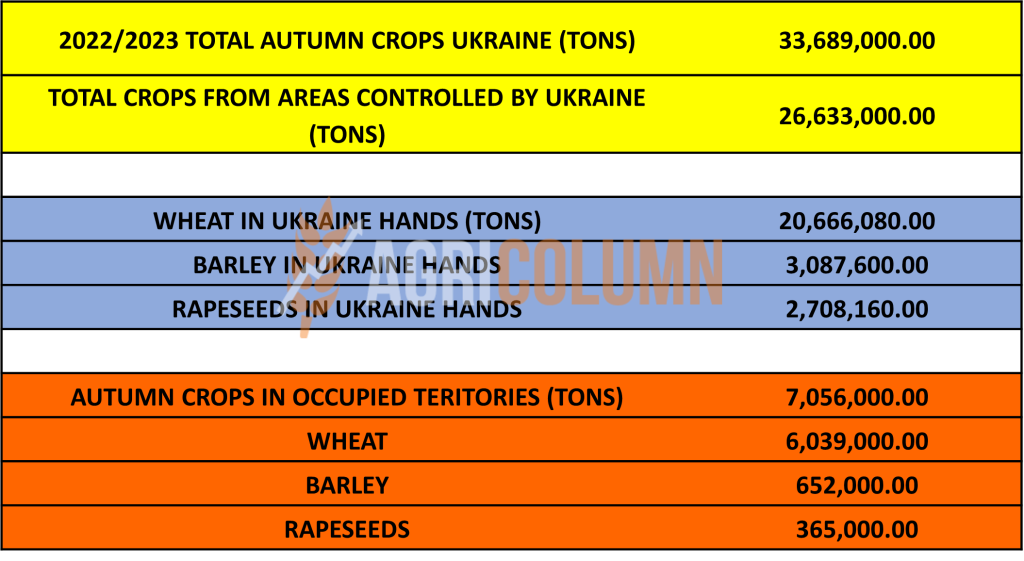
UKRAINE indicates, in association with the territories controlled by Russia, a volume very close to the pre-invasion days. Thus, aggregating the productions from the territories controlled by Ukraine with those from the territories controlled by Russia, we observe a total of 25.5 million tons, against a multi-year average of 27 million tons. It identifies, therefore, a minus of 1.5 million tons at the national level. It is an aggregate minus, because, certainly, the difference from 20.7 million tons to 25.5 will enter the Russian accounts, that is, we are talking about a surplus of about 6 million tons for Russia.
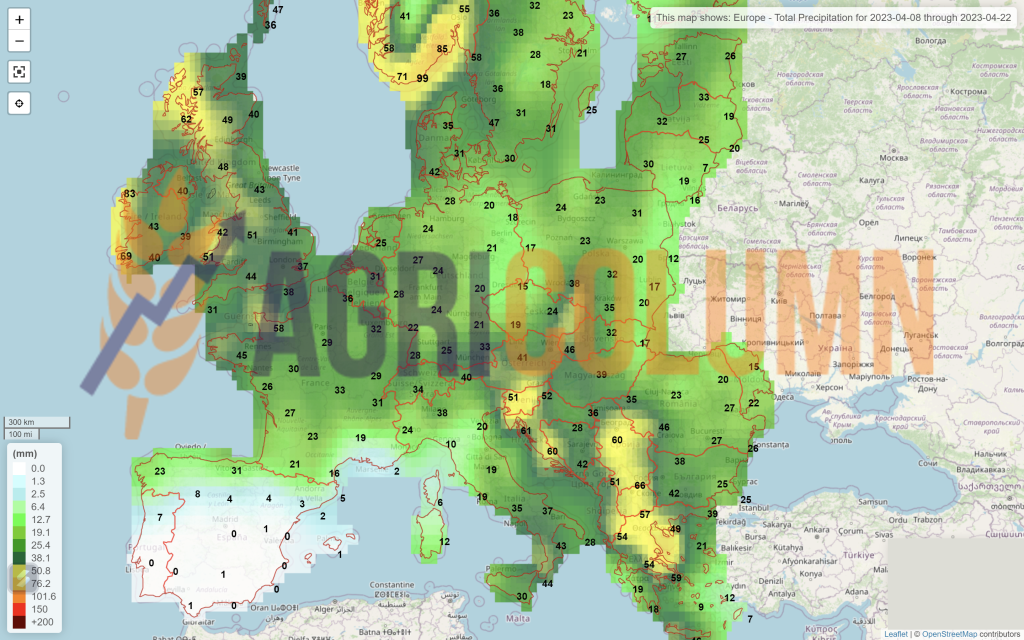
The EUROPEAN UNION remains in the same positive context regarding the vegetative index of the new crop. Rainfall is making its presence felt in the European Union, but less the Spanish area, and this strengthens hopes of positive harvest volumes in the Union area.
As for the EU export, it reached the total level of 24.24 million tons, with an imported volume of 8.47 million tons. The variation of exports compared to the previous year in the same period (YOY) is positive, of 6%. But import also has an extremely high share at Union level, 152% higher than last year in the same period (YOY). Of the import origins, naturally, Ukraine has the largest share, with 4.45 million tons of the total EU import.

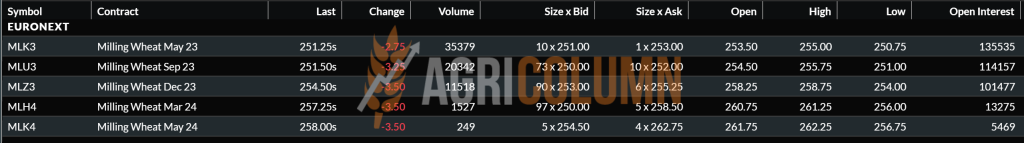
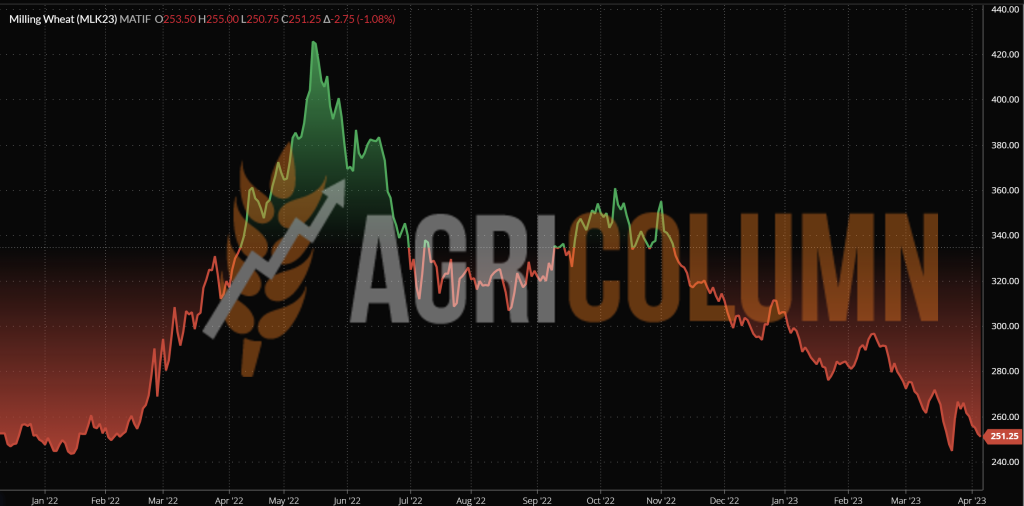
EURONEXT – MLK2323 MAY23 – 251.25 EUR (-9 EUR vs. previous week)
EURONEXT WHEAT TREND CHART – MLK2323 MAY23
GLOBAL STATUS
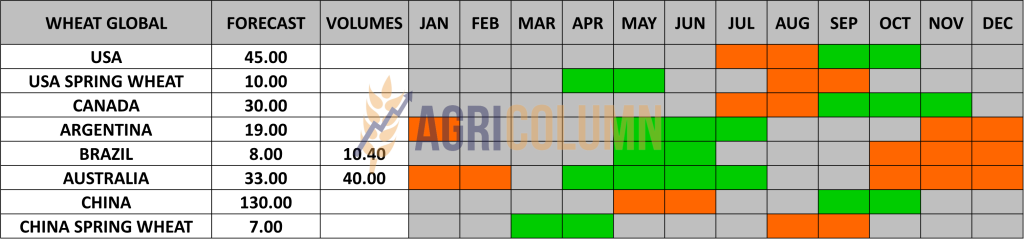
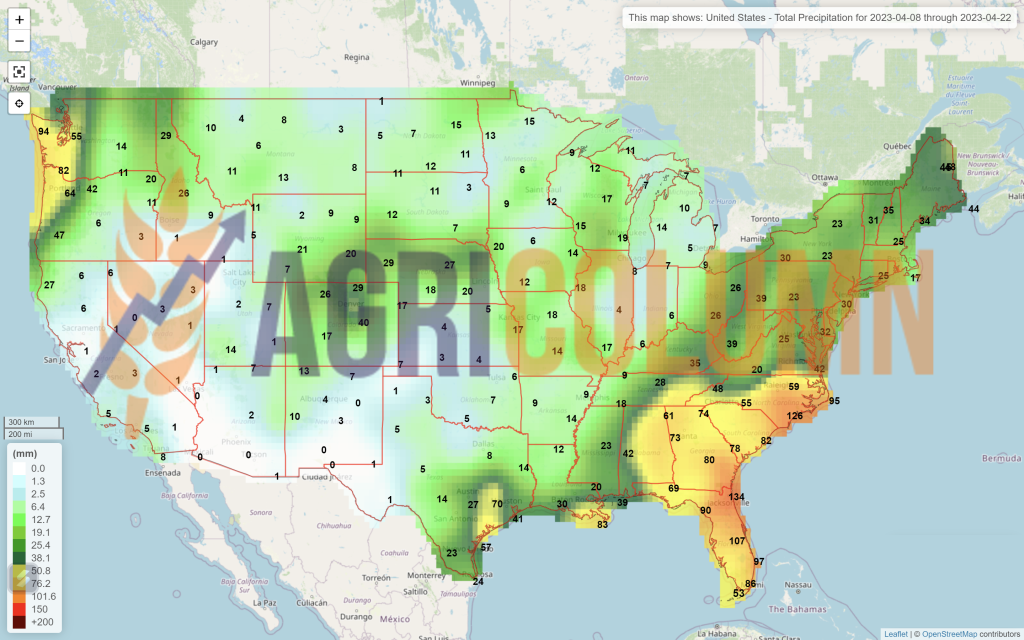
USA. The potential for the US wheat crop remains mixed. Water deficit areas in the south-central plains and snowstorms in the North and South Dakotas as well as the Montana area are affecting crops. Thus, we see a 28% good to excellent grade of the US wheat crop. But ultimately, water in any form is good for crops, and even if spring wheat seeding is delayed, we believe recovery will occur at some point.
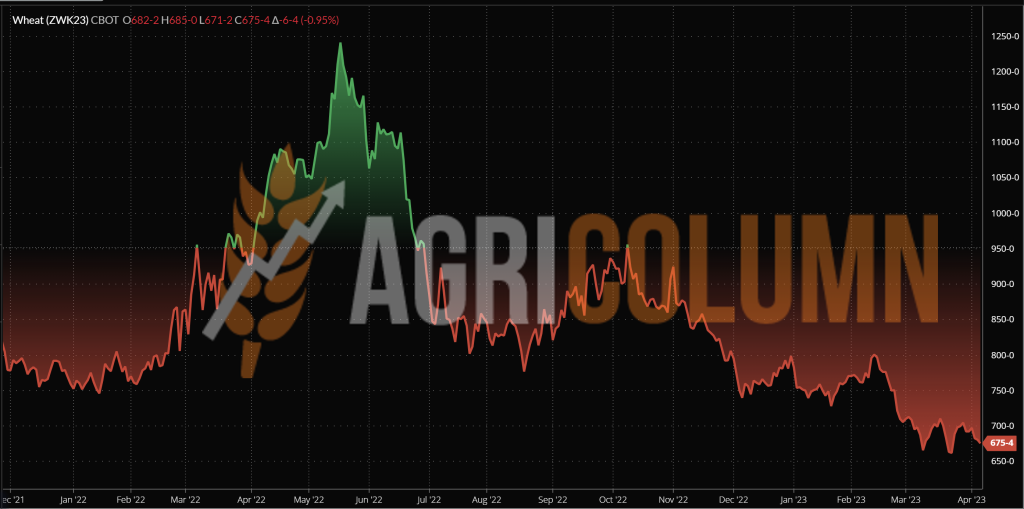
CBOT WHEAT – ZWK23 MAY23 – 675 c/bu (-17 c/bu = -6.24 USD vs last week)
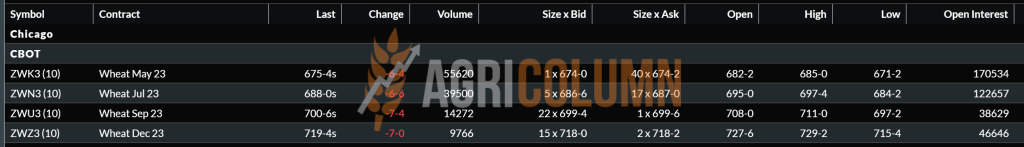
CBOT WHEAT TREND CHART – ZWK23 MAY23
TENDERS AND TRANSACTIONS
GASC EGYPT purchased a volume of 600,000 tons of Russian wheat for delivery during May 2023. About 480,000 tons were purchased from Grain Flower ex GTCS, and the difference of 120,000 tons will be delivered by Aston. Tender closing price with CAD payment term (cash against documents or at sight) was 293 USD/MT, C&F.
And here we have some remarks.
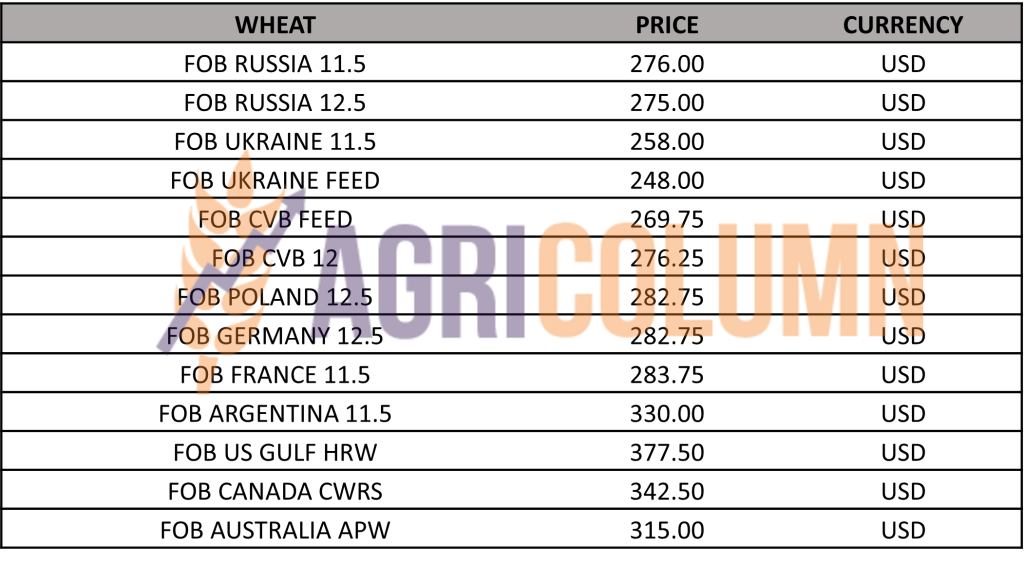
First, the FOB price is 275 USD/MT, in line with Russia’s statement that it will not sell below this threshold. Totally agree, but the line-up included Ukrainian, Romanian and Russian goods. The consignments posted by Ukraine had no chance of winning, due to high transport costs (about 52 USD/MT). The Romanian lots were well positioned, with a transport cost of 16 USD/MT. The Russian freight indication was positioned at 27 USD/MT.
But Russia negotiated with NNC (National Naval Company Egypt, the company that carries out the transport) a lower cost for the goods, so that the result was a lower price than the goods from Romania. How could this happen, that freight suddenly went from 27 USD/MT to just 18 USD/MT? Simple, the Russian state gave a disguised subsidy to transport. He will simply fuel the Egyptian ships without asking money for it when they come to load. Whether it is fair or not, we leave it to you to decide, but this no longer looks like a tender, but a Russo-Egyptian concert where the parties do not play by the same rules as the market.
So the bottom line is 600,000 tons C&F Egypt at pseudo 293 USD/MT. And Russia actually sold wheat at the level of 266 EUR/MT FOB.
WHEAT PRICE INDICATIONS IN MAIN ORIGINS
CAUSES AND EFFECTS – THE STORY
Other companies are leaving Russia and we note Dreyfus leaving the Russian theater of operations. The nationalization of exports to Russia is taking shape more and more. In fact, there are no big doubts anymore. And by controlling domestic operations and terminals, Russia will conglomerate all domestic operating margin. Russian farmers will no longer have options and will only rely on the subjectivity generated by the central state apparatus, which will not hesitate to exploit the work and profit generated by farmers.
We are approaching the moment of April 16, 2023, when the liquidations and roll-over on the stock exchanges will begin. Then we will see how the levels will fall and if in the European market the crop inverse is non-existent, in the American market it is positive in favor of the new crop.
At the same time, we already see on the horizon the time limit imposed by Russia on the corridor. And the time interval visibly decreases. Lavrov’s threats are flowing, but who has any basis for this man who does nothing but spew lies and false narratives. Russia is moving like a snail in inspecting ships coming from Odessa and even blocking the entry of ships from the Bosphorus to Odessa. But it should be noted that a large part of these goods is destined for the European Union. In other words, what comes out of Odessa-Pivnyi-Chornomorsk ends up in the European Union. And we will insert a graph that speaks for itself about the destinations of the goods leaving the corridor.
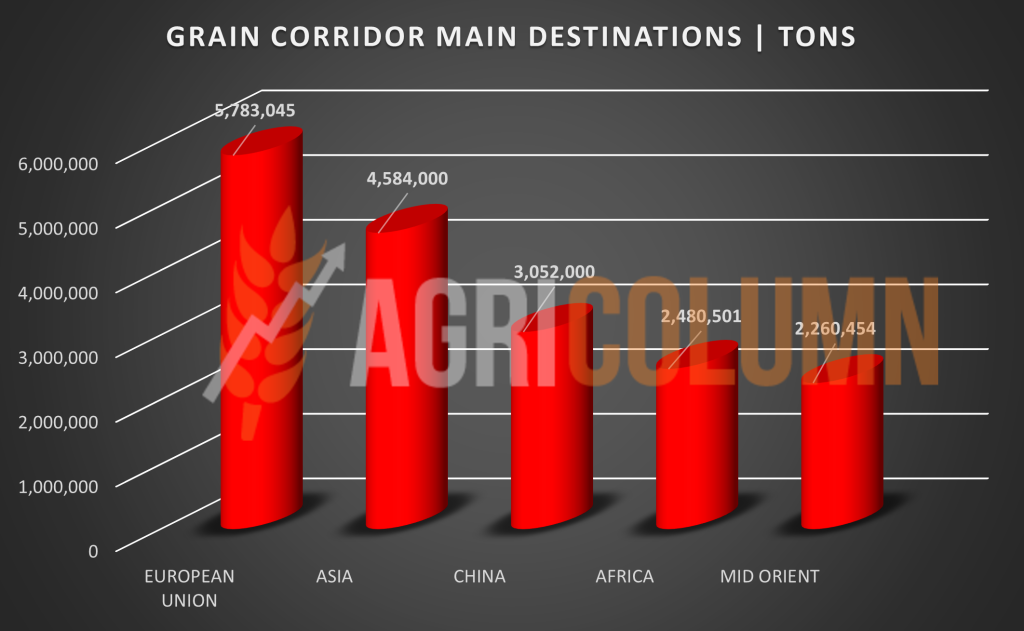
What will happen? Ukrainian goods already have other routes, Romania being one of them. And we will see the Ukrainian transfer at much higher values through Romania. First of all, it is much cheaper and much safer here than the Grain Corridor, but as we have seen above, the impact is unfortunate on the territory that these goods cross. And the European Commission extended for another year the suspension of tariffs, as well as the need to present the sanitary-veterinary certificate and the inspection itself at the borders.
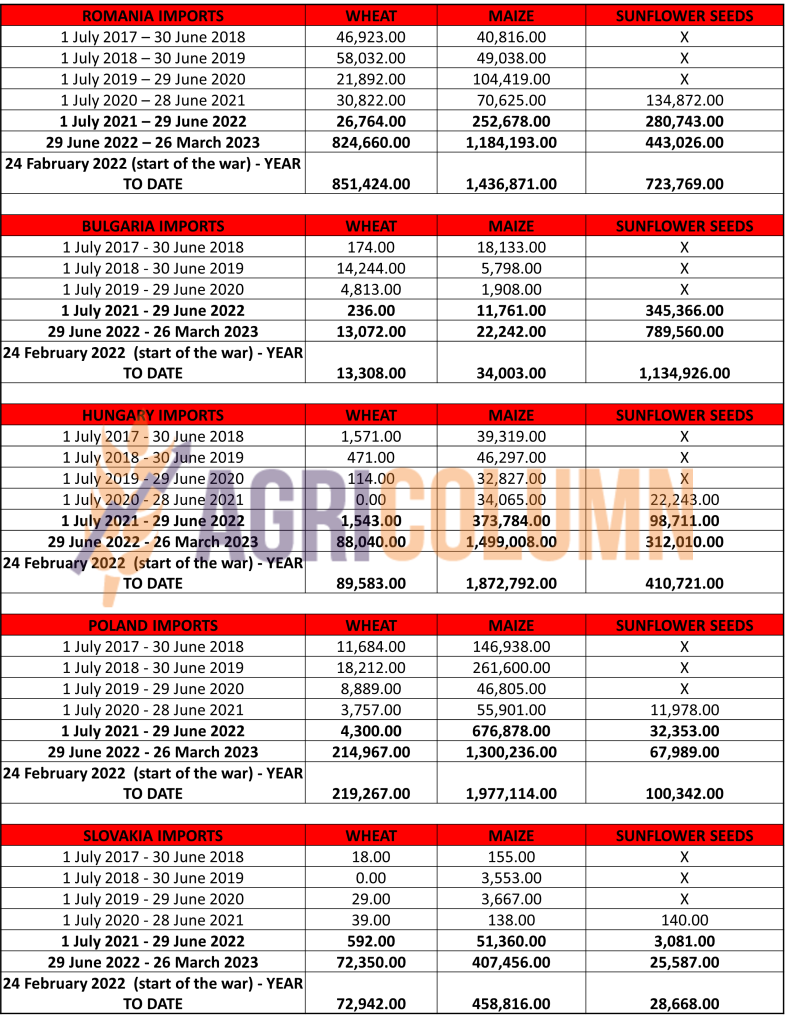
To visualize the full effect of these Ukrainian transfers, we have prepared a file with imports from the 5 countries affected by the transit, namely Romania, Hungary, Poland, Bulgaria and Slovakia. It is a file containing the level of imports in the last 6 seasons of each country listed above in terms of wheat, maize and sunflower seeds. It’s a harder file to go through, but it paints a picture of the impact these countries have suffered.

CONCLUSIONS
- Wheat volume will certainly be a bearish factor in the market;
- Compensation will come from Russia, which will do everything it can not to sell cheaply;
- In the following period, there are no market growth factors and we can extend this period to the area of April 16-17, 2023:
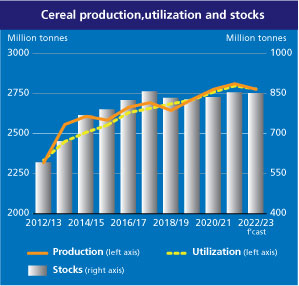
- The FAO raises the global production forecast to 786 million tons in 2023, which makes it second in size.

LOCAL STATUS
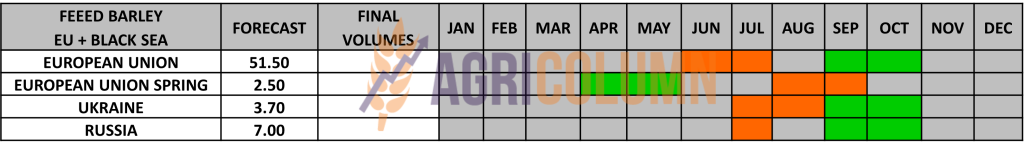
The feed barley price indications are around 195-200 EUR/MT in CPT Constanța parity. They refer to the new crop, because the old one is no longer in demand.
REGIONAL STATUS
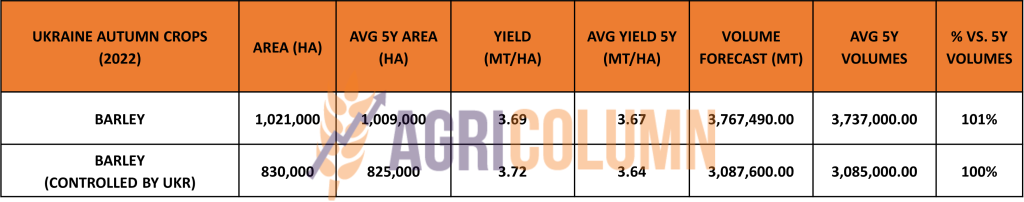
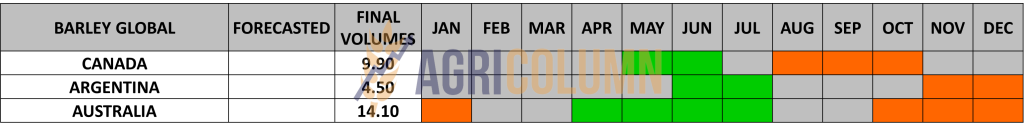
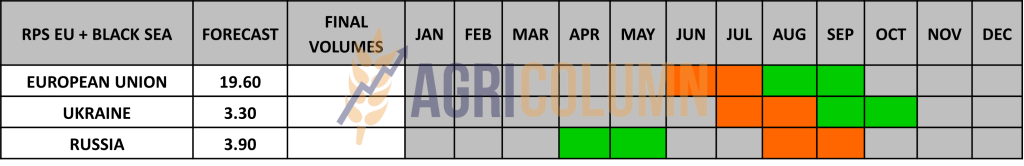
UKRAINE will generate cumulative volumes (including territories occupied by Russia) of 3.77 million tons, 1% more than the 5-year average.
THE EUROPEAN UNION increases the forecast level of the future barley crop to the level of 54 million tons. If we also take into account the countries that are not in this group, i.e. Great Britain, Serbia, Bosnia and Moldova, we will be able to add a volume of 7.9 million tons, lower than the previous season by 0.4 million tons.
MIT JORDAN purchased a volume of 60,000 tons of barley from Viterra with the delivery period September 1-15, 2023 at the price of 265.50 USD/MT in the CFR Aqaba parity. The price is 2 USD/MT lower than the previous tender and if we aggregate storage and financing costs from harvest to delivery, we have a much lower level than the previous tenders closed at 267.50 USD/MT.
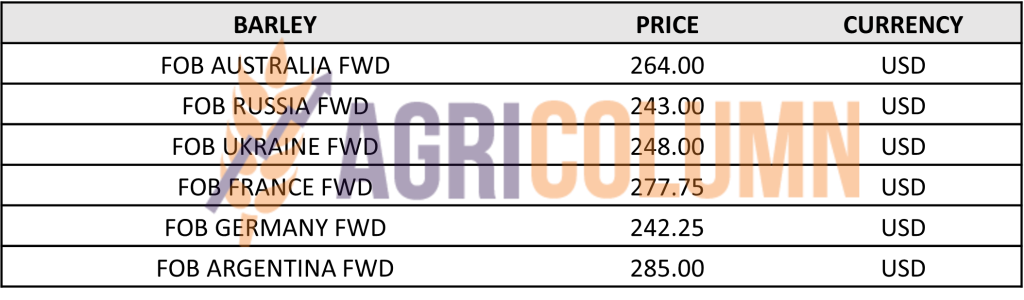
BARLEY PRICE INDICATIONS IN MAIN ORIGINS
GLOBAL STATUS
No essential changes.

LOCAL STATUS
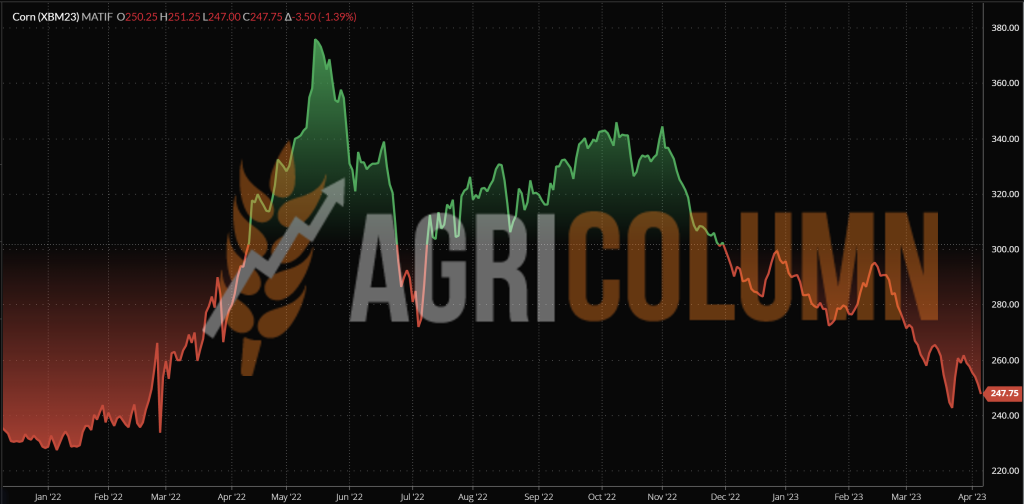
Maize remains anchored at the level of 230 EUR/MT for the goods delivered in the CPT Constanța parity. The new corn crop is valued at 210 EUR/MT, down 5 EUR/MT from the previous days.
CAUSES AND EFFECTS
The old corn crop still remains at the level mentioned above, helped by the regional context of the Black Sea basin. But we see a shift to the new crop and the effect of the NASS report on it. It will not be very long (our estimate is 40-45 days) and we will see the translation to the price of the new crop of corn, which at the level of the European Union is seen to return, even if not to the level of 2021. But the support comes from Ukraine, which will provide support in terms of future volumes.
REGIONAL STATUS
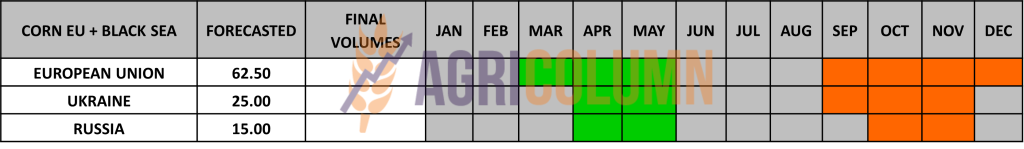
THE EUROPEAN UNION. A new harvest volume forecast comes from the European Commission, and it places the future corn crop of the European Union at the level of 65 million tons, 4 million less than the level of 2021, a landmark in terms of volume.
UKRAINE remains at the moment with a volume of corn to export of about 5-6 million tons, but difficulties continue with regard to the distribution of these goods.
POLAND prohibits the import of Ukrainian goods and will only allow their transit through its territory. It is a measure that tries to repair the local system badly affected by the volumes imported from Ukraine. We believe that it is a very fair measure and we are waiting for its application in Romania to dissipate the effects of imports of Ukrainian origin. We all understand Ukraine’s problems and are on the same side of the fence. But agribusiness systems in countries that share a common border must be protected to the same extent.
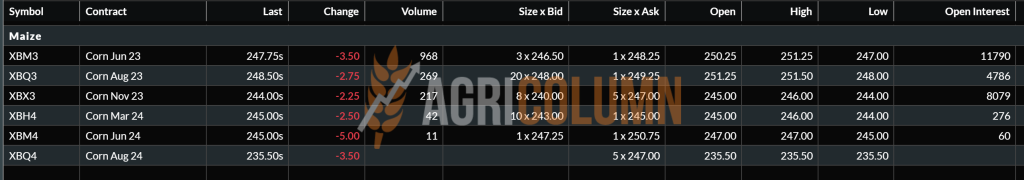
EURONEXT CORN – XBM23 JUN23 – 247.75 EUR (-10 EUR from last week)
EURONEXT CORN TREND CHART – XBM23 JUN23
GLOBAL STATUS
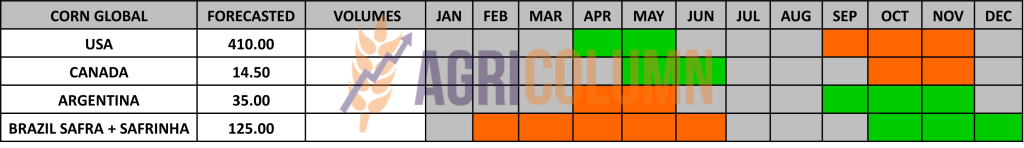
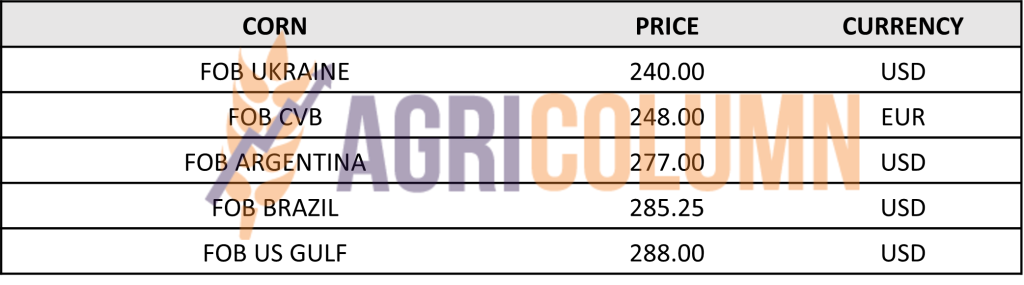
ARGENTINA does not improve the crop premise in any way, the level of 36 million tons remains stable.
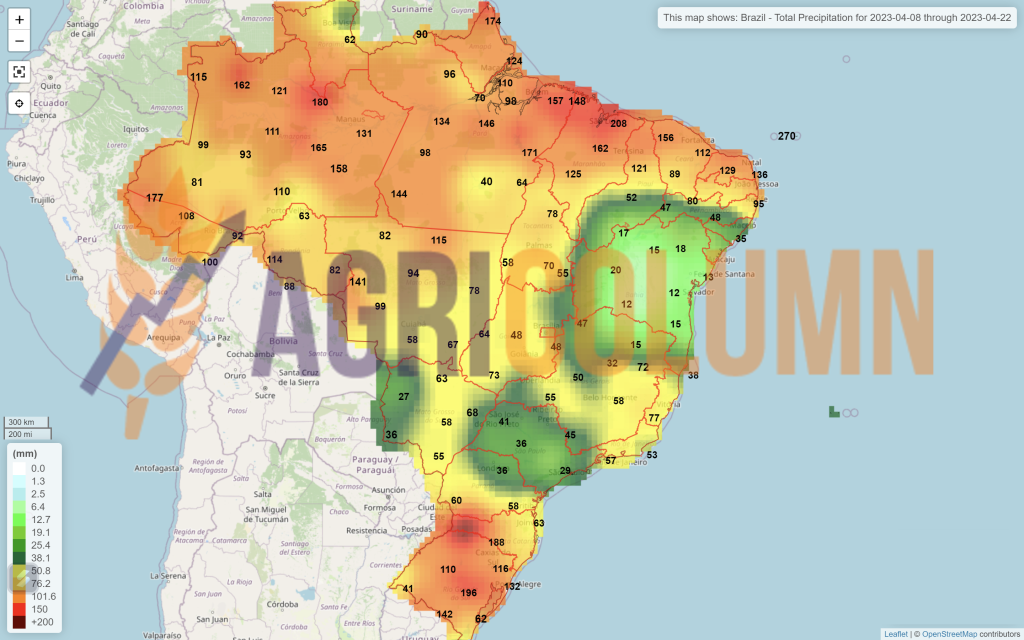
BRAZIL rises in crop forecast. With 100% planted Safrinha and adding Safra, Brazil will generate 130 million tons.
USA. The pace of planting is in line with previous years, but in certain areas, rainfall makes this process difficult. But we have no worries because we saw American corn planted in June as well, which performed very well in previous years. Water is very beneficial and this aspect is more important than the time of sowing.
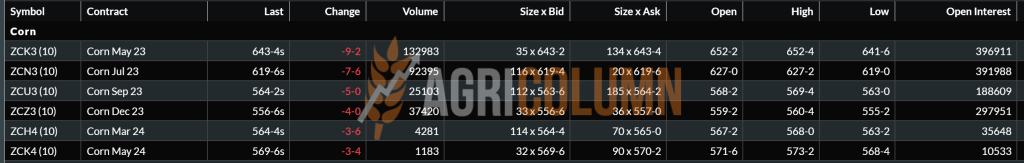
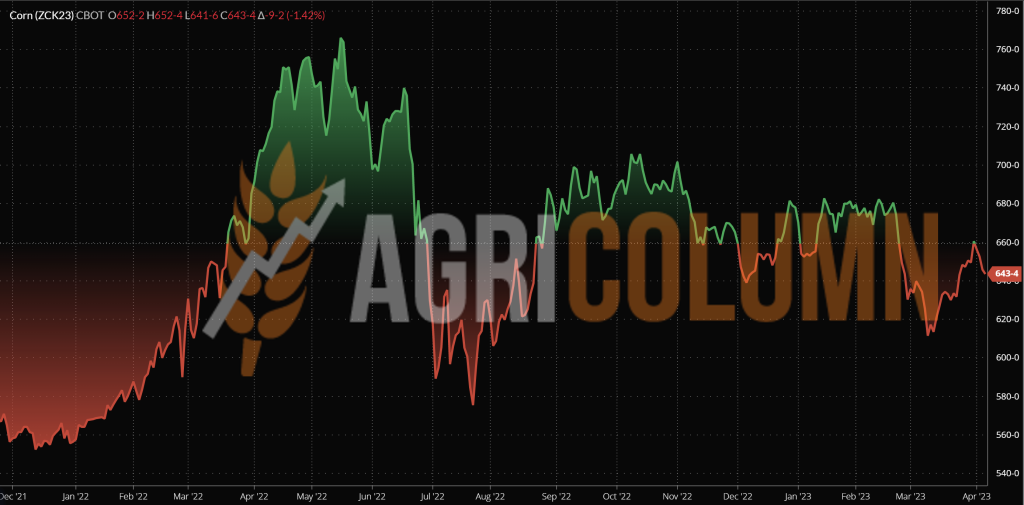
CBOT CORN ZCK23 MAY23 – 643 c/bu (-17 c/bu = -6.7 USD/MT from last week)
CBOT CORN TREND CHART – ZCK23 MAY23
CORN PRICE INDICATIONS IN MAIN ORIGINS
CAUSES AND EFFECTS – THE STORY
Corn showed an alteration in indications generated by the lifting of the Brazilian volume forecast. There’s not much going on in Argentina anymore, so we don’t find any influences from here.
As we correctly estimated, the alteration of prices starts towards the new crop, which indicates a predilection for covering volumes in the global balance. The WASDE report to be released on April 11, 2023 will confirm this and reinforce the decline in the 2023 corn crop in price terms. We could see a small pulse in the price of the old crop due to a lower inventory of the commodity in the US, but nevertheless, we do not think it is possible, as NASS has already generated the estimates and WASDE will only confirm them in turn.
At the level of global supply, no problems are indicated, with the exception of Iran, which is unable to pay for the goods purchased from Brazil, and thus, loaded ships have been sitting in Bandar Abbas harbor for a very long time. But this is an internal cash- flow problem for Iran and not a supply volume problem at all.
CONCLUSIONS
- The old crop still has support from the Argentinian disaster.
- The new crop is distancing itself in price from the old crop, with the decline in indications being dictated by forecasts from the US, Brazil and the EU.
- In about 40-45 days we will see the price move to the old crop fueled by the indications of the new crop, more precisely, after the expiration of the MAY23 CBOT and the approach to the indication of the JUN23 Euronext.
- European crop inverse is -4 EUR.
- North American crop inverse is 88 c/bu, MAY23 vs DEC23, i.e., -34.65 USD.

LOCAL STATUS
Old-crop rapeseed quotations in CPT Constanța parity are at the MAY23 level minus 40-50 EUR/MT. Subsequently, the new crop is valued at the level of AUG23 minus 40-50 EUR/MT.
CAUSES AND EFFECTS
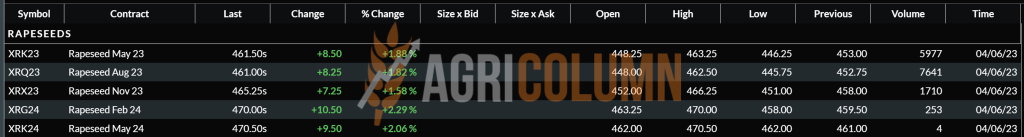
Rapeseed is conditioned by the two parameters we know very well: fossil energy quotes and the VegOil complex. Both acted accordingly and caused spikes. The indication MAY23 remains a reference parameter, because the next trend will be determined around it, once the liquidation from the speculative funds begins.
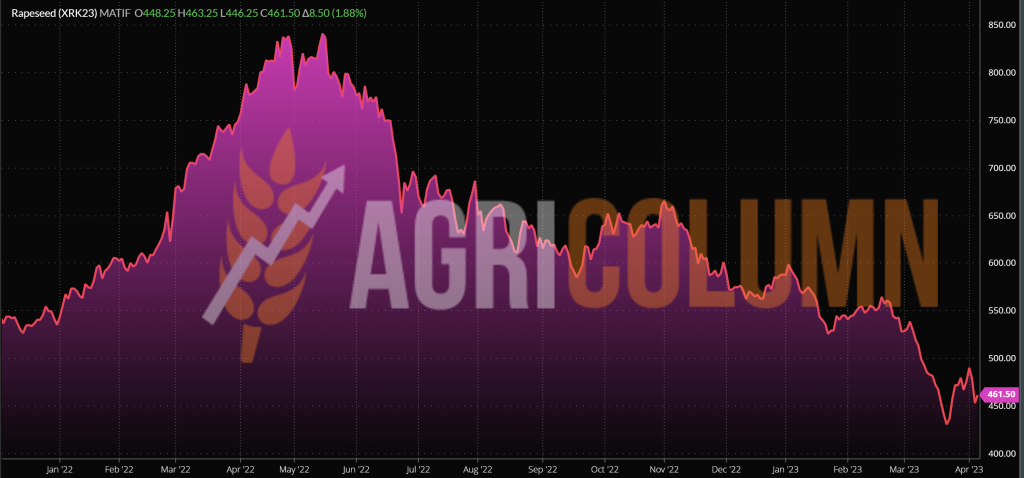
EURONEXT RAPESEED – XRK23 MAY23 – 461.5 EUR (-14.25 EUR vs last week)
EURONEXT RAPESEED TREND CHART – XRK23 MAY23
REGIONAL STATUS
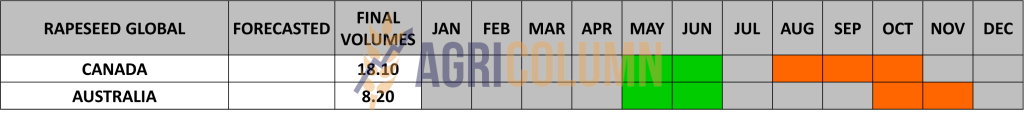
The EUROPEAN UNION boasts between two forecasted volume parameters, namely between 19.5 and 20.2 million tons. We prefer to be reserved and maintain 19.5 million tons as a parameter for where we are now because of the distance in time to harvest season.
The fragility of the previous year was fully covered by the imports made, so that at this moment, the Union has an impressive import volume, we could say, of 6.27 million tons mainly coming from 2 actors: Ukraine and Australia. Ukraine introduced a volume of 2.93 million tons into the Union, while Australia is at the level of 2.77 million tons.
GLOBAL STATUS
No references at this time, off season
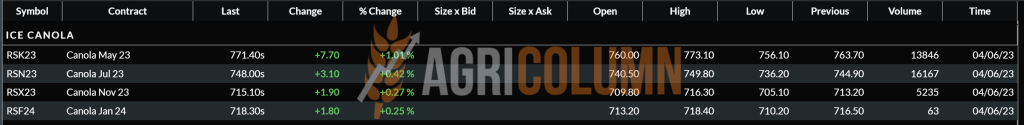
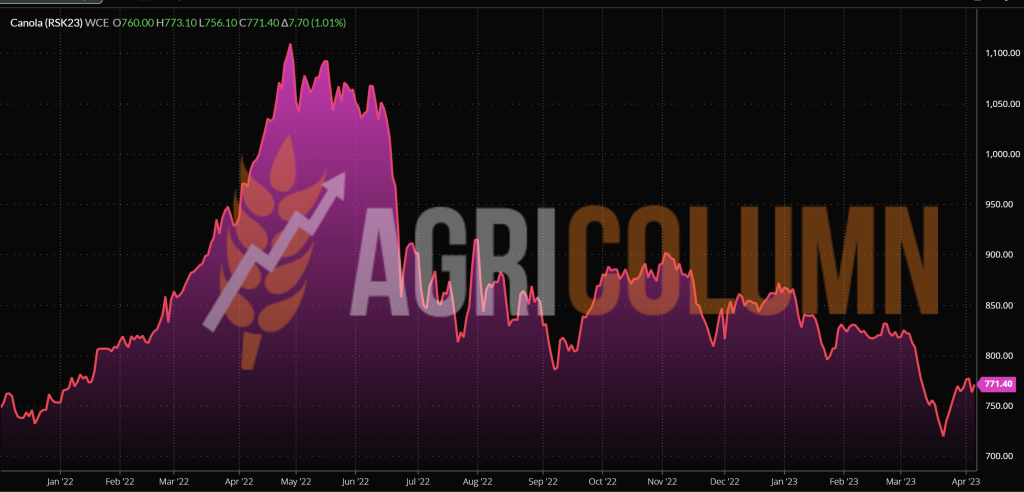
ICE CANOLA RSK23 MAY23 – 771.4 CAD (+4.5 CAD from last week)
CANOLA ICE TREND CHART – RSK23 MAY23
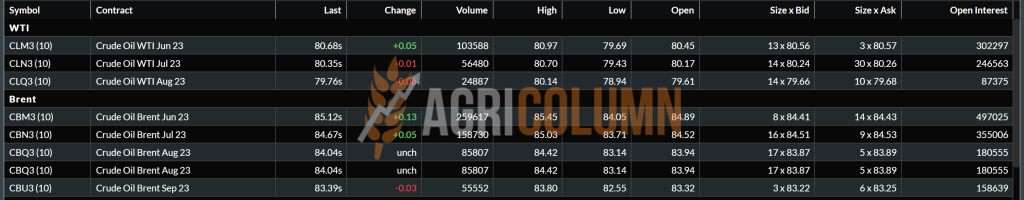
COMPARATIVE GRAPH. PETROL-RAPESEED-CANOLA CORRELATION
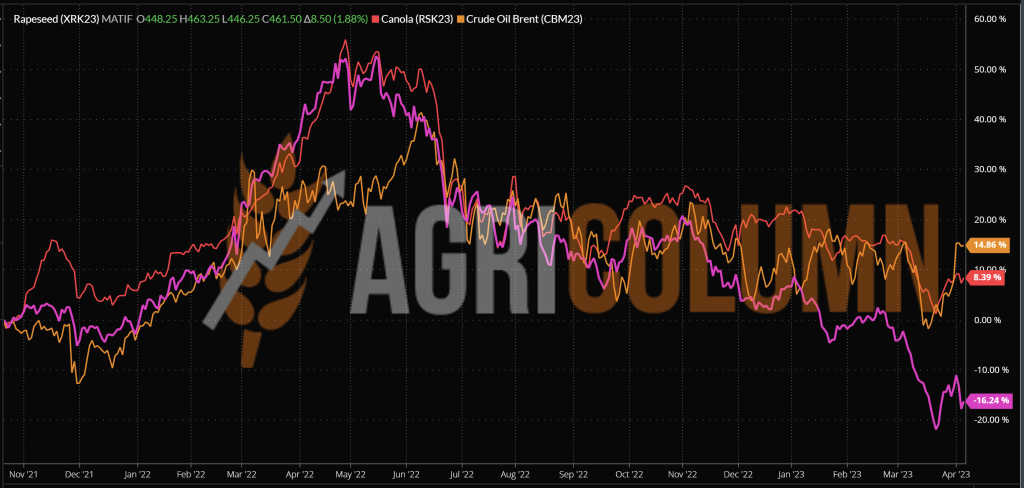
CAUSES AND EFFECTS – THE STORY
OPEC+ played by different rules and we all saw how they suddenly cut production to a level of 0.9 million barrels per day of production starting on May 1, 2023. To this figure we added Russia’s previous cut of 0, 5 million barrels. Cumulatively, we are talking about 1.4 million barrels/day of production less, starting May 1, 2023. Of the total aggregate figure, Saudi Arabia is also quoted with a decrease of 0.5 million barrels.
Thus, rapeseed gained traction and aggregated 3 days of growth, after which there was an obvious relaxation. The VegOil complex did not support this increase in oil sales and we saw how the price of rapeseed oil in FOB Rotterdam parity did not rise evenly on subsequent breakouts.
Logic and fundamentals say otherwise, which is that rapeseed production looks fundamentally good, and on top of that, due to the slowdown in global economic growth, the price of diesel is falling.
To summarize very much, we can draw the following conclusions in shorthand:
- The vegetative index is very good in the European Union and Ukraine at the moment
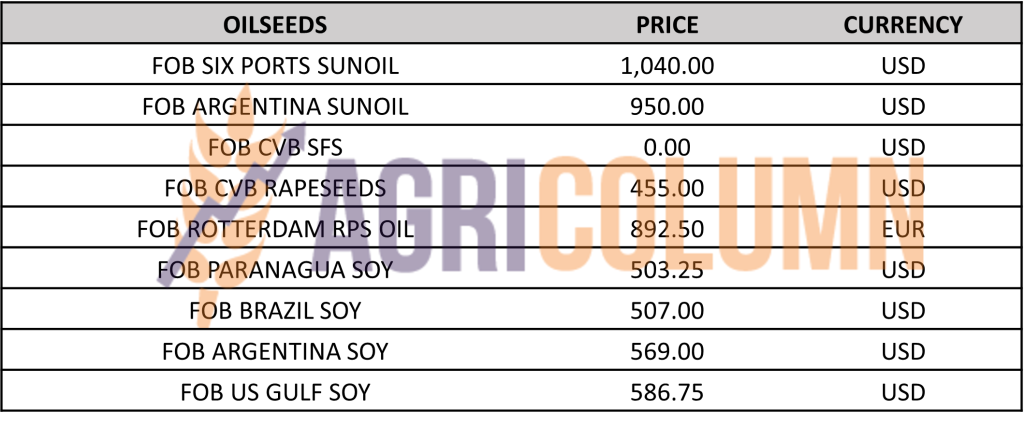
- FOB Rotterdam quotes for rapeseed oil are at the level of 892.5 EUR/MT.
- The traction imprinted by fossil energy coagulated in the Euronext indications, but let’s look with equal attention at the Canadian crop inverse. Today it is negative at 56.3 CAD or 38 EUR.

LOCAL STATUS
Port Constanța quotes sunflower seeds at 420 USD/MT.
Processors are offering 405-410 USD/MT at DAP parity processing units.
CAUSES AND EFFECTS
The 10-15 USD/MT spike was generated by the effect propagated through soybean oil in the VegOil complex. Otherwise, nothing wants to support sunflower seeds. Buyers’ indications are reserved due to the raw material coverage that the latter have up to the threshold of annual overhauls.
REGIONAL STATUS
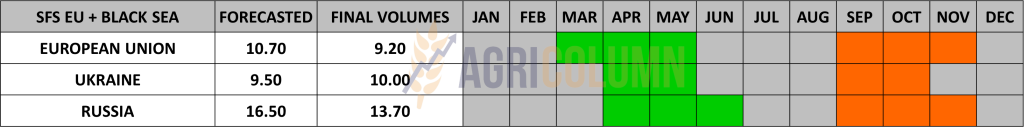
UKRAINE. The level of seed export reached the value of 1.8 million tons, with a significant weight to the European Union and, more precisely, a volume of 1.75 million tons.
RUSSIA. No substantive changes, just statements claiming that if they remove the tax, they will crash the oil market in the Black Sea basin, so they won’t do it in any form.
GLOBAL STATUS
ARGENTINA is fast approaching the completion of the sunflower seed harvest and the final result will be around 3.7-3.8 million tons.

PRICE INDICATIONS FOR OILSEEDS AND CSFO IN MAIN ORIGINS
CAUSES AND EFFECTS – THE STORY
For obvious status reasons, we maintain the same conclusions:
Sunflower seeds have entered the last stage of their life cycle, from a price point of view. And with all the support provided by palm oil and subsequently soybean oil, sunflower oil has not been able to capitalize much. SIX PORTS indications are back in the 4 digits ie 1,050 USD/MT. In the Black Sea basin, we have the same dormant state, with low demand and few buyers. What is on the horizon? The new sunflower seed crop is now being sown and there is a clear migration in the spring crop rotation to sunflowers across Europe. This state of affairs is the farmers’ response to climate change. Fears of drought and excessive heat have caused interest to shift to sunflowers. Naturally, the conflict in Ukraine also potentiated this, with past price levels generating emulation in the seeding ratio change.
But things are not the way many farmers in the Northern Hemisphere thought because the sunflower acreage has been boosted and therefore the harvest forecast will be more generous.
I identify, Ukrainian farmers will sow more sunflowers, more precisely with about 600,000 hectares more. And this will generate a crop surplus of at least 1.2 million tons, a volume which, under today’s conditions, with a Corridor likely to be restricted and strangled by Russia at Istanbul at any time, will make way for the transfer of raw material through the channels we are already used to, i.e. through the neighboring countries of Ukraine, Romania and Bulgaria. And this aspect will create an already existing pressure on the price.
Today, crude oil prices are at 880-920 USD/MT in the Black Sea basin FOB parity, with competition from Russia and Turkey, which is removing its export duties on crude oil in an attempt to capture the operational margin from processing, the so-called crush margin. They want cheap seeds from Ukraine for domestic processing and value-added export. In today’s conditions, where the support from Vegoil has not helped much, logistics will operate the price of the raw material, as a higher level of oil will act on the price of the goods and in the origin and the supply chain.
But the farmers’ account will also be paid. In other words, the new crop could find itself under pressure from commodity and crude stocks that have not yet found their destination.
In the next period, there are no strong enough reasons for the price to rise. The month of April will be one in which farmers sow and religious holidays will fragment the time with breaks.

LOCAL STATUS
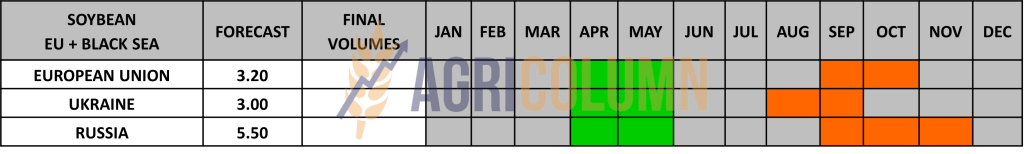
In Romania, the price indications for soybeans are at the level of 4770-475 USD/MT, DAP processing units for non-GMO soybeans.
Between July 1, 2022 and April 2, 2023, approximately 194,000 tons of soybeans were imported.
REGIONAL STATUS
THE EUROPEAN UNION. Weekly soybean imports into EU countries were 149,042 tons. Total soybean imports rose to 9.08 million tons, but this is 14% less than the same period last year.
Weekly EU soybean meal imports were 268,767 tons. Thus, total imports reached 12 million tons.
GLOBAL STATUS
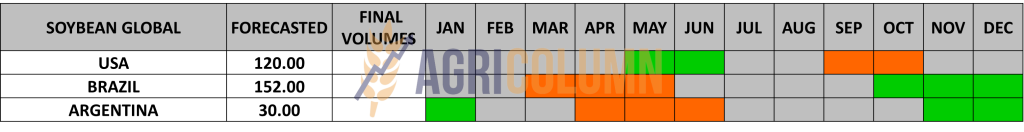
Brazil along with the US and Argentina accounted for 82% of world production and 91% of world exports in 2021/2022, according to the USDA. Brazil is the main exporter during and after the harvest of its first crop, especially between March and June, and the US takes the lead when its crop reaches the ports, between September and December. Argentina processes most of its production along with about 4 million tons from Paraguay and is the world’s largest exporter of soybean meal and oil.
USA. Total US soybean export inspections since the start of the 2022/23 marketing year have reached 45.4 million tons, up 2.8% from the previous year, according to data from the US Department of Agriculture (USDA). Prices in Brazil may lead to the idea that the US could lose a good portion of old-crop demand in several key markets. The USDA has not forecast major increases in US soybean acreage for 2023/24, and this factor could contribute to strengthening Brazil’s export market share at the expense of the US and any additional headwinds in terms of losses from conditions US weather further strengthens Brazil’s prospects for gaining market share.
ARGENTINA. The estimate for the 2022/2023 soybean crop is 24.8 million tons, compared to the 31.4 million tons previously predicted, 42% lower than last year’s crop of 43 million tons. The figure brings projections down from the 25 million tons expected by the Buenos Aires Grain Exchange and the 27 million tons seen by the Rosario Grain Exchange (BCR). Due to the historic crop loss, the processing industry will need to import more soybeans from Paraguay, Uruguay and Brazil (about 8-12 million tons) to keep factories running and honor commercial contracts and financial obligations. And even so, processed soybean production is expected to fall from 38-42 million tons per year to 30 million tons due to lack of inputs.
BRAZIL. Soybean crop estimates are increasing as follows:
- Safras & Mercado: 155.08 million tons, against the previous projection of 152.4 million tons.
- StoneX: 157.7 million tons, 3 million tons more than the previous projection.
- Conab will update its projection in the coming days. In March, Conab’s projection was 151.4 million tons.
The higher projections were driven by higher planted areas expected for 2022/2023, up 4-7% from last year when Brazil had 42.3 million ha of soybeans.
CHINA. In terms of global demand, China is the world’s largest soybean importer and is responsible for 58 percent of total imports in 2021/2022 and 2022/2023, according to the USDA.
And this year, the key to a balance between global supply and demand is China, which still has a negative domestic processing margin. Lack of demand from China could make it difficult to sell Brazil’s record crop and, by implication, build up very large ending stocks.
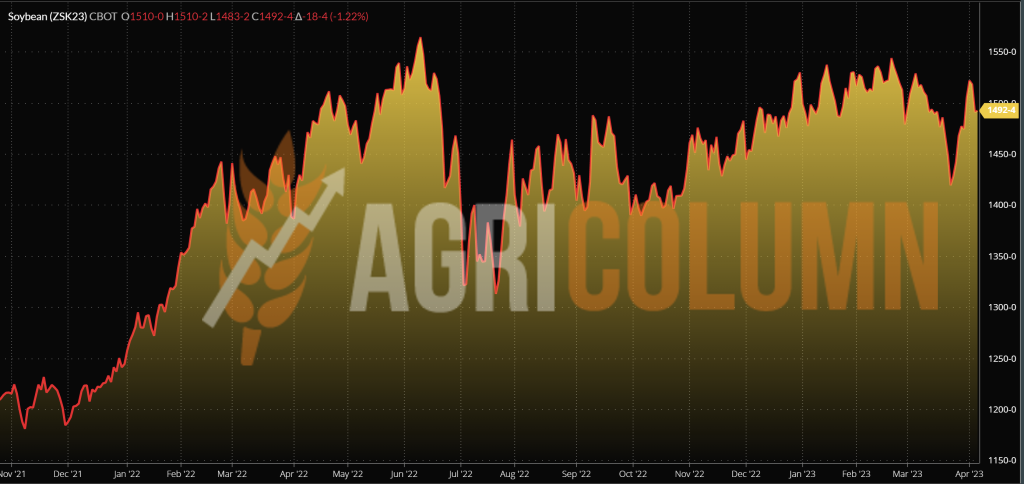
CBOT SOYBEAN ZSK23 MAY23 – 1,492 c/bu (-12 c/bu = -4.4 USD/MT from last week)
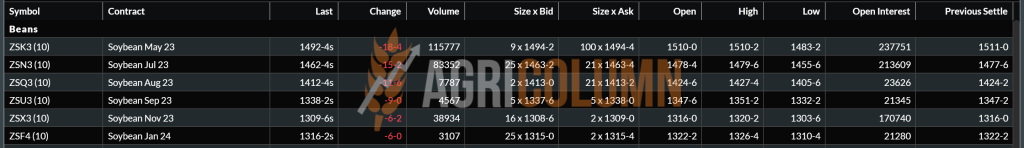
SOYBEAN TREND GRAPH – ZSK23 MAY23
CAUSES AND EFFECTS – THE STORY
Soybeans lost 4.4 USD/MT during the week. It took part in the spike generated by the increase in oil prices, but the evidence that it was only a tension exploited by the speculative funds was observed by the decrease on the platform towards the end of the week.
Soybean quotes are holding on to the same background, namely the disaster in Argentina. But as the US seedings are completed and the new crop is definitely on the horizon, along with Brazil’s fabulous crop, the trend will be one of realignment in line with the new crop indications, where we see a negative inverse of 183 c/bushel, which is 67 USD/MT.


EXTRA

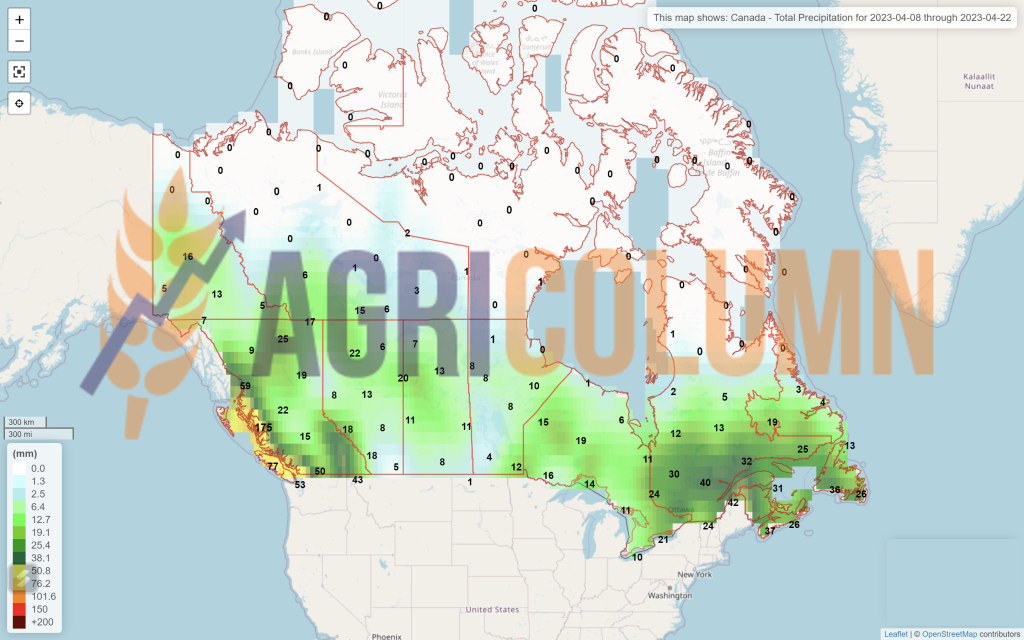
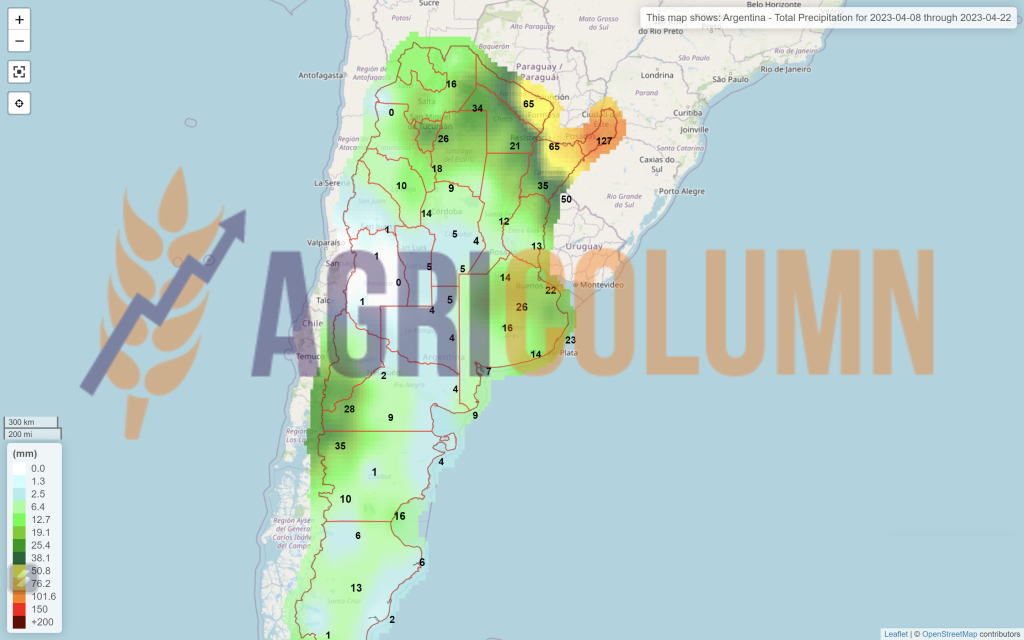
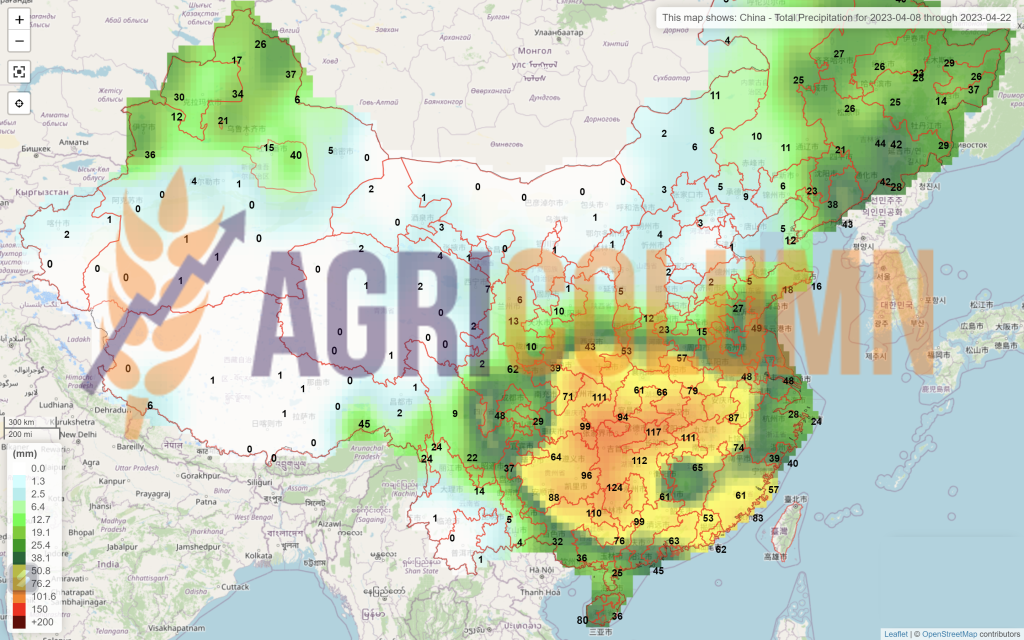
8-22 April 2023
Romania

Europe
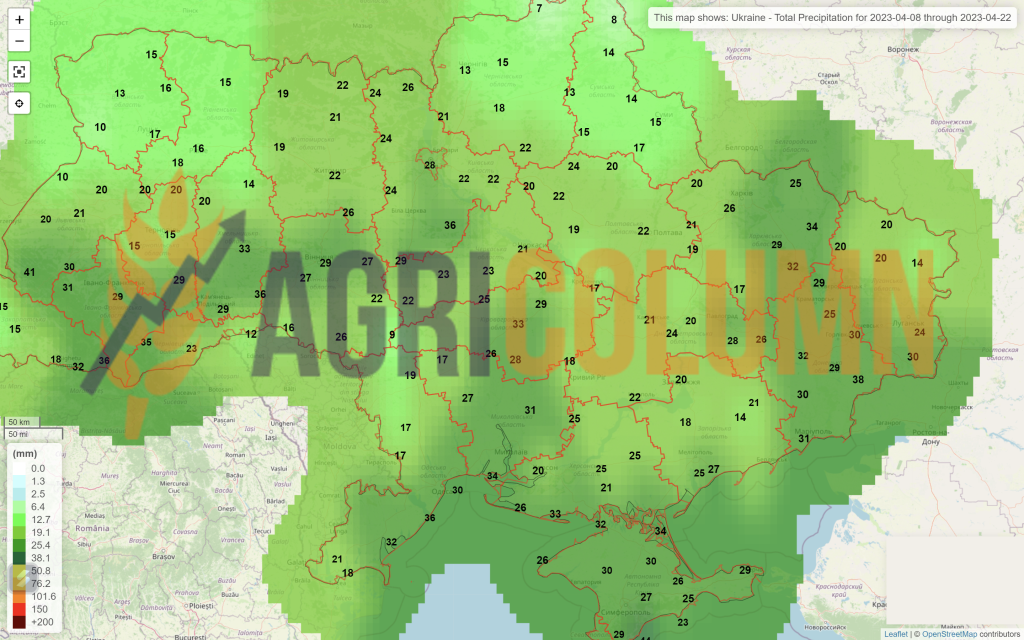
Ukraine
Russia
Canada
USA
Brazil
Argentina
China
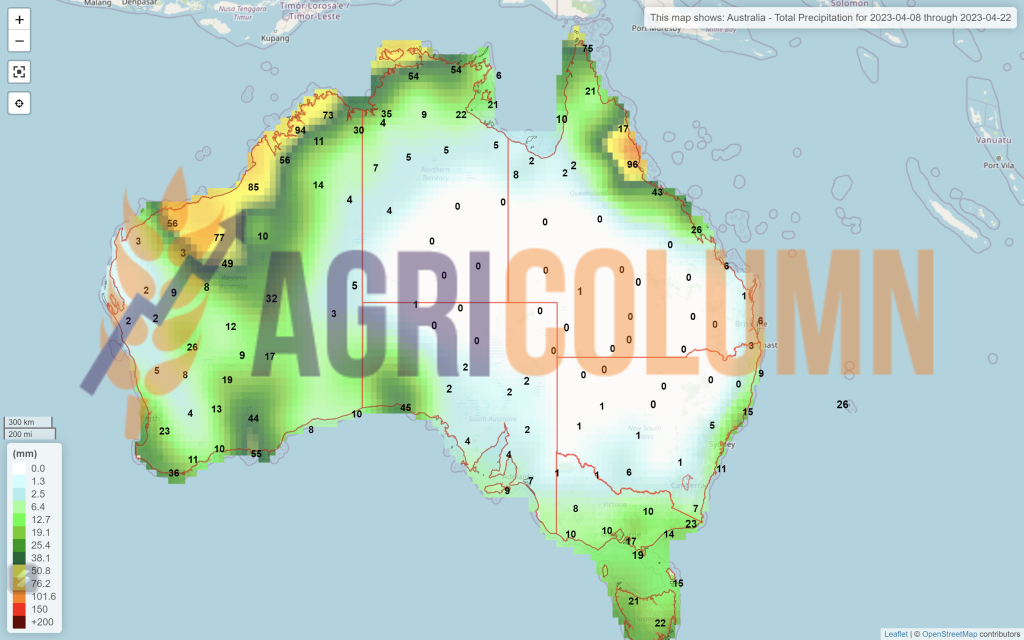
Australia