This week’s market report provides information on:

LOCAL STATUS
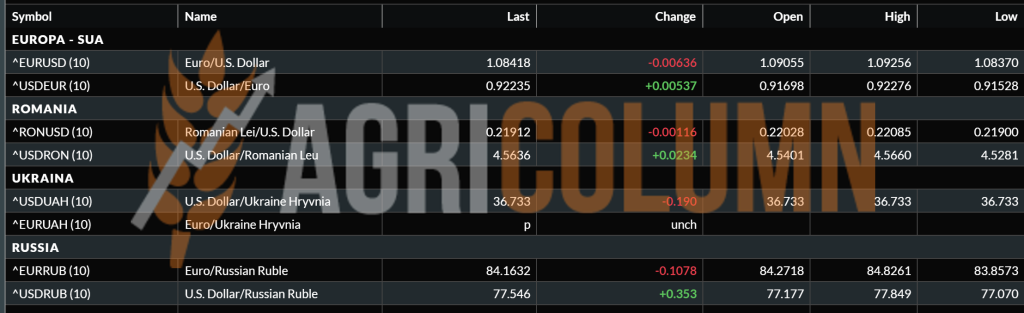
The indications of the Port of Constanța are, depending on the buyer, in a margin of 238-242 EUR/MT in CPT parity. Naturally, the discount for feed quality is 10 EUR/MT, although Black Sea’s quotes are more generous with these specifications.
The new wheat crop is valued around the same price level, with an upper limit set at 242 EUR/MT and with a much reduced discount for feed quality, i.e. a minus of 6 EUR/MT, both indications having parity as a reference CPT Constanța.
Hoisting or fobbing costs, as they are also called, are in the region of 10 EUR/MT, with one or two exceptions, where the companies that own these export terminals run only at their operational cost, without accounting for them as hubs of profit for the consolidation of profit in the price difference between buying and selling, i.e. between origin and destination. This procedure is used to consolidate the final profit in a residence other than Romania and generates an operational factor, i.e. covering costs (operational and personnel). In the end, this aspect is less important. What really matters is the lifting or fobbing indicator set at 10 EUR/MT.
CAUSES AND EFFECTS
Time passes and clearly penalizes the Romanian wheat crop that has not yet been exploited. It’s like a timer, if you will, counting down the time left until the new crop, and as we’ve mentioned in past issues, ending stocks will clearly influence prices in the near future.
The route for the early season of the 2023 wheat crop began with the premises that I recall here, of a lack of tenders in the months of December 2022 and January 2023, an undoubted sign of depressed prices. We have kept these indicators in mind and as seen today, they are already normalized. To all this will be added the remaining stocks and the harvest pressure, which we all know too well.
The clock is already ticking, like a countdown, and April 2023 will be one in which farmers will focus on sowing spring crops. This, associated with the Christian, Catholic and Orthodox religious holidays, will make the trade not have an extremely high weight, implicitly we will see the fragmentation of the time in the last period before the harvest. And we have the following milestones: 7-10 April 2023 Catholic Easter, followed by Orthodox Easter between 14-17 April, after which the traditional celebration of Labor Day, which will in turn create another break, between 28 April 2023, which marks the beginning of the weekend, and continuing as a bridge with May 1 and 2, 2023.
REGIONAL STATUS
RUSSIA indicates price support through the well-known manipulation techniques we are already used to. It’s a pity that the Artificial Intelligence represented by the trading algorithms do not have enough computing power to understand. But surely their setup is approved by the hedge funds that profit from these headline manipulation moves.
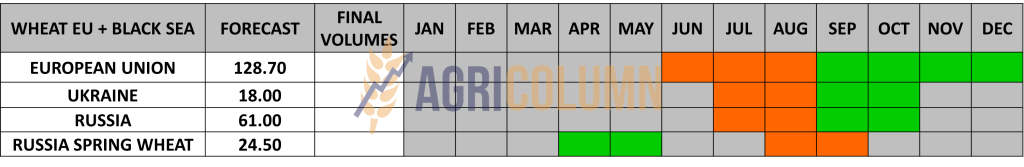
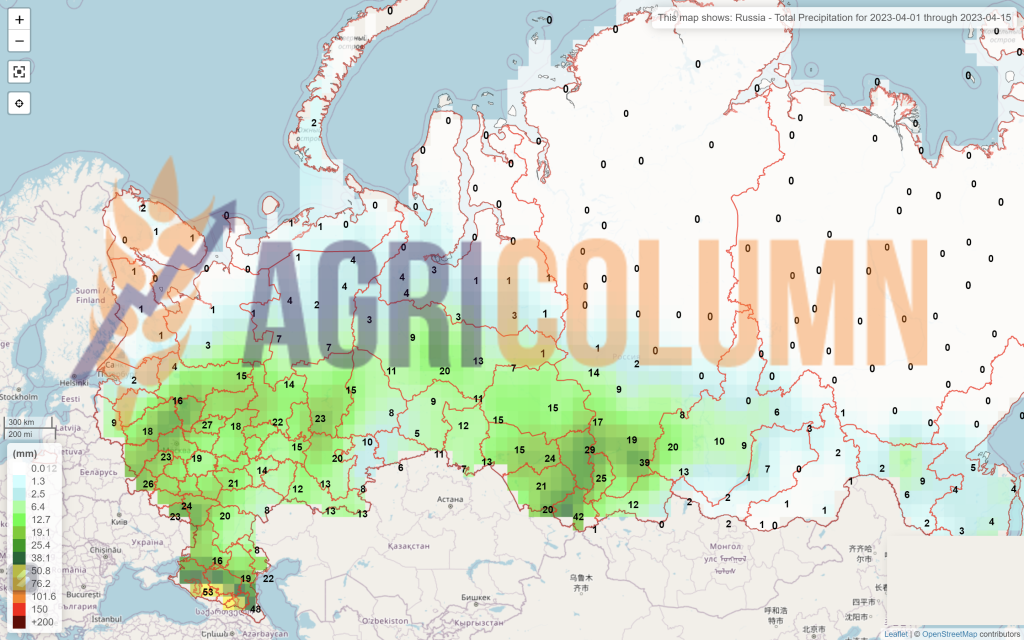
The new Russian wheat crop is in good condition, although a few weeks ago the same moves were trying to induce the idea that they will suffer volume compression. The volume indication was revised positively by fair market players 2 days ago by 1.5 mil. tons, which brings us to a potential of 82.5 mil. tons, in line with a traditional Russian average of previous years.
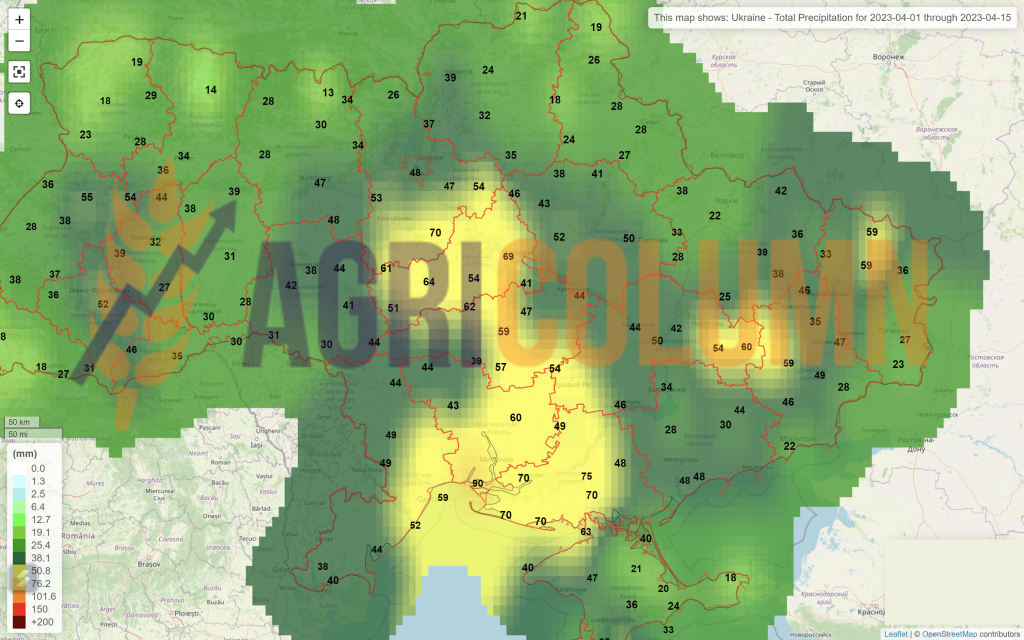
UKRAINE is also in the spring wheat sowing season. The state of the crops sown in the fall is good and we maintain the forecast of 18-19 million tons for the 2023 season. And here we will have an excess of unsold cargo from the 2022 season, with all the abuses of Russia in the south of the country, from where it appropriated approx. 10 million tons. Thus, we will have an aggregate volume, unsold stocks and new crop around 22 mil. tons and, implicitly, an export level of 14 million tons.
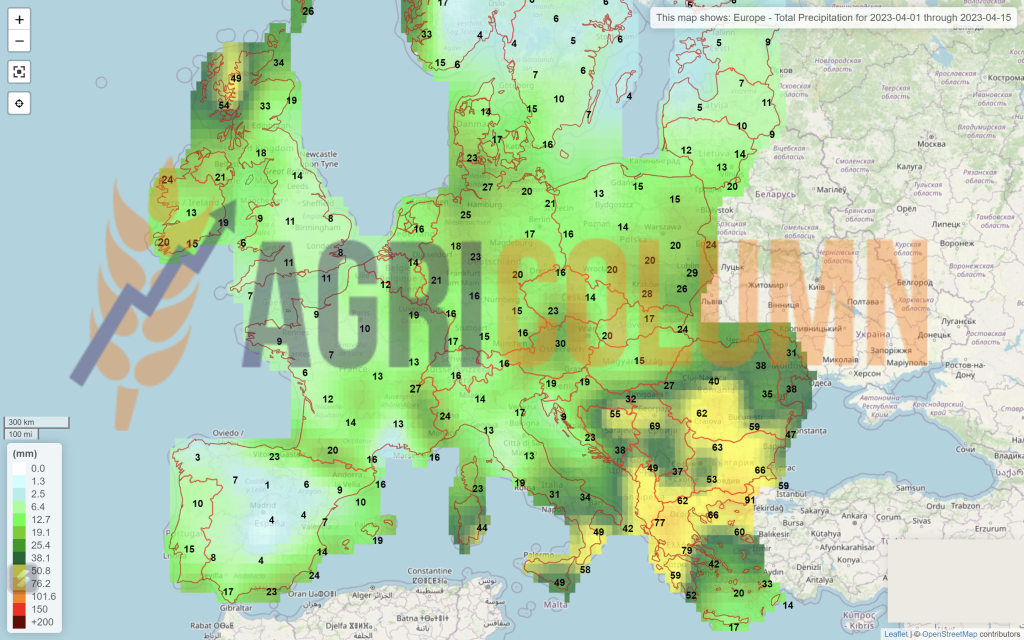
The EUROPEAN UNION is doing very well at the moment. Rainfall covers the territory of the European Union and the crop is clearly visible on the horizon. The volume assumptions for soft wheat will approach the figure of 129-130 million tons, which represents a surplus of 4-5 million tons compared to the previous crop, which was penalized by the pedological drought of the past season.

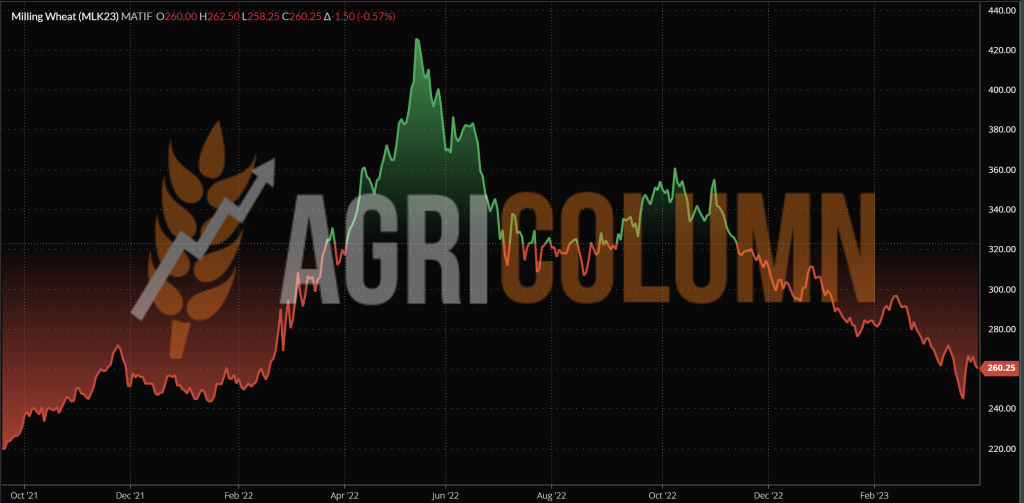
EURONEXT – MLK2323 MAY23 – 260.25 EUR (+1 EUR from previous week)
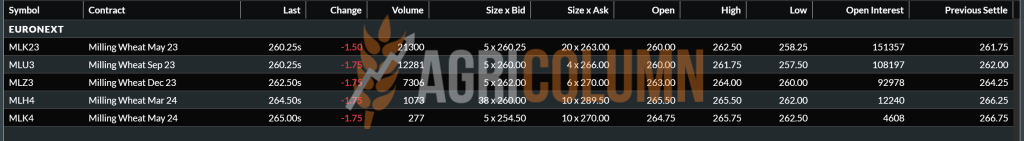
EURONEXT WHEAT TREND CHART – MLK2323 MAY23
GLOBAL STATUS
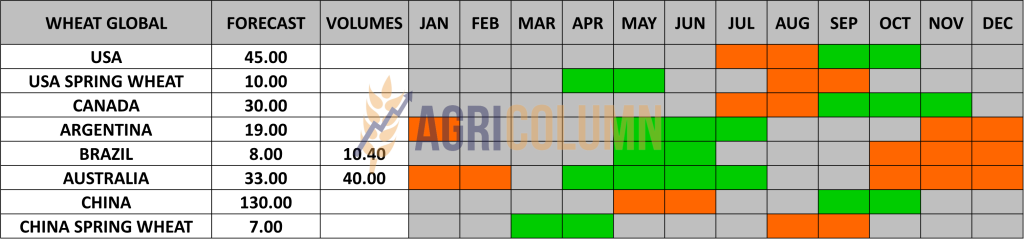
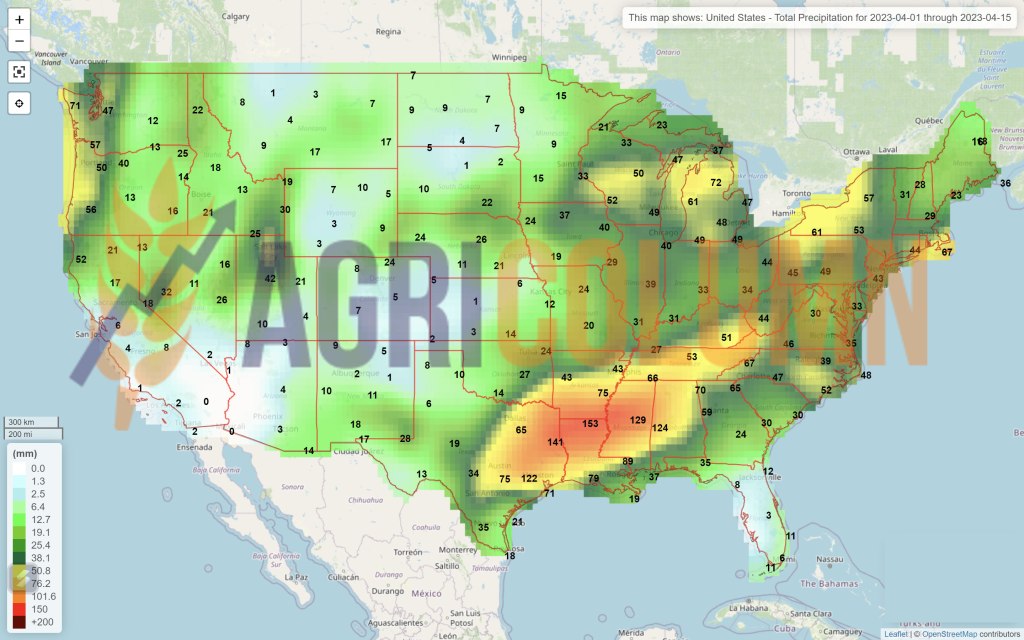
USA. The NASS report made substantial changes, with total North American wheat acreage up 9%. We have a total area of 20.19 million hectares, against the forecast of 18.52 million hectares. Translated into production, the US will generate an additional 5.35 million tons, having the benchmark of 3.2 tons/hectare as a multi-year average. Also, the NASS report generated a much lower volume of stocks compared to March 31, 2022 (by 2.25 million tons). At last year’s report, the US had a level of 28 million tons, and now it has decreased to the level of 25.74 million tons.
INDIA is reducing its crop potential by 1-2 million tons from the initial 112 million tons. Thus, the export restriction will continue to be maintained. But what we have to keep in mind is the multi-year average of the volume produced by India, which is quoted around 108 million tons, and 110 production potential is in the traditional margin. Consumption could, however, be at a higher level, due to the increase in the domestic birth rate.
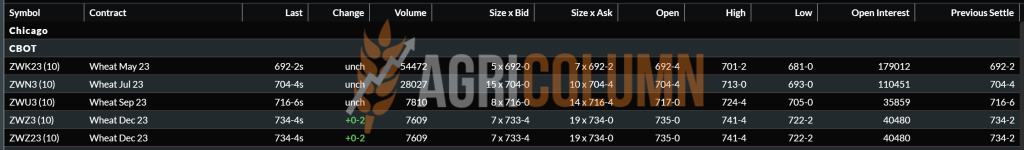
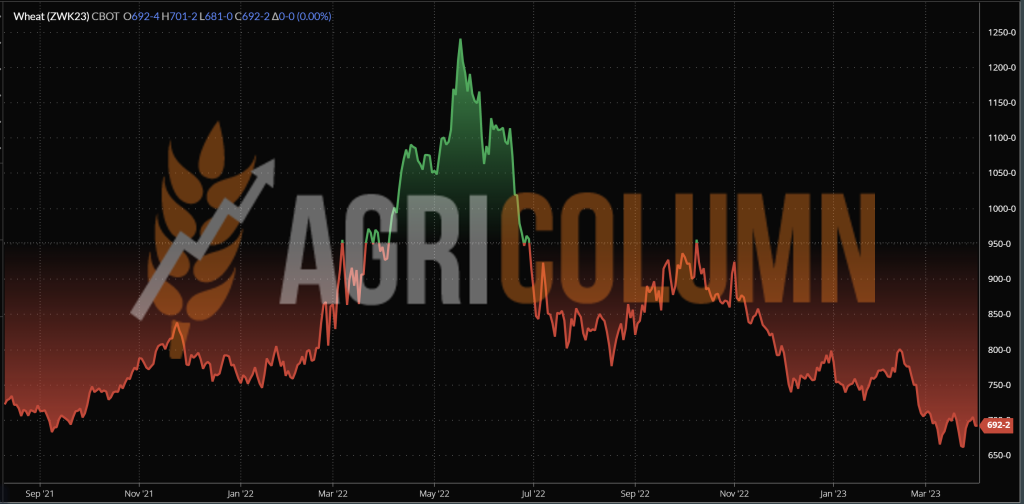
CBOT WHEAT – ZWK23 MAY23 – 692 c/bu (+4 c/bu vs last week)
CBOT WHEAT TREND CHART – ZWK23 MAY23
TENDERS AND TRANSACTIONS
TMO Turkey closed the tender for the purchase of 695,000 tons, refusing 300,000 originally purchased. The price was the main motivation as well as citing the reason that the weather will prove beneficial in the coming period for Turkey’s wheat crop. The classic “hand to mouth ” is fully active in this transaction as well.
The goods are predominantly of Ukrainian origin, with Nibulon spearheading sales, but also with other Turkish companies active in the Ukrainian operational theater. The purchase average of the 395,000 tons is 290 USD/MT in C&F parity, with an estimated freight cost of 20-22 USD/MT, taking into account the small size of the ships in terms of transport volume, as well as the distribution of Turkish ports, small and many.
But what is interesting to note is a factor related to the delivery period, which emerges from the overall 60-day extension of the Grain Corridor announced by Russia. I think we all understand that Russia will not oppose Turkey and extend this Corridor even after the expiration of the 60 days in May. Turkey’s ultimate argument is the Bosphorus, and I think it is an extremely accurate argument.
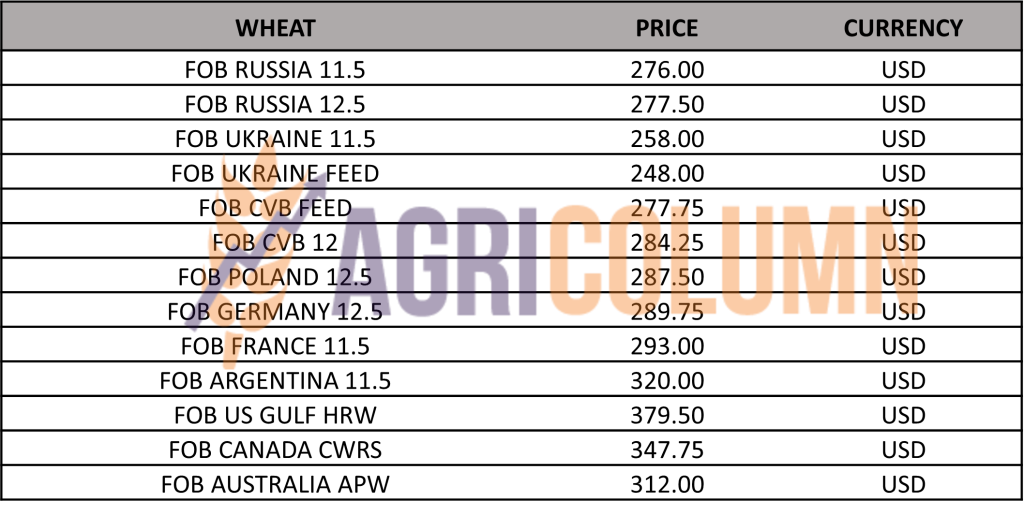
WHEAT PRICE INDICATIONS IN MAIN ORIGINS
CAUSES AND EFFECTS – THE STORY
Not a week without news. It is effectively a speculative game that animates market players. And, as we pointed out in the previous issue, everyone enjoys the speculative fruits created by the headlines. The week we ended generated new spikes on CBOT and EURONEXT generated by “official” or unofficial announcements about the exit from the Russian operational market of the global giants.
As we well know, the first to quit the Russian processing market was Bunge, a few months ago. Now, Cargill, followed by Viterra, will leave the Russian operational field from the beginning of the 2023 season, more precisely from July 1, 2023. ADM is waiting and still evaluating, but we assume that they are negotiating intensively with Aston to get out of the Joint-Venture that binds them. Will Dreyfus follow? Everything is possible, but we do not assume the same about COFCO, knowing the close relationship between Putin and Xi.
What does this actually mean? The Russian dream of operationally nationalizing grain export is being formalized. A wish expressed publicly in the summer of 2022, a working premise that I settled on at that time, is now coming to fruition. Thus, the assets of those mentioned above will be transferred to Russian national companies and the first to arrive at the table is, of course, Uralchem, a crony of Putin and, implicitly, a supplier of capital for the Russian war machine.
These assets are built to Western standards and will be absorbed by Russian companies at ridiculous prices. The commercial teams of Cargill, Viterra and those that will follow are Russian par excellence, as are the logistical and operational ones, so the transfer will be a very easy one, by incorporating and taking over the assets and personnel already affiliated.
We clearly see the exit of the giants from the Russian operational theater, where, in fact, the largest operational margins were accumulated, namely in Origination, Logistics, Execution and Transboarding (Fobbing). There was and is, always, anywhere in this world, the biggest margin.
Thus, we will see these giants lined up on the FOB Russia theater to buy Russian cargo volumes, namely in NTTK, i.e. Novorossysk, Tuapse, Taman and Kavkaz. They will be effectively fence lined. Looking at the opposite side of the table, we have to admit that Russia will not have an easy life in this endeavor either, for several reasons:
- Their carrying capacity is undersized and the announcement that they will order 61 Bulk vessels High Capacity Carrier indicates exactly that. From word to deed, there are at least 3 more years until the first batch of ships could leave the factory and enter operational mode.
- The shipping sanctions make the Russians vulnerable and they must consider selling FOB NTTK to multinationals now driven from the domestic theater of operations very seriously.
- The reputation of Origin is another parameter that will create pressure and difficulties for Russia in this attempt at operational nationalization. If the Seller is a Russian company, it will have to generate a serious discount in order to compete.
- The group of FOB buyers could create additional pressure through a price concert, which will weigh on Russia and its volumes.
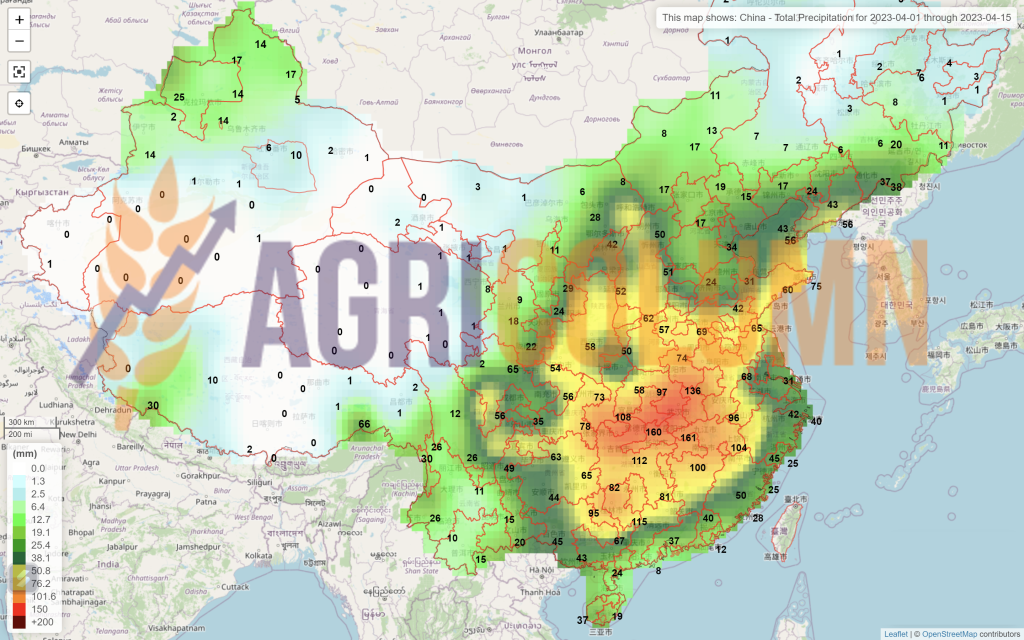
- Russia’s “friendly” destinations do not in any way cover the export level of Russian wheat. China buys about 10 million tons of wheat annually, but even they are not naive enough to put all their money on a single number, like in a casino. So they will distribute the risk towards dissipation.
- The rest of the Russian destinations, apart from the dubious transactional ones, for example Syria which is fueled by stolen goods from Ukraine, will also not want to put all their money on a single number and will diversify the Origins to dissipate the risk.
- If Russia thinks it will blackmail the world through operational nationalization, it is wrong, as usual. They will accumulate inland margins, but will have to sell and, by default, align.
Returning to the present, the euphoria created by this news gave way to stock market speculators, who created the bullish wave. And we’re talking now about the CBOT, which has been more vehement than ever. The excitement was speculated for 2-3 days, and then, in classic pattern, profit taking occurred, the decline being augmented by the NASS report. A larger area planted with wheat by 9%, thus a higher crop potential of 5.35 million tons, counterbalanced the negative difference in stocks YOY (year on year) of 2.25 million tons.
Because the global balance points to good crops at the moment, to which are also added stocks that will remain unsold. Going from east to west, we view the following stocks that will remain and cross over into the new crop:
- Russia 15 million tons,
- Ukraine 4 million tons,
- Romania 1.5 million tons,
- Bulgaria 1.2 million tons,
- Germany 1.8 million tons.
And we think the enumeration is enough. So we already have a surplus of 23.5 million tons in the wheat product. The physical fundamentals will take precedence over the speculative factor, and the alternations will be generated only by Weather and Geopolitics.

LOCAL STATUS
Price indications of feed barley are around 200-205 EUR/MT in CPT Constanța parity. The new crop is valued in the same price range, the aid generated by wheat being clear and indisputable.
REGIONAL STATUS
UKRAINE is in full sowing season and they have reached a level of over 300,000 hectares sown so far.
THE EUROPEAN UNION is at a forecast level of the future barley crop higher than the previous one by 1 million tons for the EU-27 as a whole, of 52.5 million tons. If we also take into account the countries that are not in this group, i.e. Great Britain, Serbia, Bosnia and Moldova, we will be able to add a volume of 7.9 million tons, lower than the previous season by 0.4 million tons.
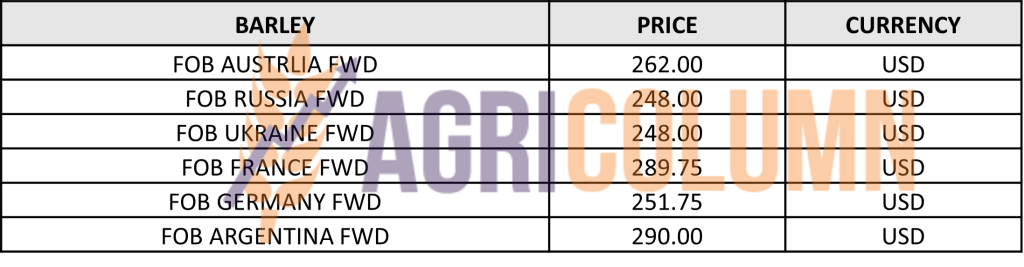
BARLEY PRICE INDICATIONS IN MAIN ORIGINS
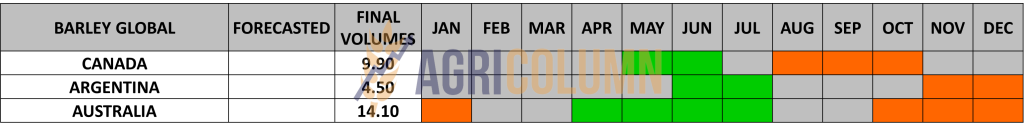
GLOBAL STATUS
No essential changes.

LOCAL STATUS
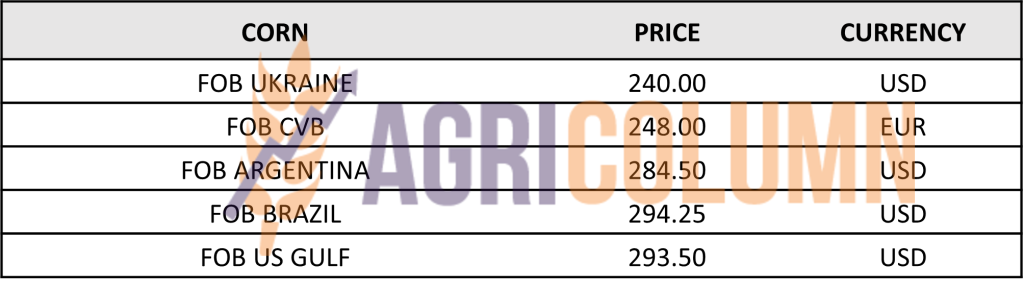
Maize is quoted at the CPT Constanța level at levels between 230-233 EUR/MT. The fobbing indication is the same as for wheat, namely 10 EUR/MT.
The new corn crop is valued at 215 EUR/MT, which represents a negative premium to Euroenxt NOV23 of 35 EUR/MT, i.e. the Basis.
CAUSES AND EFFECTS
The old crop corn (OC = old crop) still has support. Stock and weather factors, plus demand from China, are positioning the corn price for the next period and we may even see positive developments, not very big (due to the competition with Ukraine), but on the order of 3-5 EUR/MT.
In Romania, the seeding process is in full swing. I have even visualized a change in approach to seeding time. Some farmers in southern Romania started at the end of February, trying to convert to advantage the permissive weather and the existing soil water reserve in the premises of a dry and potentially hot summer.
Globally, you will all notice a change over the next 10 years, namely an increase in the area devoted to wheat, at the expense of corn. This is due to global warming and the effect of drought and extreme heat during summer. This process will come undetected, along with the movement towards a much earlier sowing season than before, for the reasons expressed above. Genetics will, in turn, support this trend of an early sowing season, along with a shorter growing season. So we predict a decline in late hybrid corn within 10 years from now.
REGIONAL STATUS
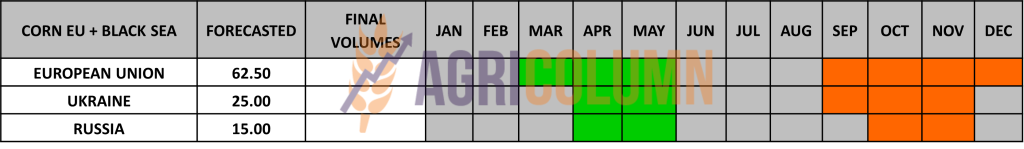
THE EUROPEAN UNION. Volume forecasts for the upcoming corn crop are somewhat bleak despite posting a note that they will be 10 million tons higher than the previous season. Of course, it does, but it perhaps knowingly omits the drought and heat that decimated European corn last season, reducing it from 69 million tons to just 52.5 million tons. Next season’s projection is quoted at a level of 62.5 million tons, which is indeed higher than the previous season, but is at the same time 10% lower than the 2021-2022 season. Support at European level will inevitably come from non-EU countries, which are quoted at a level of almost 9.5 million tons. The exponent of this group is Serbia, which will generate a production of at least 7.5 million tons.
As for the pace of imports at the level of the Union, it is no longer so sustained, the level of 20.4 million tons is similar to the previous week and, naturally, it is 69% higher than that of the previous season. Export also remains at the level of 1.8 million tons, 63% lower than the previous season. From here we distinguish Romania, with an export level of 1 million tons recorded up to this moment.
UKRAINE has exported in the last 9-10 months a volume of 22.5 million tons of corn, and the premises for the new crop are that the area allocated will decrease in favor of the sunflower crop, for reasons of operational cost of drying and storage, such as and for logistical cost reasons, which is very high compared to the price of corn.
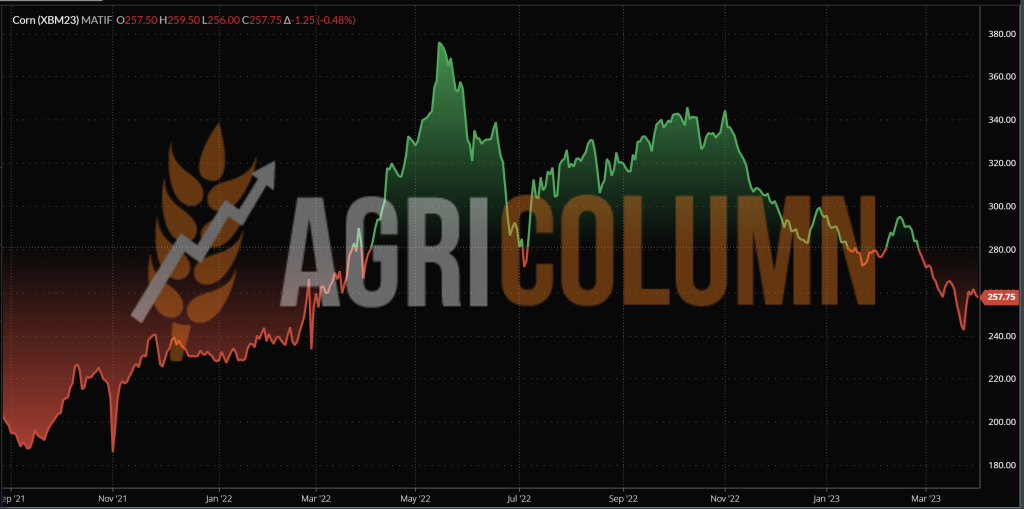
EURONEXT CORN – XBM23 JUN23 – 257.75 EUR (+4 EUR vs. last week)
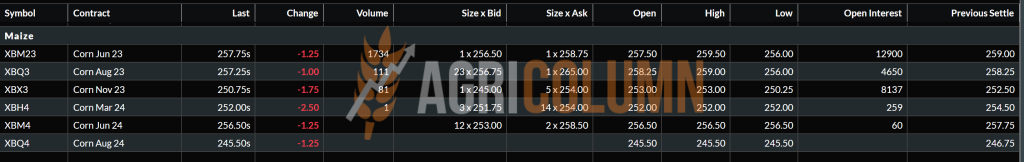
EURONEXT CORN TREND CHART – XBM23 JUN23
GLOBAL STATUS
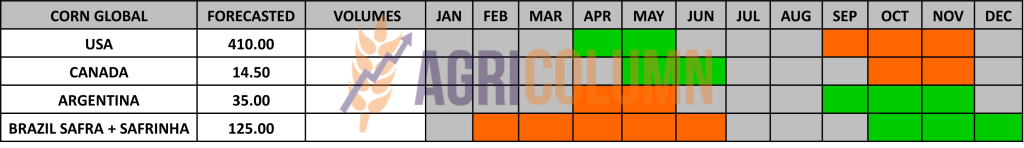
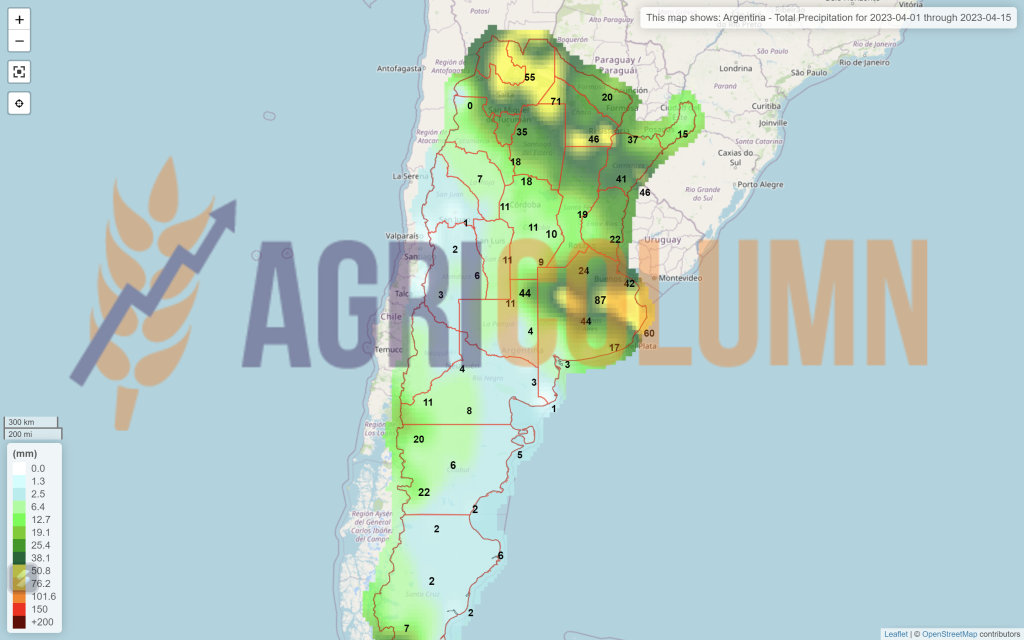
ARGENTINA does not improve the crop premise in any way, the level of 36 million tons still remains stable. The recent rains aren’t helping much. They are late, as in the case of the soybean crop.
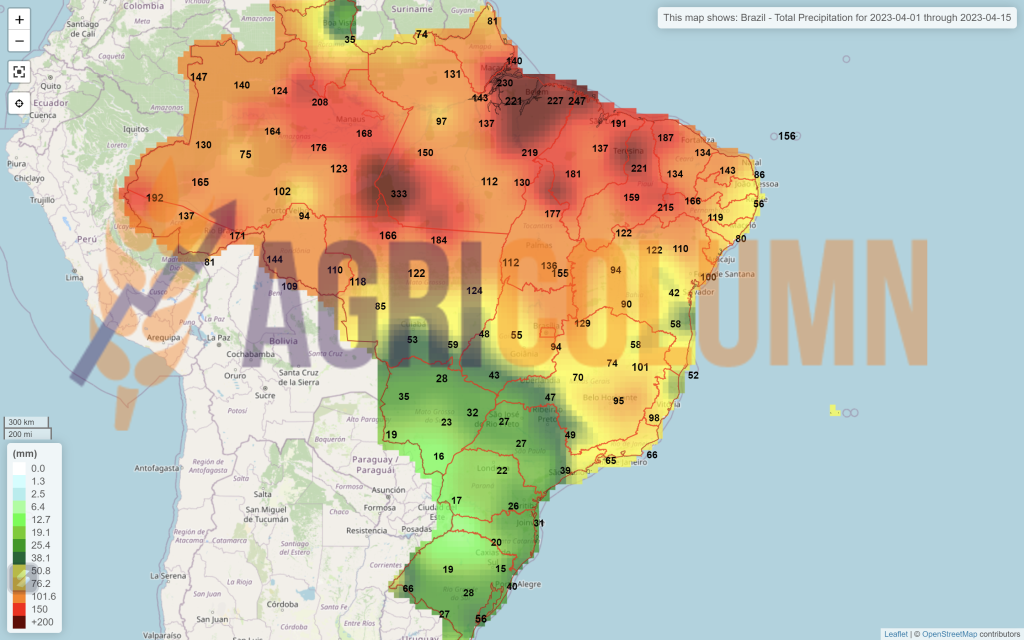
BRAZIL remains in the forecast volume of 125.5 million tons, cumulative Safra + Safrinha.
USA. The NASS report had stocks down from March 2022, the main benchmark, by 9 million tons. In March 2022, the US held a level of 197 million tons in stocks, and in March 2023, only 188 million tons.
At the same time, the NASS report generated much higher planting intentention. And compared to previous figures, we see a 4% increase in area, which is an increase of 1.38 million hectares, that will generate, according to the US national average, an addition in volume of 15.2 million tons. Thus, with an area of 37.24 million hectares and an average of 11 tons per hectare, the USA has a potential of 410 million tons this season.
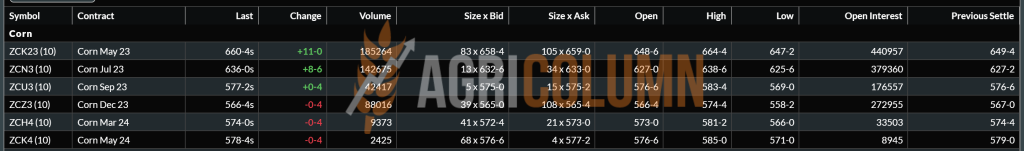
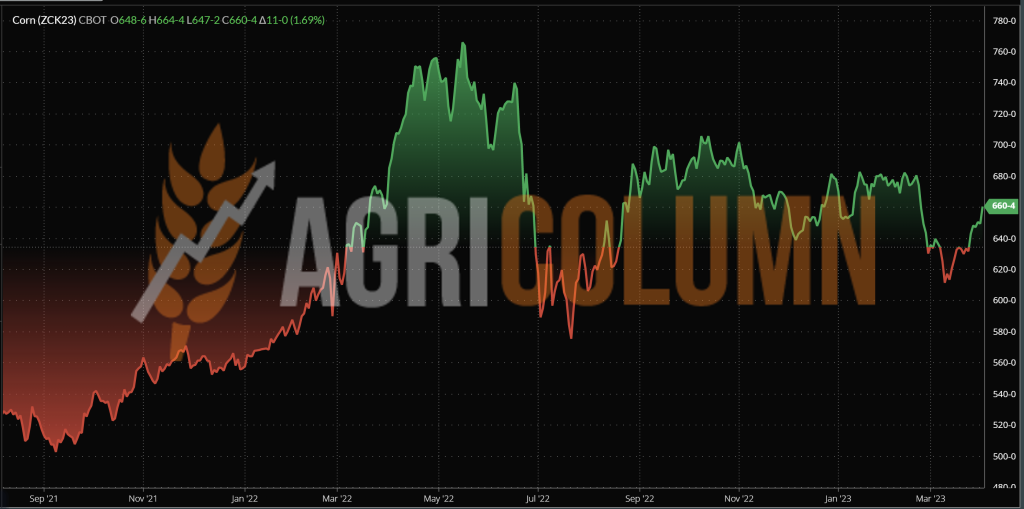
CBOT CORN ZCK23 MAY23 – 660 c/bu (+17 c/bu = +6.7 USD/MT vs last week)
CBOT CORN TREND CHART – ZCK23 MAY23
CORN PRICE INDICATIONS IN MAIN ORIGINS
CAUSES AND EFFECTS – THE STORY
NASS, through the generated report, literally split maize in terms of price.
On the one hand, the minus 9 million tons in American stocks is causing a price increase, also helped by the disaster in Argentina. And so the formula for price growth and support will be generated over a period that will most likely end around June 9, 2023, when the WASDE report will be released and we will have the full picture of global volumes of corn, as well as the much more realistic projection of crop potential in the Northern Hemisphere, the EU, the US and Ukraine + Russia.
On the other hand, NASS generated a report that highlights an increase in the corn planting area that will in turn generate a volume, according to the calculation matrix, of 410 million tons. It is a gigantic figure at first glance, but the average production per hectare in the USA is 11 tons, and the multiplication factor is 37.24 million hectares, which leads to the volume expressed above.
The ratio of fertilizer cost (price reduction) in the establishment cost of a hectare of corn, associated with the production per hectare and the selling price (because American farmers sell futures) how they seeded (they were basically long on that commodity) made the corn to be preferred by US farmers.
Of course, there is still a long way to go and the weather will take its toll on the American volume. Drought, heat are the parameters that will bite from the displayed volume. But even with adverse weather, in which we would reduce a potential of 30 million tons, we would have a level of 380 million tons, which is extremely high. The US previously met such volumes in the 2016-2017 season and in 2021-2022.
Thus, the CBOT price remains unchanged for the time being for the new crop. It is clearly a split of interest and the two crops are diverging at this point. The old crop grows and the new crop stays put. DEC23 vs MAY23 is now down 94 cents/bushel, or 37 USD/MT. And this decoupling will last until the WASDE report of June 9, 2023.

LOCAL STATUS
Old-crop rapeseed quotations in CPT Constanța parity are at the MAY23 level minus 40-50 EUR/MT. Subsequently, the new crop is valued at the level of AUG23 minus 40-50 EUR/MT.
CAUSES AND EFFECTS
Canada is, so to speak, the generator of the price spike in Euronext quotes. Tight stocks caused uncovered traders to compete for the commodity in an attempt to cover. It’s a good time for farmers in Romania with stocks, as rapeseed is jumping up and down by 10-15 EUR per trading session as we’ve become accustomed to.
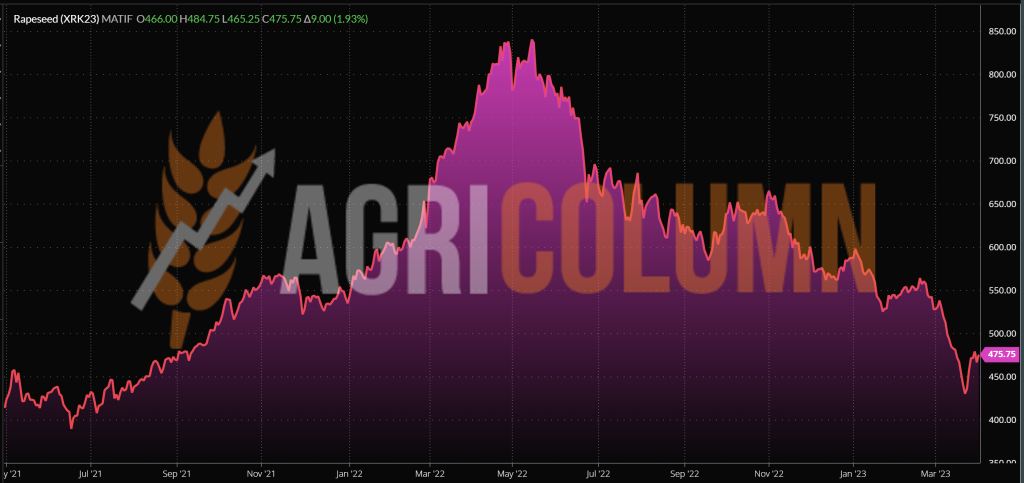
EURONEXT RAPESEED – XRK23 MAY23 – 475.75 EUR (+18.75 EUR vs last week)
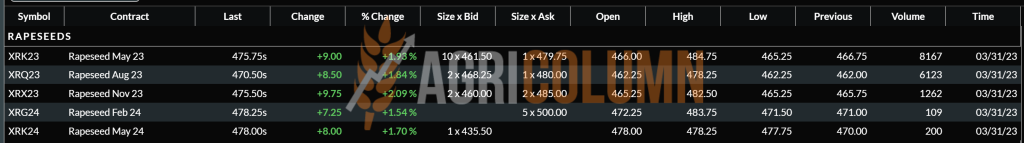
EURONEXT RAPESEED TREND CHART – XRK23 MAY23
REGIONAL STATUS
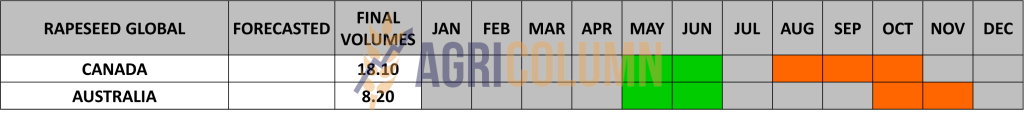
The EUROPEAN UNION maintains the level of 20 million tons as a harvest volume forecast, to which must be taken into account another 1.36 million tons generated by the states that are not members of the European Union.
As for Union imports, they are quoted at 6.2 million tons, up 58% from the previous season. Ukraine remains in the export zone to the Union with 2.9 million tons, but Australia reaches a level of 2.72 million tons. Among the processing countries, we highlight Belgium, which has an import level of 1.72 million tons, followed by the Netherlands, with an imported volume of 1.05 million tons, followed by France, with 0.88 million tons, Germany, with 0.82 million tons, Poland, with 0.7 million tons and Romania, with 0.45 million tons.
GLOBAL STATUS
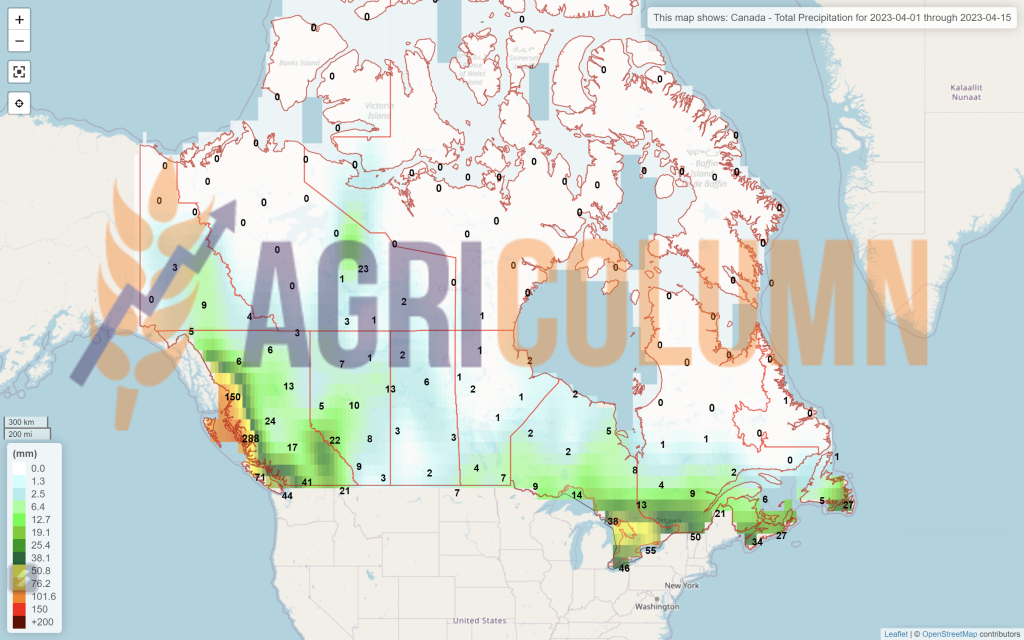
CANADA is experiencing problems with canola stocks. In September 2022, the satellite system indicated a harvest volume of 19.5 million tons, and in November 2022, StasCan indicated only 18.5 million tons. That missing million tons moves the market in these days because the coverage is not enough and thus the competition generates the price spiral.
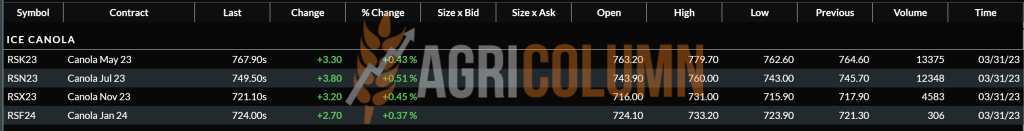
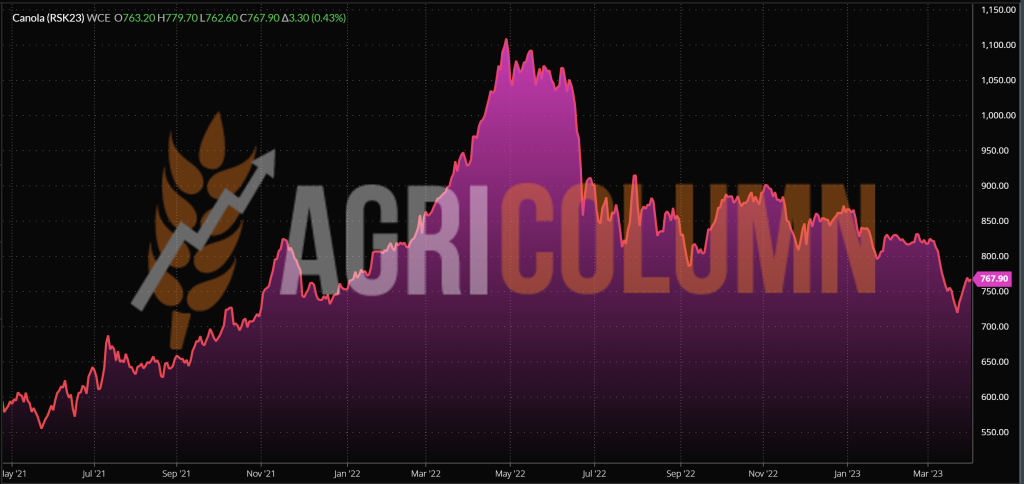
ICE CANOLA RS K23 MAY23 –767.9 CAD (+24.9 CAD from last week)
CANOLA ICE TREND CHART – RSK23 MAY23
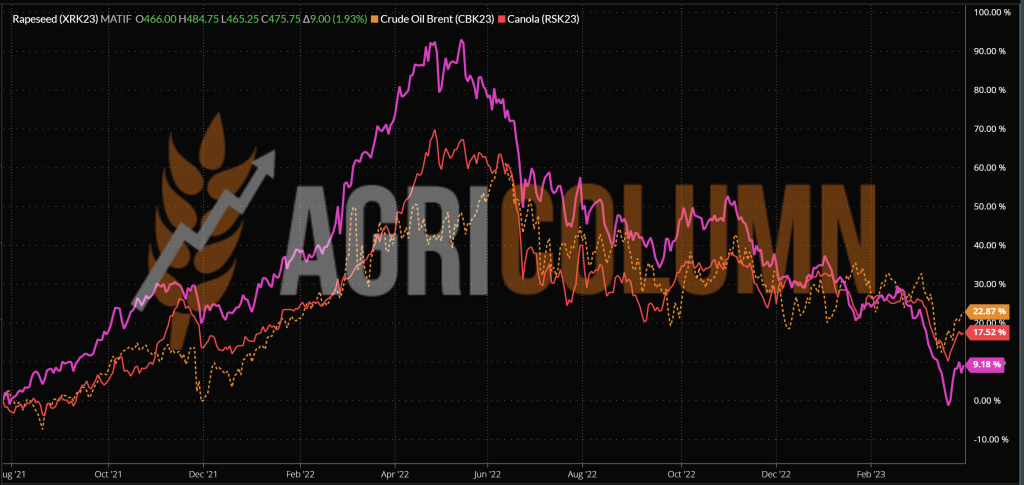
COMPARATIVE GRAPH. PETROL-RAPESEED-CANOLA CORRELATION
CAUSES AND EFFECTS – THE STORY
We have three cumulative factors in this upward price ramp through EURONEXT indications. And we will explore each one separately to understand the mechanism of the price increase.
The first factor is Canada, through tight stocks and competition between Traders to ensure coverage. Canadian canola oil is in demand in California for biofuel, and demand forecast is steadily increasing, from 1.8 million tons in 2021 to 18 million tons by 2025.
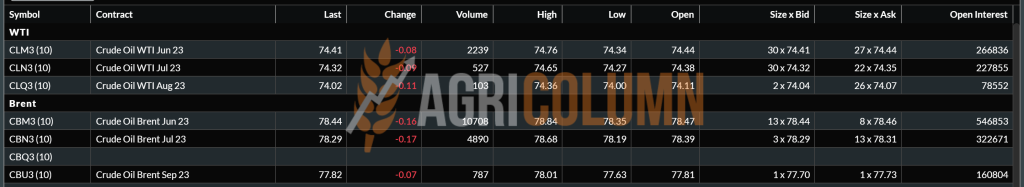
The second factor is related to the price of fossil fuel, also increased. While everyone was focused on the Russian wheat price diversion, the latter cut oil production by 500,000 barrels/day. Thus, the price increased from 72 USD/barrel to 79 USD/barrel in the quotation Brent. Subsequently, WTI (Western Texas Intermediate) reacted, taking the price from 68 USD/barrel to 75 USD/barrel. Inevitably, Russia played its game, selling less and more expensive. In the price of rapeseed, this correlation was seen instantly, but the effect will be reversed on the logistics cost for all raw materials. Shipping will become more expensive.
The third factor is palm oil, which has seen production problems due to floods in Indonesia. The latter will deliver 23% less palm oil to the market and the lack of volumes has generated a price spike in the Malaysian stock market.
KOJ23 CHART TREND – 4,058 MYR (Malaysian Ringgit). To the right of the graph, you can see the spike.
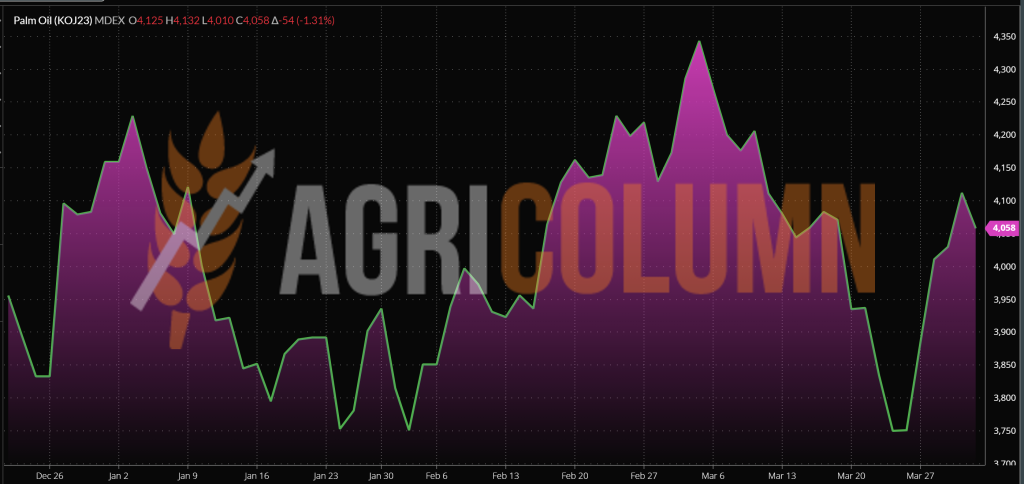
In conclusion, the support seen in recent days is generated by tight Canadian canola supplies, reduced palm oil volumes and rising fossil fuel prices.
But we can’t ignore another longer horizon factor, namely the Canadian crop inverse: RSX23 NOV23 721 CAD vs RSK23 MAY23 768 CAD, which is a minus of 47 CAD, which means 32 EUR. That translates to a Euronext indication of 443 EUR, NOV23.

LOCAL STATUS
Port Constanța quotes sunflower seeds at 405 USD/MT. The new crop is not yet valued.
CAUSES AND EFFECTS
We continue to maintain our selling recommendation on sunflower seed stocks. Sowing has started in Romania and we see a level of 1.32 million hectares, which will generate with the help of the Weather factor 3.2-3.3 million tons. The premise of a sufficient crop is on the horizon and the remaining stocks will hang heavy in the future price economy.
Processors and exporters are not yet capitalizing on the new crop of sunflower seeds, and I think the answer to the question of why they are doing so is clear. Awaiting completion of seeding in EU and Ukraine + Russia to generate future oil sales.
REGIONAL STATUS
UKRAINE. Same status as last week, with selling intentions, but not many buyers. Local processors are in the same status, with stocks still unsold.
RUSSIA finally realizes that demand is limited and plans to eliminate export duties on crude oil in April.
GLOBAL STATUS
ARGENTINA reached a harvest level of 77% and reached 2.9 million tons of harvested volume. This means that they will reach 3.5-3.6 million tons. So here too we can no longer talk about surprises that can influence the market.

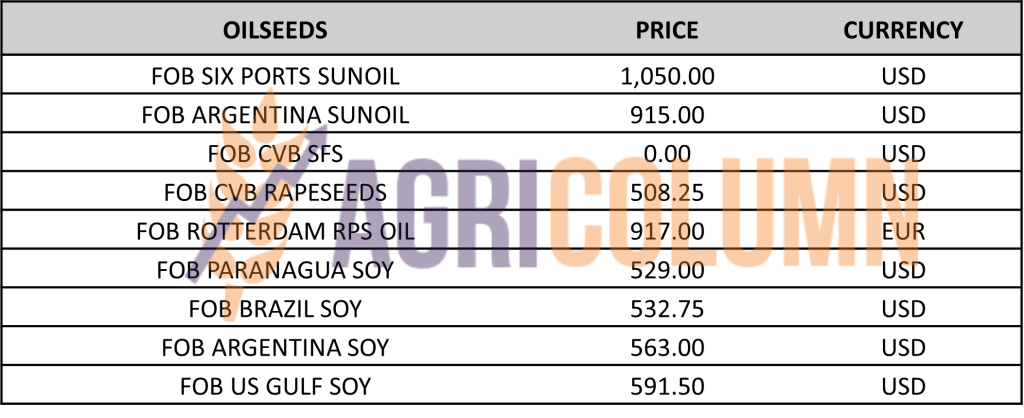
PRICE INDICATIONS FOR OILSEEDS AND CSFO IN MAIN ORIGINS
CAUSES AND EFFECTS – THE STORY
Sunflower seeds have entered the last stage of their life cycle, from a price point of view. And with all the support provided by palm oil and subsequently soybean oil, sunflower oil has not been able to capitalize much. SIX PORTS indications are back in the 4 digits ie 1,050 USD/MT. In the Black Sea basin, we have the same dormant state, with low demand and few buyers. What is on the horizon? The new sunflower seed crop is now being sown and there is a clear migration in the spring crop rotation to sunflowers across Europe. This state of affairs is the farmers’ response to climate change. Fears of drought and excessive heat have caused interest to shift to sunflowers. Naturally, the conflict in Ukraine also potentiated this, with past price levels generating emulation in the seeding ratio change.
But things are not the way many farmers in the Northern Hemisphere thought because the sunflower acreage has been boosted and therefore the harvest forecast will be more generous.
I identify, Ukrainian farmers will sow more sunflowers, more precisely with about 600,000 hectares more. And this will generate a crop surplus of at least 1.2 million tons, a volume which, under today’s conditions, with a Corridor likely to be restricted and strangled by Russia at Istanbul at any time, will make way for the transfer of raw material through the channels we are already used to, i.e. through the neighboring countries of Ukraine, Romania and Bulgaria. And this aspect will create an already existing pressure on the price.
Today, crude oil prices are at 880-920 USD/MT in the Black Sea basin FOB parity, with competition from Russia and Turkey, which is removing its export duties on crude oil in an attempt to capture the operational margin from processing, the so-called crush margin. They want cheap seeds from Ukraine for domestic processing and value-added export. In today’s conditions, where the support from Vegoil has not helped much, logistics will operate the price of the raw material, as a higher level of oil will act on the price of the goods and in the origin and the supply chain.
But the farmers’ account will also be paid. In other words, the new crop could find itself under pressure from commodity and crude stocks that have not yet found their destination.
In the next period, there are no strong enough reasons for the price to rise. The month of April will be one in which farmers sow and religious holidays will fragment the time with breaks.

LOCAL STATUS
In Romania, the price indications for soybeans are at the level of 475 USD/MT, DAP processing units for non-GMO soybeans.
REGIONAL STATUS
THE EUROPEAN UNION does not generate much change in the import of soybeans, only a level of 8.68 million tons, representing a decrease of 14% compared to the previous season. For soybean meal, we see a minus compared to the previous season of 5%, in total the import of the Union, which is currently 11.54 million tons. I think the protein parameter was changed in the feed recipe with the component cheap corn from Ukraine, because it provides a better profit margin.
GLOBAL STATUS
USA. The NASS report generated surprises by the difference in stocks between the two years, March 2022 and March 2023, namely a shortfall of 6.84 million tons:
- March 2022 = 52.71 million tons,
- March 2023 = 45.87 million tons.
This moved the CBOT extremely strongly by 31 c/bu (11.4 USD/MT) for the indication MAY23, ie the old crop.
Planting intent remains in the same regime as last season, but at a slightly higher level – 35.43 million hectares nationally in the US.
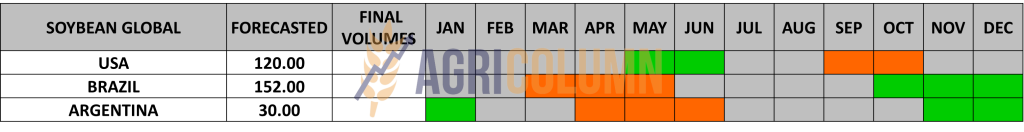
ARGENTINA. No change in terms of volume, the same level of 25 million tons forecast.
BRAZIL remains at the same level of 153-155 million tons generated by local analysis houses and the USDA.
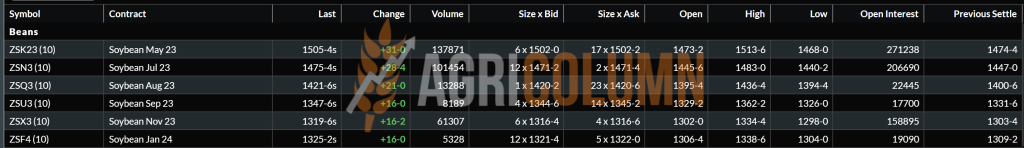
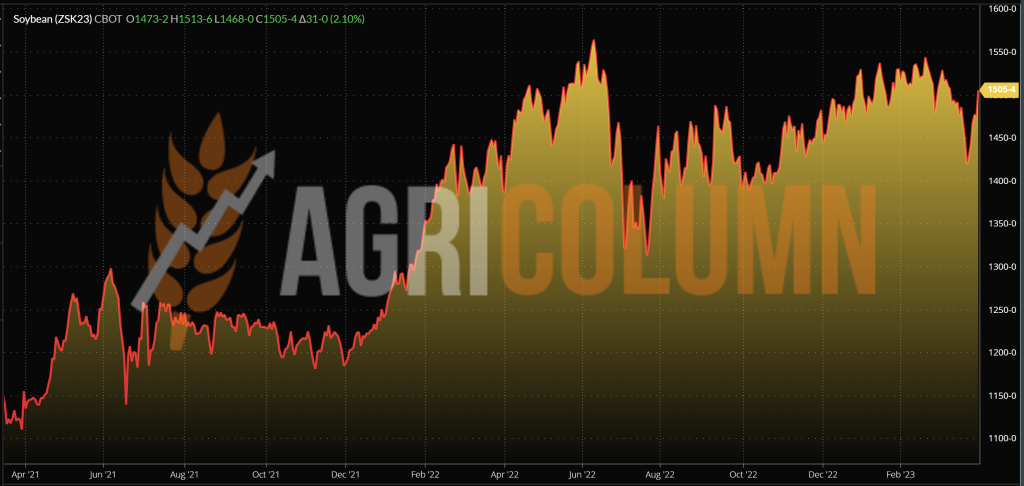
CBOT SOYBEAN ZSK23 MAY23 – 1,504 c/bu (+76 c/bu = +$28/t from last week)
SOY GRAPH TREND – ZSK23 MAY23
CAUSES AND EFFECTS – THE STORY
The soybean price level in the MAY23 indication is over 1,500 c/bu. With a significantly reduced stock ratio of minus 6.84 million tons, hedge funds felt obliged to position themselves for short-term profit accumulation. Because yes, from April 15, 2023, the liquidation of positions will begin.
But if we carefully study this growth, we will notice its artificiality. Soy has lost two weeks in a row, and now it has recovered. On March 16, 2023, the MAY23 indication was set at 1,491 c/bu, and the one at the close of March 31, 2023 is 1,504 c/bu. The difference between these two dates is only 13 c/bu, or 4.77 USD.
Next, attention must remain distributed between Demand and Weather, because if we compare the two sequences, we will see a massive decline on the horizon in terms of price. And these sequences are MAY23 (1,504 c/bu) compared to NOV23 (1,319 c/bu), where we identify a crop inverse of 185 c/bu, which is 68 USD/MT.
EXTRA
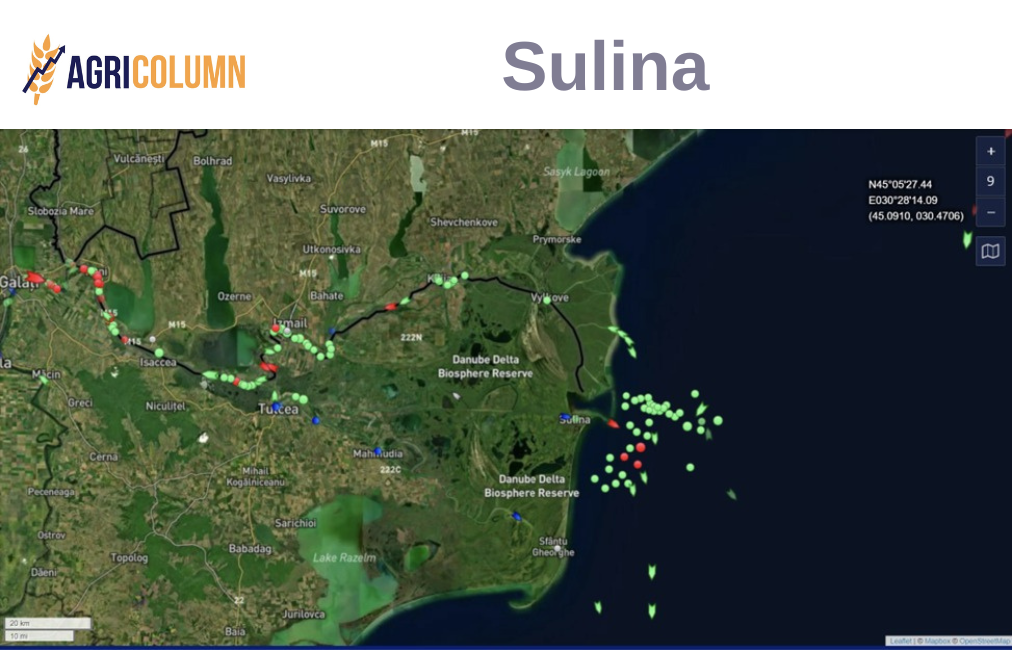
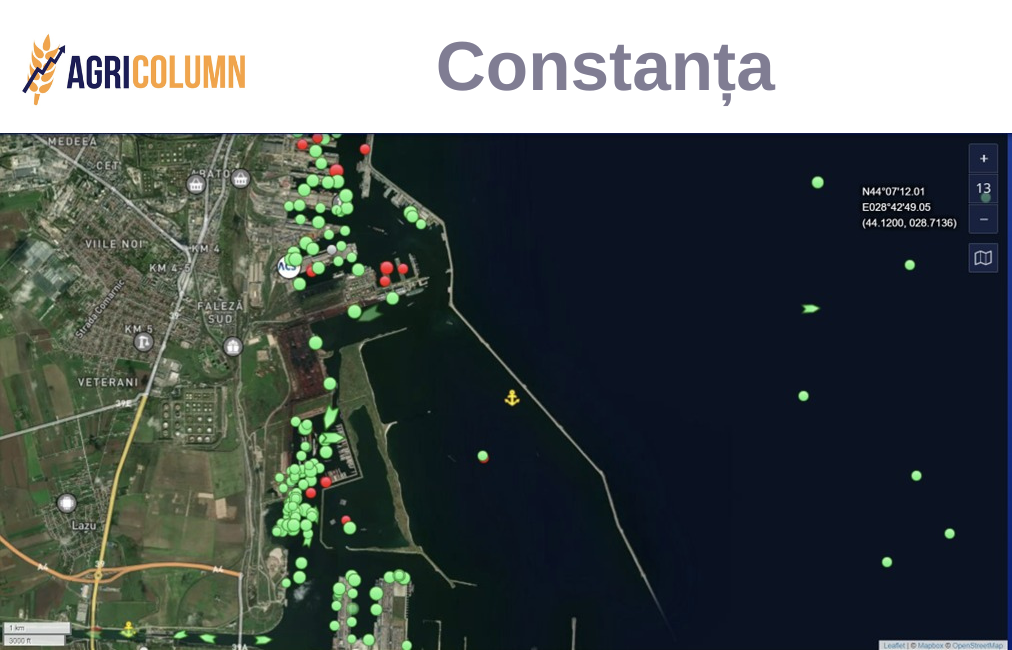
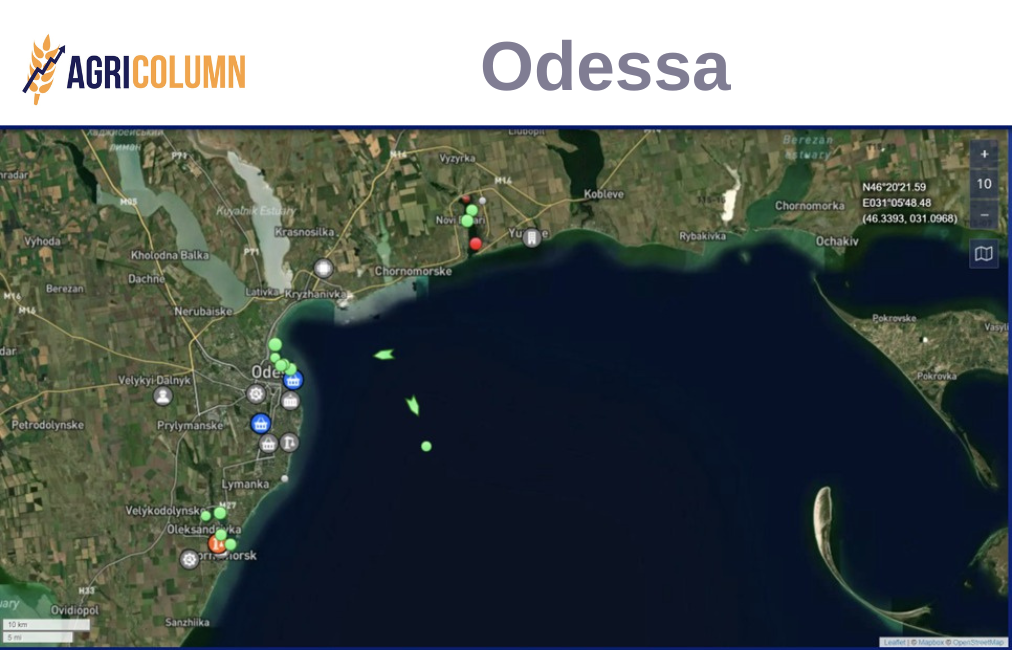
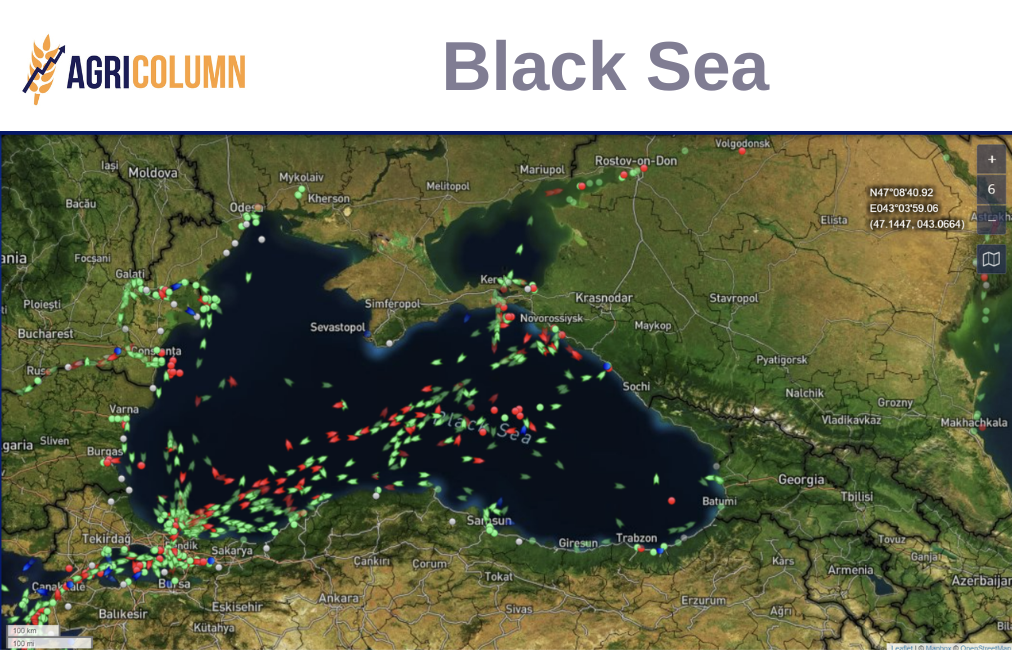
Romania is still the cheapest route for Ukrainian goods. Their transfer via Constanta avoids the Russian-Turkish inspection in Istanbul, the so-called JCC, and the images below indicate this.
By comparison, we observe the congestion in the port of Constanța and the entrance to the Sulina branch, opposite Odessa- Pivny – Chornomorsk. Waiting time for inspection in Istanbul costs the goods by 30-35 USD/MT. In effect, any demurrage is charged by the shipowner. Moreover, this taxation is customary, legal and regulated by the charter-party contracts.
Source: marinetraffic.com.


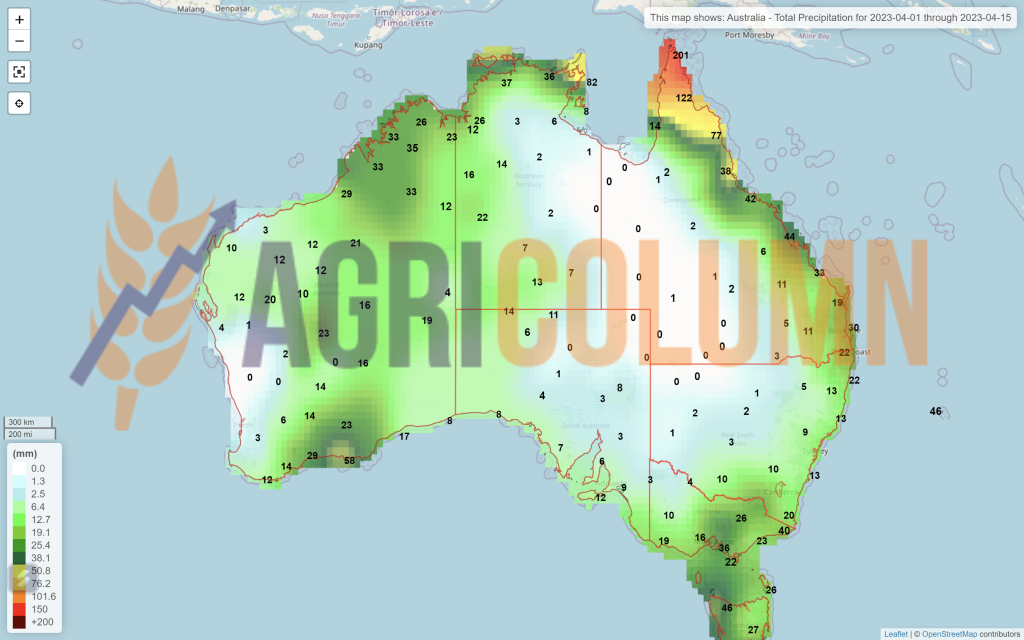
1-15 April 2023
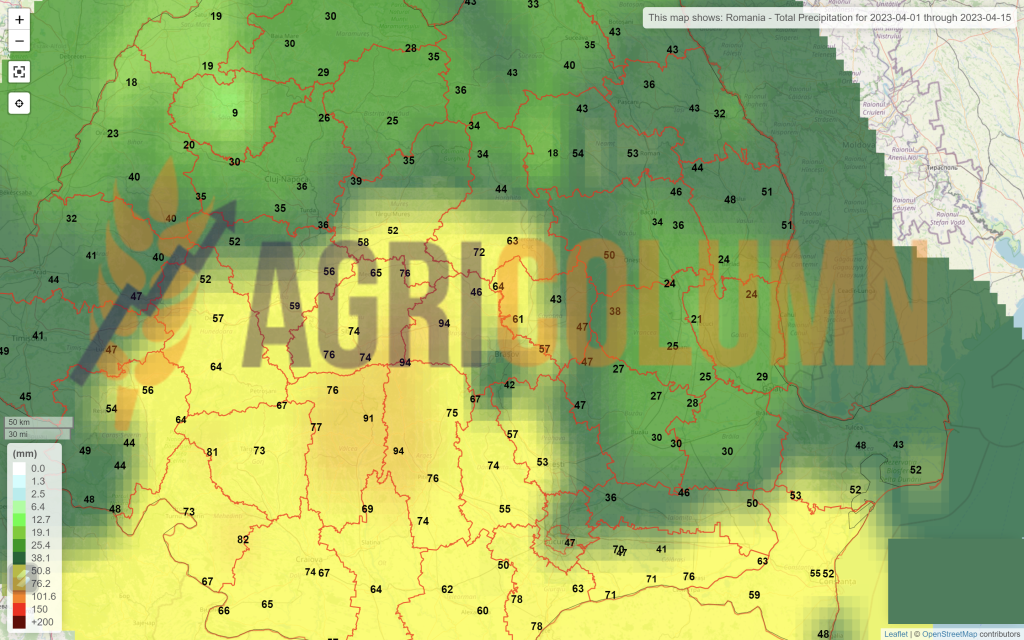
Romania
Europe
Ukraine
USSR aka Russia
Canada
USA
Brazil
Argentina
China
Australia