This week’s market report provides information on:
FAO MARCH 2023
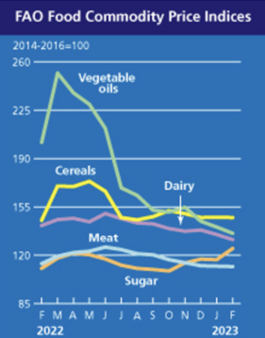
The FAO Cereal Price Index averaged 147.3 points in February, down fractionally (0.1%) from January and up 2.0 points (1.4%) from a year ago. After falling for three consecutive months, international wheat prices rose marginally (0.3%) in February.
The slightly firmer tone largely reflected continued concern about dry conditions in key US winter wheat production areas and robust supply demand from Australia, while strong competition among exporters helped limiting price increases.
World corn prices were little changed, up just 0.1% month-on-month. Support came from worsening conditions in Argentina and planting delays for the second corn crop, along with a strong export pace to Brazil, while weak demand for supplies from the United States weighed on corn export prices.
The FAO vegetable oil price index averaged 135.9 points in February, down 4.5 points (3.2%) from January and marking the lowest level since early 2021. Continued weakness in index was driven by lower world prices for palm, soybean and sunflower seeds and canola oils.
International palm oil prices fell for a third consecutive month in February, weighed down mainly by sluggish global import demand, despite lower seasonal output from major growing regions in Southeast Asia. Meanwhile, world soybean oil prices continued to fall, supported by lower purchases from key importing countries and the prospect of rising production in South America.
As for sunflower and rapeseed oils, world prices remained on a downward trajectory, depressed by their abundant global export availabilities.
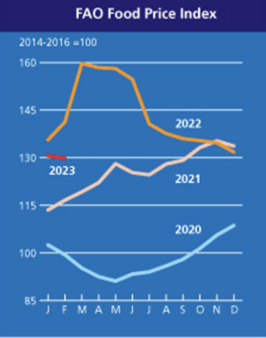
The FAO Food Price Index (FFPI) averaged 129.8 points in February 2023, down marginally (0.6%) from January, continuing its downward trend for the eleventh consecutive month. With the latest decline, the index is down 29.9 points (18.7%) from its March 2022 peak.
February’s marginal decline in the FFPI reflected significant declines in vegetable oil and dairy price indices, along with fractionally lower grains.
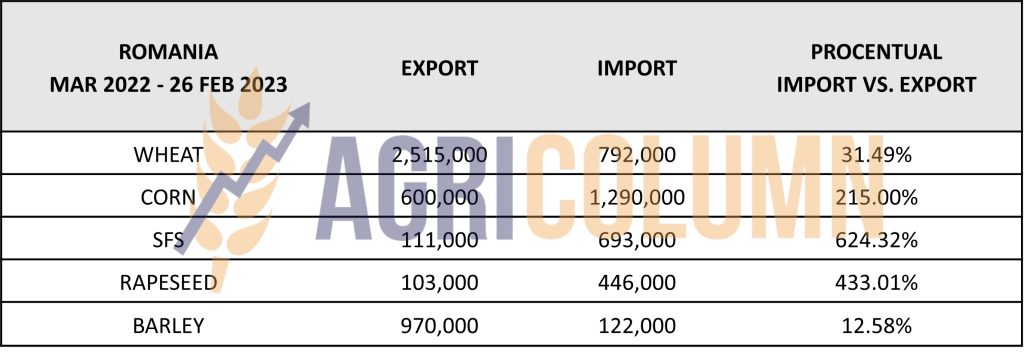
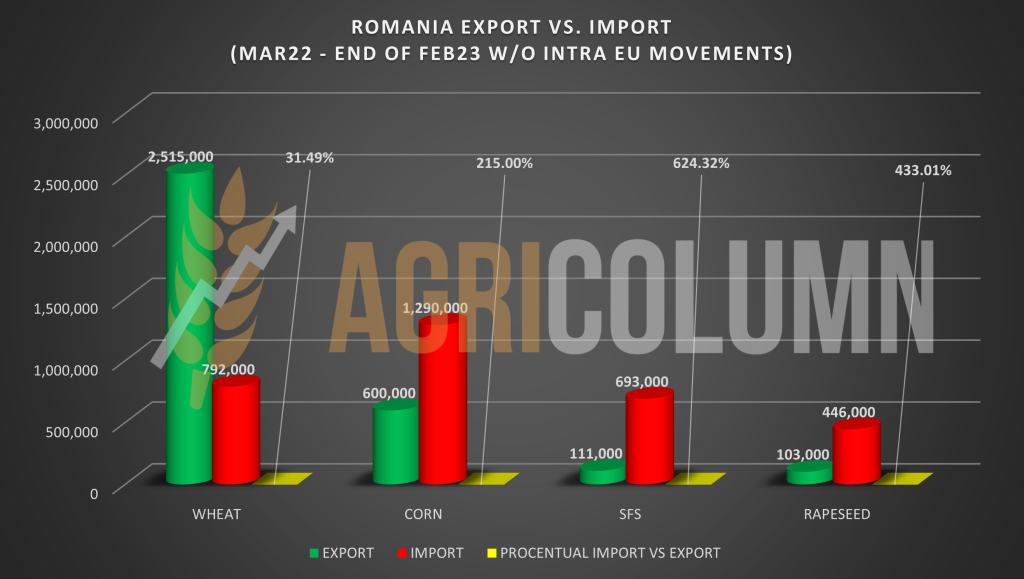
ROMANIA – EXPORT VS. IMPORT (MAR 2022 – 26 FEB 2023) – MAJOR DISCREPANCIES
Romania is in a state that everyone didn’t think was possible a year ago. The complacency of the decision-making factors, the lack of perspective and anticipation generated a reverse traction for Romanian agribusiness from the point of view of sales.
We all witnessed the start of the conflict and saw the desperation of Ukrainian farmers to sell their produce. The self-sufficiency and the lack of clarity, the lack of desire to receive and value the correct information and forecasts in the right of the decision-makers and in the right of the farmers have led today to the context we live in, namely, unsold Romanian goods, Romanian goods that are not competitive, there are very large stocks of goods and we notice an accumulation of financial costs in the accounts of Romanian farmers.
The assumptions we generated, the accuracy and the preview of what was going to happen were one by one validated by the fundamentals of the physical market. It is very easy to believe what you want to believe, it is easy not to have the elements of forecasting and not to understand what will follow, and here we add the lack of vision and competence of many decision-makers.
The lack of capacity, aggregated with the lack of courage to argue and position Romania’s interests, have brought us to today’s landscape, the one you will find in the graph below. And an amendment: what will come will be incomparably different from what it has been. We will all witness the days to come, and time will corroborate our predictions.

LOCAL STATUS
The indications of the Port of Constanța are around 260 EUR/MT. New crop indications are 248-250 EUR/MT. The crop inverse is therefore 10-12 EUR/MT.
CAUSES AND EFFECTS
The price drops we see are nothing more than confirmations of our forecasts that repeatedly accompanied each issue of the market report. The availability in the Black Sea basin confirms the clear downward trend in the price. We have crossed stages on the price floor, and nothing has stopped the wheat from following the path we indicated.
The new crop matches up very well with the old crop, with post-harvest price indications being generous today. A crop inverse of 12 EUR associated with a difference of only 6 EUR/MT for feed quality reflects this. The market norms we have become accustomed to were pointing to inverse crop benchmarks around 18-22 EUR/MT, and the difference between milling and feed grades was stated at 10-12 EUR/MT.
The path of wheat 4 months before harvest and associated with the old crop is clear. For those who visualize new crises produced by Russia, we only say this: the percentage ratio of stocks clearly indicates Russia as the holder of volumes and not Ukraine at all.
REGIONAL STATUS
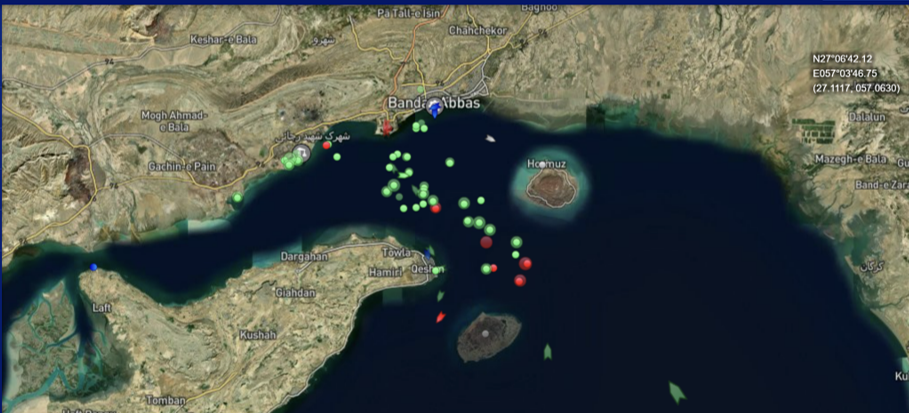
RUSSIA is experiencing problems with payment of its products to certain destinations, and we are locating a large number of ships waiting in the Persian Gulf in the Bandar Abbas port area of the Strait of Hormuz. They have been in abeyance since September 2022 for the simple reason that they are not paid. These wheat deliveries are part of the deals between Russia and Iran at the state level.
The price of Russian wheat in the FOB Novorossiysk parity fell to around 293 USD/MT, which reflects, in a EUR/USD parity of 1:1.063, a level of 275 EUR/MT.
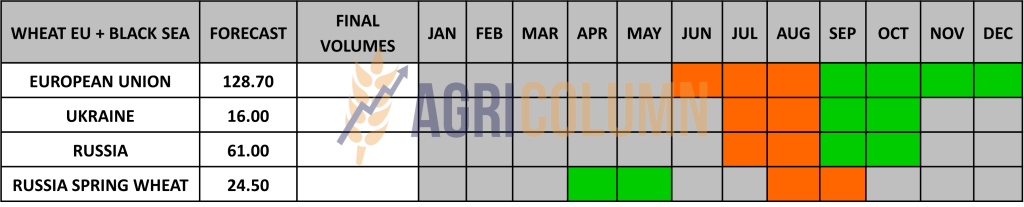
As for the new wheat crop, with all the attempts of Russian analysts to present in their style the so-called problems in the current state of vegetation, the numbers indicate a level of 85 million tons as a forecast, which brings the Russian new crop to a level slightly above the normal average. This figure is made up of around 61 million tons of winter wheat and just over 24 million tons of spring wheat.
But their problem remains, at the moment, the stock, namely what will cross over to the new crop. It shows no signs of abating yet, and therefore we prefer to keep it at the minimum level of 15 million tons. If we combine the two figures, new crop plus old crop stock, we will generate a level of 100 million tons, to which the cargo extracted from southern Ukraine will be added. how much It is not clear at this time, but a minimum of 8-9 million tons will be generated from the occupied territories.
UKRAINE continues to export wheat, although not at a sustained pace. The volume of exported wheat amounts to about 11.4 million tons, compared to 18 million tons in the previous season.
The main problem remains the availability of the Corridor, because the lines of solidarity exist. If this Corridor will be denied by Russia, there are enough implications that can develop negative areas of trade in Ukraine. But, to understand things better, we need to think about Russia’s gain from maintaining this corridor.
First of all, they score in the image chapter. They will not be categorized as those who want to starve poor countries. Secondly, they will supervise, by strangulation, this thin thread of export, because about 20 million tons have gone out through the Corridor, from the beginning until now. In other words, they will constantly know what, how and how much Ukraine exports, and they will adjust the pace so that they are not disturbed. Their propaganda claims that they were not allowed certain things, namely the export of agricultural products.
Totally false, Russia can export any agricultural product. Russia, on the other hand, cannot export fertilizers, which is a separate topic. After all the large-scale blackmailing of gas supplies to the European Union, the latter cannot give in to blackmailing of fertilizers. The price of gas has raised the price level of fertilizers to astronomical levels, impacting the global production of agricultural products and implicitly the prices of goods.
For this, we have only one source, namely Russia. The sanctions imposed on Russia are directed at the export of fertilizers, which are in the hands of a group of oligarchs loyal to Putin. And subsequently, Russia, through its request to accept the export of fertilizers, is asking for the lifting of the sanctions on the payments. How else?
In other words, the lifting of the restriction on the export of Russian fertilizers, granted with the lifting of sanctions on payments, would do nothing but feed the dogs of war, fuel the Russian war machine and, implicitly, generate much more imbalance in the region.
And the European Union has no interference in all these negotiations for the Corridor. Effectively, only the UN and Turkey are involved.
As a corollary to the above, Russia loses if it blocks the Grain Corridor because Ukraine could move without Russia, retaliating in the Black Sea. And this chapter can generate, in turn, other working premises.
First of all, inspection in Istanbul, a total waste of time for Ukrainian goods, will disappear. Second, if Ukraine decides to go down this road further, it will certainly have the support of Turkey, a direct beneficiary of cheap Ukrainian goods. And we do not believe that Russia will allow itself to attack any Turkish ship escorting a convoy of ships leaving Ukraine, bearing in mind that Turkey is a NATO member country.
Except that this scenario would generate wild Russian attacks on the Ukrainian port infrastructure on the Black Sea, in this case the three agreed ports. And thus a total deadlock will occur.
The last working premise in this case is the redirection of cargo flows through the already created routes. And here we nominate Romania, Poland, Hungary, Bulgaria. But this will put extreme pressure on these countries’ infrastructure, border crossings, inland logistics and, of course, on the already logistics-affected farmers in these countries.
It is not impossible to carry out, but everything must be planned carefully, with great accuracy, with compensatory measures for local farmers, with clear rules regarding the regime of goods entering transit and their destination, as well as the traceability of these volumes from the point of view of their quality.
However, we believe that Russia will realize that if they stop the Corridor, it will generate very high costs for their products, for the simple reason that the war premiums related to marine insurance will increase enormously for them as well.
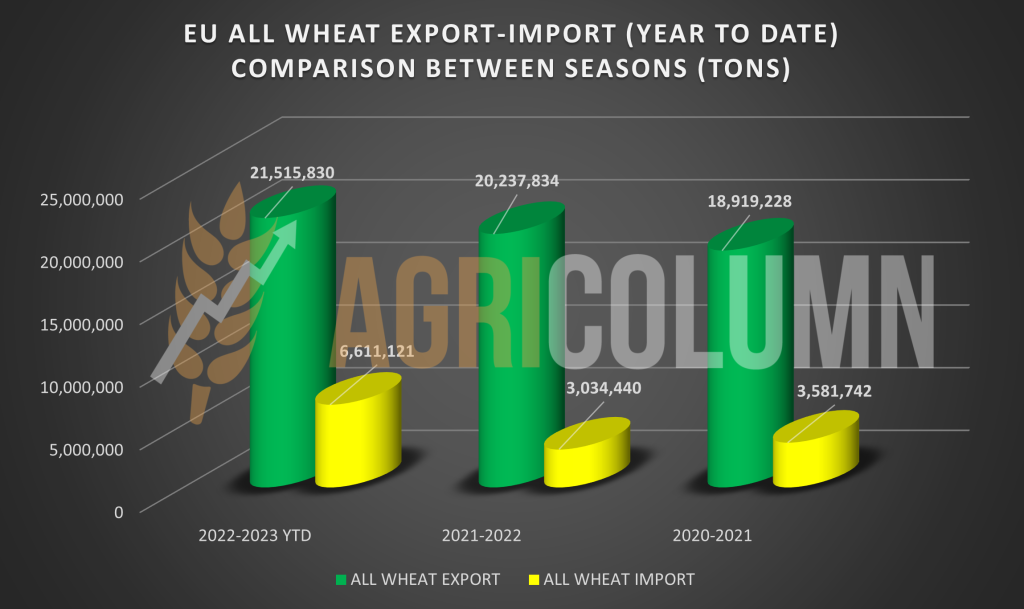
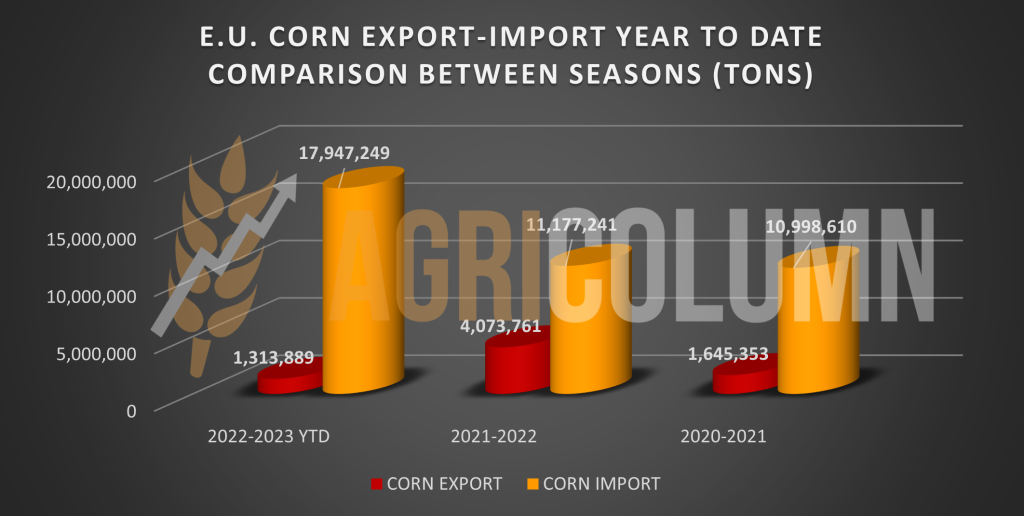
THE EUROPEAN UNION. Here we want to insert a graph that is suggestive of the pace of export versus import in direct comparison, referring to the same period of two previous seasons, namely, 2021-2022 and 2020-2021. The graph shows us the export surplus, but if we analyze the import generated this season, up to this date, we see that the latter balances out. And we keep in mind that the Union did not have a brilliant crop level in the summer of 2022, but on the contrary, one reduced by about 4-5 million tons at the level of the Union.
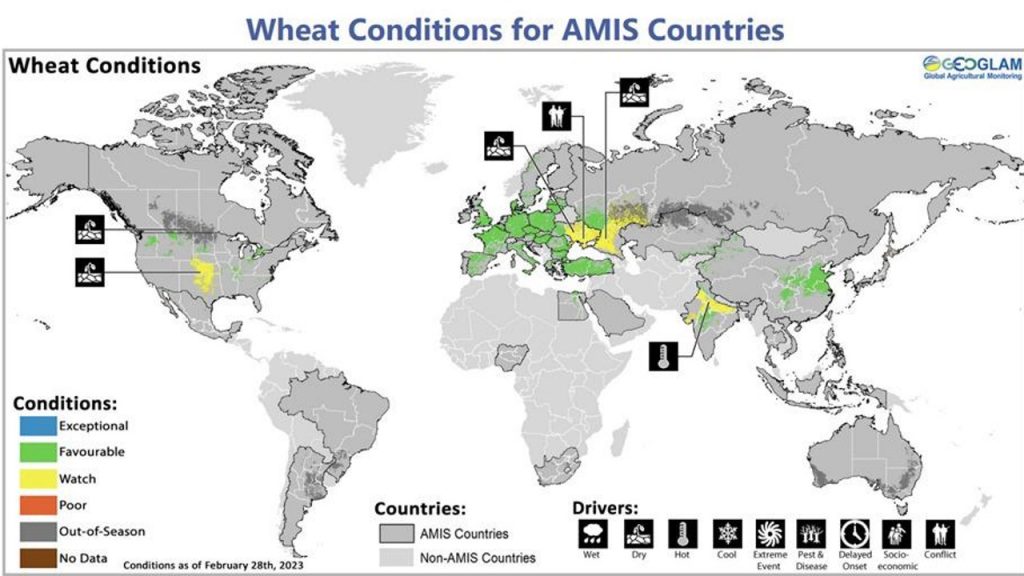
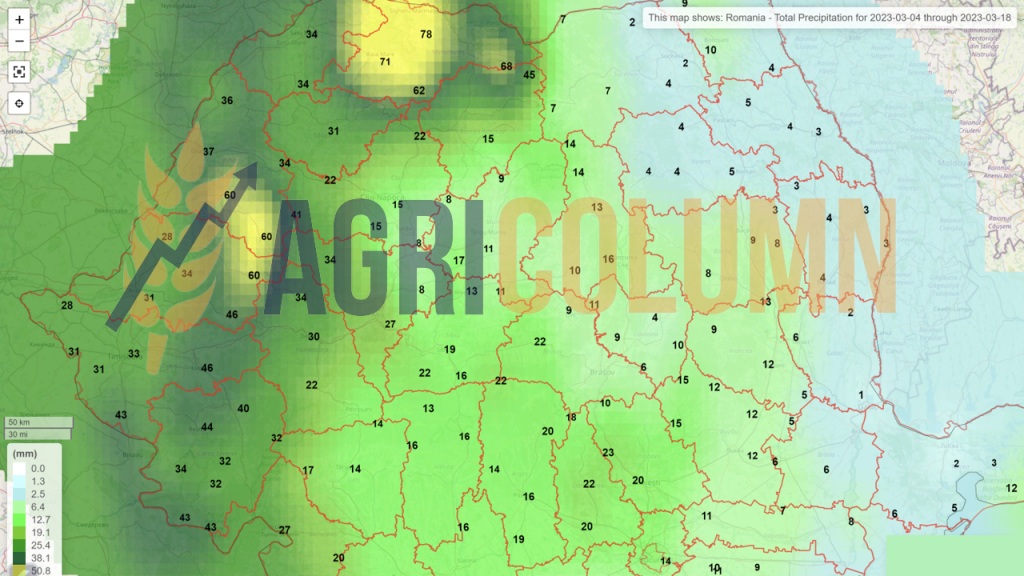
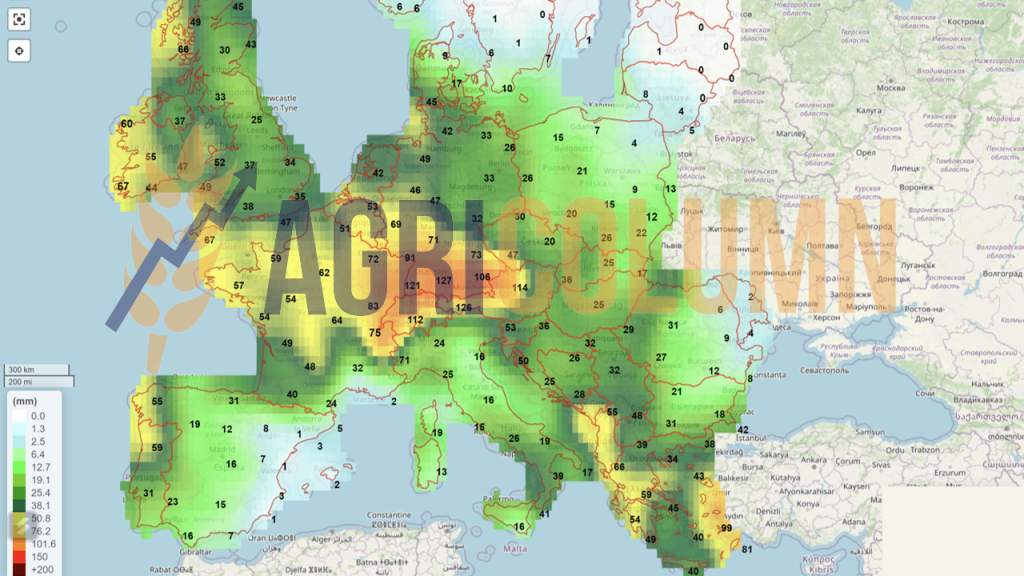
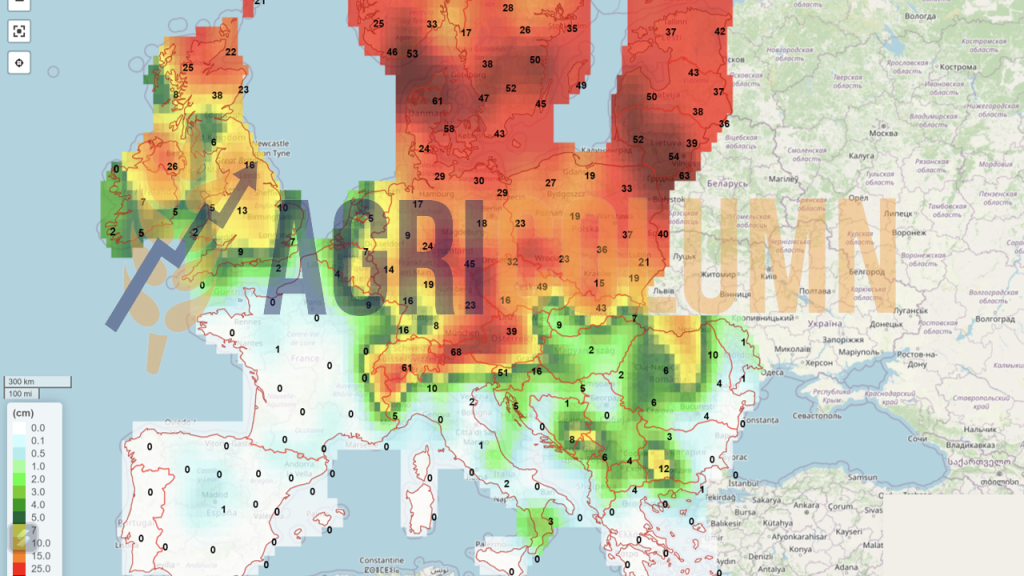
At the level of the European Union, wheat indicates a correct vegetative state for this period. Rainfall is needed, especially in the French area, but there, things are looking good for this period, with a GOOD rate of 91%, EXCELLENT at 4% and SATISFACTORY at 5%. And the precipitation will arrive without delay. I invite you to view the weather maps related to Europe in the annexes of the AGRIColumn report.
We have the same report from the AMIS Crop, with a satellite image of European wheat that is generating security at the moment. As we can see, European wheat has a Favorable grade at the moment, and the rains that will arrive will strengthen this current level of vegetation. Source: AMIS report; Geoglam.

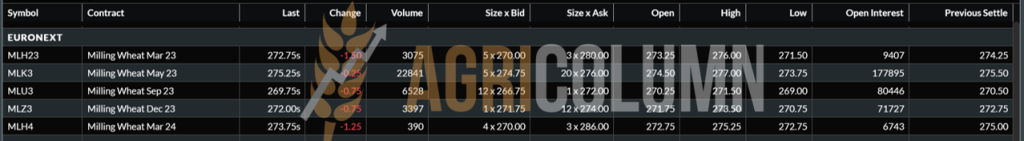
EURONEXT – MLK2323 MAY23 – 275.25 EUR (-5 EUR from previous week)
EURONEXT WHEAT TREND CHART – MLK2323 MAY23

GLOBAL STATUS
The USA registers through the CBOT important drops in the price level of wheat. The latter shows its lack of competitiveness generated by confidence in the brutally corrected price trend in the last two weeks. Otherwise, American winter wheat is in a mixed state. Areas with problems, but also areas with a good vegetation stage. As a final qualifier, we would mention that American wheat is in satisfactory conditions, but what needs to be observed.
INDIA is starting the harvest, but at the same time, it is experiencing problems caused by excessive heat and drought already in many regions. This could cause an estimated crop of 112 million tons and at the same time extend the export restrictions. As for supply, we believe that Russia will supply India with wheat, their relationship being well known.
BRAZIL and ARGENTINA open doors for genetically modified wheat with increased drought resistance. Bioceres Crop Solutions Corp. ( Bioceres ) (NASDAQ: BIOX ), a fully integrated global provider of crop productivity solutions designed to enable agriculture’s transition to carbon neutrality, announced that CTNBio, the National Biosecurity Commission of Brazil’s Ministry of Science, Technology and Innovation, completed the safety assessment of HB4 wheat, giving full approval for marketing and cultivation in Brazil. Thus, the way is opened for commercialization in Argentina as well.
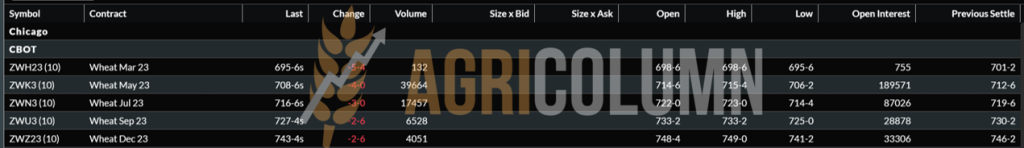
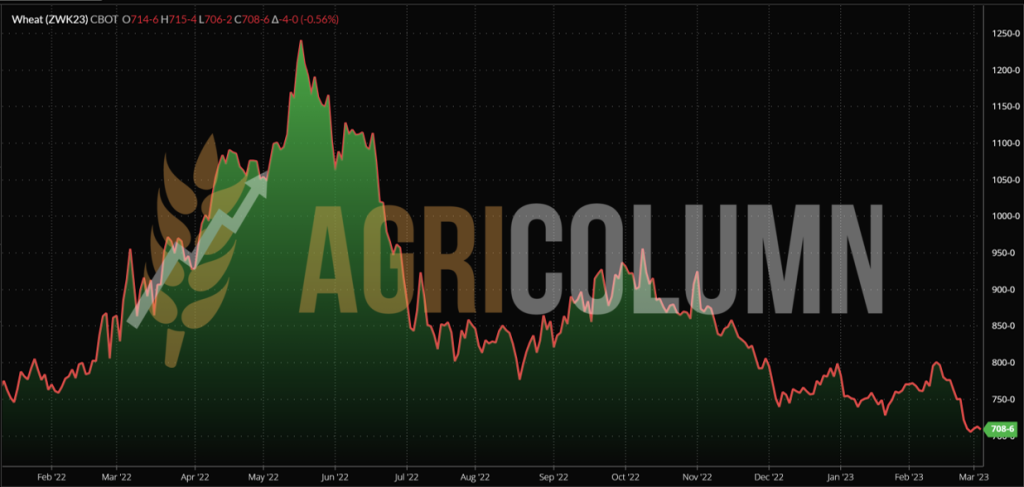
CBOT WHEAT – ZWK23 MAY23 – 708 c/bu (-13 c/bu = -$4.77 vs last week)
CBOT WHEAT TREND CHART – ZWK23 MAY23
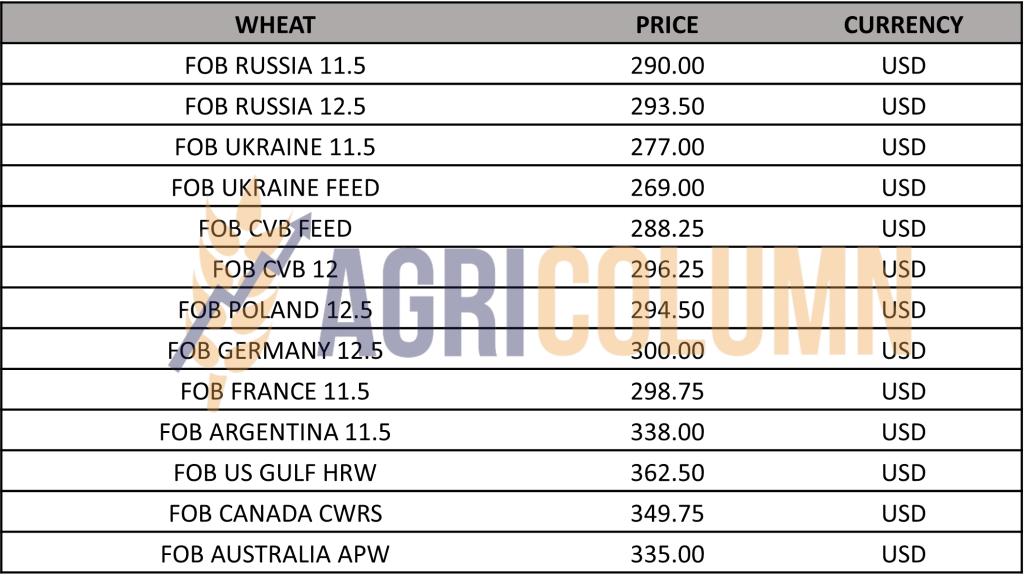
WHEAT PRICE INDICATIONS IN MAIN ORIGINS
TENDERS AND TRANSACTIONS
TMO TURKEY closed the tender by purchasing around 300,000 tons of wheat at a level of 310-311 USD/MT, CIF Porturi Turkey.
MIT Jordan canceled the tender dated February 28, 2023.
CAUSES AND EFFECTS
The first factor worthy of analysis and the natural cause of what will happen is the main actor of the self-created war in Ukraine, namely Russia. The first foundation that characterizes this actor is his definition: Russia is condemned to sell wheat. Russia cannot afford a moment not to sell wheat. All initial attempts to blackmail globally with the product called wheat have failed.
Their volume is considerable and they effectively have nothing to do with it. This attribute cannot disappear from Russia’s label. Russian farmers need to restart the production cycle, and liquidity is absolutely necessary. Their genetics do not cover the requirement, only 55-56%, but in the case of wheat we can say that it does not have such a high weight.
Of the arrogance dictated by the extremely high prices in the first months after the start of the war, which in turn fueled speculators and farmers in the physical market, there is absolutely nothing left. The export tax has steadily declined, the tax that fed Putin’s henchmen and gave them the energy to continue their savage assaults on Ukraine.
In the last few days, we have seen Putin announce the Security Council of Russia. Everyone was afraid. What will he do? Will he declare war on Ukraine? Stocks blinked briefly, 4.5 EUR up on Euronext and around 3.5 USD on the CBOT. But reasoning has corrected this presumption. If he declared war, surely no grain of Russian wheat would cross the Bosphorus. And no oil tankers.
That so-called Security Council turned into a pathetic zoom, in which the increased attention on terrorist attacks was reiterated. For the Russians claimed that Ukrainian soldiers entered Russia and attacked the border villages and killed the population.
Surely we are all aware of that “casus belli ” caused by Nazi Germany, when German soldiers dressed in Polish army uniforms attacked the Gleiwitz radio station on the German border, on the evening of August 31, 1939.
What Putin pursued was nothing more than a potentiation of his position in front of the Russian population and a purge at the top of four generals, thus also changing the command of special operation Z, thus appointing the general who conquered Mariupol.
Returning to our topics, we can say that the closure of the Corridor does not benefit Russia in any way. It is their only measure of control over what comes out of Ukraine, and they prefer to strangle it slowly to weaken the export from the three ports. Turkey will not allow the closure of the Corridor either, being an easy source of cheap goods.
But if this happens, the associated costs will be commensurate, and we mean insurance premiums. Not to mention the potential problems Russia could face if it pulls its military fleet out of Sevastopol. We remember Moscow.
And what is left outside the pool cannot return home to provide support. Simple, Turkey closed the passage to warships.
Stock markets also bear this out, and the picture is extremely clear. The CBOT is at a 22-month low. Below you have the graph and the trend line. US wheat was down 55 c/bu a week ago and another 13 c/bu in the previous week, for a total of 68 c/bu, an aggregate loss of 25 USD/MT.
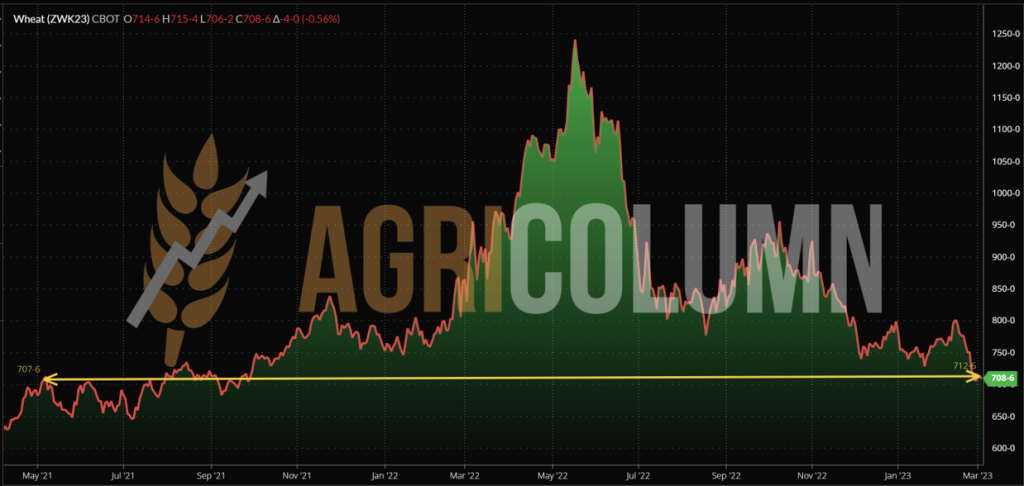
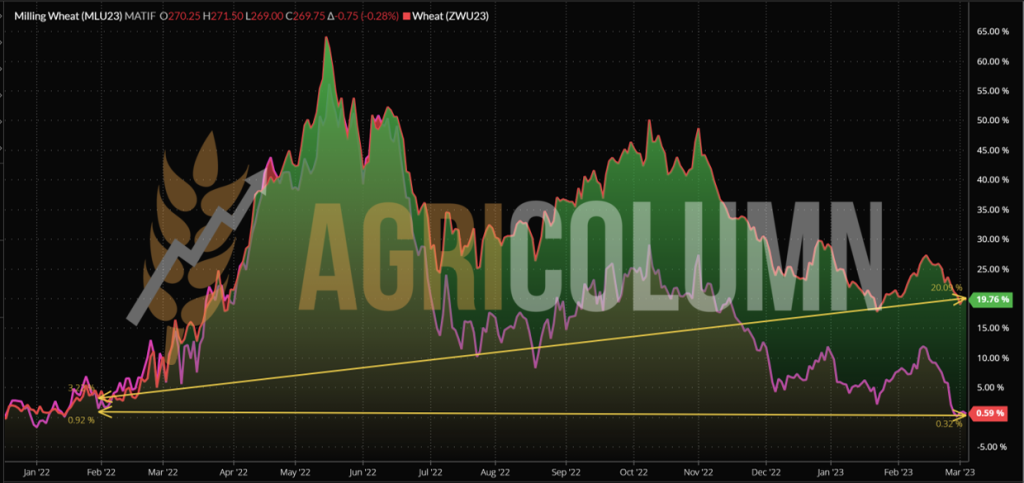
However, EURONEXT indicates a high rate compared to the dawn of the invasion. And this difference is nothing but uncertainty. In the background, the green area is the EURONEXT trend, which has been clearly decoupled from the CBOT since late June 2022. EURONEXT, for its part, has collected a cumulative minus of 15 EUR in the last 2 weeks.
There are 4 months to go until harvest and things are getting clearer every day. We have price markers through the new crop tenders, we have markers through the inverse crops. It is therefore a good time to sell part of the 2023 wheat crop.

LOCAL STATUS
The price indications of feed barley remain in the indication area of 237-240 EUR/MT in CPT Constanța parity.
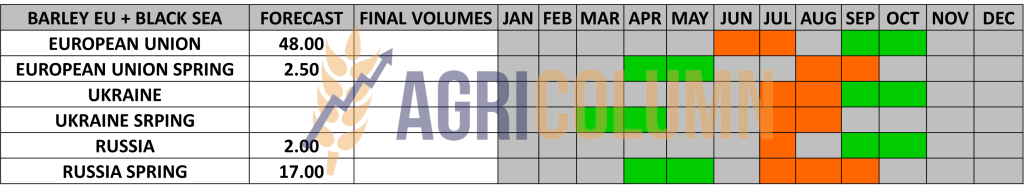
REGIONAL STATUS
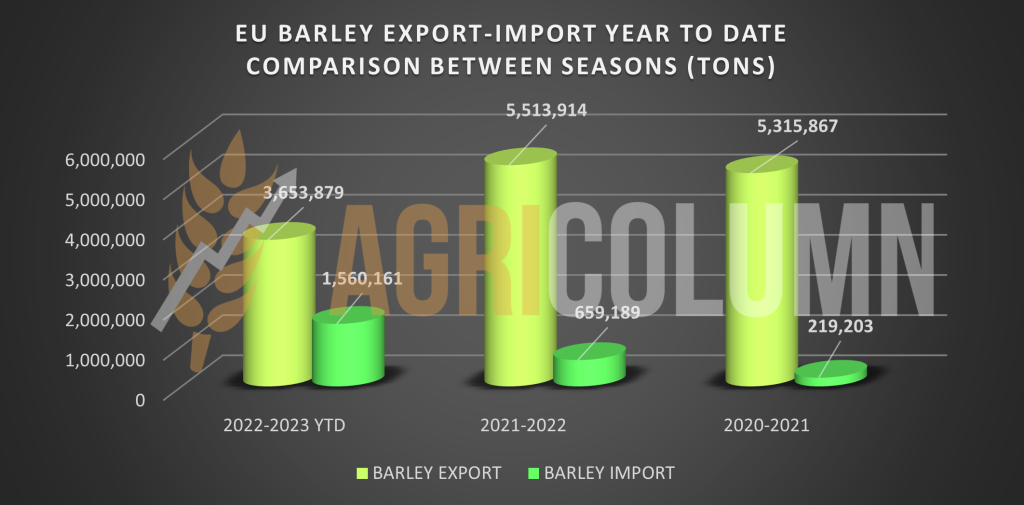
EUROPEAN UNION has up to this moment an export level of 3.65 million tons, down from the previous season by about 1.9 million tons. But the import level is much higher than in the previous season, indicating the Ukrainian source as the main origin.
The graph below is a comparison between the current season and the previous ones.
TENDERS AND TRANSACTIONS
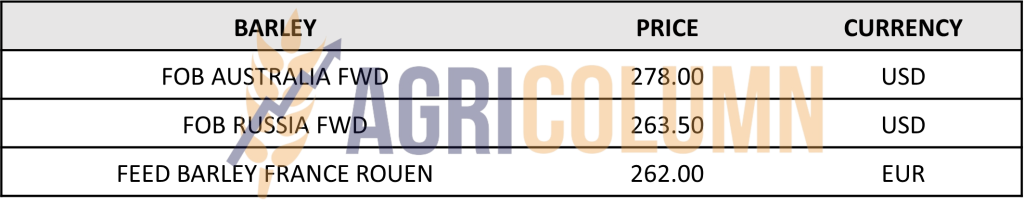
TMO TURKEY purchased a volume of 440,000 tons of barley with an average price of 279-283 USD/MT, CIF Turkey ports.
BARLEY PRICE INDICATIONS IN MAIN ORIGINS
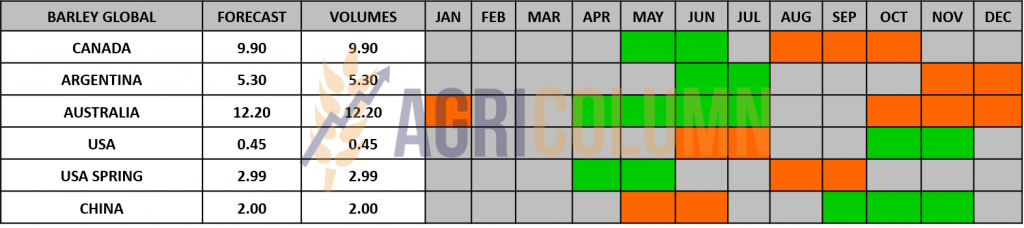
GLOBAL STATUS

LOCAL STATUS
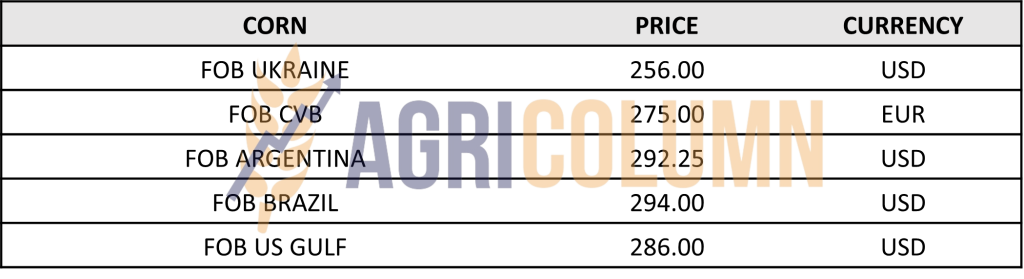
Corn indications in the port of Constanța are starting to decrease, so for spot deliveries we are recording levels of 255 EUR/MT.
CAUSES AND EFFECTS
As we said in the previous issue, the stability of corn no longer has extremely solid foundations. So at the moment we are witnessing a decrease of 10 EUR/MT and we remember that we said that we would see it at 245 EUR/MT. Support on the level exists from the uncertainty generated by the grain corridor, but that’s about it at the moment. The demand exists and is currently honored by whoever sells, regardless of origin, Ukraine or Romania.
REGIONAL STATUS
UKRAINE is still harvesting corn left in the field in the fall. We have no doubt that this is an extremely poor quality product with obvious quality issues.
The EUROPEAN UNION indicates an impressive level of corn imports so far. The cause is natural, namely the drought of the 2022 season, which generated a production shortfall of around 17 million tons at the EU level. Naturally, 50% of imports are of Ukrainian origin. About 9 million tons of goods arrived imported from Ukraine. The chart below shows us how it compares to previous years. The explanation for the high level this season is simple – the drought has bitten the production of the European Union.
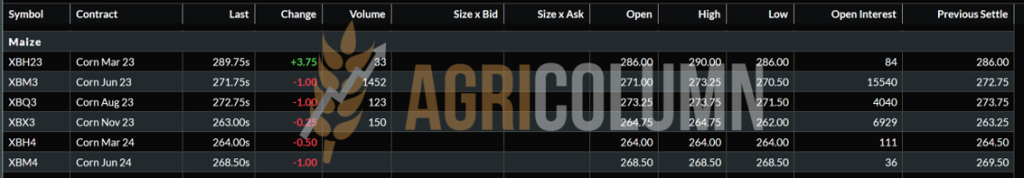
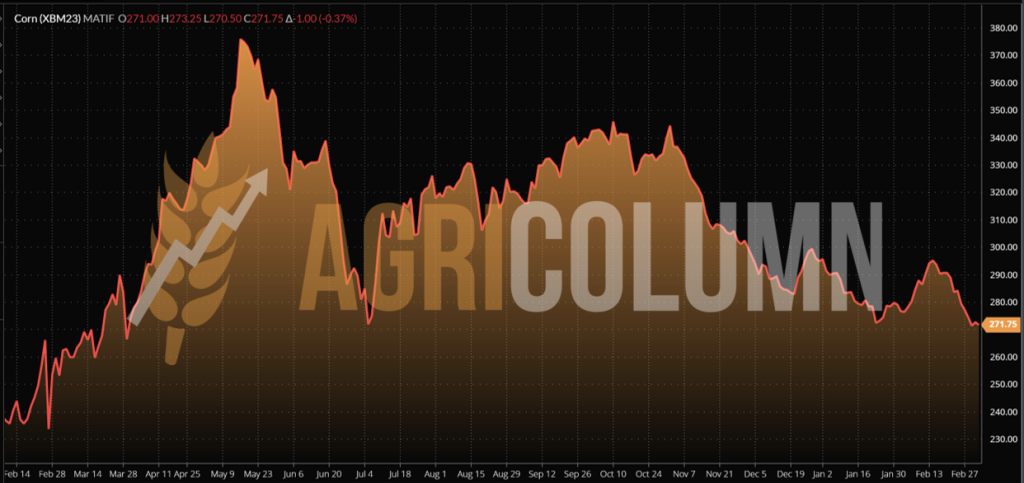
EURONEXT CORN – XBM23 JUN23 – 271.25 EUR (-8 EUR from last week)
EURONEXT CORN TREND CHART – XBM23 JUN23
GLOBAL STATUS
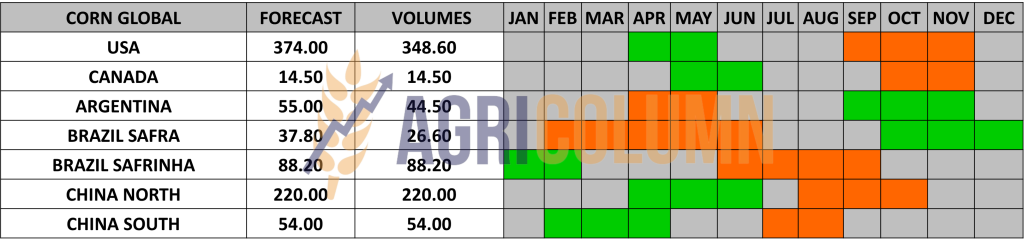
ARGENTINA is still in deficit, and the volume forecasts are not encouraging. Ahead of the WASDE report, we see a forecast of 43 million tons, down 4 million tons from WASDE February.
BRAZIL, ahead of the March 8, 2023 WASDE, has a steady volume forecast of around 125 million tons.
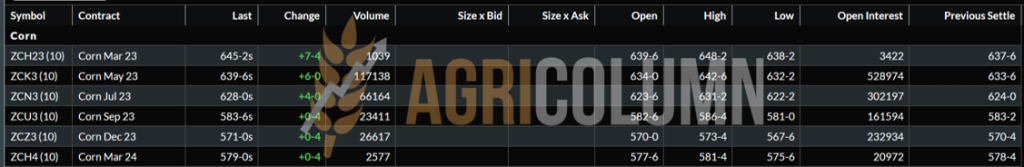
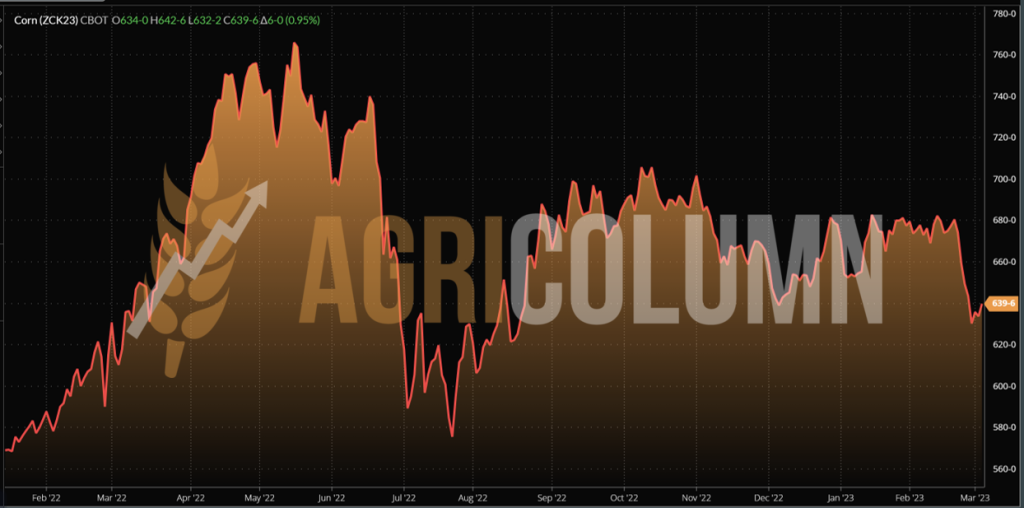
CBOT CORN ZCK23 MAY23 – 639 c/bu (-10 c/bu = -4 USD/t from last week)
CBOT CORN TREND CHART – ZCK23 MAY23
CORN PRICE INDICATIONS IN MAIN ORIGINS
CAUSES AND EFFECTS
EXCERPT FROM NUMBER 7: “But we must be aware that this price platform will not remain at this level indefinitely. With each passing week, it erodes. Why? It is extremely simple. The South American volumes will be known, and at this moment, we do not think that they will be able to decrease, so the premises could reverse and we could see corn at the level of 245-250 EUR/MT in the CPT Constanța parity.”
Maize has a support from South America (Argentina), but an obstacle in North America. Argentina’s decline forecasts provide a supportive lever for corn, and Argentina’s declines are one reason. But unfortunately, the hurdle lies right at home in North America, where stocks are higher than previously thought and the seeding forecast is higher. The two basically cancel out in a zero sum game, and the wheat goes the way of the corn, i.e., down.
What comes from Ukraine will feed the European Union, which, let’s face it, is not far short of the 22-23 million tons needed to import this season and can already breathe a sigh of relief in this regard. Brazil generates a competition with Ukrainian origin and fills it in turn, especially since China has focus on Brazil to the detriment of the USA.
In other words, corn has moved into the second half of its price life cycle and is coordinating with its driver called wheat. If the corridor closes, the existing routes through the countries of the European Union can channel, in smaller volumes, it is true, Ukrainian corn resources. We will see corn at 245 EUR/MT CPT Constanța and maybe lower, that is clear and unequivocal.

LOCAL STATUS
Rapeseed quotations are generated by EURONEXT and according to the established formula, CPT Constanța indications are around 505 EUR/MT.
The new crop has indications from local processors and exporters at AUG23 minus 30 EUR/MT as an average. Some offer at AUG23 minus 35-40 EUR/MT. Everything takes place in direct negotiation between the parties.
CAUSES AND EFFECTS
There are no essential changes compared to the previous week. Inventories hang heavy in the economy of Romanian farms and generate pressure on quotations. The size of stocks is no longer a secret. The problem remains the same, namely the refusal to release stocks.
Time does not turn back, and the months of May and June 2022, are even less so. But this level of stocks will, in turn, make future sales difficult. Hopes can live a maximum of 1-2 months. Everything depends on what happens in Ukraine. But after we passed the 24th of February and started to enter the month of March, we can say that nothing extraordinary will happen, and the price will not be able to go up.
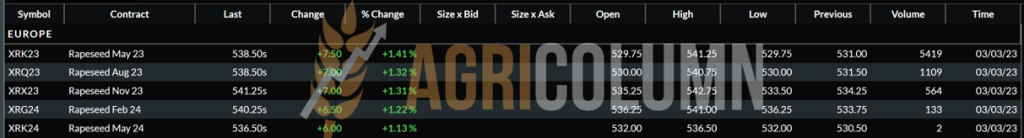
EURONEXT RAPESEED – XRK23 MAY23 –538.5 EUR (minus 4 EUR compared to last week)
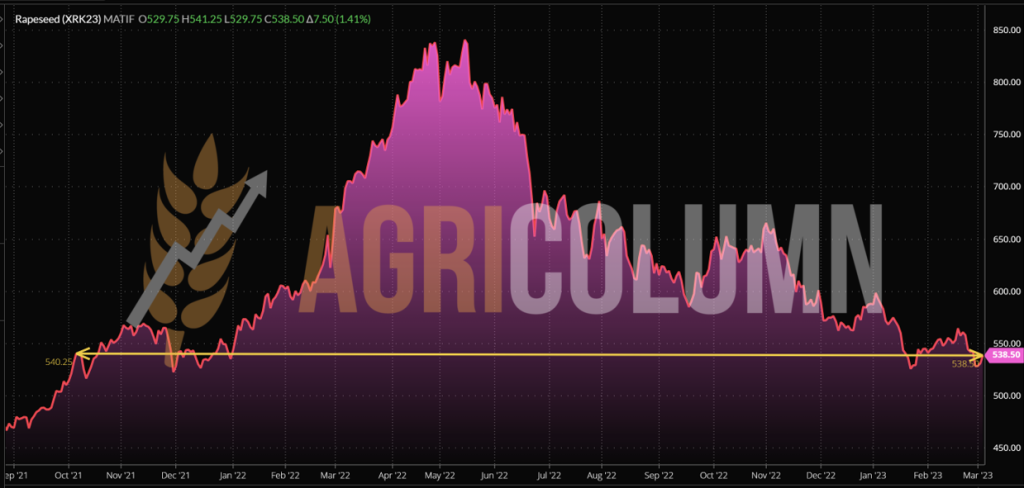
EURONEXT RAPESEED TREND CHART – XRK23 MAY23
REGIONAL STATUS
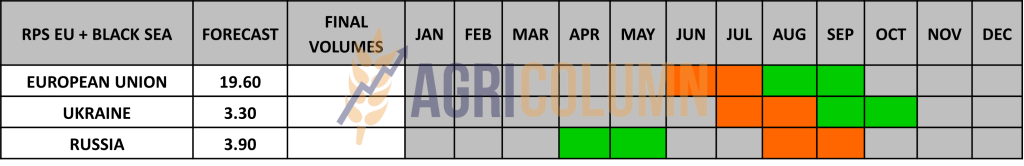
THE EUROPEAN UNION has a sufficient level of coverage at the moment, with an imported volume of 5.33 million tons, generated by Ukraine (2.74 million tons) and Australia (2.10 million tons), as well as to Canada (0.2 million tons) and Uruguay (0.1 million tons).
Regarding the new crop, the forecast is improved by Strategie Grains, which raises the forecast for the EU rapeseed crop to 19.6 million tons, from 19.5 million tons.
Rapeseed plants are generally in satisfactory condition, although rain was needed in the western part of the EU. The anticipated slight increase in production could help boost stocks further next season, and rapeseed is also expected to face competition from SFS and soybeans for processing demand.
EU rapeseed stocks are already expected to increase in the 2022/2023 season as supply from competitively priced Australian supplies and imports from Ukraine to Poland and Romania outstripped demand.
GLOBAL STATUS
Out of season.

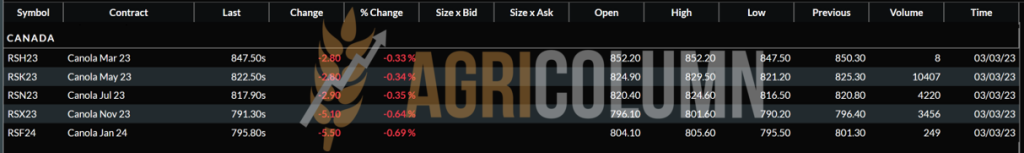
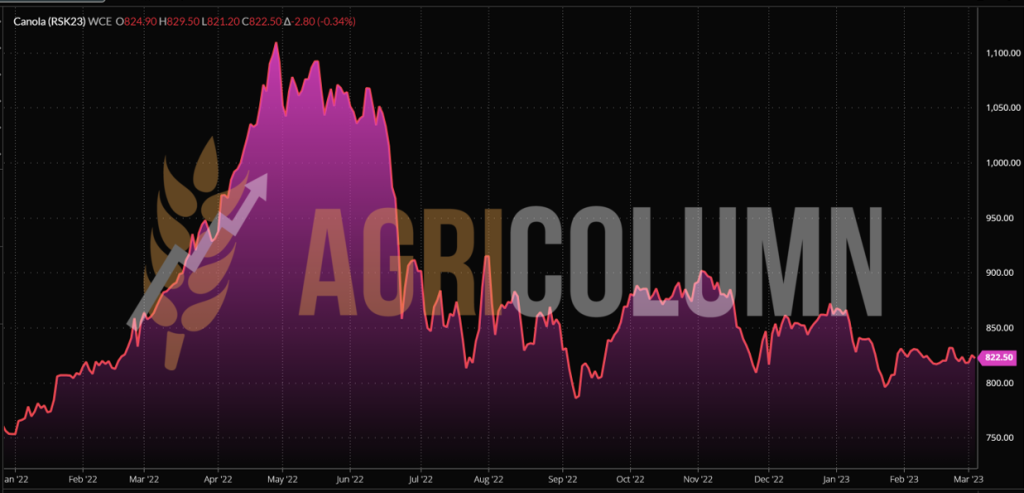
ICE CANOLA RSK23 MAY23 –822.5 CAD
CANOLA ICE TREND CHART – RSK23 MAY23
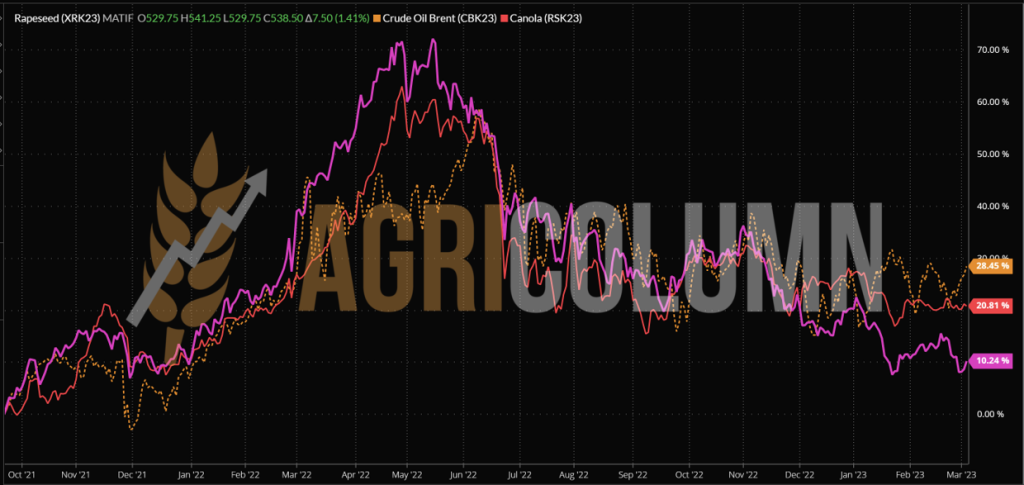
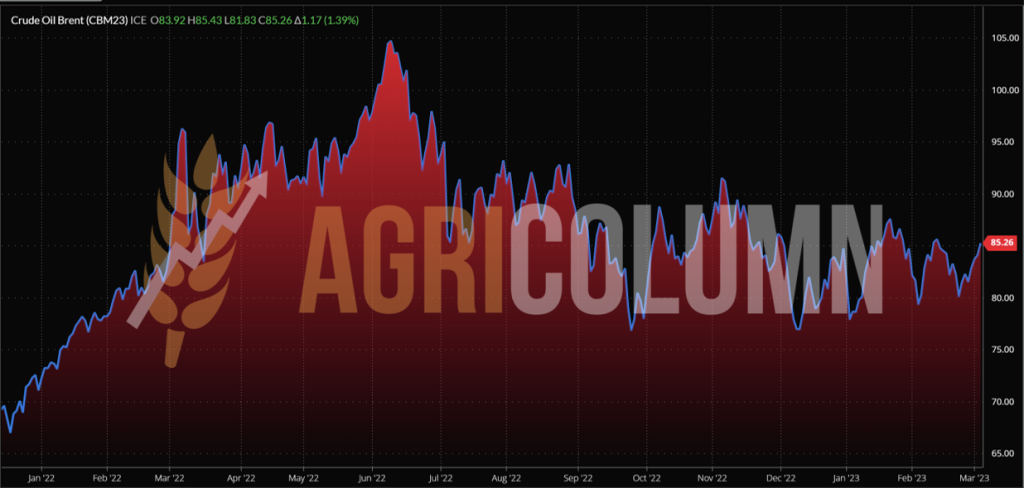
COMPARATIVE GRAPH. PETROL-RAPESEED-CANOLA CORRELATION
CAUSES AND EFFECTS
Rapeseed gains around 7 EUR at the end of the weekly session helped by Brent oil quotes. However, if we look at the last two weeks, we will see that rapeseed actually lost 12 EUR.
The abundance of raw material, the imports from Australia that have passed 2 million tons in the European Union, the future crop forecast of 19.6 million tons lead to the unique conclusion that rapeseed cannot generate future spikes. Russia will go into seeding in April, identical to Australia and Canada. India will produce below the level of last season, but enough. Australia will no longer generate 7.2 million tons as La Nina ends and goes into ENSO, so we’re looking at close to the multi-year average of 5.7 million tons in that area.
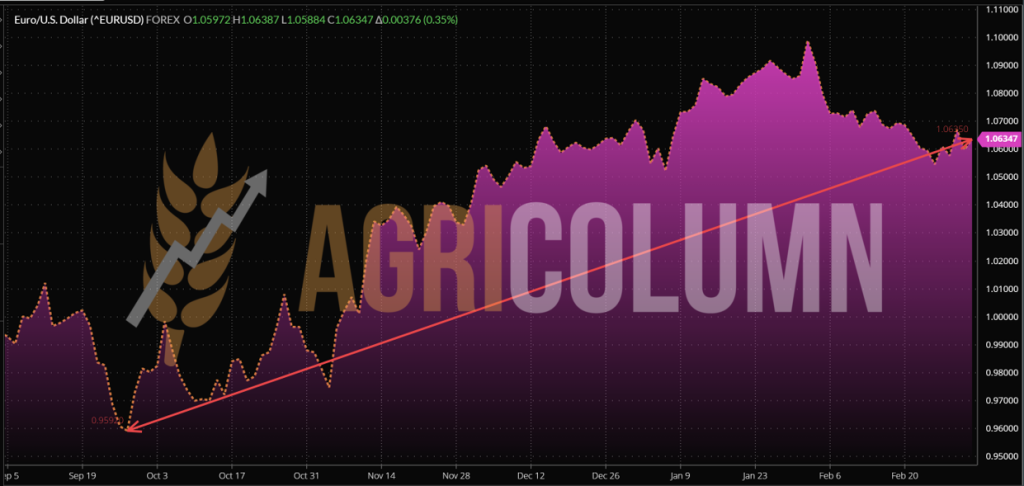
If you follow the EURONEXT chart that I have inserted above, you will notice the trend line that fixes two points in time, namely: October 6, 2021 and March 4, 2023, that is 18 months or better said 1.5 years. In other words, we are back to the price level of October 6, 2021, and this should indicate that this is the level, if not lower, going forward. The only sticking factor is the crop inverse, which is zero.

LOCAL STATUS
Constanța port quotes sunflower seeds at values between 510-520 USD/MT. Processors are correlating and indicating a trading base of 505-515 USD/MT at DAP Processing Units parity.
CAUSES AND EFFECTS
The same effect of Ukraine’s crude overcrowding and a lack of demand is weighing on the price and putting pressure on the commodity. So we have a decrease in the level caused by the unsold stocks of goods from Ukraine. And the month of March is about the last of the supply streak of the processing units. And Romania is also the holder of important stocks of sunflower seeds, which, if not sold, will put quite obvious pressure on the price of the new crop.
REGIONAL STATUS
UKRAINE. According to operational data, in the period September-January 2022/23, the export of sunflower oil from Ukraine decreased by 14% compared to the previous year, to 2.28 million tons. In particular, Russia’s blockade of the grain corridor operation and the increase in product delivery time significantly limit the operation of factories and the supply of Ukrainian products to the global market, especially to distant countries. The largest reduction in exports among traditional sales destinations was seen in India (-54%), China (-36%) and Iraq (-32%).
In addition, due to the disruption of the main distribution chains and the increase in the cost of delivery, the offer prices for sunflower oil on the Ukrainian export market in January-February 2023 were at their lowest level since November 2020.
At the same time, in September-January 2022/23 MY, oil delivery to the EU increased to almost 1 million tons (+19%). Thus, the European Union is the leader among importers of Ukrainian sunflower oil, with a share of almost 44% in the total volume of crude oil exports from Ukraine (32% annually). Ukraine also holds the leading position among suppliers of sunflower oil to EU countries, with a share of 85%.
GLOBAL STATUS

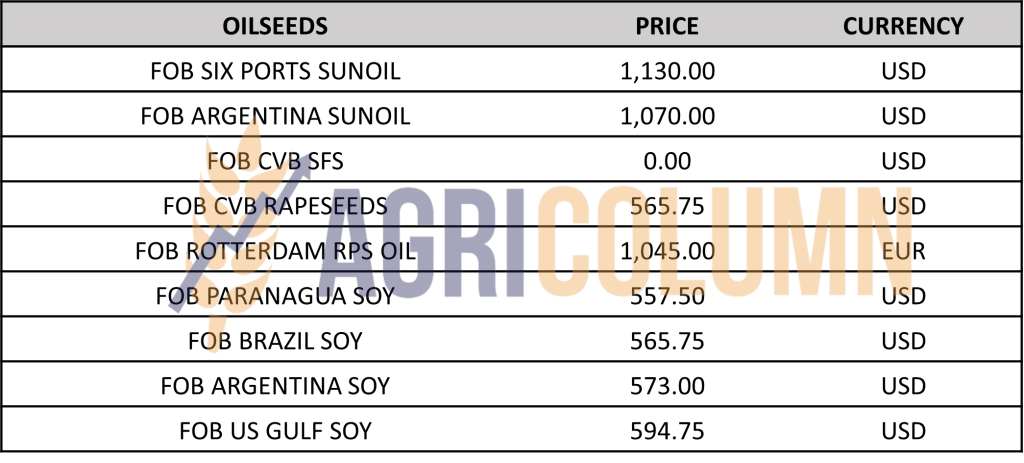
PRICE INDICATIONS FOR OILSEEDS AND CSFO IN MAIN ORIGINS
CAUSES AND EFFECTS
Sunflower seeds are under pressure. This is generated by the source called Ukraine, which has produced extremely much oil, but there is no demand for it from Asian areas, despite lower palm crop forecasts. Indeed, this oil was directed to the European Union, and the Union market is saturated at the moment. Turkey has taken a lot of raw material and crude oil at discounted prices and this destination is also covered.
At the moment, amid the decline in the price of soybean oil in the complex, nothing can help sunflower seeds. I admit that technically the expected level of 575-580 USD/MT was reached some time ago and there is no longer any fundamental in the physical market on which a potential price increase depends. Argentina is harvesting in stages and they will record a value close to 3.7-3.8 million tons, which will certainly be lower than the initial forecast of 4.2 million tons, but higher than the previous season when they harvested 3.5 million tons.
The only bullish factor could be a blockade of Ukrainian exports and a redirection of flows. Then, extra-continental demand could find itself in a position where Russia cannot supply and therefore there is not enough goods available. We still have about 25-35 days available for this potential.

LOCAL STATUS
In Romania, the price indications for soybeans are at the level of 560 USD/MT DAP processing units for non-GMO soybeans.
REGIONAL STATUS
The EUROPEAN UNION has reached a level of more than 7 million tons of imported soybeans. The origin of imports is led by the USA with a level of 3.56 million tons, followed by Brazil with 1.92 million tons. The table is completed by Ukraine with 0.77 million tons, Canada with 0.6 million tons and Uruguay with 0.12 million tons.
The European soybean production forecast is up 28% year-on-year to 3.2 million tons.
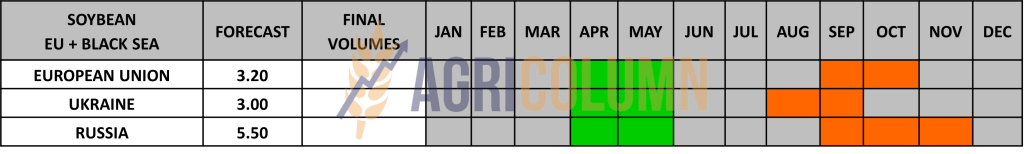
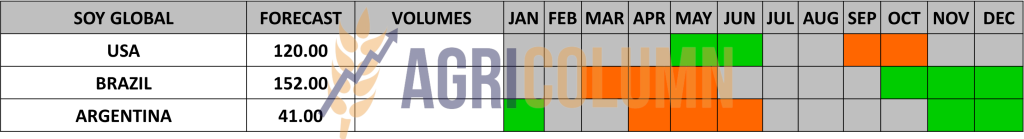
GLOBAL STATUS
USA. American sales to China increased. The previous week, a volume of 0.36 million tons was sold for export.
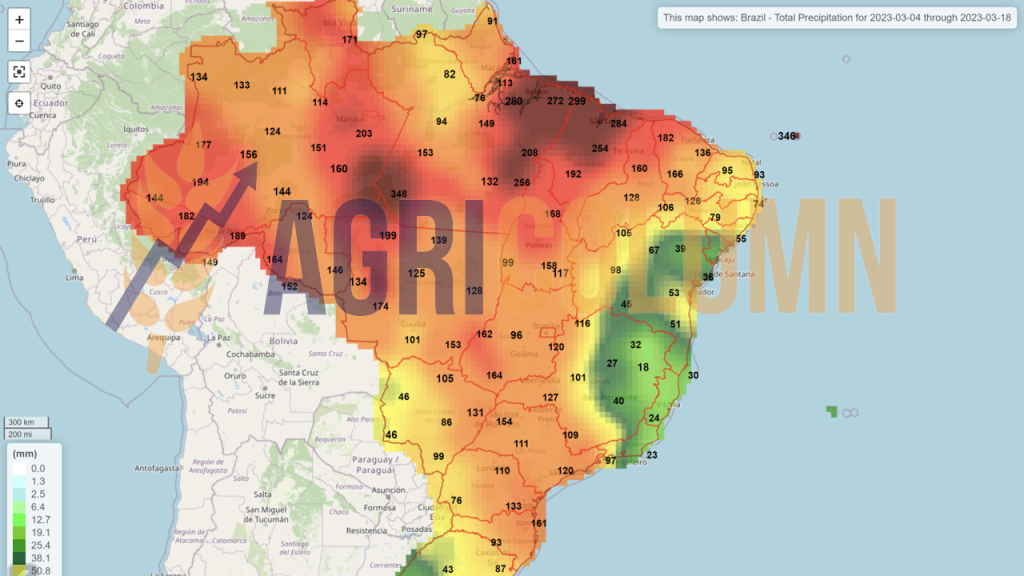
BRAZIL indicates a soybean production of 152.9 million tons, down by about 0.5-0.6 million tons compared to the previous report. The WASDE report will or will not adjust for this marginal decline.
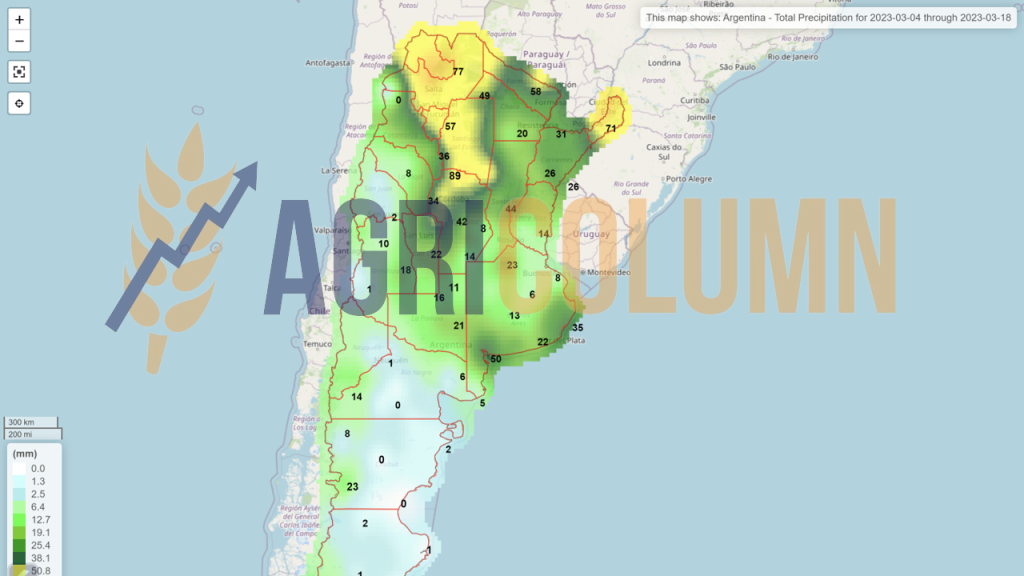
ARGENTINA drops dramatically in G/E rating, good to excellent, reaching close to 0%. Today the G/E indicator is at the level of 2%. And volume estimates are also down from WASDE February 2023, from a level of 41 mil tons to 36.65 mil tons, a considerable depreciation. WASDE will certify or not this drop in a few days.
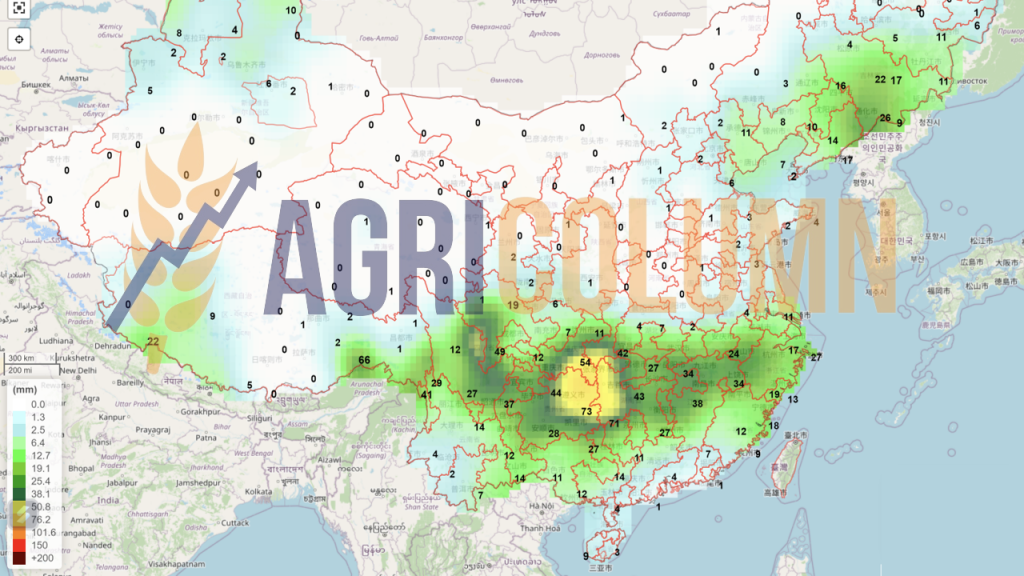
CHINA continues its robust purchase of soybeans from North and South American origins. In 2022, it was settled with 91 million tons, and this season, starting from September, it is at a level of 28.5 million tons of US origin, out of a commitment of 30 million tons.
CBOT SOY ZSK23 MAY23 – 1,518 c/bu (-1 c/bu compared to last week)
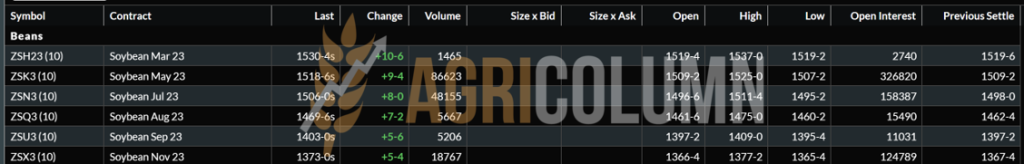
SOY GRAPH TREND – ZSK23 MAY23

Looking at the trend chart for soybeans, we note an advance of 154 USD/MT from 24 months ago. It’s really impressive how soybeans remain the only commodity that, due to Argentina’s distorted supply and demand, manages to retain an advantage. If we analyze the complex of the last year, we visualize that it is quite close to the peaks of June 8, 2022, when it reached a level of 1,564 c/bu, which is 574 USD.
The difference between 24 months of 154 USD is therefore expressed as follows:
March 3, 2021 = 404.5 USD | March 3, 2023 = 558 USD


EUR/USD from 0.95 to 1.063. A stronger dollar means a higher price in EUR. The reverse is visible in the physical market, with goods having a lower price in EUR.

BRENT JUNE23 = 85 USD/barrel

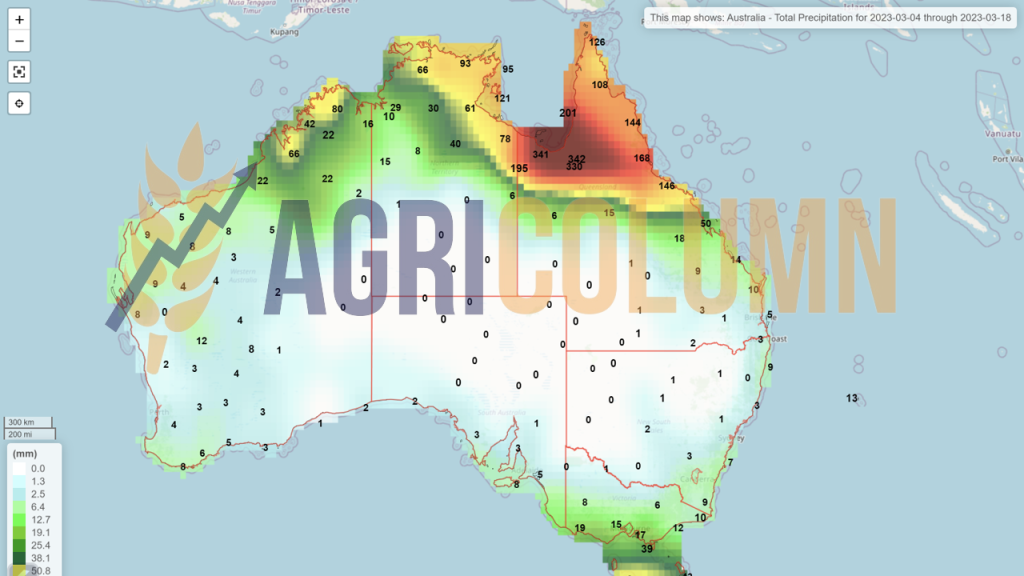
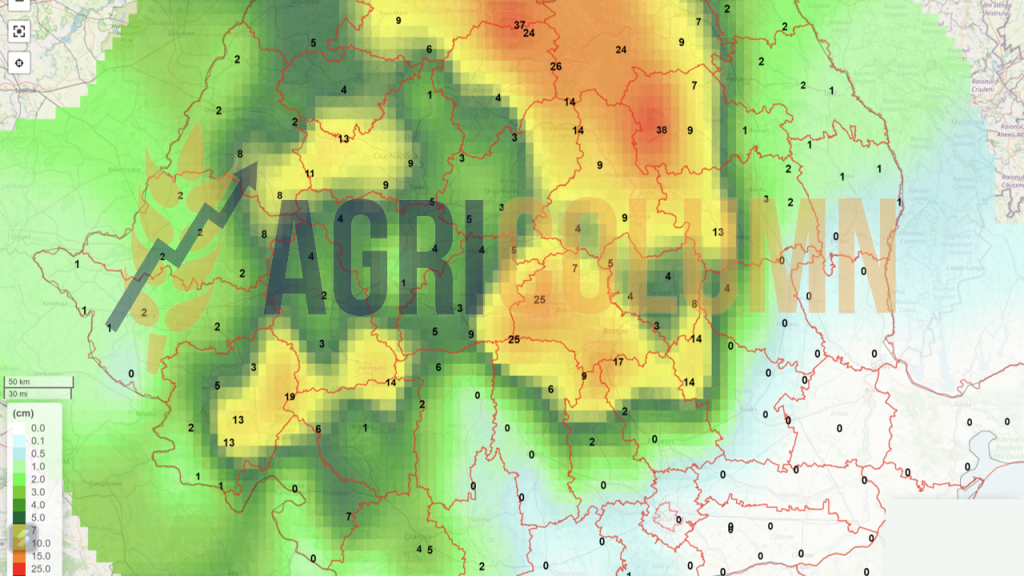
4-18 March 2023
Romania (rain)
Romania (snow)
Europe (rain)
Europe (snow)
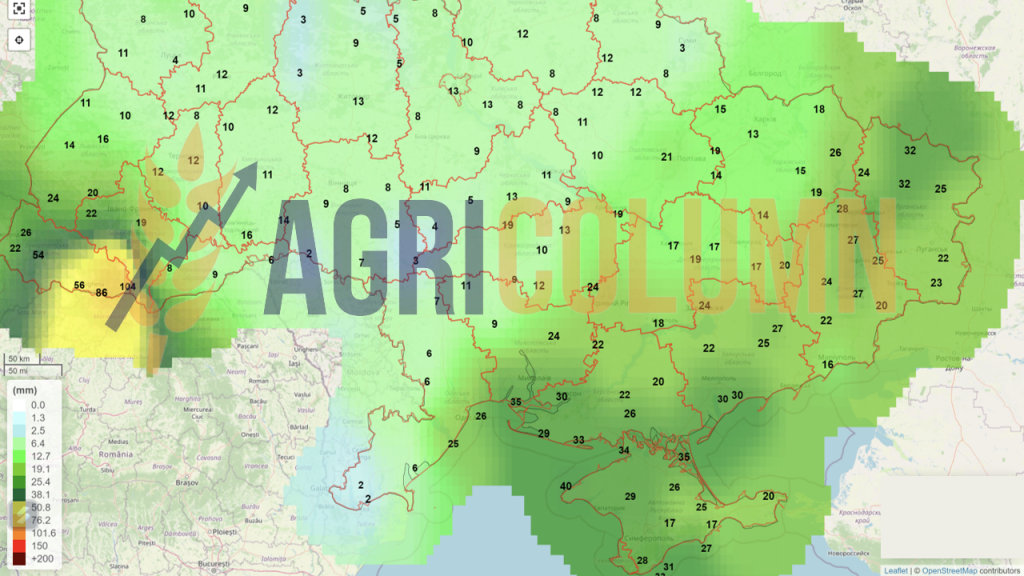
Ukraine (rain)
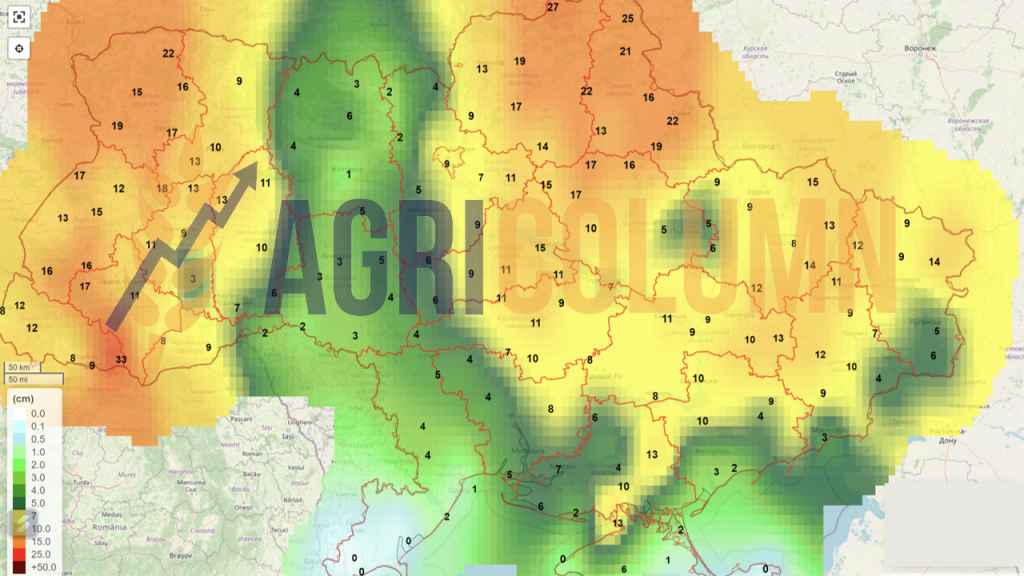
Ukraine (snow)
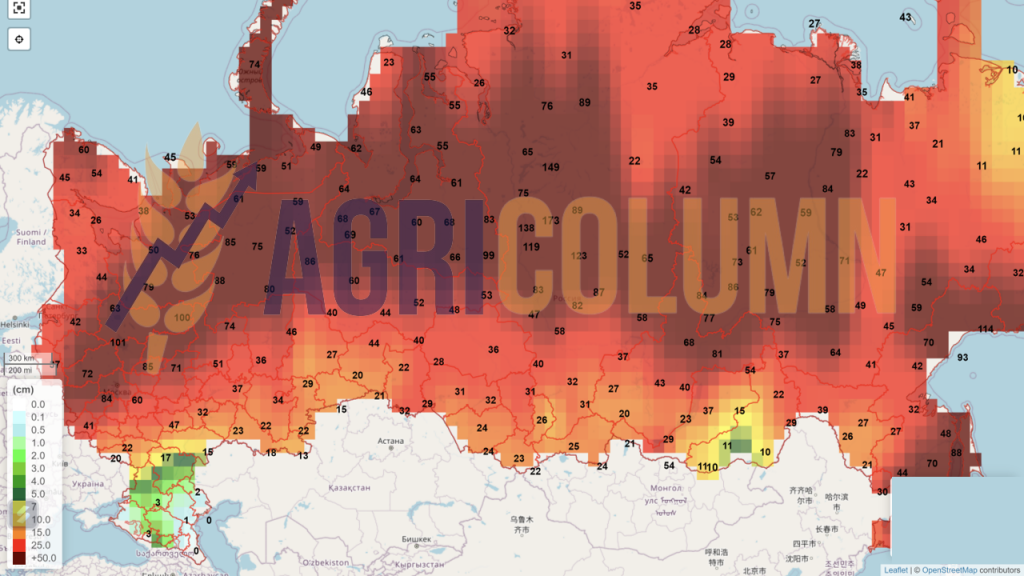
Russia (snow)
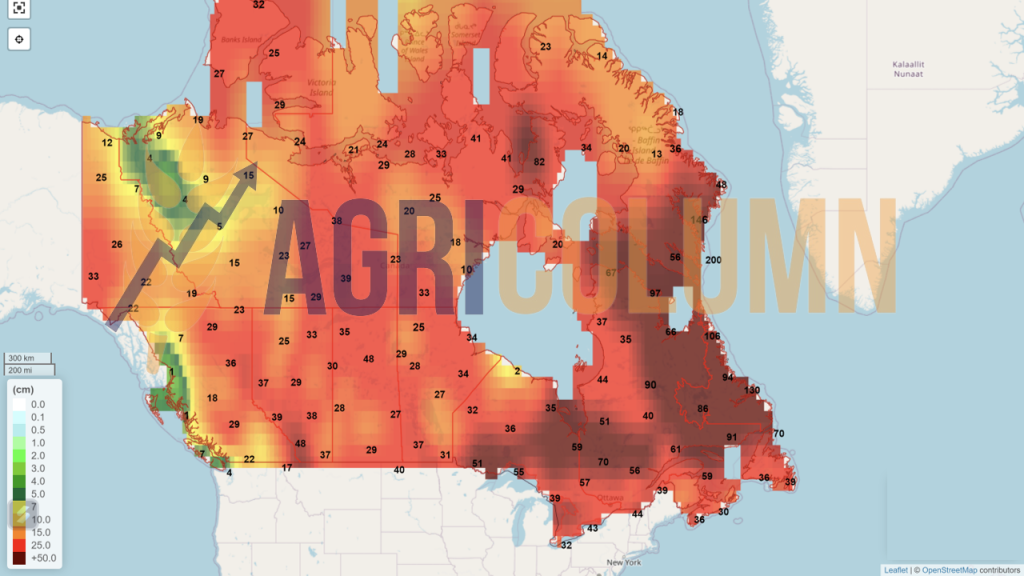
Canada (snow)
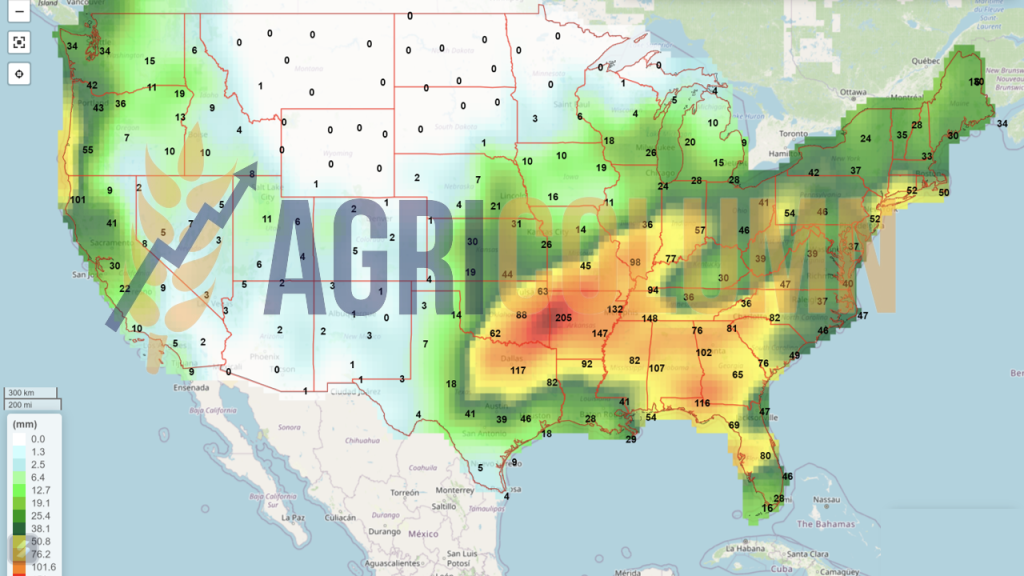
USA (rain)
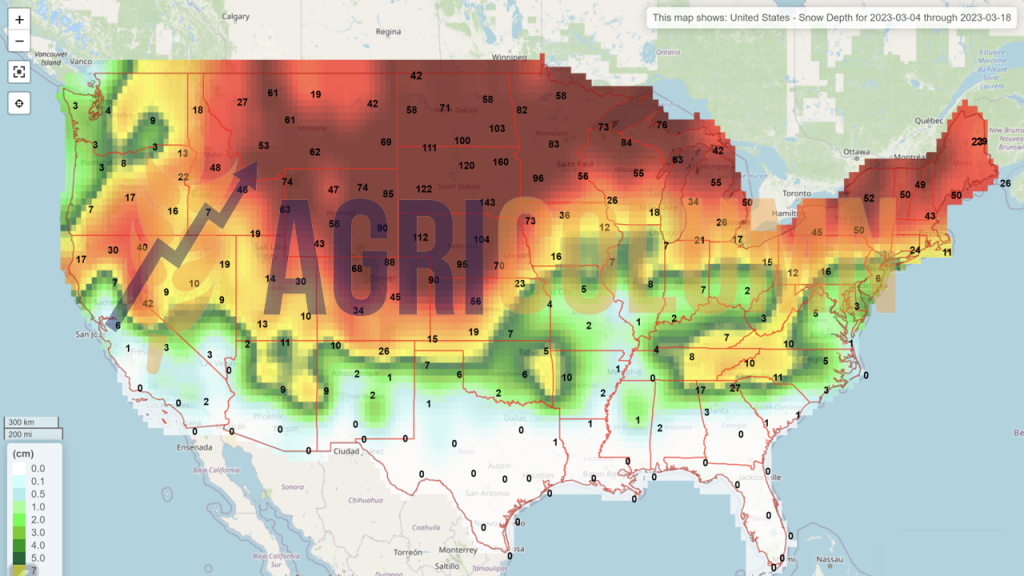
USA (snow)
Brazil
Argentina
China (rain)
Australia