This week’s market report provides information on:

LOCAL STATUS
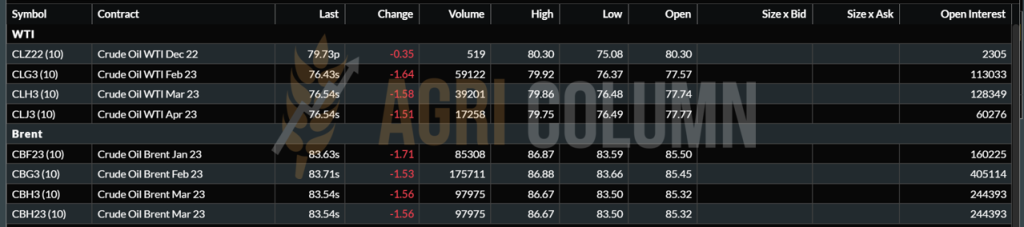
The indications of the port of Constanța are at the level of 305 EUR/MT in CPT parity. The price of feed wheat is 25 EUR/MT lower than the price of milling wheat. In the country, at the level of processing, the price indications are aligned with the Port of Constanța, with processors offering values of 300 EUR/MT.
CAUSES AND EFFECTS
The wheat market indicates stagnation for the moment, against the background of the price level generated by the last tenders where Russian wheat gained a large part of the volume. Romanian wheat remains at the same latent level in terms of price. What is now being seen and bringing, in turn, an apparent calm is the rainfall regime that appears to be giving a boost to the wheat crop this fall. Although appearances do not want to indicate the relationship between the old crop and the new crop, the correlation exists and the current moment is one that generates hope for the coming year.
REGIONAL STATUS
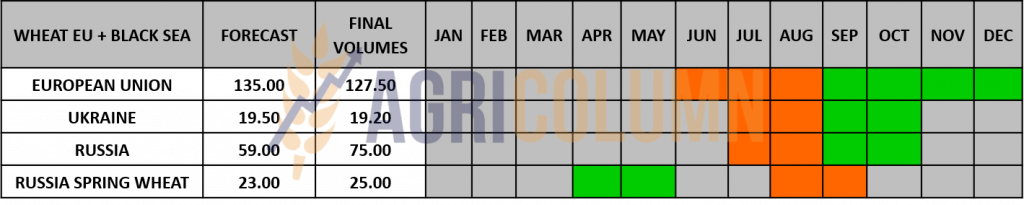
RUSSIA. Consulting firm IKAR raised its forecast for Russian wheat exports for 2022-2023 by 2 million tons to 44 million tons. Its overall forecast for cereal exports was raised by 1 million tons to 53.5 million tons, meaning non-wheat cereal shipments should be 1 million tons lower than those provided previously. This is somewhat at odds with the Russian export intention set at 47.5-50 million tons for the 2022-2023 season.
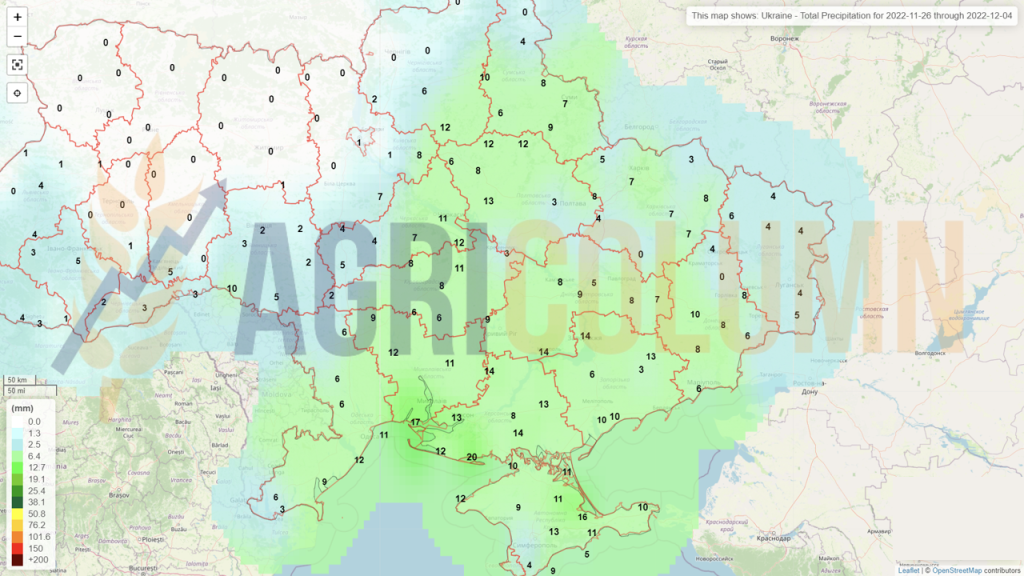
UKRAINE shows signs of slowing down in the wheat export process. It is a direct consequence of the rains and snows falling on Ukrainian territory. Moreover, Russia’s persistently damaged and demolished infrastructure makes domestic logistics less efficient.
THE EUROPEAN UNION. France reached a wheat export level of 7.8 million tons from the estimated 9.8 million tons in the 2022-2023 season. By default by the end of December 2022, France will export at least 75% of its export forecast. South-eastern Spain, all of Bulgaria and south-eastern Romania are experiencing problems amid the deep drought this autumn.

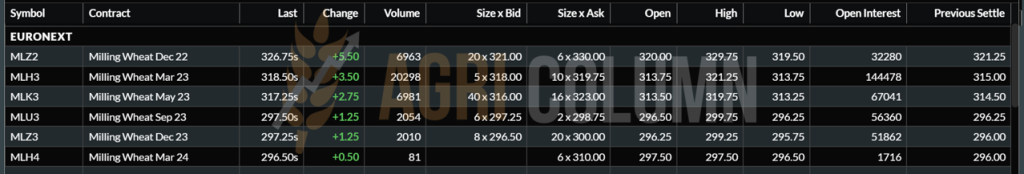
EURONEXT – MLH23 MAR23
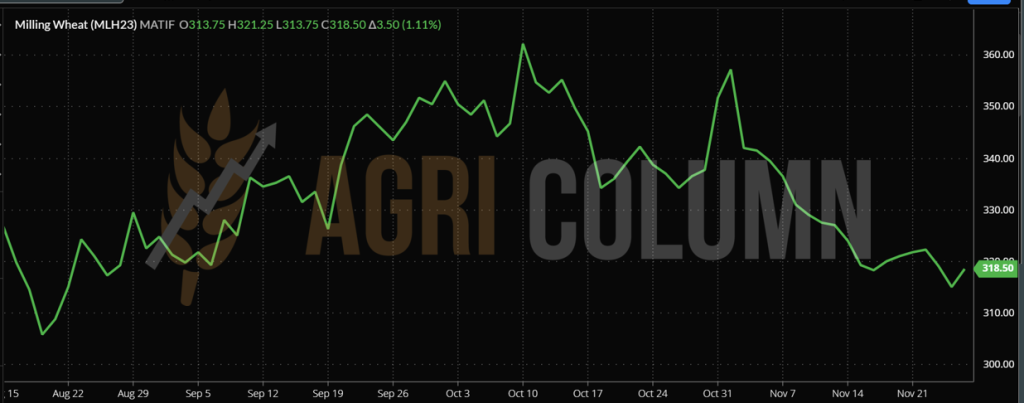
EURONEXT WHEAT TREND CHART – MLH23 MAR23
GLOBAL STATUS
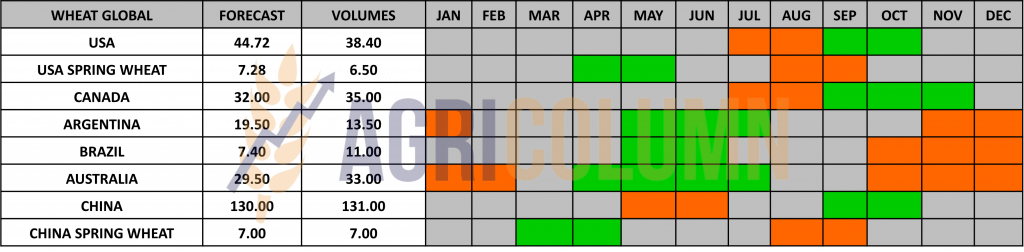
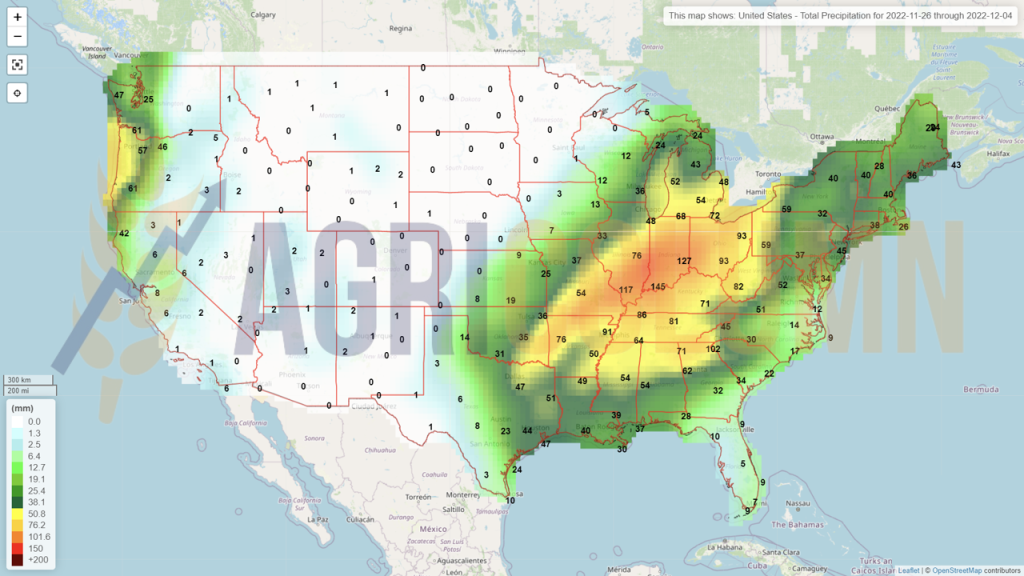
The USA is in the same status as before. Lack of rainfall causes US wheat to continue to suffer. Precipitation in the form of rain is present on the east coast, and snowfall is forecast in the northwest. But the Central Plains are still not getting any rainfall.
CANADA records very good values in terms of wheat quality. In addition, the fact that it has a crop surplus of 3 million tons positions it very well in the global context of exports.
ARGENTINA finds itself in the same desolate state. Nothing can change the fate of the Argentine wheat.
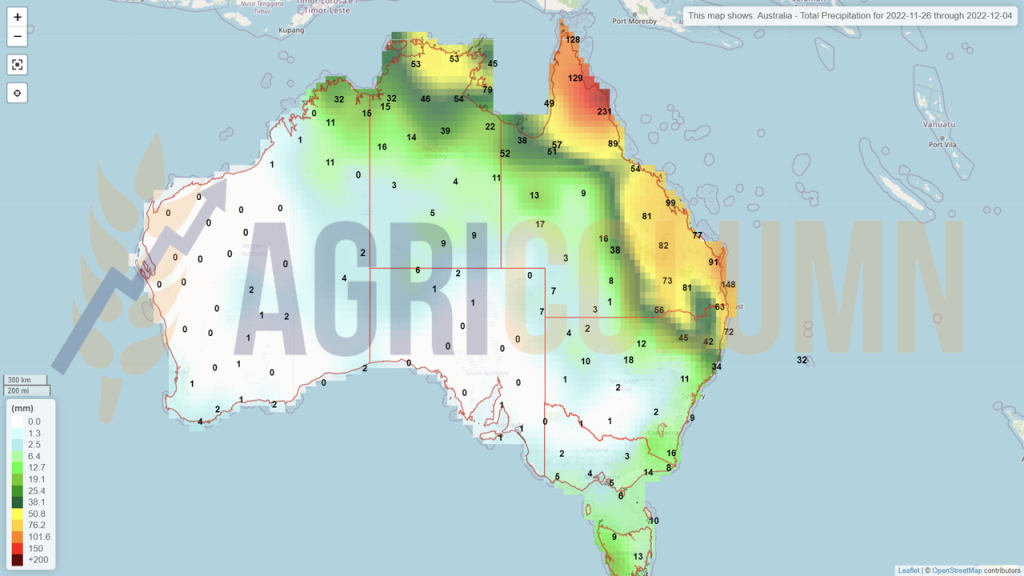
AUSTRALIA is in full harvest at this time. The rain has moved north and into New South Wales. Along with the state of Victoria, they can perform in terms of wheat harvest.
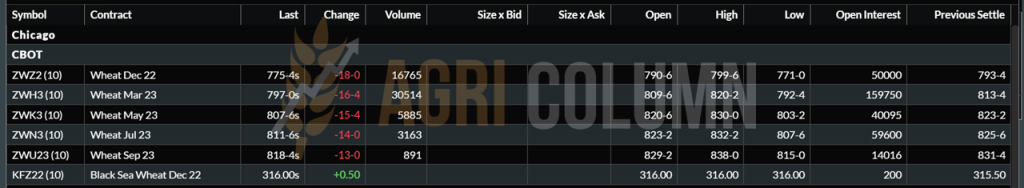
CBOT WHEAT – ZWH23 MAR23 – 797c/bu (-16c/bu = -5.9 USD)
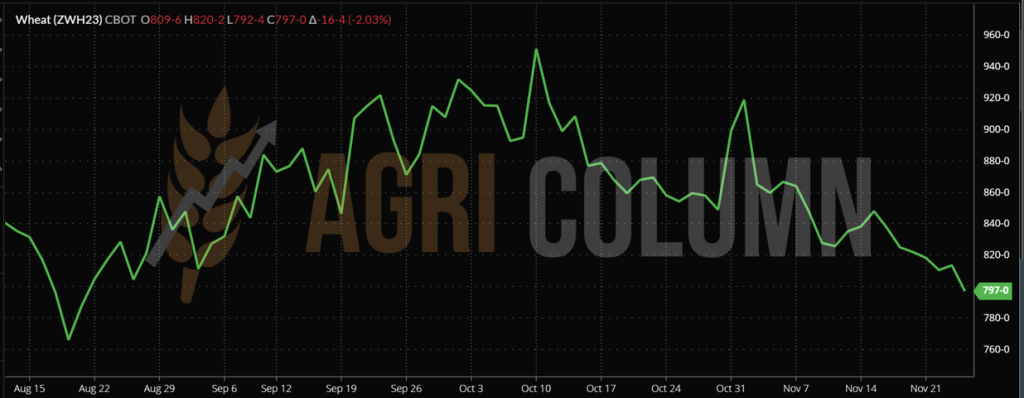
CBOT WHEAT TREND CHART – ZWH23 MAR23
WHEAT PRICE INDICATIONS IN MAIN ORIGINS

TENDERS AND TRANSACTIONS
GASC EGYPT has again purchased directly a volume of 375,000 tons of wheat at an indicative price level of 361 USD/MT in C&F parity. This has become a habit on the part of the Egyptian state, but the first for this direct purchase is that Ukrainian wheat entered the competition with Russian wheat and won a lot of 35,000 tons from the purchase made by Egypt. The Egyptian state began to lend wheat to private operators in the Egyptian profile industry, a sign that the latter’s financial problems are quite serious at this time.
TMO TURKEY is organizing a tender for the purchase of 495,000 tons of wheat for November 29, 2022.
TCP PAKISTAN is also looking for wheat. 500,000 tons of wheat are sought in the tender.
CAUSES AND EFFECTS
First, we have to consider the effect of Euronext, which generated a surge after the announcement of the extension of the Istanbul Agreement. Why? Because a lot of Euronext players were short and had to cover for the DEC22 indication to expire. This kept the Euronext market high in the indications.
The second aspect is that of the price difference between North American and European wheat. On the North American continent, as we well know, there have been problems generated by drought and we recall the USA, which closed at a level of 44.5 million tons, against an estimate of 52 million tons. Calibration with Canada did not occur due to the fact that the latter did not generate the surplus to cover the US deficit. Under this premise, US processors, especially those in the northern regions, will be supplied by Canada. Instead, a surprise could emerge for the southern area, where European wheat, at least the one from the Baltic Sea area, is extremely competitive in relation to indigenous North American wheat. Shipping costs have come down enough that we may see more deals like this in the near future.
In South America, the Argentine premises are dramatic. The various analysis houses estimate between 11.8 and 12.8 million tons of wheat production, and the USDA will have to intervene on December 9, 2022 one way or another, so as to reduce the production ratio that it had set to 15.5 million tons in the November 9, 2022 report.
Finally, on the European continent and in the Black Sea basin, the surplus of wheat still resides, as the unfavorable weather has its say. Rain, snow and cold considerably slow down exports from an operational point of view. Logistics to the ports is also affected. This is also seen in Ukraine, which is moving extremely slowly, especially after the extension of the Agreement.
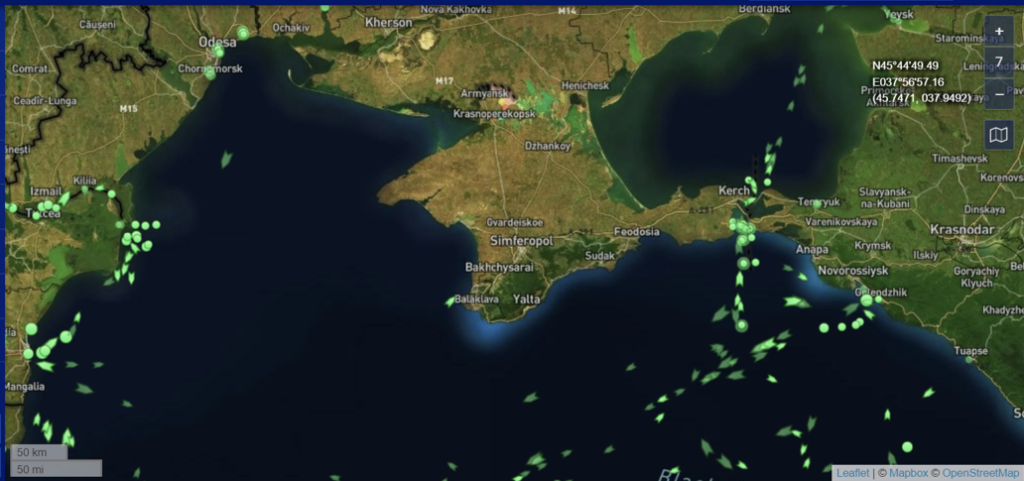
It is exactly the intended effect of the resulting relaxation. No more than 5-6 ships per day transit through the corridor. Stockholders no longer have the fervor to export anyway and at any price, especially since the price has fallen in FOB Ukraine delivery parity. It can be easily seen from the photo below the real time situation and how the Cereal Corridor is almost empty.
Source: marinetraffic.com
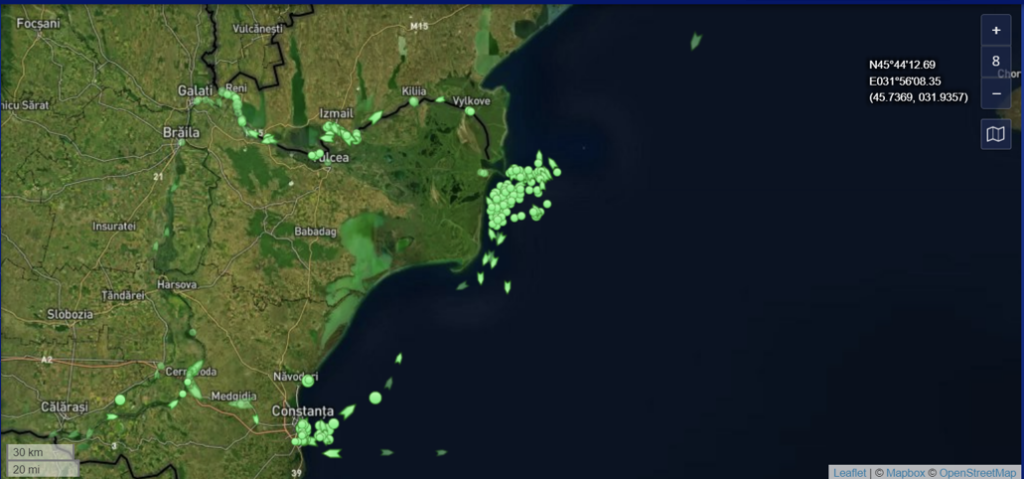
Instead, Russia moves its ships continuously to destinations, and Ukrainian goods pass through Romania, which can be seen in the photo below. The Sulina region is very crowded. The European route is much more attractive from the point of view of goods traceability and taxation, we could say. Photo source: marinetraffic.com.
The Australia factor will also generate pressure in the short term. The bountiful crop will cause discounts, especially due to the quality of the goods. However, it is certain that from 36 million tons, sufficient volumes will be found to generate the coverage of the demand for quality.
As if the flooding on Australia’s east coast wasn’t enough, a state of emergency imposed by a strike at the country’s largest pusher tug company has been in place since Friday indefinitely. Svitzer owns over 100 tugs operating in 17 ports in eastern Australia. They have 600 employees. And right now it’s a total gridlock. Vessels cannot be operated, neither those wishing to enter with goods, nor those wishing to leave.
This affects port workers, truck drivers, warehouse workers and will ultimately affect Christmas in Australia due to the lack of goods in stores. It is, if you will, the Australian version of the Suez Canal crisis (Ever Green). This strike also impacts Australian exports of wheat, barley and canola.
And the lockdown in China will be another stress factor for the price of wheat. China will maintain its annual import level of 10 million tons, but the demand for shipping fuel will drive cost reductions in global shipping, so any Origin will be able to compete.
As a sum of the conclusions, we can state:
- Volatility is still present, but not at the rates we would expect. Euronext will continue to YO-YO until positions are liquidated or rolled over for MAR23.
- With the passing of December 9, 2022, i.e. the release of the WASDE report, an apparent calm will rule the markets until after the holidays.
- Russia and its military aggression in Ukraine is a constant subject of stress and volatility. The destruction of Ukraine’s energy infrastructure, coupled with the cold winter that has almost arrived will be a hot topic every day. And Russia has been pretty quiet lately, which can be a worrying factor. We refer to Putin as the decision maker.
- Last but not least, the meeting between Ukraine and Russia in Saudi Arabia regarding a potential prisoner exchange in exchange for the export of Russian liquid ammonia via Ukraine did not bring any response. Some sources point to a US-Russia meeting in Arab countries on the subject this week. Exactly at the moment when NATO meets through its ministers in Bucharest, between November 29-30, 2022.
- If the exchange is agreed and carried out, the price of fertilizer will drop, but it will fuel the Russian war machine with the money Russia would receive in exchange for exporting liquid ammonia. But, in this way, the price of wheat and other raw materials will decrease.
The first move to yield was made by American wheat, which is showing much higher values than European wheat. This will generate more liquidity for European wheat as well. Destinations want cheaper freight, and the remaining window of time until the holidays will generate some emulation.

LOCAL STATUS
The feed barley price indications in the CPT Constanța parity are decreasing compared to last week, to the level of 260 EUR/MT.
TMO Turkey is organizing a tender for the purchase of 495,000 tons, with completion on December 1, 2022.
MIT JORDAN. The November 23, 2022 barley tender had 5 participants: Cargill, Viterra, Ameropa, Olam and Australian Grains. There were three offers. MIT canceled its bid without issuing a new date for a new bid attempt.
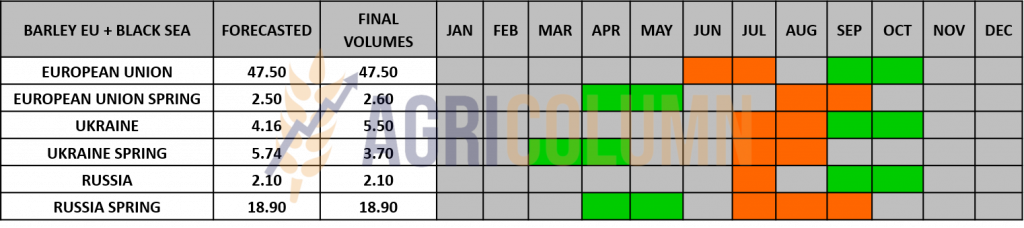
BARLEY PRICE INDICATIONS IN MAIN ORIGINS

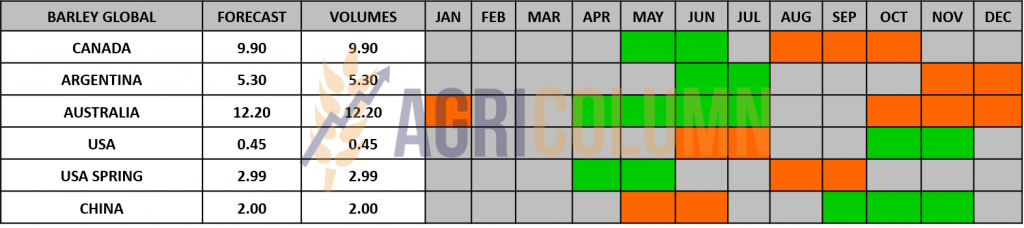
GLOBAL STATUS

LOCAL STATUS
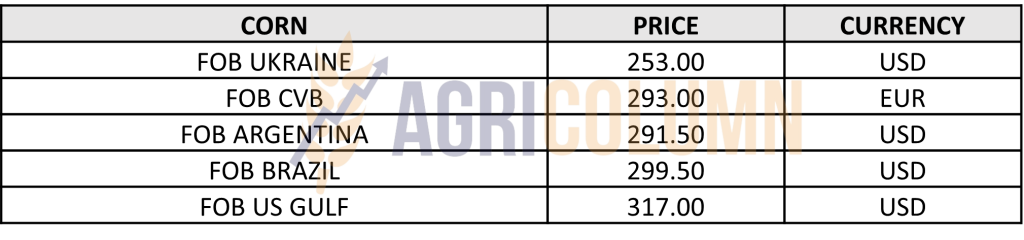
Corn indications in the port of Constanța remain constant at the level of 270 EUR/MT. Nothing surprising about that. The decline is driven by the negative pull of wheat and also the effects of the FED, effects that we see every day but have not wanted to consider.
REGIONAL STATUS
UKRAINE. The probability that part of Ukraine’s corn crop will remain in the fields for the winter is increasing. Heavy fall rains slowed harvest and raised corn moisture to 28-32%, which, amid high drying costs and low corn prices, makes harvesting impractical. The snow that fell in mid-November stopped field work altogether, and the same weather will remain for another two weeks.
In Ukraine, on November 18, 12.3 million tons of corn were harvested from 2.1 million hectares or 50% of the area, with a yield of 5.81 tons/ha, while local analysts estimated the crop at 27-28 million tons, and the USDA at 31.5 million tons. Maize can be harvested in winter or early spring, but in frosty conditions and the absence of snow in the field. Ukrainian farmers have not yet left such large volumes in the fields for the winter, so it is difficult to estimate possible losses now.
Traders have resumed buying corn at Ukrainian Black Sea ports at 175-205 USD/MT, but the pace of deliveries remains low, given the port delivery cost of around 55 USD/MT and the drying cost of approx. 68 USD/MT.
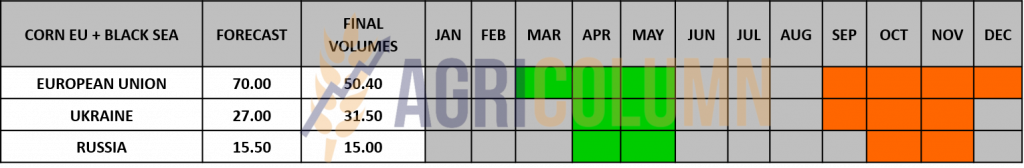
THE EUROPEAN UNION is unofficially revising its maize import forecast from 18-19 million tons to 22 million tons for the 2022-2023 season.
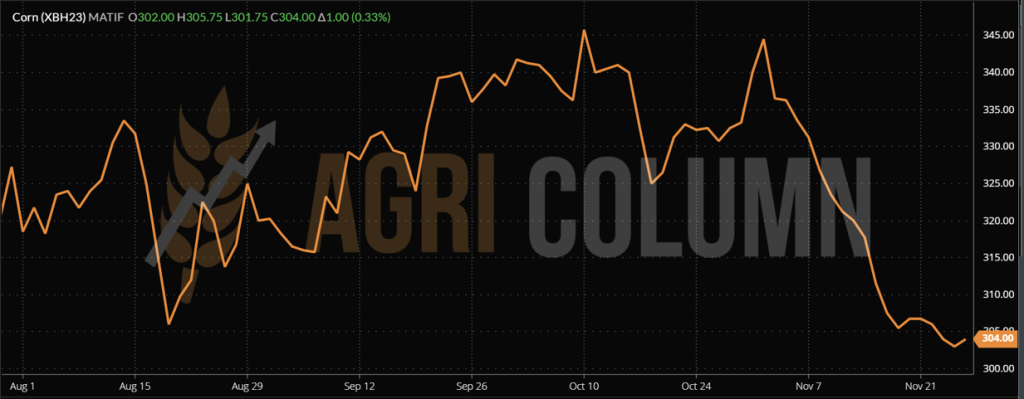
EURONEXT CORN – XBH23 MAR23 – 304 EUR (+1 EUR)
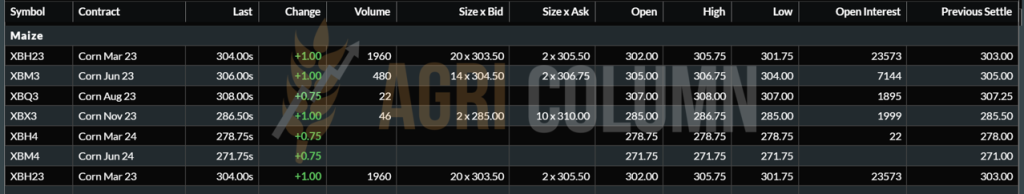
EURONEXT CORN TREND CHART – XBH23 MAR23
GLOBAL STATUS
ARGENTINA. No obvious change in the seeding process. In certain areas of Argentina precipitation has fallen, but their effect is not lasting.
BRAZIL advances in harvest. Sowing of summer corn crops in Parana reached 98% completion on November 21, representing a weekly advance of 5 percentage points, but remained down from the same period last year, when sowing had already been completed.
Surfaces rated as good remained stable at 85%, as did surfaces rated as average at 14% and those rated as poor at 1%.
The first corn crop is expected to reach 3.8 million tons in the southern part of the state, up 31 percent from last year, when both soybean and corn were affected by a severe drought.
In Brazil, planting of the summer corn crop advanced 9 percentage points during the week to a completion rate of 62.6%, but remains behind the 70.3% rate recorded at the same time last year.
In Rio Grande do Sul, 84% of the area has been planted and crops are currently in good condition in most areas. Meanwhile, the groundwork is expected to last until January.
In Paraná, seeding is nearing completion and stands at 95% completion, while 85% of areas are in good condition. Production is forecast at 28.1 million tons, up 12.5% from last summer’s crop.
USA is off season. But we must not forget to decouple from the 353 million tons a number of 53 million allocated to export.
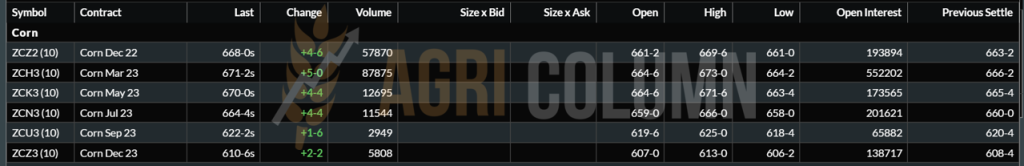
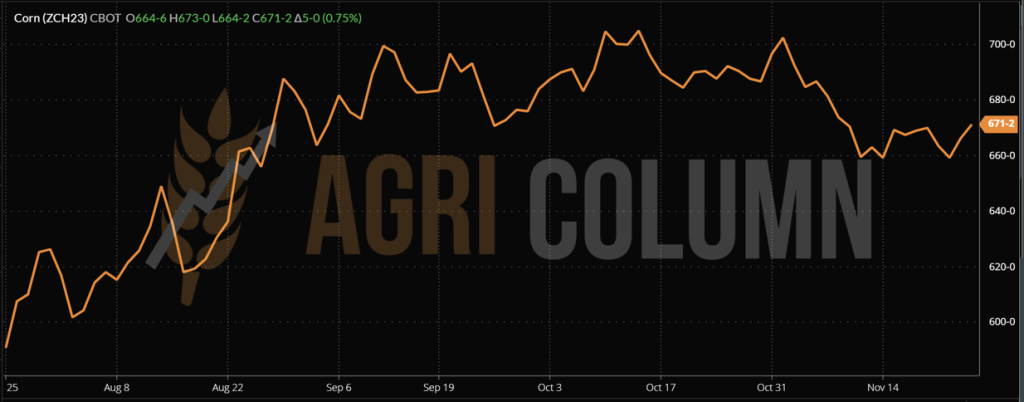
CBOT CORN ZCH23 MAR23 – 671 c/bu (+5 c/bu)
CBOT CORN TREND CHART – ZCH23 MAR23
CORN PRICE INDICATIONS IN MAIN ORIGINS
CAUSES AND EFFECTS
Visualizing the Ukrainian flows through the Corridor, we can state that they are very low in volume. Indeed, corn has a European destination and Ukraine is focused on exporting corn to the European Union. But here again we run into the problems of the past, namely a low level of traceability, non-compliant taxation and a partially underground economy. Unfortunately, Ukrainian farmers are the ones who settle. Only by seeing the 45 USD difference between CPT and FOB Odessa parity do we realize how and who is really making a profit on each ton of corn.
Judging by the level of the Ukrainian crop, we are in a position to estimate that it will not generate the 31.5 million tons promised by the USDA and potentially even the 27.5 million tons initially stated by the government of Ukraine. The rains will damage the potentially 50% of hectares left unharvested due to the high cost of drying operations. Today the volumes are still mixed (those from 2021 with those freshly harvested in 2022) and this generates a stability in the supply chain. But soon we will be able to see the correctness of our arguments regarding the volume of the Ukrainian harvest.
The USA has an export potential of 53-54 million tons, and the traditional partner China turned to Brazil, a first, if we can call it that. So we could see American corn exploring the Iberian peninsula soon, thanks primarily to the low cost of shipping across the Atlantic.
China, on the other hand, could be a boulder around the neck of the corn price. We clearly saw the disappearance of China from the Black Sea basin and after partially successful attempts to acquire corn from the US, partially incomplete due to the low level of the Mississippi River, and the move to Brazil.
But China has an import forecast of only 18-19 million tons this season, a fact governed by 2 factors. The first is a very good domestic production of 275 million tons, and the second factor is a particularly aggravating one from the import point of view. We are referring to the exacerbated lockdown which, according to estimates, affects over 420 million inhabitants of China. Beijing looks like a ghost town and the outlook is extremely bleak. This is apart from the social disorder that manifests itself locally. We are talking about falling demand for corn, which will matter in the global economy. Because the demand for corn for ethanol will subsequently decrease with the minimization of travel in China, we will witness a surplus of goods from the point of view of the decrease in industrial consumption, a fact that will be reversed in the price of corn at the global level. A Bloomberg Intelligence calculation of the potential abandonment of the ZERO COVID program in China indicates the following numbers: 363,000,000 infections, 5,800,000 intensive care admissions and 620,000 deaths.
We have, on the one hand, factors that can generate a support for the price of corn. Instead, we have a large consumer that could eat up the energy of the price by reducing industrial use, and we are talking about China, the country that will celebrate the Chinese New Year from January 22, 2023, until February 9, 2023, the Year of the Water Rabbit. And this tension-fueled lockdown will greatly impact trade and consumption in China, as well as globally.

LOCAL STATUS
Rapeseed indications appear in the same mold as in the last period, i.e. FEB23 minus 20-25 EUR/MT for the goods delivered in CPT Constanța parity and with FEB23 minus 15-20 EUR/MT for the goods delivered to the processing units.
CAUSES AND EFFECTS
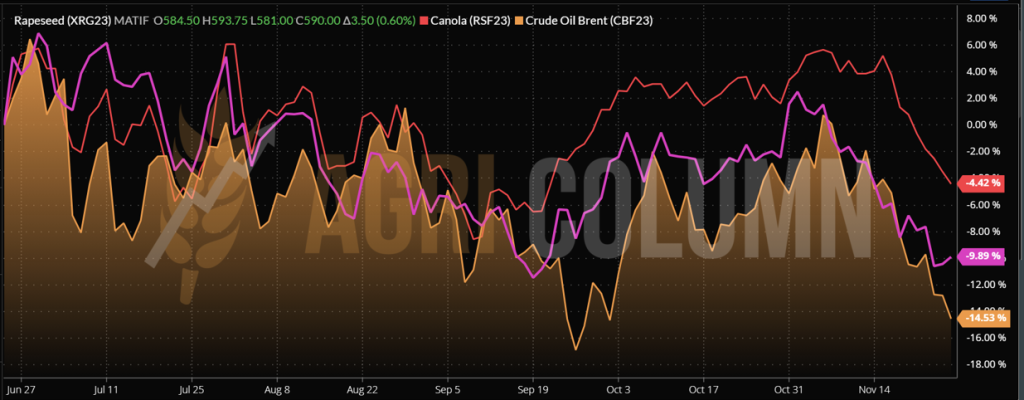
As we are used to, rapeseed correlates with the demand and, above all, with the indications of petrol. In this sequence, we have nothing new from last week. Processing demand is covered and is the main driver of decline this period for rapeseed.
Rapeseed does not have a favorable route in the next period.
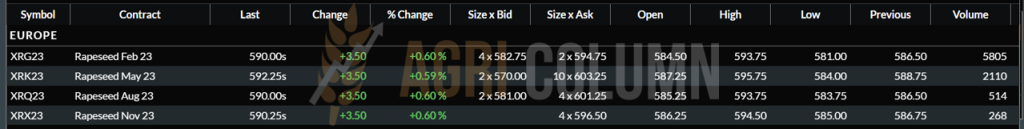
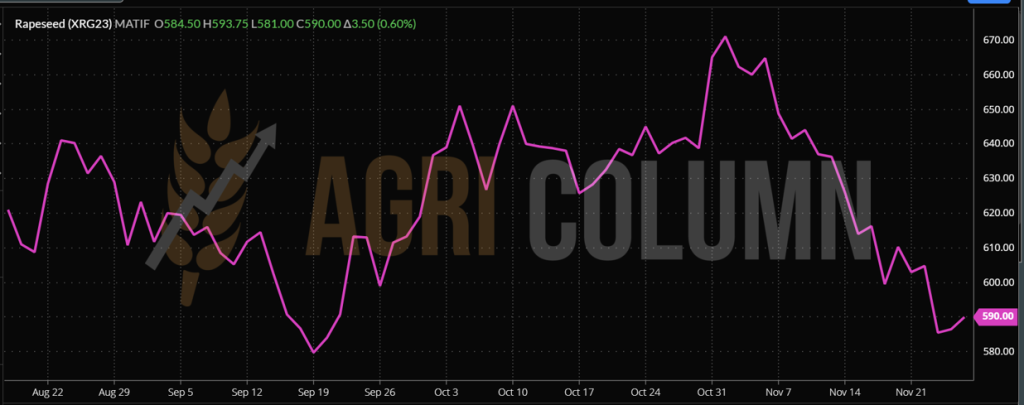
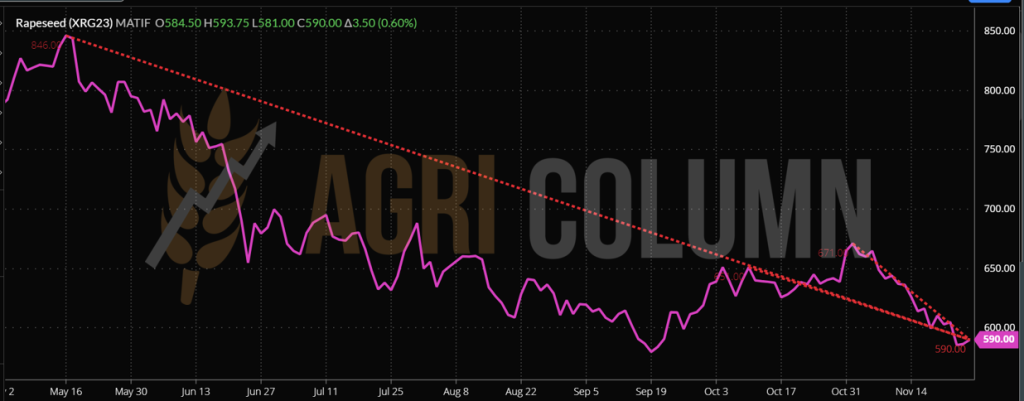
EURONEXT RAPESEED – XRG23 FEB23 – 590 EUR (+3.5 EUR)
RAPESEED CHART – XRG23 FEB23
GLOBAL STATUS
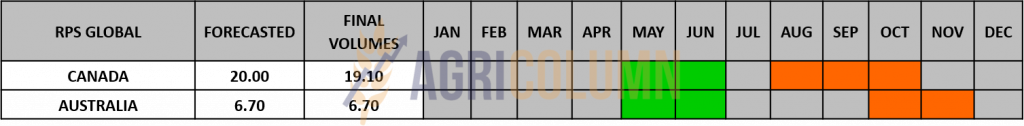
CANADA. Out of season.
AUSTRALIA is harvesting and acting as a pressure factor on the canola price.
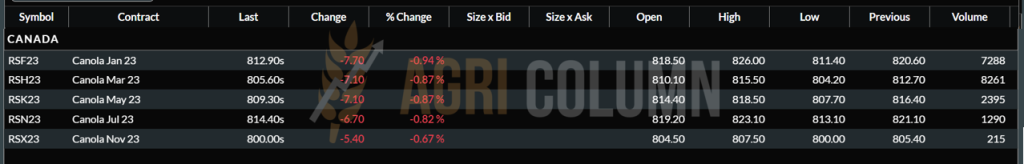
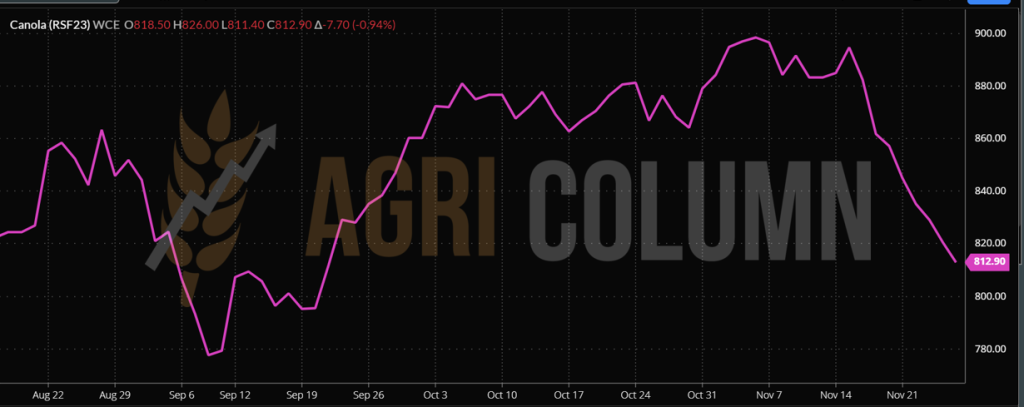
ICE CANOLA RSF23 JAN23 –812.9 CAD
ICE CANOLA TREND GRAPH – RSF23 JAN23
COMPARATIVE GRAPH. PETROL-RAPESEED-CANOLA CORRELATION
RAPESEED CHART, MAY-NOVEMBER 2022. MINUS 256 EUR
CAUSES AND EFFECTS
Rapeseed does not generate growth potential in the next period. EU rapeseed prices fall as canola supplies from Canada and Australia increase. As of November 17, compared to the previous season, EU countries increased their rapeseed imports by 38%, from 1.833 to 2.612 million tons, of which 66.4% or 1.736 million tons were delivered from Ukraine, 25.3% or 660 thousand tons from Australia and only 4.1% or 107 thousand tons from Canada, because Canadian canola is more expensive than Ukrainian and Australian canola. In this context, rapeseed quotations on the Paris stock exchange in November fell by 14.4%.
Ukraine is finalizing the export of rapeseed and has already delivered 2.5 million tons of the forecasted 2.6-2.8 million tons. European consumers are more actively buying local rapeseed, although producers are curtailing sales in anticipation of prices rising to the spring 2022 level, but forecasts are putting pressure on this market with a record canola crop in Australia.
In Ukraine, demand prices for rapeseed for delivery to ports on the Danube and the Black Sea remain at the level of 470-500 USD/MT, while for deliveries to DAP Poland and the Czech Republic they have decreased by 20-70 EUR/MT, reaching 550-570 EUR/MT. Importers have already built up the necessary stocks until January and are reducing purchases, especially since the volume of European rapeseed offers is increasing.
Amid high prices and demand, farmers in Ukraine and the EU have increased rapeseed acreage, which could add pressure on quotes in the spring, especially if the South American soybean crop lives up to forecasts.
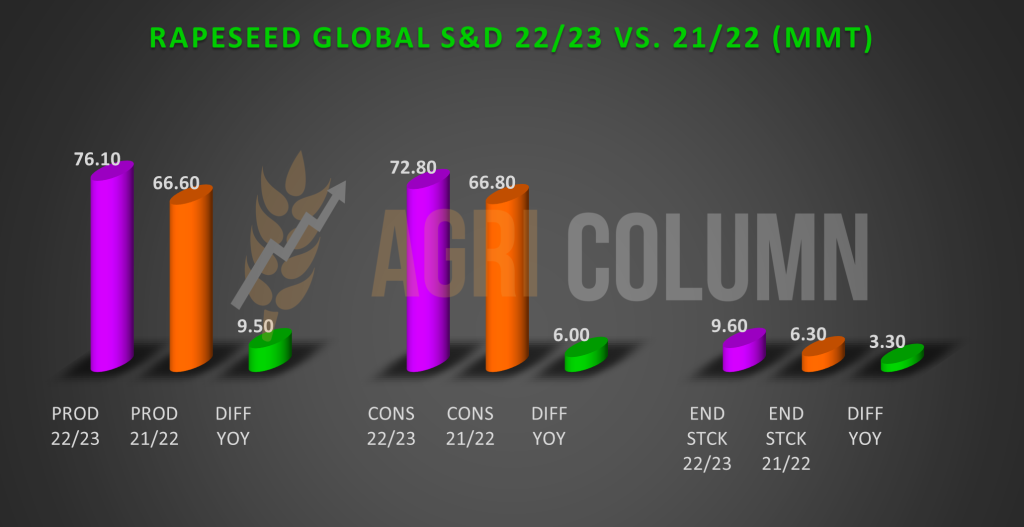
Reposting from the previous issue: What we still need to understand in the rapeseed chapter are the fundamentals of the physical market, which very clearly indicate a higher production compared to last season by 9.5 million tons. We also see higher consumption, indeed, but only by 6 million tons and consequently a higher ending stock level by 3.3 million tons. We have inserted the table for comparison, as well as the subsequent graph.


LOCAL STATUS
The primary indications for sunflower seeds are 560-565 USD/MT at the level of the Constanta port and about 5-10 USD/MT lower at the level of the processing units.
Bulgarian processors indicate a level of 580 USD/MT in DAP parity, and the cargo originating in Ukraine places it at 570 USD/MT.
CAUSES AND EFFECTS
Coverage is obvious for European processing units. But we still have at least 7-8 months of processing ahead of us, which will fuel the competition for sunflower seeds locally. Today the peace is evident, but it will not last more than 30-45 days. The application will return to the JFM stripe after the holidays.
REGIONAL STATUS
UKRAINE does not produce even 10 million tons of local production. Harvesting conditions were not permissive and we again see the decrease in Ukrainian potential.
This year, Ukraine will harvest the smallest sunflower crop in recent years, but so far this has not affected purchase prices, as the main processing plants are located near the Black Sea ports, and their activity has been stopped due to constant missile attacks and uncertainty with further exports.
The dynamism of ships entering Black Sea ports and the pace of sunflower exports are forcing processors to step up purchases and raise prices, given the lack of offers from farmers.
According to the Ministry of Agriculture, during the week, Ukraine increased the export of sunflower oil by 9%, up to 175.5 thousand tons, but decreased the export of seeds by 6.5%, up to 94.8 thousand tons, and that of sunflower meal by 67.5%, up to 46.99 thousand tons, due to the lack of supply from producers. In total, in 2022-2023, 1.36 million tons of sunflower oil and 770.7 thousand tons of seeds were exported. Most factories are unable to process sunflowers due to power outages and are gradually restocking as export shipments are made.
Ukrainian sunflower purchase prices rose to 410-435 USD/MT ex-works following higher export prices but could soon fall again amid lower oil export prices and sunflower seeds.
Sunflower export prices for delivery DAP – Romania, Hungary and Bulgaria had increased from 550-570 USD/MT to 580-600 USD/MT but fell back to 550-560 USD/MT DAP as of Monday, under pressure from the drop in oil and palm oil prices by 9-11%.
Asking prices for sunflower oil for delivery to Bulgaria fell to 1,220-1,230 USD/MT DAP, while those for port delivery remained at 1,000-1,050 USD/MT.
RUSSIA is falling, just as we predicted last week. On November 24, the sunflower crop amounted to 13.3 million tons. Sunflower was harvested from 7.3 million hectares (9.6 million hectares a year earlier).
The sunflower harvest is going badly because of the weather conditions. Sunflower harvesting will certainly continue, as large areas of the Center region and the Volga region have not yet been harvested, but it is still difficult to assess what condition the seeds will be in.
The most difficult situation in terms of cleaning is in the Center, especially in the Chernozem region, but this problem has also affected part of the Volga region. Due to prolonged rainy weather, the quality of oilseeds has declined, but farmers will try to harvest to recover costs at least partially.
Sunflower prices are gradually increasing. Thus, in the Center the price by the end of the week reached about 461 USD/MT. At the beginning of November, it was at the level of 412 USD/MT. In particular, the increase is due to the fact that processors have a fairly large profit margin from processing, so they can give up some of it to farmers.
The EUROPEAN UNION is out of season.
GLOBAL STATUS
PRICE INDICATIONS FOR OILSEEDS AND CSFO IN MAIN ORIGINS

CAUSES AND EFFECTS
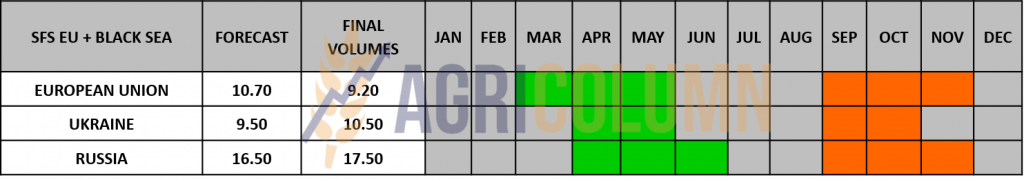
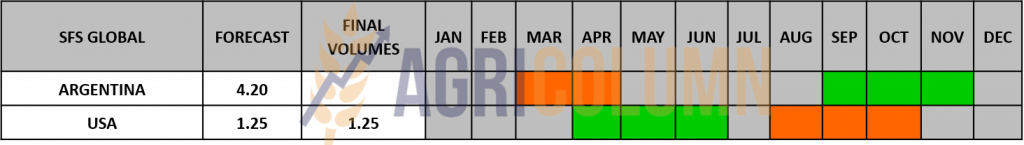
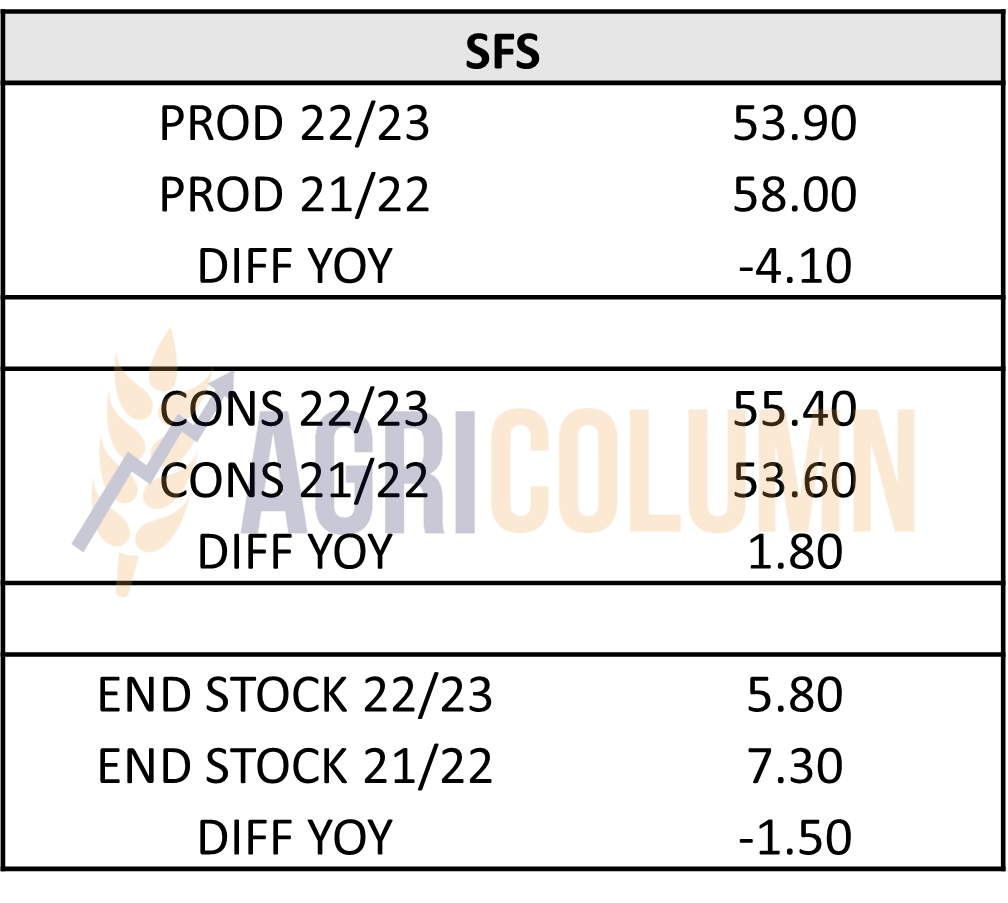
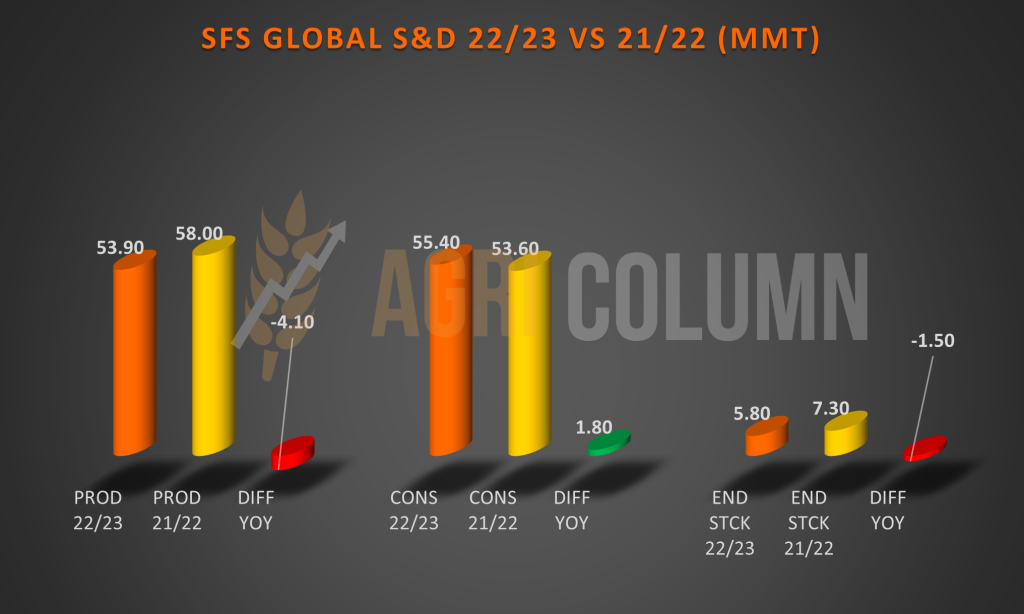
We enter the “weather market” area for sunflower seeds. And our estimates are proving correct regarding the status in Ukraine and Russia. Both countries are experiencing declines in harvest volumes. If in Ukraine we can estimate a final crop of almost 10 million tons, Russia is still far away. In practical terms, it harvested a maximum of 13.3 million tons, and up to 16.3 million tons (the current estimate, not the previous estimate of 17.5 million tons) is still a very big difference. In both tons and percentages. Already in Russia we are no longer talking about performance on what remained unharvested, but about the recovery of the investment. This, combined with the fact that these seeds, potentially remaining to be harvested, will require drying and conditioning, will cause the price of the raw material to rise. The seed price will, according to our forecasts, point to a rise and support after the holidays and to reinforce this we are re-inserting from the previous issue the global Supply & Demand for the current season.
So, this is how the 2022-2023 season looks globally compared to the previous one, which, let’s not forget, was a very attractive one in terms of volumes. We’ve been talking for a while about the pairing between 2020-2021 and 2022-2023, and here the numbers bear it out. We have an imbalance compared to the previous season, 2021-2022. We therefore have a production level down by 4.1 million tons compared to last season, consumption up by 1.8 million tons and a negative ending stock level by 1.5 million tons.

LOCAL STATUS
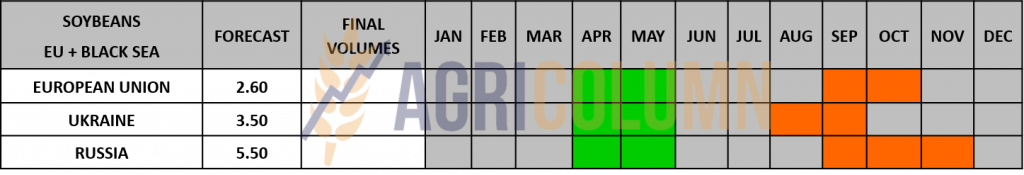
In Romania, the price indications for soybeans are at the level of USD 560/MT DAP processing units for non-GMO soybeans. Between July 1 and November 20, 2022, approximately 120,000 tons of soybeans were imported.
REGIONAL STATUS
Weekly soybean imports from the European Union rose to 183,632 tons, bringing total imports since July 1 to 4.16 million tons. The main origins were the USA and Brazil, with shares of 1.7 million tons and 1.6 million tons, respectively.
The total import of soybean meal by EU countries for the current year amounted to 6.3 million tons.
GLOBAL STATUS
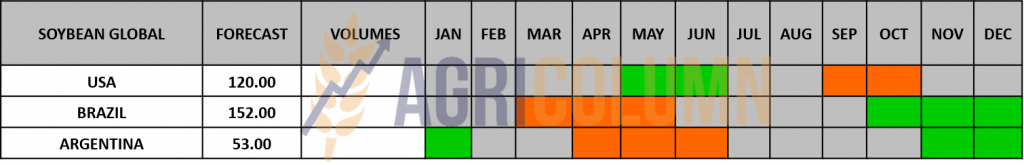
USA. Weekly soybean inspections stood at 2.3 million tons, up from 1.8 million tons the previous week and up from the 1.9 million tons average over the past five years.
The largest volume was destined for China, as 1.7 million tons of soybeans were inspected for export to the Asian country. Other destinations were Mexico (153,900 tons), Germany (124,933 tons) and Vietnam (68,490 tons).
The weekly volume pushed total inspections for the start of the 2022-2023 marketing year to 17.1 million tons, down 12.2% from a year earlier.
BRAZIL. About 80 percent of Brazil’s soybean crop has been planted, up from 69 percent a week ago, but still behind last year when 86 percent of the crop was planted. Michael Cordonnier kept his estimates for Brazil’s soybean production unchanged at 150 million tons, but said he was “concerned” about the country’s weather patterns.
Production costs for soybeans in Brazil’s top agricultural producer state, Mato Grosso, fell as the price of fertilizers and other inputs fell, according to the state’s agricultural institute, IMEA. IMEA’s first estimates for the 2023-2024 soybean crop showed a 2.7% drop in costs compared to 2022-2023. The decrease in costs is mainly related to soybean seeds (-12.6%) and fertilizers (-15.7%), IMEA said. On the other hand, total operating costs for 2023-2024, which also include depreciation, increased year-on-year due to higher prices of machinery and other equipment.
Brazil’s soybean exports are expected to reach 78 million tons this year, down 9.3 percent from 86.3 million tons in 2021, according to grain exporters’ association Anec. But the figure is 2.5 million tons higher than the previous estimate of 75.5 million tons for soybean shipments.
ARGENTINA. Soybean planting in Argentina for the 2022-2023 cycle is facing serious delays compared to last year as the country suffers a prolonged drought and expects only light rainfall in the coming days, according to the Buenos Aires grain exchange.
Soybean seeding rate in Argentina is usually very precise, meaning it doesn’t vary much from year to year. But things are significantly slower this year, with planting 17 percent complete this week, compared to an average of nearly 30 percent. Soil conditions were very dry.
Although this year’s sown area is forecast at 16.7 million hectares, slightly above last year’s 16.3 million hectares, the drought has left very little moisture in the soil.
At a meeting organized by the Inter-American Trade and Production Council, Argentina’s Minister of Economy, Sergio Massa, hinted that an official announcement regarding the reintroduction of the “soy dollar” will take place soon, and market sources expect the new rate exchange rate to be fixed at 225 pesos to one US dollar.
Between the drought and the liquidity generated by the last “dollar-soybean” program, there have been no sales in the last 30-60 days, and the government needs the foreign currency income. No one knows what volumes farmers will sell under the new scheme, but the government hints that a success would be a total of 5 million tons of soybeans sold.
CHINA. Soybean stocks rose 15.15 percent from last week to 3.42 million tons, while the level is 20.8 percent below a year ago.
CNGOIC (National Grains and Oil Information Center) said China’s processors have kept utilization rates low due to a lack of soybean inputs, but still expect processing volumes to rise steadily in the future as that the pace of imports increases.
Soybean meal stocks were still down 20% from last month. Compared to the same period last year, scrap stocks fell by 55%. The huge drop in stocks was driven by tight soybean supply and a recovery in hog feed demand since June. Stocks are expected to rise gradually in December as processors ramp up processing given the better supply of soybeans. However, the build-up of soybean meal stocks could be slower as demand for hog feed is expected to be strong.
Processors believe soybean import costs are likely to remain relatively higher due to limited supply of old crop from South America. The possible return of Argentina’s dollar-soybean program could put further downward pressure on soybean prices, and the Argentine government is expected to make a formal announcement on the implementation of the dollar-soybean program before buying more a lot of soybeans from Brazil and the USA for the next deliveries.
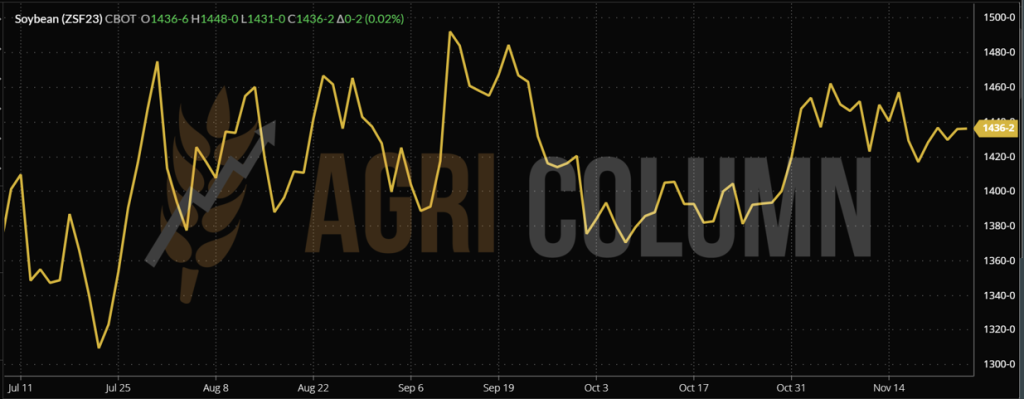
CBOT SOYA ZSF23 JAN23 – 1,436 c/bu
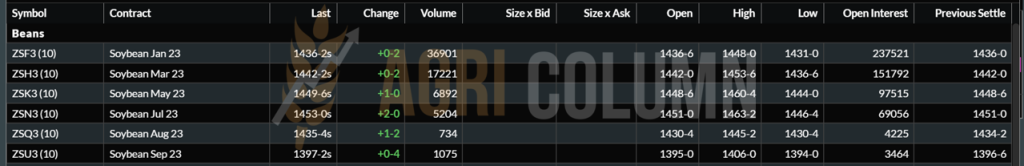
CBOT SOYBEAN TREND CHART – ZSF23 JAN23


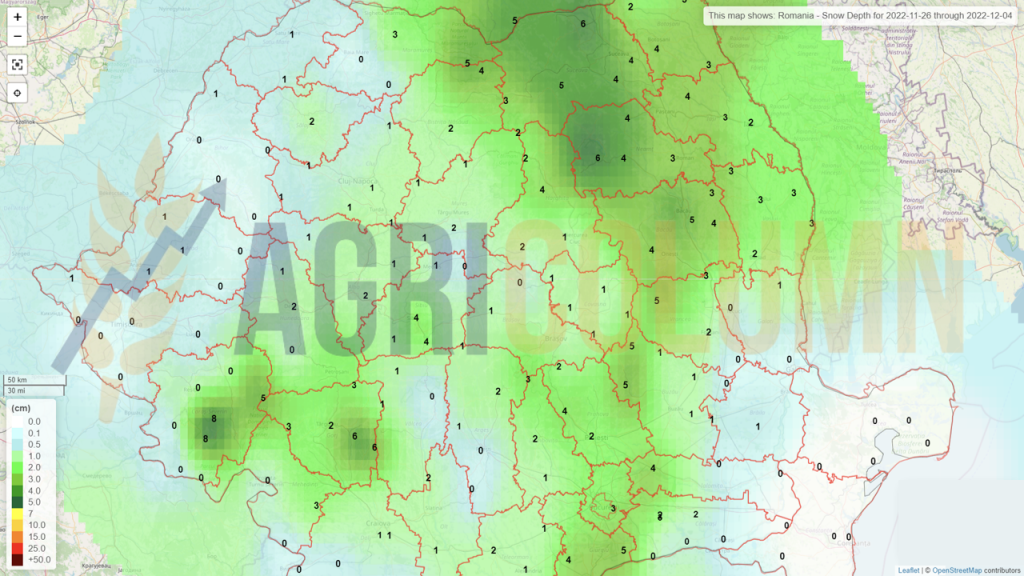
26 November – 4 December 2022
Romania (snow)
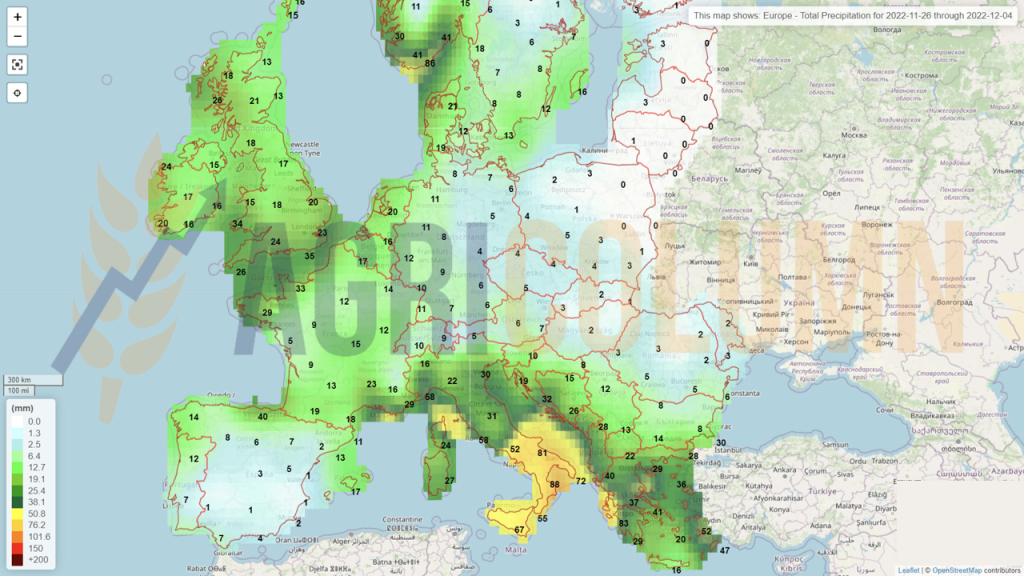
Europe (rain)
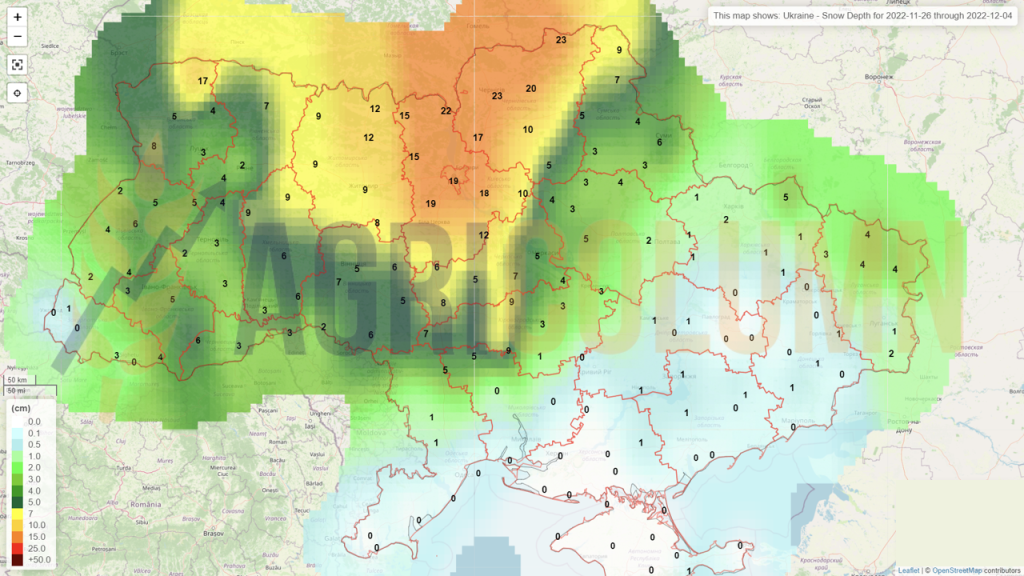
Ukraine (snow)
Ukraine (rains)
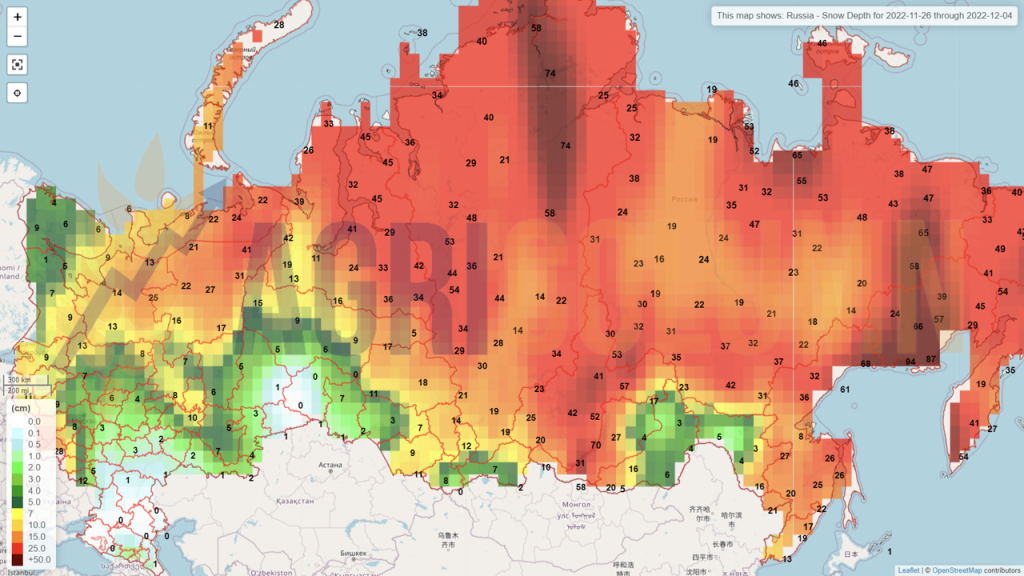
Russia (snow)
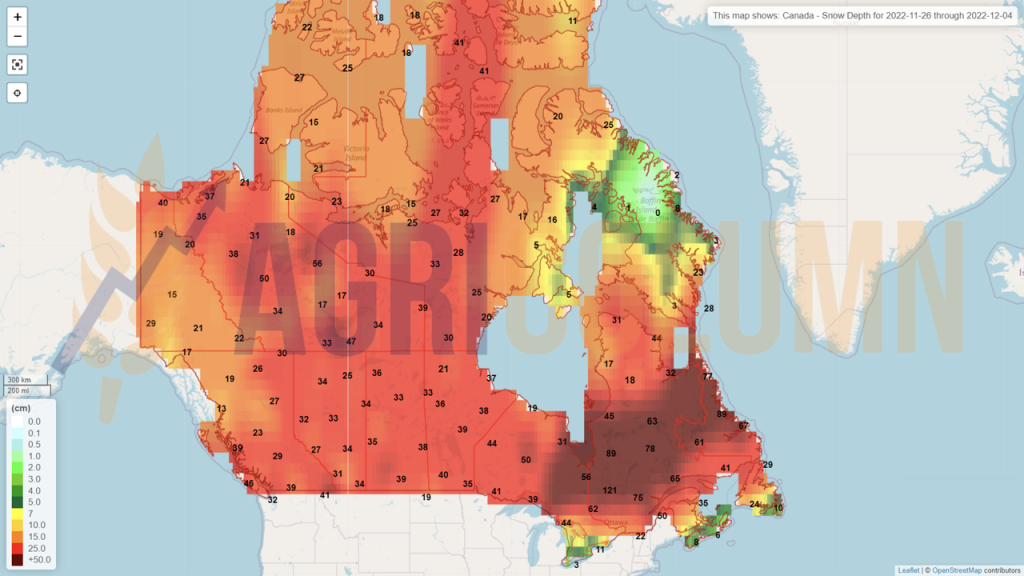
Canada (snow)
USA (snow)
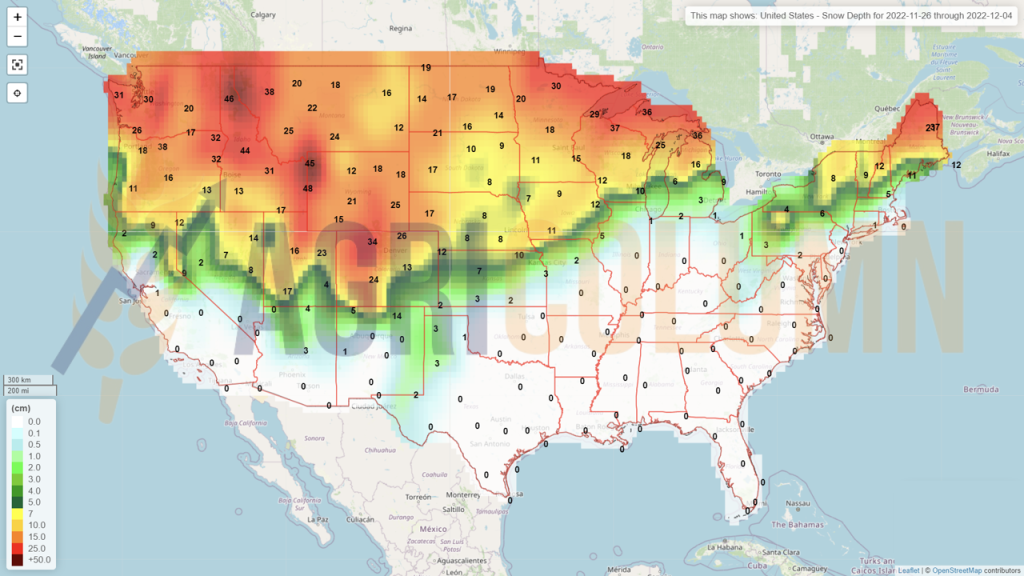
USA (rains)
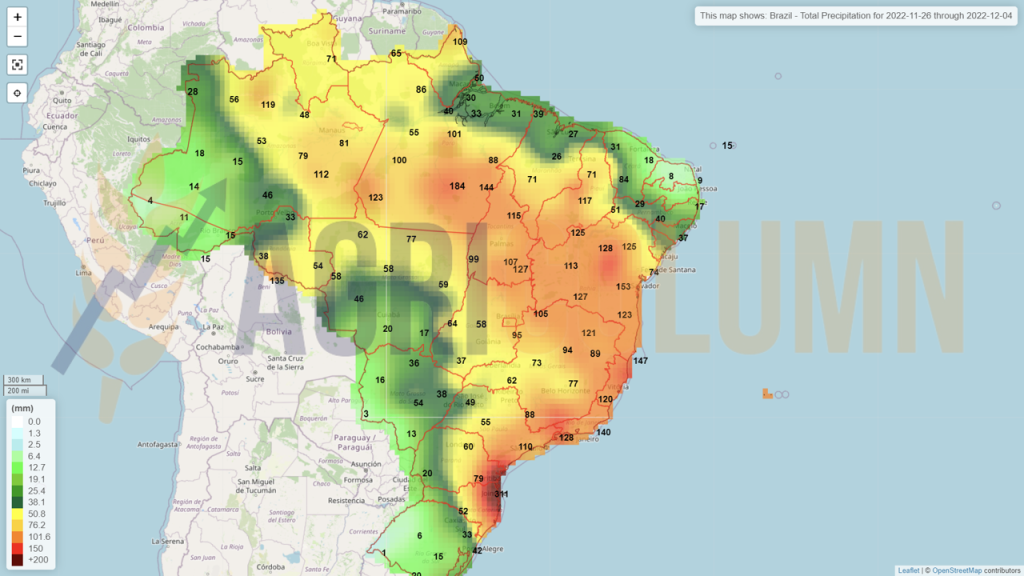
Brazil (rains)
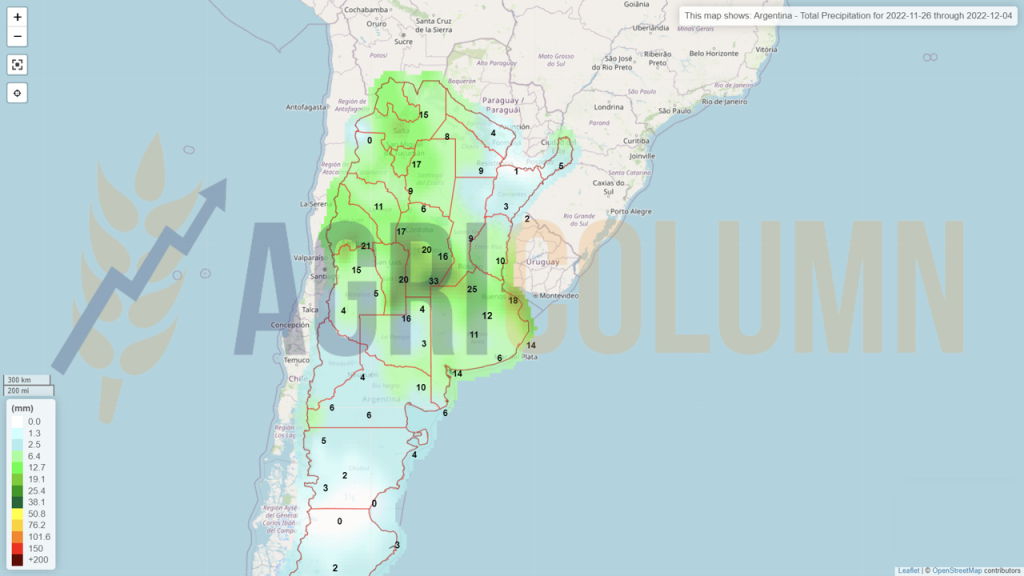
Argentina (rains)
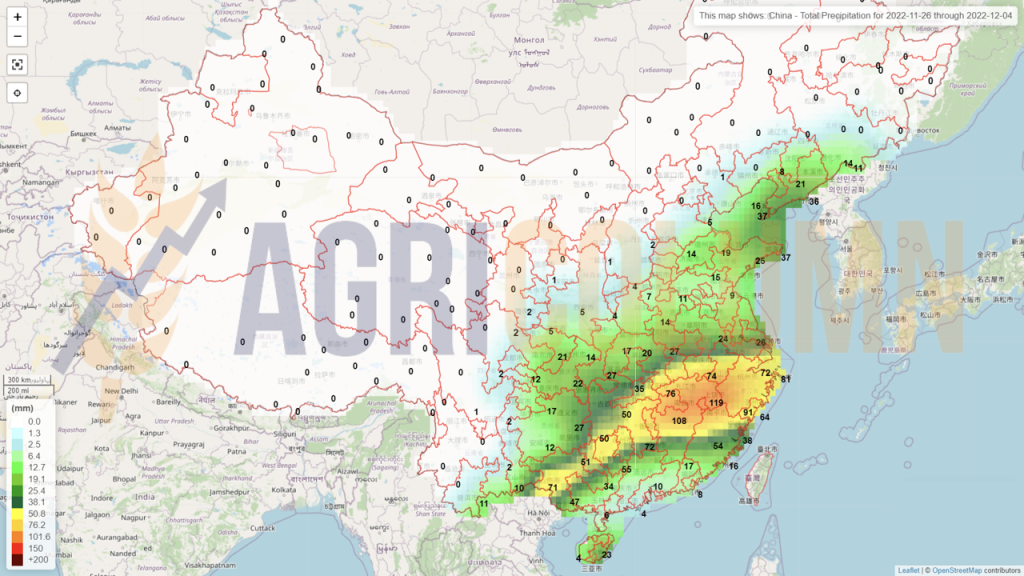
China (rains)
Australia (rains)