This week’s market report provides information on:

LOCAL STATUS
The indications of the port of Constanța are at the level of 315-320 EUR/MT in CPT parity. The price of feed wheat is 25 EUR/MT lower than the price of milling wheat. In the country, at the processing level, the price indications are 315-320 EUR/MT, depending on the quality offered to the processing unit.
CAUSES AND EFFECTS
The WASDE report produced nothing spectacular in terms of global wheat production, consumption, and stocks. Argentina’s downgrade, according to WASDE, was offset by higher production in Australia. In the Black Sea basin, the tension is somewhat dissipated and everyone goes about his own business. Russia exports wheat at a very good rate, winning tender after tender. Ukraine also sees work in the Grain Corridor. But there are still a few days until the expiration of the 120 days under the Istanbul Agreement. What could happen? Normally, if no one denounces it, this agreement will continue on its own.
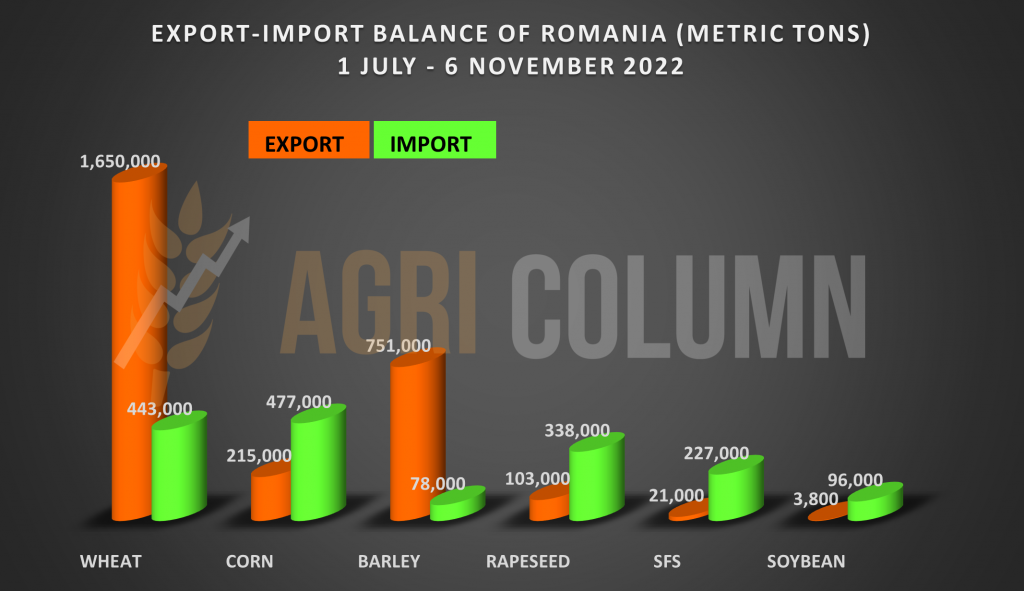
Regarding the volume of agricultural commodities imports, we insert a graph that can tell you a lot because it mirrors exports with imports. However, the goods that took the intra-Community route are missing, as well as volumes that left Romania from Origin Romania. In any case, this graph shows us that a lot of goods in transit remained in Romania through the domestic market of processors and livestock users.
- Romania is a net exporter of wheat and we see how it imported a volume of 443,000 tons.
- Romania is a net exporter of corn and we see how it imported a volume of 477,000 tons.
- Romania is a net exporter of rapeseed and here we see an import of 338,000 tons.
- Romania is an exporter of sunflower seeds, but we imported over 277,000 tons.
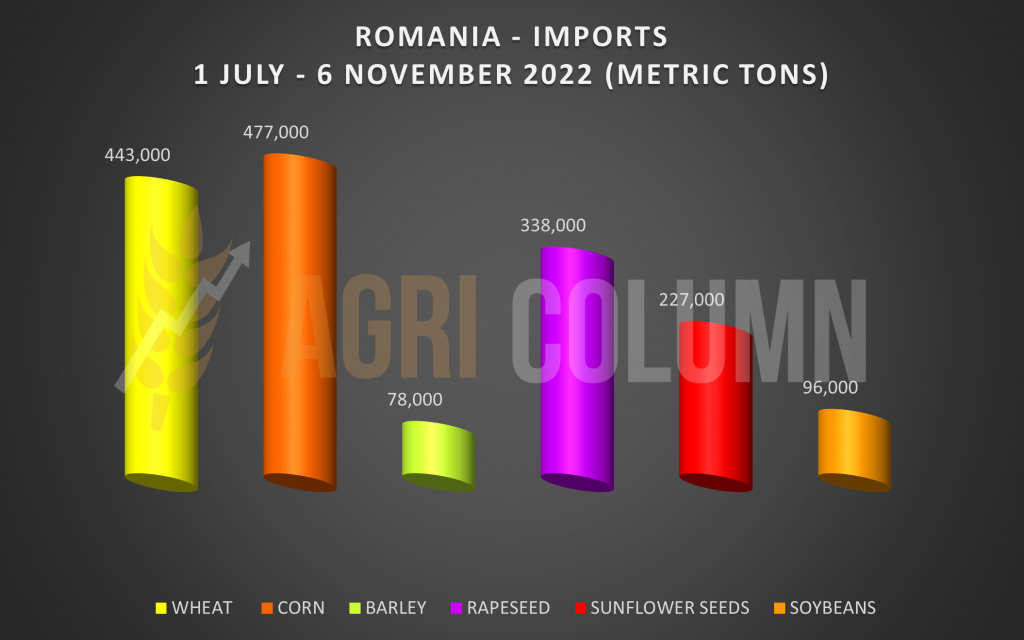
VOLUME OF IMPORTS (July 1 – November 6, 2022)
REGIONAL STATUS
RUSSIA continues the sustained pace of exports, in despite the enthusiasm of Russian analysts, who continue to announce a crop level of 104 million tons, WASDE generated no change, keeping Russia at 91 million tons of production. Russian marketing is particularly active during this period, trying at every moment to exploit anything, just to be able to support the increase in the price of wheat.
MOSCOW, Nov 9 (Reuters) – Russia said on Wednesday it had yet to see any progress on easing its fertilizer and grain exports – parts of the Black Sea grain deal that Moscow sees as key to extending the initiative beyond next week.
Foreign Ministry spokeswoman Maria Zakharova told reporters that the United States and the European Union were restricting Russian exports, and said it remained unclear whether Moscow would extend its participation in the initiative, which expires on November 19. “The United States and the EU continue to put obstacles in the way of the export of Russian fertilizers and grains. We will take this into account when we decide whether or not to extend the grain agreement,” she said.
But Turkey intervened and declared through the Turkish Defense Minister: “We said: the conflict is separate, the humanitarian conditions are separate. Ukraine has given Russia a written guarantee through Turkey. We will offer to extend the agreement for another year.”
On November 11, 2022, Russia met with the UN in Geneva for discussions regarding the extension of the grain corridor. No statement after the meeting, no overall decision, all behind closed doors. We know the stake, the lifting of sanctions on the payment system and the unfreezing of the fertilizer trade.
“In this discussion it is hoped to advance the progress made in facilitating the unrestricted export of food and fertilizers originating in the Russian Federation to global markets,” said Alessandra Vellucci, spokeswoman for the United Nations in Geneva.
Russia has already announced an export tax of 23.5% per ton of fertilizers, but with a minimum base of 450 USD/MT, on the condition that, according to the TASS agency, Britain authorizes financial transactions for deliveries of Russian fertilizers to countries third parties. It has been specified that the license applies only if the fertilizers are purchased for agricultural use.
UKRAINE remains, according to WASDE, at the same level of production and does not register any change in terms of wheat export volume.
Agricultural producers in Ukraine complete planting of winter crops. By November 8, 2022, 4.3 million hectares had been planted, which is 90% of what was planned. Wheat was planted on 3.6 million hectares (or 91%).
In Ukraine, however, certain things are beginning to happen. The Ukrainian government has prepared a bill that obliges all exporters to post a guarantee of 15% of the value of exported goods. The amounts will be returned when the exporters’ accounts (in Ukrainian banks) are credited with the value of the export in question. This bill is extremely harmful to the Ukrainian market, but it smooths the way for multinationals operating in Ukraine. In other words, they want to eliminate small traders from the circuit and ensure that the money from the goods returns to the country, because today, the collected sums lose track and do not return to Ukrainian banks.
The EUROPEAN UNION is downgraded in wheat production by 0.45 million tons, according to the WASDE report. But in recent days, European wheat has gained quantities to be delivered to North African countries, even though Russia has been extremely competitive.

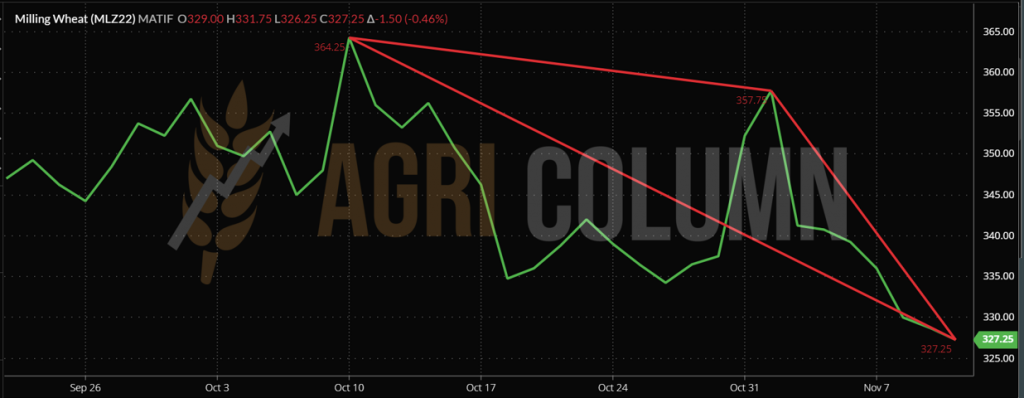
EURONEXT MLZ22 DEC22 –327.25 EUR
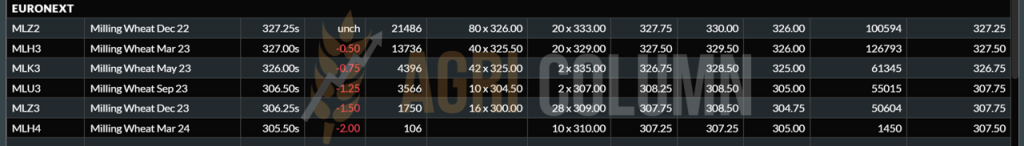
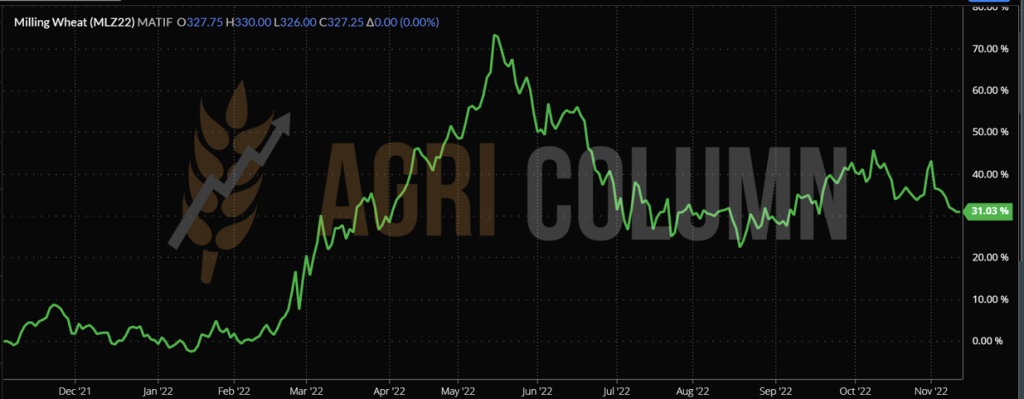
EURONEXT WHEAT TREND CHART – MLZ22 DEC22
GLOBAL STATUS
The US does not see major changes. 75% of American wheat is in dryland areas.
ARGENTINA lowers its crop forecast once more. Nothing in common with the USDA, which lowered it to 15.5 million tons. The Rosario stock market is leading the crop at 11.8 million tons and even lower in the near future.
AUSTRALIA gets a crop boost from USDA, from 33 to 34.5 million tons. However, we believe that this level will be easily exceeded and we will find ourselves with a real harvest volume of 36 million tons.
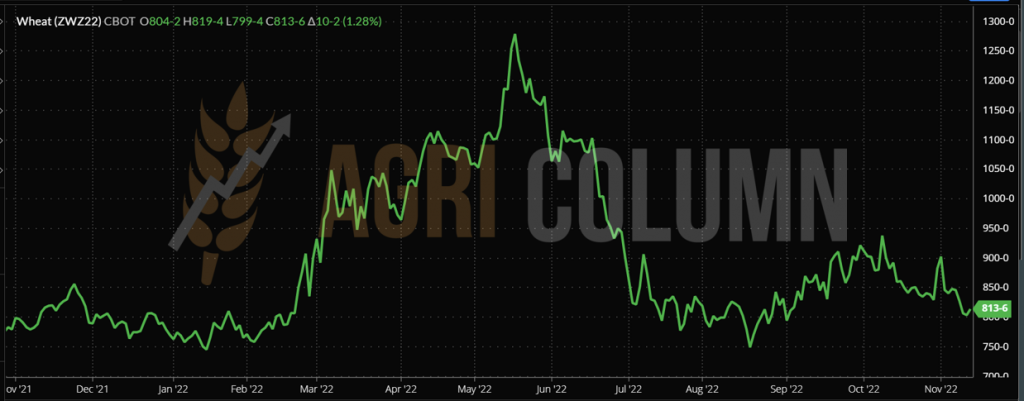
CBOT WHEAT – ZWZ22 DEC22 – 813 c/bu vs. MAR23 – 835 c/bu. Funds move positions to MAR23.
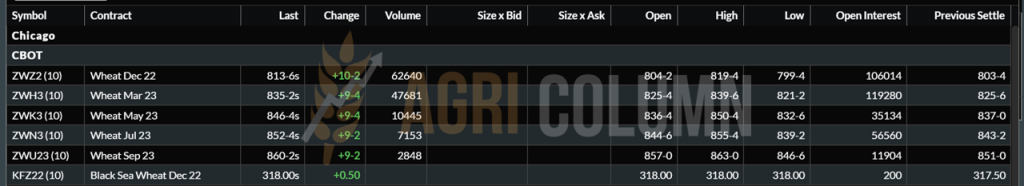
CBOT WHEAT TREND CHART – ZWZ22 DEC22
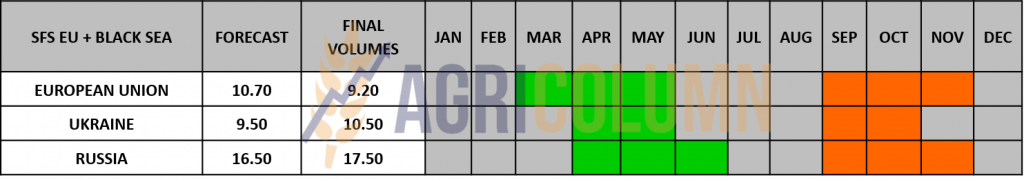
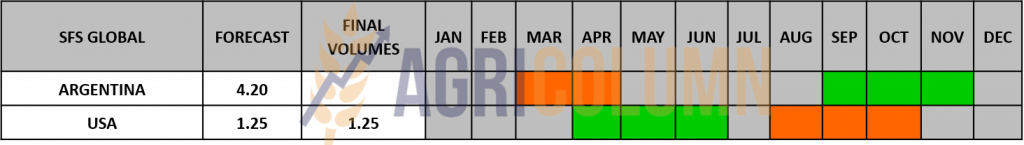
WHEAT PRICE INDICATIONS IN MAIN ORIGINS

TENDERS AND TRANSACTIONS
GASC EGYPT organized an international tender for the purchase of wheat, but after all bids were submitted, by evening, the auction was cancelled. On November 11, 2022, however, GASC directly purchased a volume of 280,000 tons of Russian wheat in C&F Egypt parity with delivery SH (second half) December 2022 and FH (first half) January 2023. The purchase price is 362.50 USD/MT, with 180-day payment term guaranteed by Letter of Credit. Taking into account an NNC (National Naval Company – Egyptian state transport company) transport value of 30-32 USD/MT, as well as financing values and insurance costs from Origin to Destination, we arrive at a level of 310-312 USD/MT in FOB Russia parity.
SAGO SAUDI ARABIA is in the market for the purchase of 595,000 tons of wheat for the delivery period April-June 2023. The tender will be concluded after the publication of our report. Unloading ports: 180,000 tons Jeddah, 180,000 tons Yanbu, 180,000 tons Dammam, 55,000 tons Jizan.
CAUSES AND EFFECTS
In the following period, wheat has no growth potential. I have been advocating this for a long time. Any voltage is only a momentary spike, which later recedes. Physical market fundamentals always come first.
And, to better understand the fundamentals, we insert below a graph of the price of wheat, which lost 37 EUR in one month in the EURONEXT DEC22 quote. Why? We first aggregate the continuity of the Corridor with global wheat production as well as demand. I hope we all remember how I wrote in the summer that there is wheat, it’s just a matter of price and that’s it. The expression I was using was Threshold of Pain. No more transactions happen from there. Destinations simply prefer not to buy anymore.
PANDEMIC, INFLATION, RAW MATERIAL COSTS and WAR
Do you still believe in coincidences on this string?
And now, after the above aggregation (grain corridor, production, demand from destinations), comes the FED factor that no one takes into account, but it acts silently and quietly. Why do you think CBOT DEC22 indications crashed? Why do you think they went for the roll-over or profit taking formula earlier?
Because on November 2, 2022, the FED increased the interest rate again by 0.75%. And today we still remember the words of Jerome Powell (FED President) from the summer: “it will be a soft landing”. And to hedge funds he said: “you can exit at expiration, not immediately.” Whoever had the courage to understand and believe what I was saying all summer, more precisely from May to June, understood the trend.
Here is the chart promised above: minus 37 EUR between October 10 and November 11, and the story is not over.

LOCAL STATUS
The price indications of feed barley in the CPT Constanța parity did not experience any essential changes. They remain anchored in the perimeter of 280 EUR/MT
REGIONAL STATUS
No change in regional status for the period from the previous report to today.
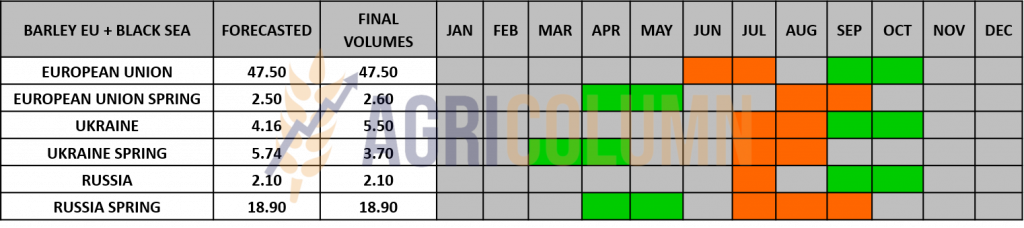
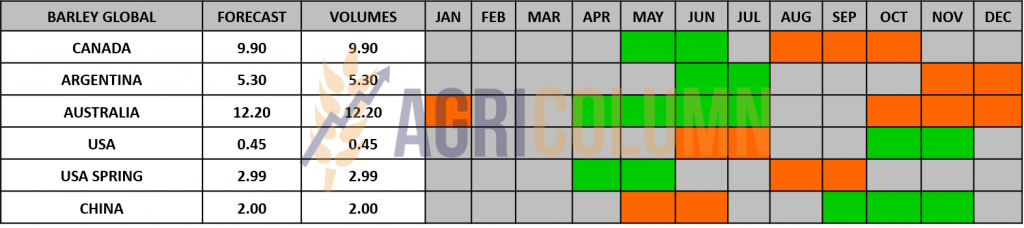
BARLEY PRICE INDICATIONS IN MAIN ORIGINS

GLOBAL STATUS

LOCAL STATUS
Corn indications in the port of Constanța drop by 5-10 EUR/MT after the publication of the WASDE report. Thus, they are found at a level of 285-287 EUR/MT.
REGIONAL STATUS
UKRAINE harvests corn, but at a very slow pace. The harvest in Ukraine is slower than last year, and the average humidity values are very high, due to the long rains in September and October. Farmers hope that the frost will reduce the moisture content of corn from 22-28% to an acceptable level of 16-20%.
In the current season, the cost of grain drying has increased from last year, from 2-3 USD/t% to 4-7 USD/t%, due to the increase in the price of gas and diesel.
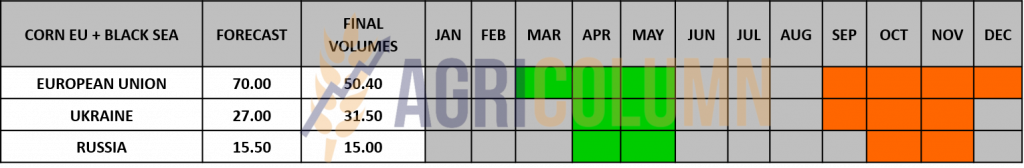
The EUROPEAN UNION is set by the USDA at 54.8 million tons, but these figures are not guaranteed by the European analysis houses, nor by us. We maintain the forecast of 52 million tons, even though some sources indicate 50.8 million tons. Hungary ended the harvest with only 2.4 million tons of production, compared to an initial estimate of 7.5 million tons.
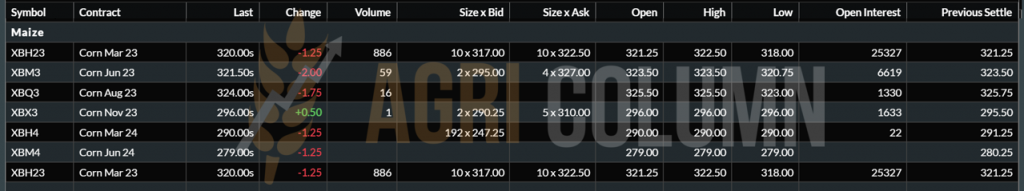
EURONEXT CORN – XBH23 MAR23 –320 EUR
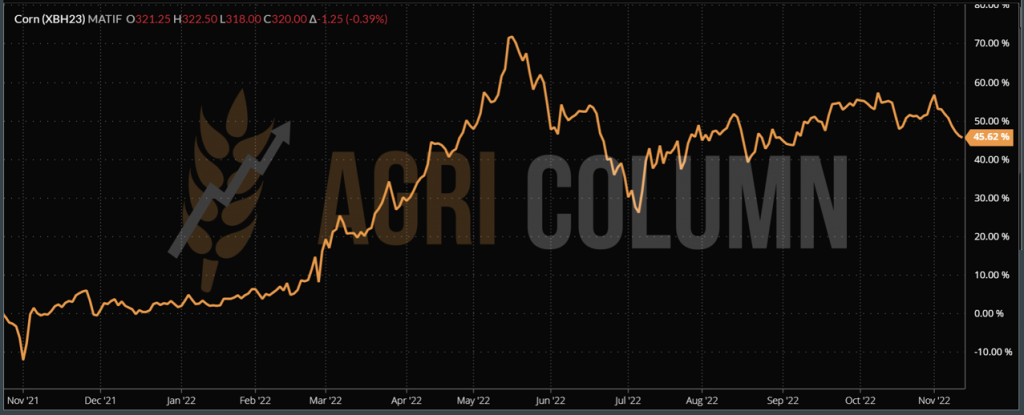
EURONEXT CORN TREND CHART – XBH23 MAR23
GLOBAL STATUS
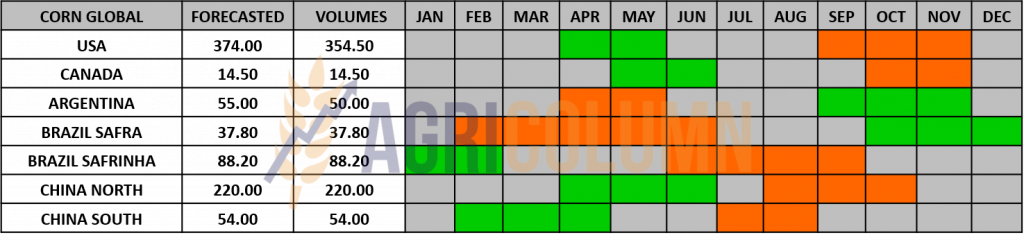
The US has reached the level of over 90% corn harvest level. We have US production up 0.89 million tons to 353.84 million tons, according to WASDE.
US rail strike update: 50% of rail unions ratify new agreements with rail carriers; Two of the largest unions, representing +60,000 conductors and engineers, have yet to vote on new agreements.
However, 50% is a good percentage before November 19, 2022, and if things calm down we will not have a corn rally.
What’s more, barge freight on the Mississippi River has halved from a week ago, and from a month ago, it’s down 150% from 105.86 USD to 80.11 USD/t a week ago. And today, the price is at 40.73 USD/t, according to USDA, via @AsimAnand25. Corn delivered in NOLA (New Orleans Louisiana) is 312.70 USD/t for NOV22 and down 5 USD/t (307 USD/t) for DEC22.
ARGENTINA. Same status as last week, slow progress in the seeding process. The forecast is already reduced by 1 million tons for the next crop, due to reduced areas.
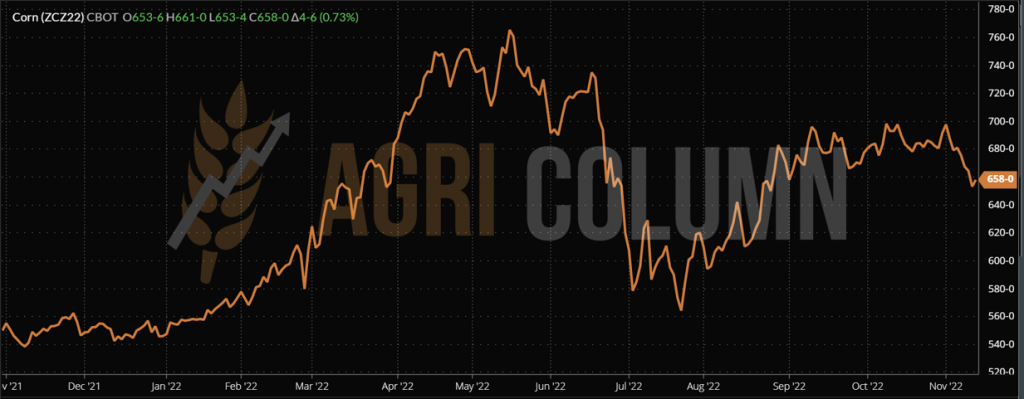
CBOT CORN – ZCZ22 DEC22 – 658 c/bu
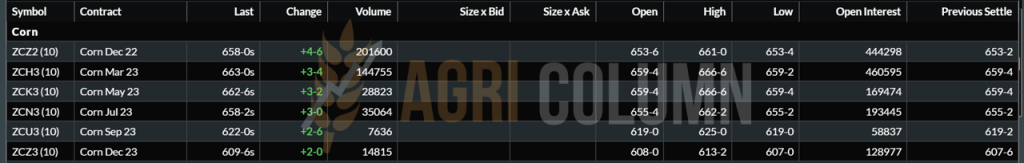
CBOT CORN TREND CHART – ZCZ22 DEC22
CORN PRICE INDICATIONS IN MAIN ORIGINS

CAUSES AND EFFECTS
The WASDE report generated a bearish market sentiment through its balance. The US crop registered an increase of about 0.9 million tons which compensated for the deficit of the European Union. Along with easing US strike potential and quiet in the Grain Corridor, corn is losing ground. The Mississippi River begins to recover, in turn, and we see how, in a very short period, the decline is particularly steep. In 11 days, it fell on Euronext by 24 EUR, although in the physical market, things were not so dramatic. But the decline of Euronext is a measure that must be taken seriously in the coming period. If we look at the subsequent indications, we will see support from the carry cost in corn. And with corn the dice are not rolled as in the case of wheat. South America and how it will seed is a factor to watch, as well as vegetative development. In South America, summer is coming now…


LOCAL STATUS
Rapeseed indications appear in the same range as in the last period, i.e. FEB23 minus 20-25 EUR/MT for the goods delivered in CPT Constanța parity and with FEB23 minus 15-20 EUR/MT for the goods delivered to the processing units.
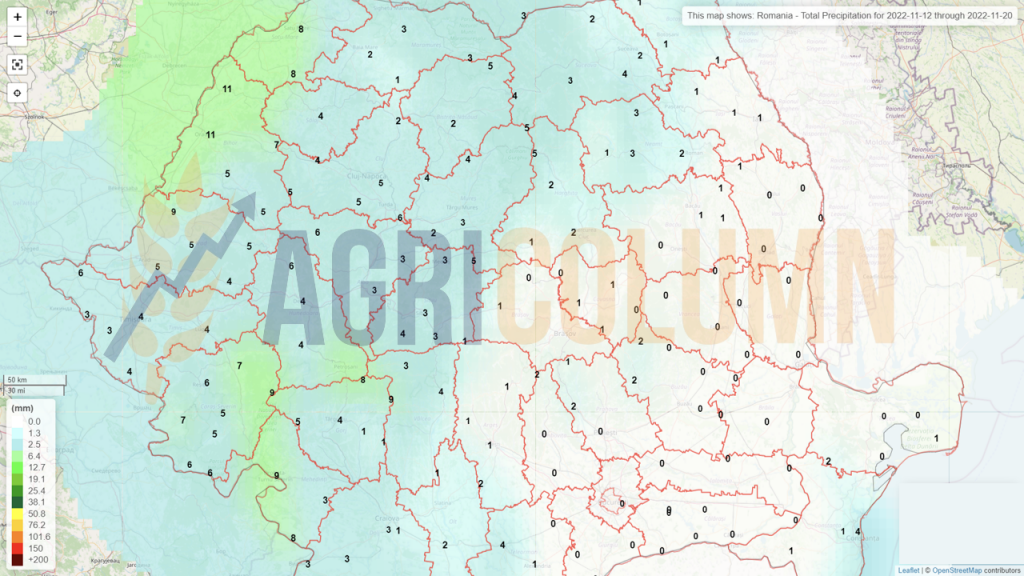
The rain that crossed Romania on November 11, 2022, brought an unexpected effect for rapeseed. The fields have benefited from a level of precipitation of 5-11 liters and, even if it is not enough, a revival can be seen in certain areas.
CAUSES AND EFFECTS
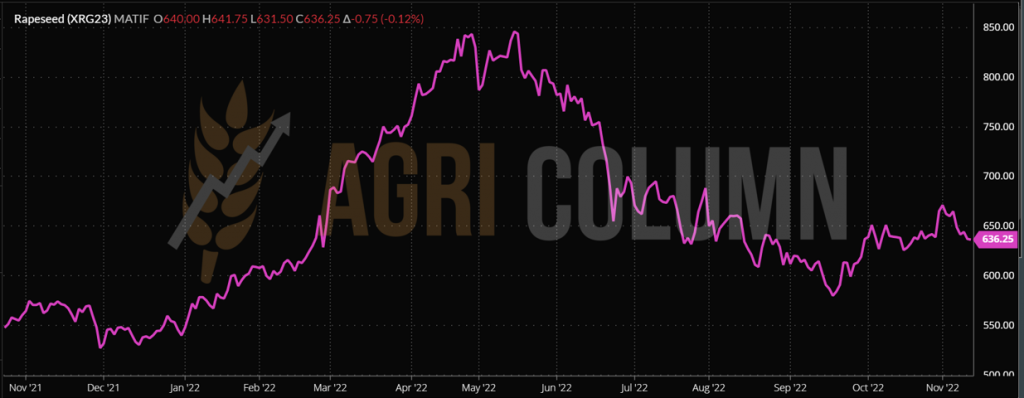
In the coming period, rapeseed will correlate only with the price of fossil energy. There is no other reason for traction in the near future.
We have no change at the regional level, but the main focus remains tracking the vegetation stage of rapeseed, which can be influenced by the weather.
EURONEXT RAPESEED – XRG23 FEB23 – 636.25 EUR

EURONEXT RAPESEED TREND CHART – XRG23 FEB23
GLOBAL STATUS
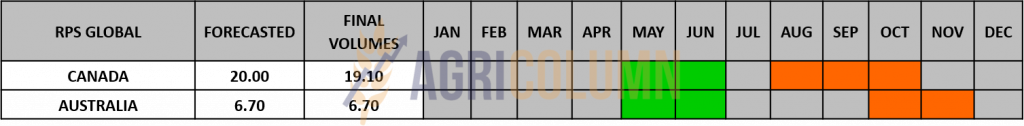
CANADA. Out of season.
AUSTRALIA will begin shipping from the promised 6.7 million tons crop.
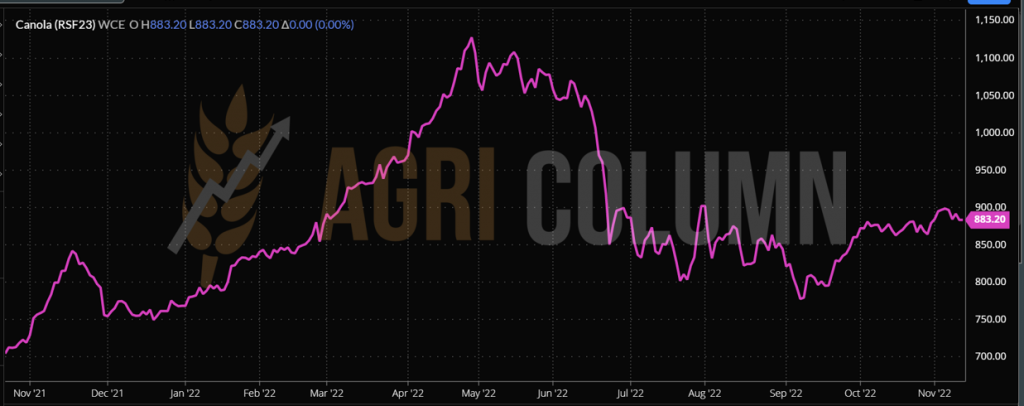
ICE CANOLA RSF23 JAN23 –883 CAD
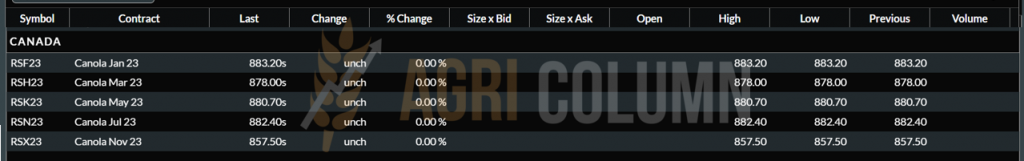
ICE CANOLA TREND GRAPH – RSF23 JAN23
COMPARATIVE GRAPH. PETROL-RAPESEED-CANOLA CORRELATION
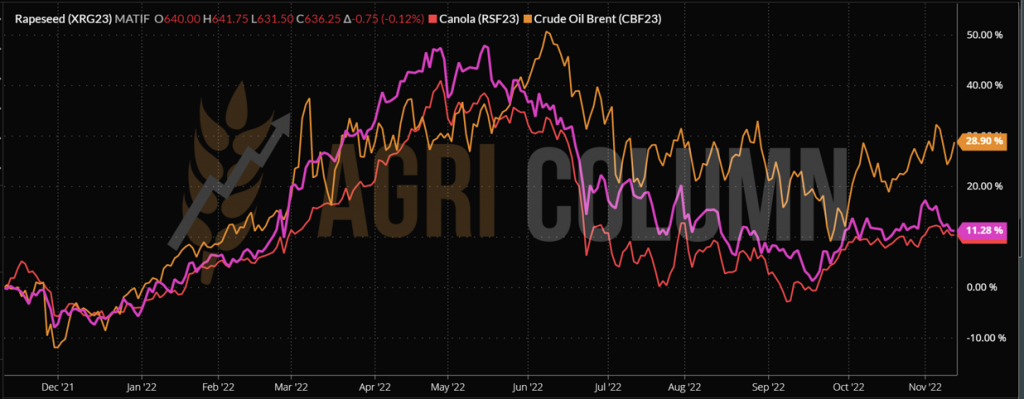
CAUSES AND EFFECTS
Rapeseed will not know any evolution in the next period. Only the correlation with fossil energy remains. We expect a very mild rebound early next week, driven by FOSSIL ENERGY, and of course the decline in USD strength versus the EUR will generate a price offset (decline). Ukraine also presented the final sowing figure of 1 million hectares for the coming season.

LOCAL STATUS
The primary indications for sunflower seeds are 570-575 USD/MT at the level of the Constanța port and about 5-10 USD/MT lower at the level of the processing units.
Processing units in Bulgaria indicate a level of 585 USD/MT in DAP parity, and the cargo originating in Ukraine places it at 580 USD/MT. We also recorded trade at 590 USD/MT DAP Processor.
CAUSES AND EFFECTS
The Romanian processors are starting to prospect the market very carefully to locate and identify the cargo lots and the levels at which they can purchase, a sign that, with the month of December 2022, interest will increase exponentially because the quarter (stripe) JFM (JAN -FEB-MAR23).
REGIONAL STATUS
UKRAINE will end the harvest at the level of 10 million tons, by no means the value of 10.5 million tons that they estimated some time ago.
RUSSIA maintains the same status. No difference from the previous week.
The EUROPEAN UNION finds itself in the same status as last week.
GLOBAL STATUS
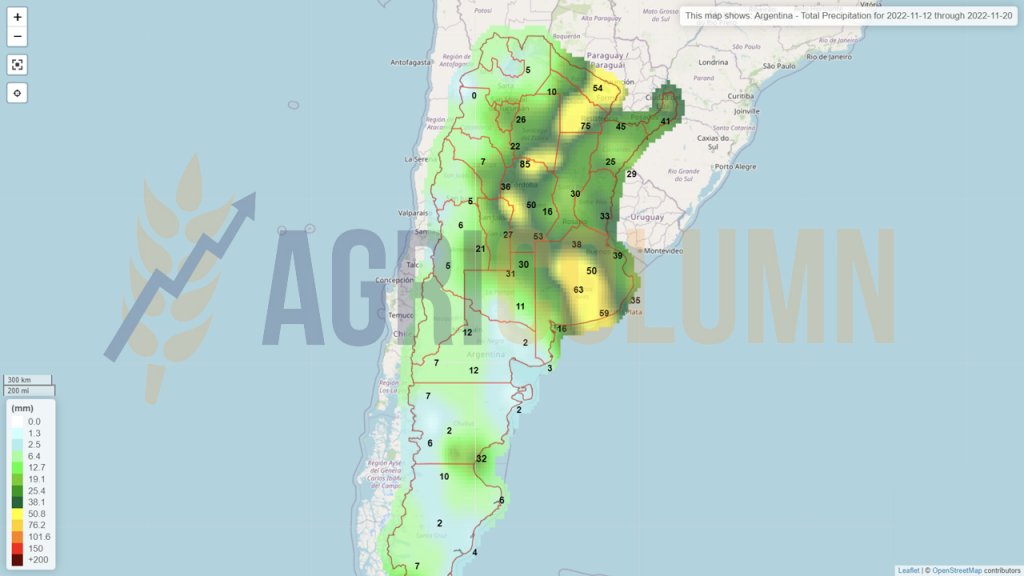
ARGENTINA receives precipitation in the areas where sunflower seeds are grown and we highlight here the Buenos Aires area, with a share of 53% of the harvest volume, as well as Chaco with 17%, Santa Fe with 13%. The areas being in the north (and therefore closer to Brazil) benefit from precipitation. This rainfall will have a beneficial effect on the crops.
PRICE INDICATIONS FOR OILSEEDS AND CSFO IN MAIN ORIGINS

CAUSES AND EFFECTS
No implied change in sunflower seed price performance. The share of transactions is not very high, if we refer to goods of Romanian origin. Farmers prefer to sell the wheat and keep the sunflower seeds.
Goods of Ukrainian origin are traded like those of Moldovan origin. Local and European processing coverage is obvious at this point. Evidence is the price of CSFO in the 6PORTS parity, which rose only marginally by 5 USD/MT to the level of 1,345 USD/MT. In the transaction we recorded a sale to GASC of crude oil, 6,000 tons, at the level of 1,474 USD/MT C&F EGYPT.
Sunflower seeds retain their potential for the future as well. Their price life cycle is in the first third, so we will see developments in the medium term.

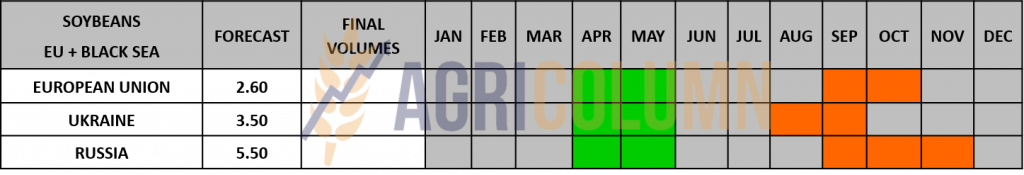
LOCAL STATUS
In Romania, the price indications for soybeans are at the level of 570 USD/MT DAP processing units for non-GMO soybeans. Between July 1 and November 6, 2022, approximately 95,000 tons of soybeans were imported.
REGIONAL STATUS
GLOBAL STATUS
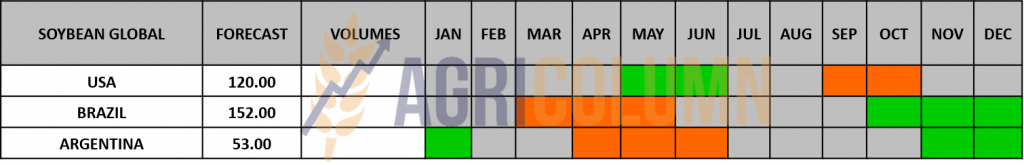
USA. The U.S. soybean harvest is nearing its end, ahead of last year, with the crop acreage 95% harvested.
USDA confirms the following US export sales for delivery in the 2022/23 marketing year: 144,000 tons of soybeans to Mexico, 138,700 tons of soybeans to China, 132,000 tons of soybeans to unknown destinations.
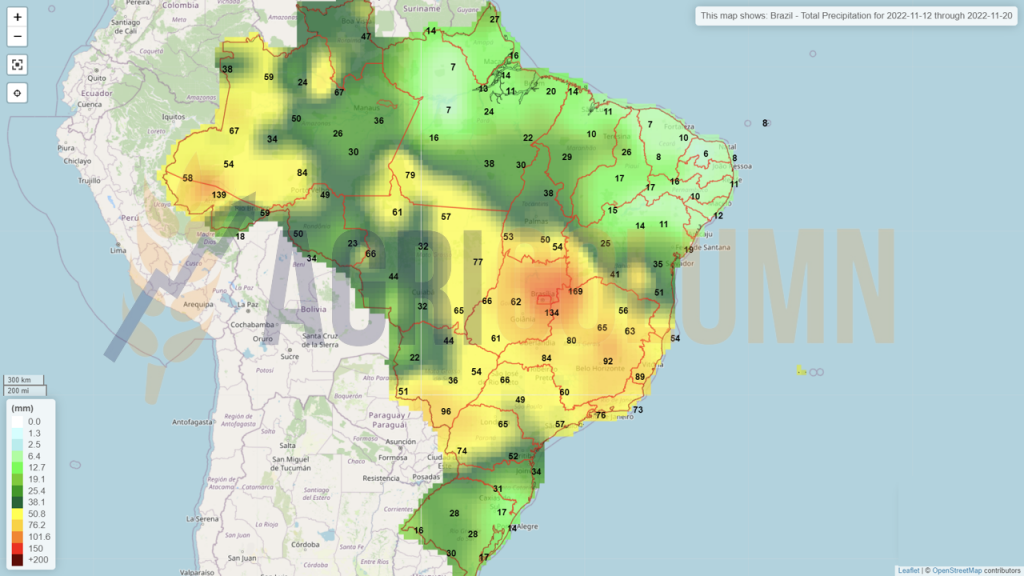
BRAZIL. Conab estimates that Brazil is currently expected to produce a record 153.5 million tons of soybeans, 1.2 million tons more than the previous forecast. If realized, it would be +22% compared to last year, with exports of 96.4 million tons.
Planting of the 2023/23 soybean crop in Brazil reached 55.9% of the total planned area as of November 4. Brazil exported 4.1 million tons of soybeans in October, with annual exports of 74.8 million tons down 7% from a year earlier.
ARGENTINA. Argentine farmers sold about 72% of the current soybean crop as of last week. Soybeans are particularly important key crops because they help generate much-needed foreign exchange for Argentina ‘s cash-strapped government. Soybean sowing in Argentina is very late, the longest in the last 12 years, due to drought.
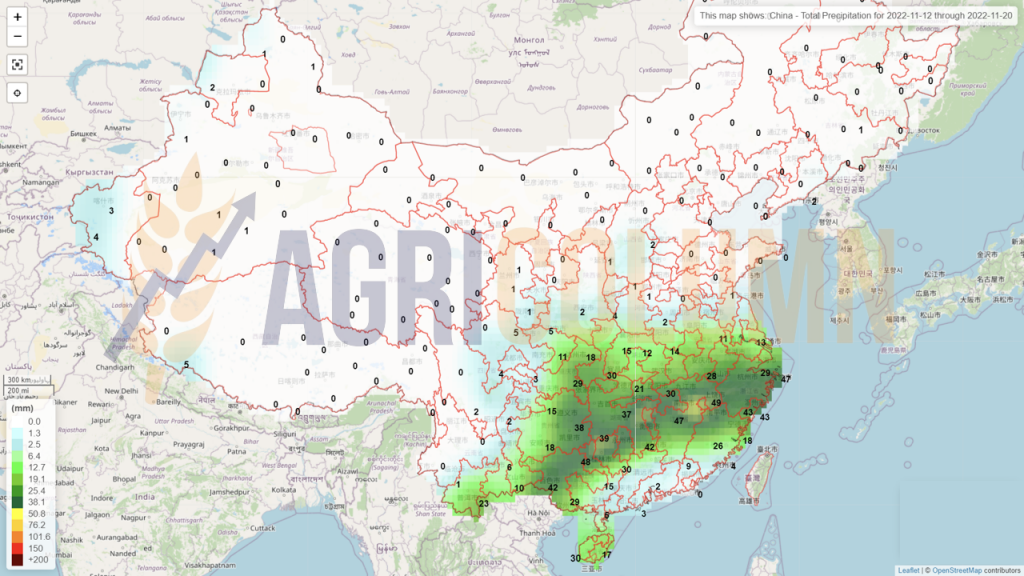
CHINA. China imported 4.14 million tons of soybeans in October, down 19 percent from a year earlier. In October of this year, soybean imports reached the lowest level since 2014 until now, according to customs data.
US export problems in September played a large role in the decline, but the main reason is driven by buyers, who have reduced purchases due to high global prices and weak processing margins.
China plans to import soybean meal from Brazil as part of broader efforts to diversify sources of supply of this important animal feed ingredient, reduce short-term supply shortages and mitigate inflation risks.
China’s soybean production in the 2022/23 marketing year is forecast to reach 18.4 million tons, thanks to higher yields, according to the USDA.
China is by far the largest consumer of soybeans in the world, with domestic consumption expected to reach 116.59 million tons in 2022/23, up from 106 million tons the previous year, according to the USDA.
CAUSES AND EFFECTS
Oil World forecasts global soybean production this year of 390.2 million tons, well above the 355.9 million tons produced in 2021/22. This is mainly due to the record crop in South America that is forecast.
WASDE reports world soybean production down 0.46 million tons from 390.99 to 390.53 million tons in its November report. The US is up 0.89 million tons from 117.38 to 118.27 million tons. In contrast, Argentina is down 1.5 million tons from 51 to 49.5 million tons and together with other marginal production declines, we cumulatively arrive at the decline stated above.
Soybeans are harvested almost entirely in the US and only the South American late planting spectrum generates chills for now. But the North American harvest of 122-123 million tons can generate sufficient trade until at the times when we will see South America exposed in vegetation. Argentina in drought, Brazil in too much precipitation (rain forest). La Nina’s will end the cycle in February and we will enter ENSO (El Nino Southern Oscillation).
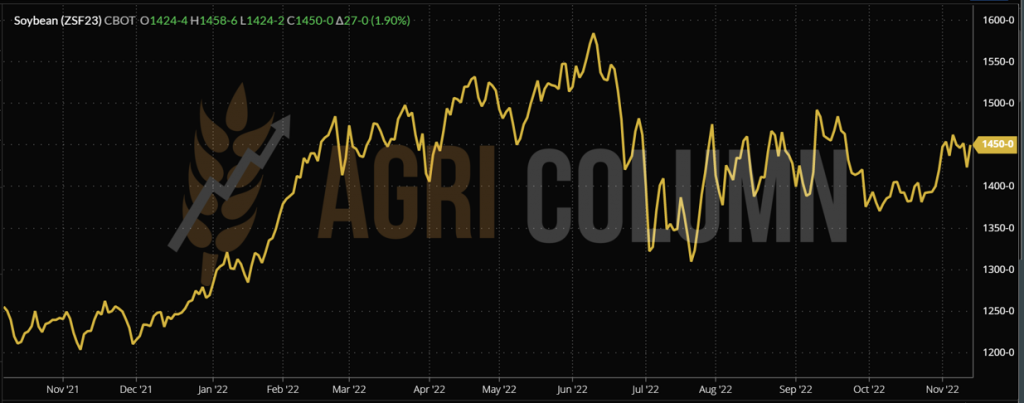
CBOT SOYA ZSF23 JAN23 – 1,450 c/bu

CBOT SOYBEAN TREND CHART – ZSF23 JAN23


12-20 November 2022
Romania
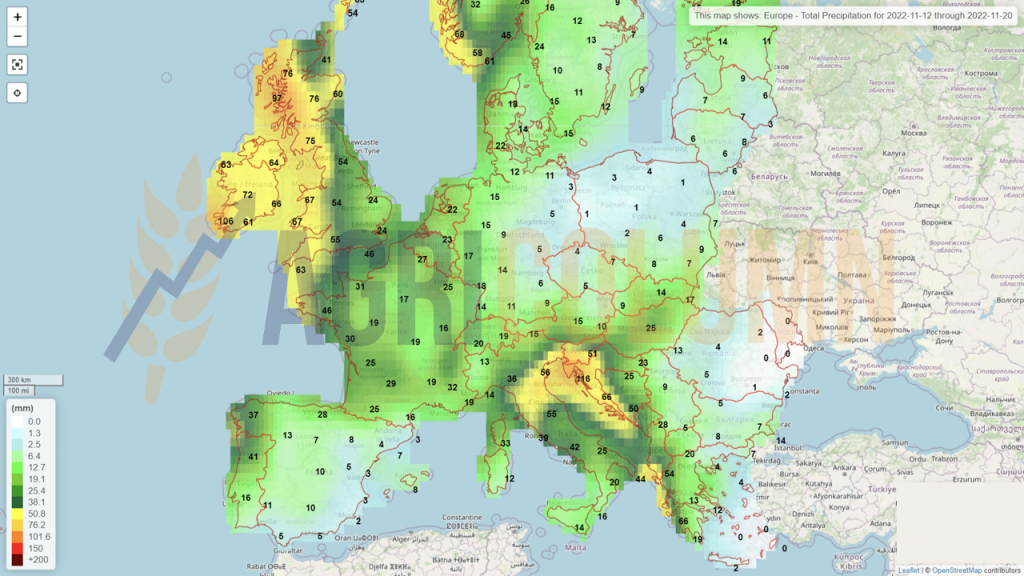
Europe
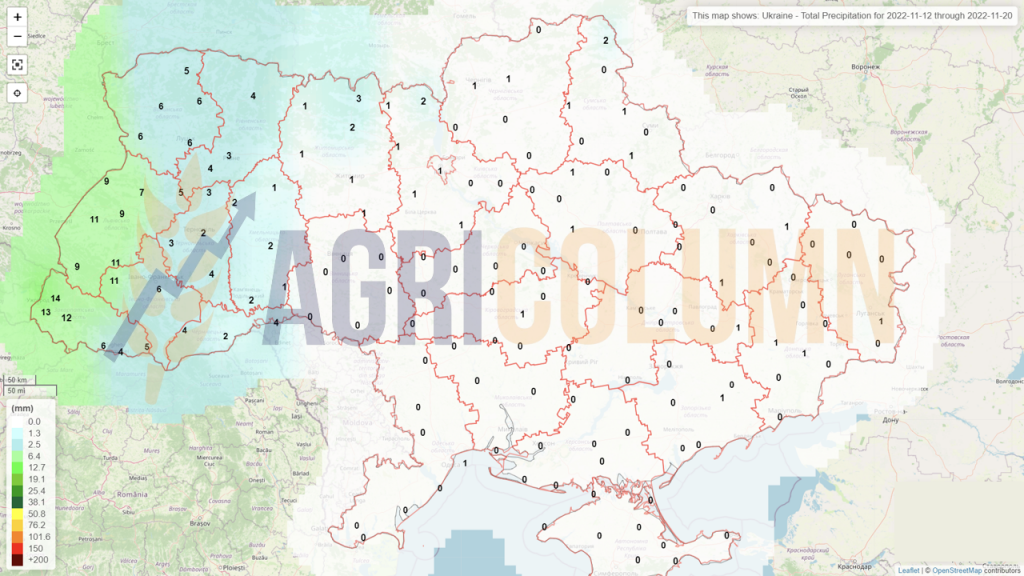
Ukraine
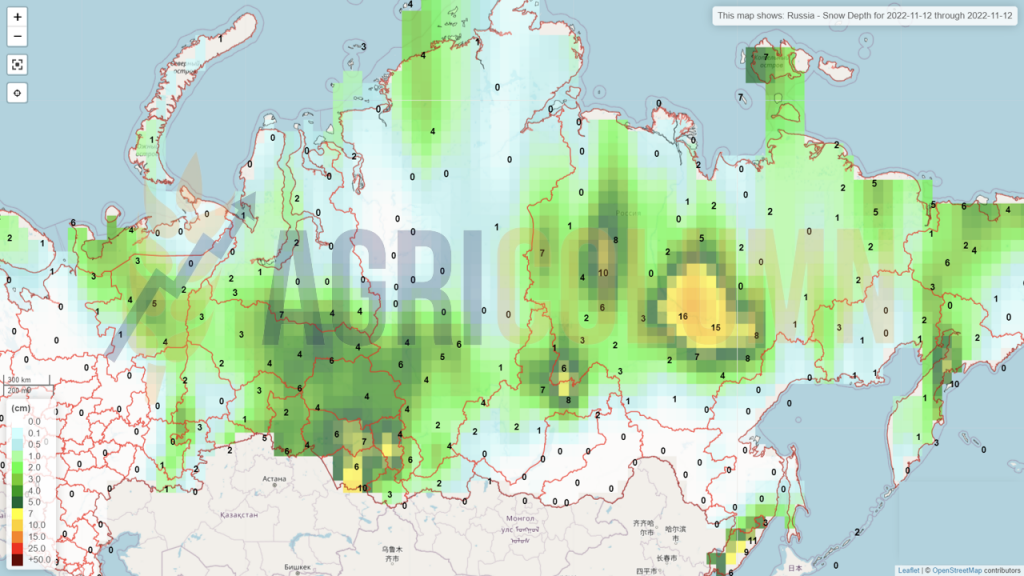
Russia (snow)
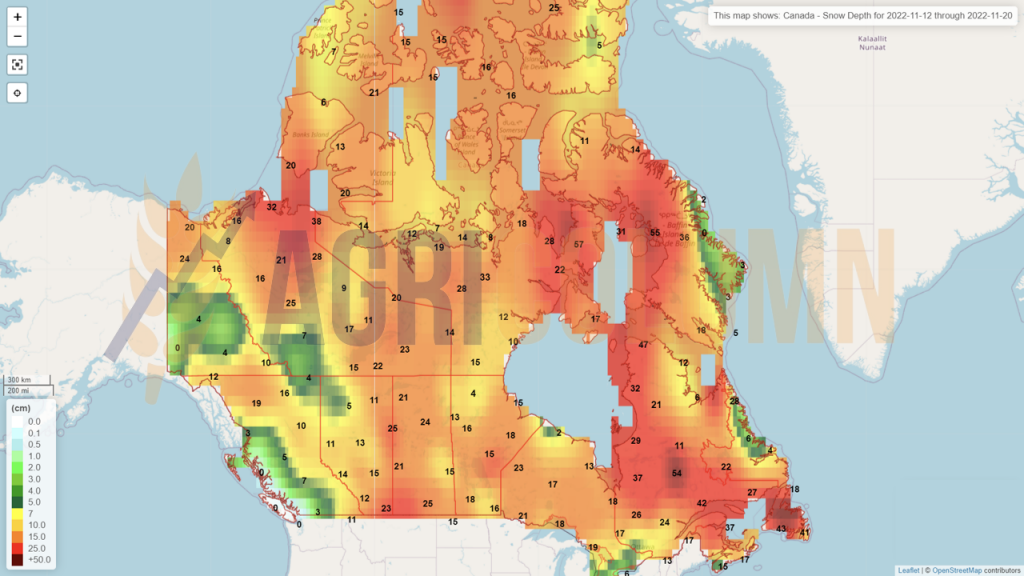
Canada (snow)
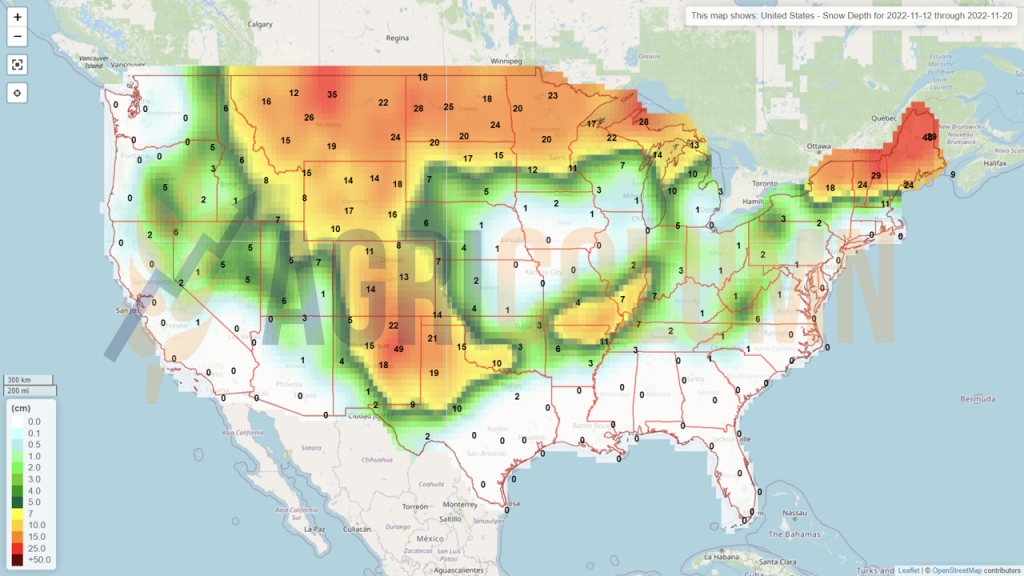
USA (snow)
Brazil
Argentina
China
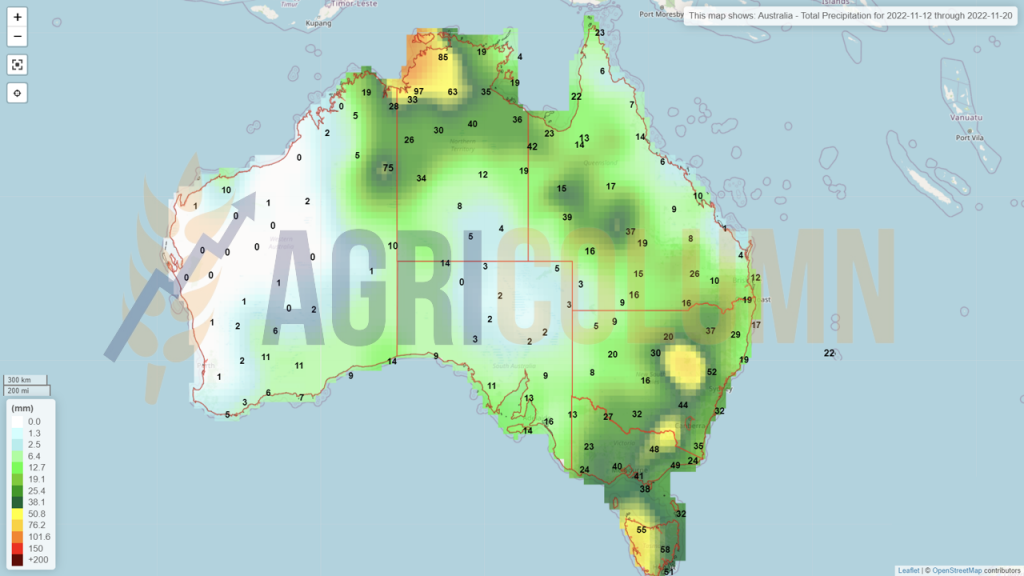
Australia