This week’s market report provides information on:

LOCAL STATUS
Indications of wheat in the port of Constanța have fluctuated around the value of 313-315 EUR/MT in the CPT parity. There were also peaks of up to 320 EUR/MT, but only for a day or two. Feed wheat has the same discount of 20 EUR/MT compared to milling wheat.
In the local market, however, processors are supplied at a slow pace. Most farmers are hoping for a much better price in the winter of 2023.
CAUSES AND EFFECTS
Next, the effects of the war in Ukraine can be seen on Romanian territory and this aspect is quantified in the import values of wheat from this origin. About 150,000 tons are entered into the domestic processing circuit on the basis of a sufficiently attractive discount for processors. Disruption of Romanian agribusiness at the farm level continues and uncertainty is an important factor for farmers’ horizons.
Exporters already have a shipment level of 1.3 million tons, out of a total of 1.7 million tons committed. But their purchases amount to about 2.5 million tons in total at the moment. From the total volume related to export this season, about 5 million tons, we have reached half of the allocated volume.
Processors generate competition, but their reception parameters often remain barriers in the farmers’ decision to sell. Another unknown remains the supply volume at the processing unit level because this parameter is diffused at the unit level and is extremely difficult to quantify at this time.
A correct and perfectly legal solution is the application of regulation 1185/2017 amended by note 791/2022, which establishes the necessity and obligation to declare stocks at farm level, traders, processors, as well as other intermediaries in the commercial-logistics chain. But here a firm political decision is needed to implement IT systems and identify reporting procedures at market segment level.
Why do we support this? Because Romania’s food safety must be in the foreground. At this time, exporters generate purchase, export, remaining to be exported and non-destination difference figures. We have a value of 0.8 million tons with no destination at the moment. If the domestic market is competitive and exporters have contracts with processors, some of these goods will end up in domestic consumption.
The exporters have the level of information high enough to be able to engage in such contracts in the domestic market, as the low financial liquidity of the processors is well known, as well as the pace of supply. In this way, financial costs are passed through the price of the goods at a future date, through monthly phased sales, with financial and operational costs included in the price on an increasing scale.
But if market volatility causes the market to rise sharply, the volume differences already advanced by exporters will take the export route. And this fragility generated by the lack of a correct, legal information system makes Romania vulnerable, from the point of view of food safety.
However, there is another level that owns volumes of goods, namely the local merchants. Thanks to a cash-flow and a logistics system of their own, they conglomerate, as every year, quantities of goods that they exploit much later. Here, too, we have a total lack of information and this damages the Romanian food safety system, as the volumes can take any destination at any time, without this being known.
The simplicity of the North American system of detailed reporting and operationalized by NASS (North American Statistical Services) means that the USDA knows at all times the status of the food safety system. Briefly, the information collection directions have the following benchmarks:
- Stocks on farms.
- Off-farm stocks (purchases with no default destination at that time, so-called long positions).
- Destination: human, feed or industrial consumption (domestic market).
- Exports must be inspected by the USDA before being carried out.
- The disappearance rate (it is effectively domestic consumption + export), which is calculated as a decrease from the total production of domestic consumption, to which the made exports are added.
The result is simple and clear: the remaining stock level, on the basis of which the domestic requirement is calculated, given the time remaining until the new crop.
The current moments do not generate very high hopes for a possible price increase. But the volatility exists because of the political factor, and Mr. Putin’s recent statements remind us that in the area we have a war started by the one that generates 25% of the global wheat trade.
But as we’ve learned, surprises can happen within hours, with Euronext ‘s latest rally in wheat largely driven by changes that Vladimir Putin may demand in the operation of the Green Corridor. One thing is simple and clear, however – Russia must sell wheat from the extremely rich crop of this season (2022-2023).
REGIONAL STATUS
RUSSIA is fined by Strategie Grains with the increase of the harvest volume to the level of 98 million tons.
UKRAINE closes harvest at 19 million tons, with a large shortfall of 8 million tons, which was either looted or destroyed by the Russian military.
The EUROPEAN UNION does not undergo changes. The volume remains at 126 million tons, this figure referring exclusively to soft wheat.
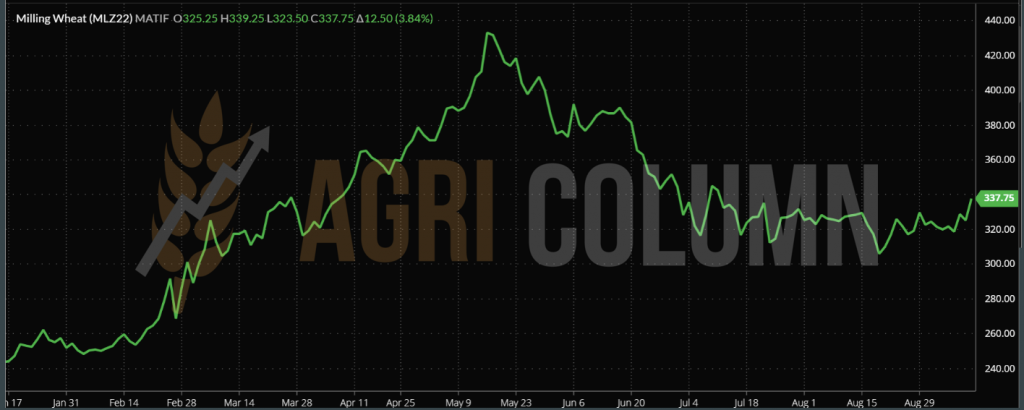
EURONEXT MLZ22 DEC22 –337.75 EUR (+12.5 EUR)
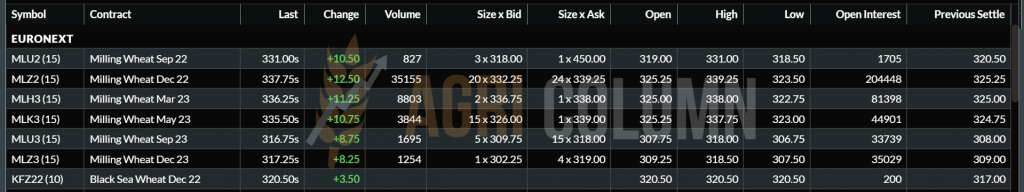
EURONEXT TREND CHART – MLZ22 DEC22
TENDERS
MIT JORDAN purchased a volume of 60,000 tons for delivery in the second half of February 2023, CFR Aqaba, at the price of 374USD/MT, lower by 2.5 USD/MT compared to the previous tender. Viterra is the seller in this transaction.
EGYPT. Egypt’s Minister of Supply, Aly Moselhy, stated that “Egypt has agreed to receive 63,000 tons of imported Russian wheat ‘on the responsibility of the Russian supplier.’ This leads us into a shadow cone as to the real origin of that cargo lot.
GLOBAL STATUS
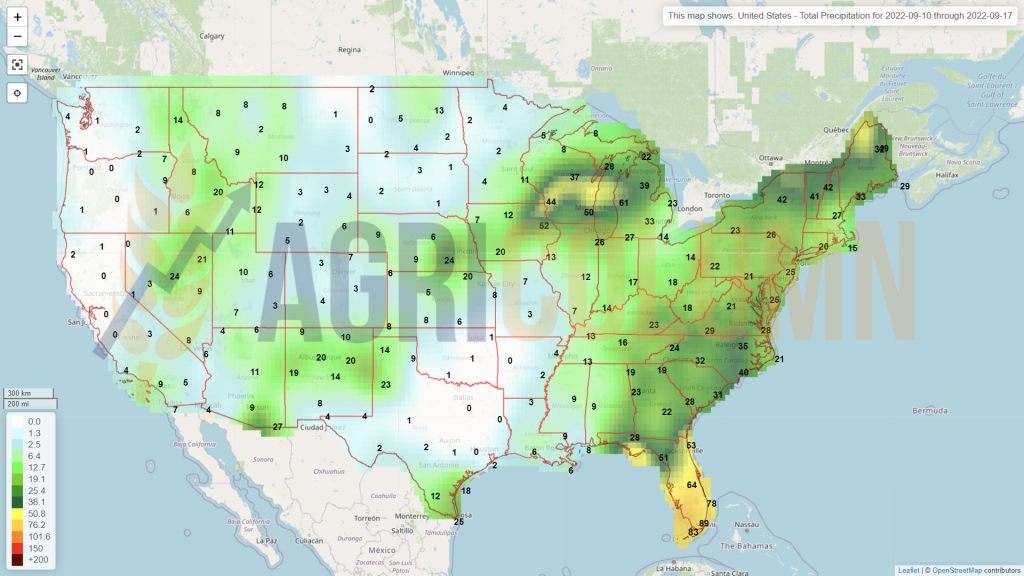
The US will close without any difficulty at the estimated level of 48.4 million tons
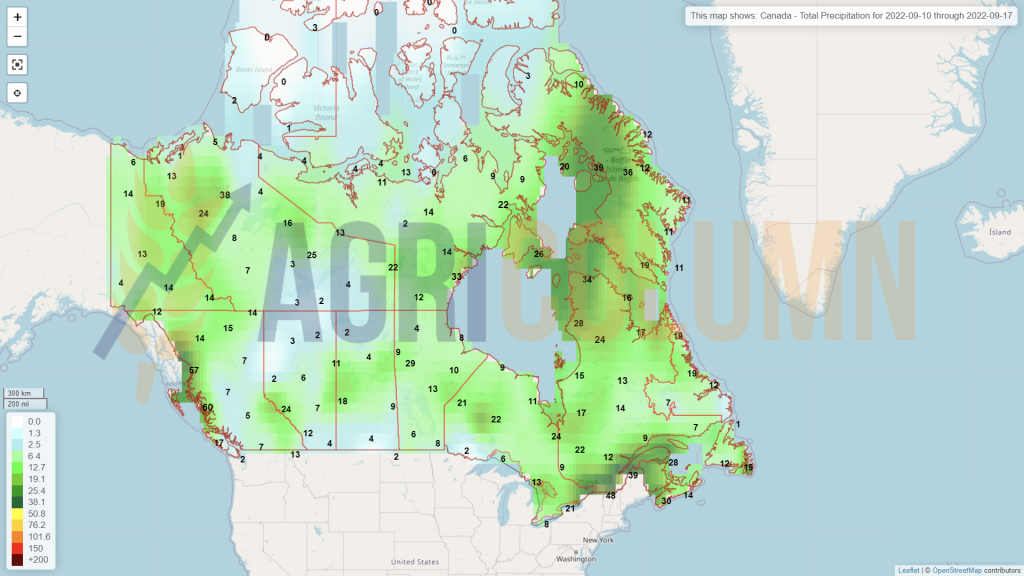
CANADA is harvesting in full these days and they will meet the 35 million tons.
ARGENTINA is facing extremely big problems. The recent frost is affecting wheat, which has already suffered surface losses (the drought did not allow sowing), and here we may have surprises. We have aggravating premises in the perspective of the Argentine wheat crop. About 700,000 hectares of wheat are in a worse condition compared to last week by 14%, to the value of 54%. Argentina had initially reduced the area intended for sowing by 1 million hectares due to the prolonged drought that did not allow this operation. Today, the La Nina context is not a happy one. About 80% of the exponent area of wheat production is under the continuous specter of drought. It is, according to the Rosario Grain Exchange, the driest season in the last 27 years.
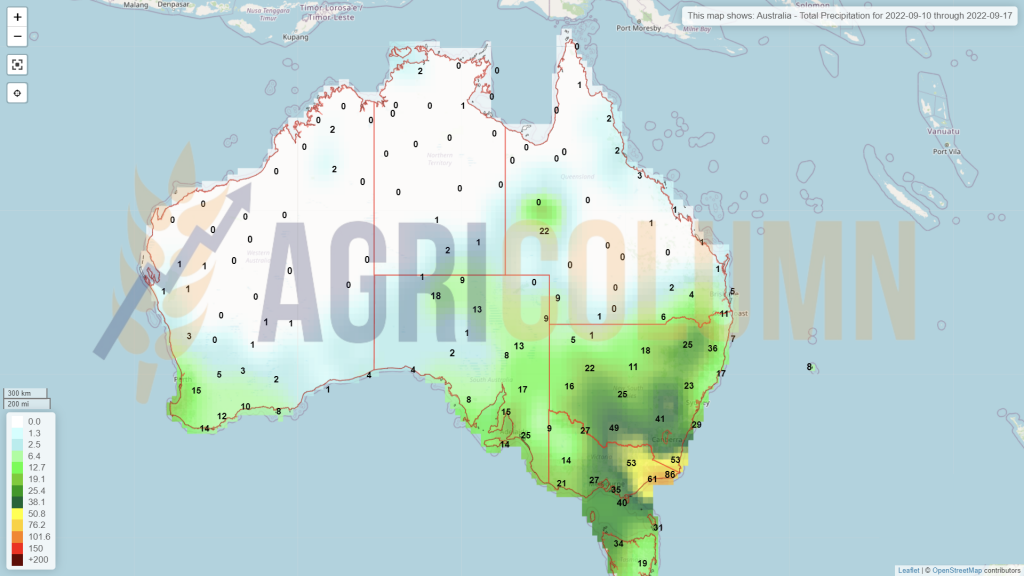
AUSTRALIA will begin harvesting in early October, but at this point, we see no change to the volume forecast of 33 million tons, down from last season’s bumper crop of 36 million tons, but higher than average multiannual of 24.5 million tons.
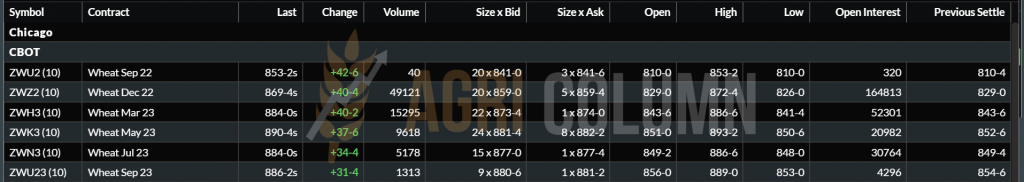
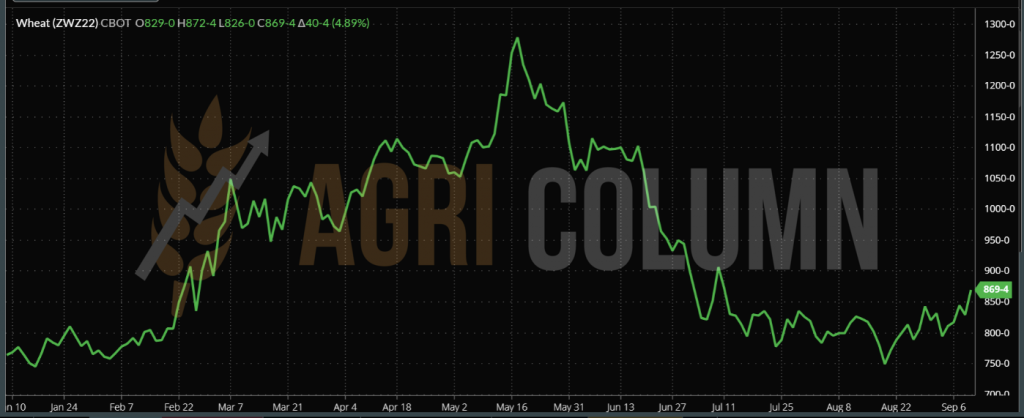
CBOT ZWZ22 DEC22 – 869 c/bu (+40 c/bu = +14.7 USD)
WHEAT TREND CHART – ZWZ22 DEC22
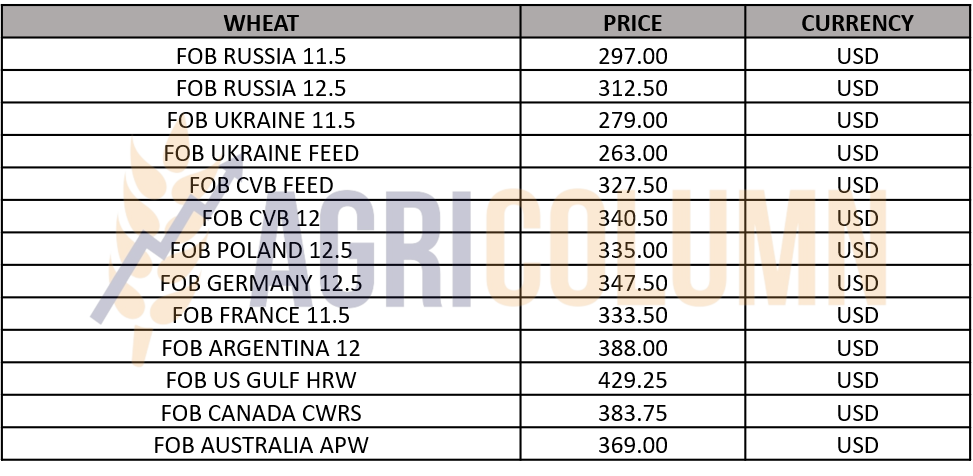
WHEAT PRICE INDICATIONS IN MAIN ORIGINS
CAUSES AND EFFECTS
The rally generated by Euronext and CBOT has two causes. The first is the approach of the meeting between Putin and Erdogan, where they will discuss the modification of Ukraine’s green corridor. And the second is the fear of Argentine problems, the frost of the last period, which can seriously affect the wheat crop and so started with problems due to the drought.
Returning to Putin and his statements, we understand the source of the frustrations and tend to agree with him, to a large extent. The Green Corridor actually feeds the European Union and Turkey, and Putin feels cheated because he didn’t get what he bargained for, namely the right to sell fertilizers in Europe. Between September 16-18, he will have meetings with Erdogan to clarify or modify the details of the green corridor.
Argentina comes into the limelight with unpleasant news. The drought that is biting Argentina’s wheat crop is not stopping. Argentine wheat is under big question marks.
So we have two factors, one political and the other related to the effects of the weather. Both conjointly generated a bullish rally in Euronext and the CBOT. And this is before the WASDE report on September 12, 2022. This growth effect will have a weight over time.
If Argentina is a definite source of concern in terms of the effects of the drought, Russia has a clear intention to increase the price and export. The fact that the export tax mechanism once again lowered its level by 12.5 USD to the level of 48.7 USD/MT indicates to us the desire of Russia to generate more export, which can be achieved only by removing others from the competition perimeter players.
Through his rhetorical statements about the green corridor, Putin generates a price increase at the European and global level. At the same time, the export tax decreases and implicitly generates easier access to many markets, markets that are in low demand.
Wheat is still expensive for many destinations, and they prefer the “hand-to-mouth ” system, i.e. they supply in small quantities and only as much as is necessary for consumption, because many figures are known about the level of the Russian crop and the Canadian surplus, as well as the Australian one.
Egypt domestically consolidated its purchases by about 0.7 million tons. Thus, purchases from the domestic market have risen to the level of 4.2 million tons, which means that we will have a reduced import level by this amount. This aspect definitely penalizes future Egyptian purchases.
In short:
- The wheat rally was driven by political and weather factors.
- Next week, the political factor will be finalized, because Russia is interested in selling, and the blocking of the green corridor could have repercussions on it. Let’s not forget that Joe Biden declared that Russia will not enter the list of terrorist states because it accepted the opening of the humanitarian corridor.
- The physical market will react accordingly, but the much higher commodity price level will give Russia a leg up in future commodity sales. Russia has an interest in selling wheat, not in blocking it internally. Russian farmers need liquidity to continue the production cycle.
- Erdogan talks, but according to the above, Putin is targeting the sale of fertilizers, not the blocking of the green corridor, since a lot of corn comes out there, and Russia has little to do with it, taking into account their domestic crop level of only 15 million tons.

No essential changes are recorded in the purchase values of CPT Constanța of feed barley. The level is maintained at 270-272 EUR/MT.
At the regional level, no disruptions to the price offered in traditional origins are seen.
BARLEY PRICE INDICATIONS IN MAIN ORIGINS


LOCAL STATUS
The indications of the port of Constanța are at the level of 288-293 EUR/MT in CPT parity. In the country, corn is still trading at the level of 270-275 EUR/MT.
Maize harvesting has started in Romania and we estimate a harvest level of 10% of the area. Yields, as we know, are extremely low, and production is still quoted at a maximum of 8.2 million tons.
These premises lead us to an extremely low export of corn. But apart from the very small crop, the market distortion continues, due to Ukrainian flows generating cargo volumes. The discount of goods clearly affects the price of Romanian products and the final impact is on the balance sheet of Romanian farms.
CAUSES AND EFFECTS
The reduced Romanian crop has an effect at the national level, unfortunately. The fact that there is a drought in Romania does not affect global production. An extremely important marker will arrive without delay on Monday, September 12, 2022, namely the WASDE report, which will be released to you at 19.00 Romanian time.
Another cause that will have a domino effect on commodity prices is the fight against inflation generated by central banks globally. Thus, the Bank of Canada generated an interest rate increase of 0.75%. On September 8, 2022, the ECB (European Central Bank) increased, for its part, the monetary policy interest rate by 0.75%, representing the largest increase in the history of the monetary policy union, and the FED is again on the horizon – The US Federal Reserve, which on September 27, 2022 will raise interest rates. Normally a 0.5% increase is announced, but appearances lead to 0.75% (some sources claim as much as 1%).
In other words, a price rally, potentially generated by the WASDE report, will be altered over time by central bank policies. And here comes a very big problem. Crop establishment costs are heavily penalized by the cost of fertilizers, which will keep the price of commodities (and corn, for that matter) from falling below a certain level. It is a general current that manifests itself not only in Europe, but also in North America.
REGIONAL STATUS
RUSSIA remains at the same forecast of 15.5 million tons in the days leading up to the report.
UKRAINE remains a question mark. WASDE generated a volume of 30 million tons, but the line minister in Ukraine generated a figure of only 24.7 million tons. How should we judge these figures? Who should we believe? We suspect both sides are right. It’s a lot of image manipulation and supply and demand shaping. WASDE needs volume stability and Ukraine needs better commodity prices.
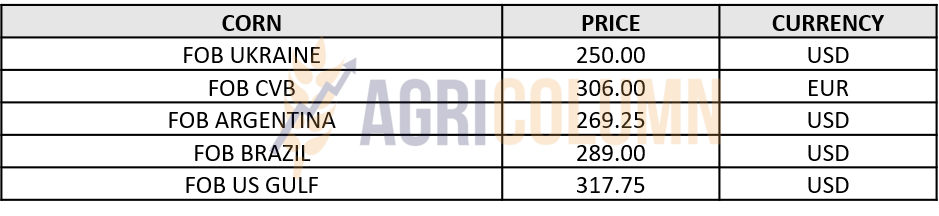
As an extremely interesting detail, lift logistics or fobbing in the three green corridor ports is 50-60 USD/MT. In other words, the operators in the three locations have greatly reduced the operating price on demand, and we all know that in times of war the biggest profits are made. Thus, corn offered FOB Ukraine at 250 USD/MT has a CPT price of 190 USD/MT. 50-60 USD/MT goes into the port operators’ accounts.
The same thing is happening in Romania. Discounts on goods are made from the operational cost. Ukrainian traders selling in Constanța have a lifting or fobbing cost of at least 30 USD/MT, compared to, say, 10 USD/MT for Romanian goods. But this fobbing price is moved to FOB parity to create the illusion of equal treatment. Ukrainian cargo is not sold CPT, but FOB, and the operating contract has the rates of 30 USD/MT, as mentioned above. At a glance, it can be said that the origins have the same price, but the operational cost differs. Next, indigenization is carried out and the resulting product mix is offered as multiple origin.
The EUROPEAN UNION maintains its crop forecast of 59.3 million tons, but we maintain the figure of 55.5 million tons. We do not believe that WASDE will substantially fine European production because it does not want a price rally.
Ukrainian goods must come at prices as low as possible to feed the demand of European processors. It is, if you will, part of the bill for military aid to Ukraine. Bullets in exchange for food.
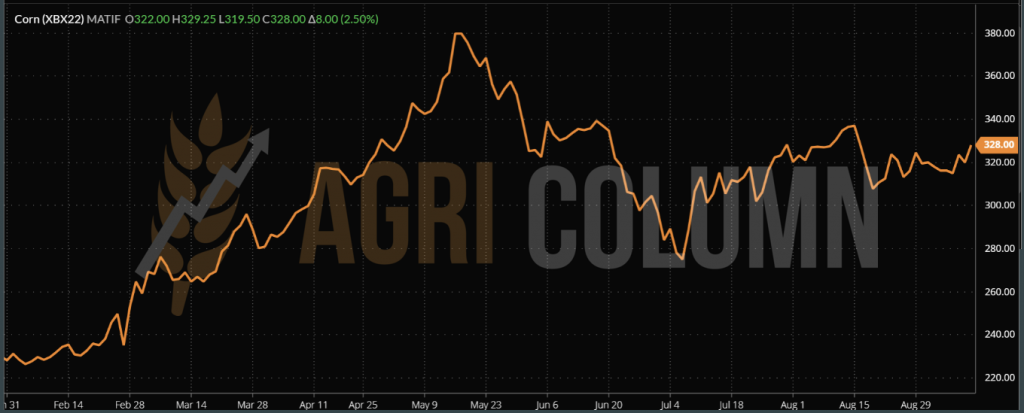
EURONEXT XBX22 NOV22 – 328 EUR (+8 EUR)
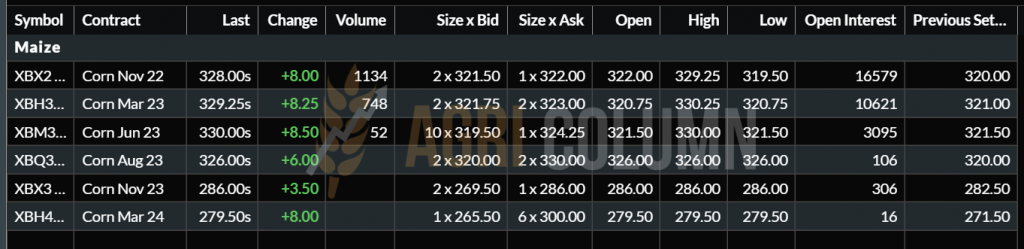
EURONEXT CORN TREND CHART – XBX22 NOV22
GLOBAL STATUS
The US goes through a period where success is intertwined with disappointment. Some North American states show very good crops and will produce excellent corn yields, while others are extremely disappointing. As a general picture, states with good productions will not be able to cover the deficit of production in other states.
Kansas has started harvesting, but results are below expectations. Ohio needs water and sun, and Iowa and Illinois will most likely not produce the predicted yields.
Pro Farmer Crop tour generated minus 16 million tons in US production, while Barchart estimates the same volume as on August 12, 2022. WASDE will certify part of the truth with the report, knowing that they are not pouring gasoline over the price rally through the 100% certification of the decrease in the corn crop.
BRAZIL. Corn production in 2021-2022 decreases by 1.42 million tons, from 114.69 million tons (both Safra + Safrinha crops) to 113.27 (estimated on August 21, 2022)
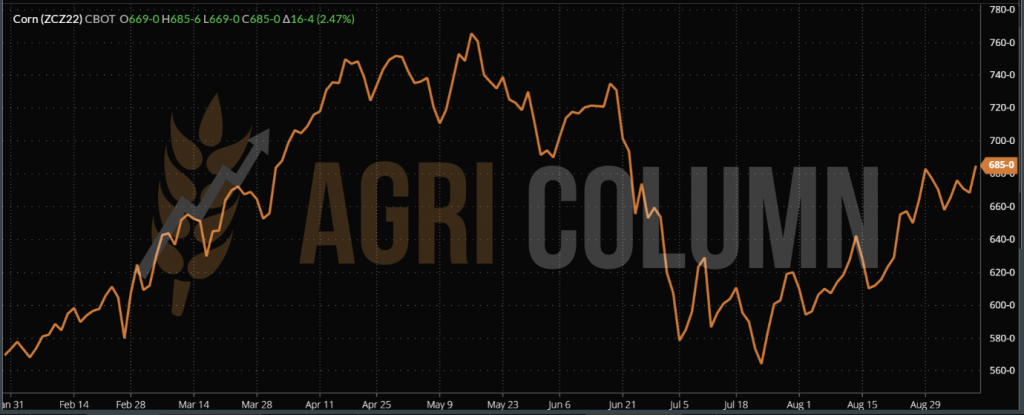
CBOT ZCZ22 DEC22 – 685 c/bu (+16 c/bu = +6.3 USD)
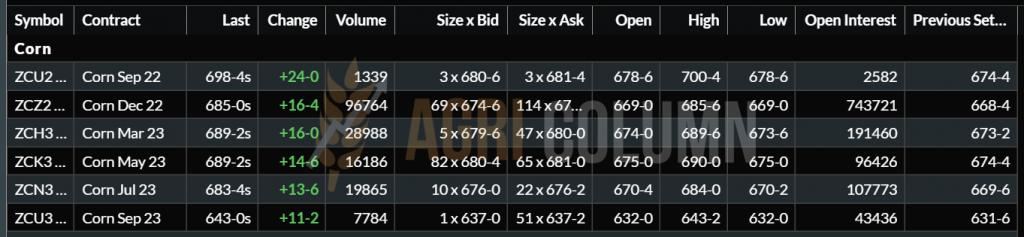
CBOT CORN TREND CHART – ZCZ22 DEC22
CORN INDICATIONS IN MAIN ORIGINS
CAUSES AND EFFECTS
The expectation in the market is for corn to rise in price following the release of the WASDE report. In other words, everyone in the market is expecting a bullish report, which is correct, regarding market fundamentals. And we list them below:
- The European Union has a crop devastated by drought;
- The US is seeing a decline in crop potential;
- Ukraine is questioned (30 or 25 million tons?);
- Will the green corridor be maintained or will it change? Or will it be closed after the 120 days are up?
- Brazil records a decrease in volume of 1.4 million tons.
We are clearly seeing an increase in the corn price driven by lower volume globally. But in the physical market will it have effects, taking into account that the European Union is supplied at discounted prices from Ukraine?
Moreover, the costs of establishing corn are very high, and this year’s drought has deeply affected the financial potential of farmers. If the price of corn will increase, it will automatically pull the level of wheat with it. But how long can it last, taking into account the financial policies of the central banks?
WASDE will deliver the information little by little, keeping a possible rally under control. October and November 2022 will reflect the volume-wise end of the North American, Ukrainian and European corn harvests.
But from the growth premises that will be able to be fined by financial policies, an element that can create surprises emerges, namely the North American NASS stocks report of September 30, 2022. A possible decrease in corn and wheat stocks at the North American level would could trigger a price rally in the physical market.
Until then, there is still plenty of time to wait for the WASDE report for a more accurate assessment of the physical market and fundamentals. We believe we will see the price of corn rise, judging by the frenzy of hedge funds, which are accumulating long corn positions on the CBOT.

LOCAL STATUS
Local indications are given, naturally, with the NOV22 indication hovering around 600 EUR and therefore the price potential sellers receive is at a negative 20 eur/MT Premium for cargo delivered at parity CPT Constanța.
In the local market, we see a higher negative Premium of 30 eur/MT applied to the NOV22 indication. The larger discount is generated by the distance between the processing unit and the port of Constanța, so it is a logistical effect. Although logistics should have no implication here, only crush calculation margin, given that the finished product, i.e. rapeseed oil, goes to biodiesel blending which is mainly done by processors in the local oil industry. Even if there is also the export of crude rapeseed oil, the whole point of processing remains as the main landmark, because there the operations are carried out towards the final result, i.e. crude rapeseed oil.
In Romania, the sowing of rapeseed is in full swing, with a number of 270,000-280,000 hectares sown. The figure we forecast to be final is around 500,000 hectares. Today we are almost 60% done.
CAUSES AND EFFECTS
Rapeseed has no growth horizon in the coming period, due to European and Ukrainian harvest volumes. We remind you that the Ukrainian rapeseed crop is intended for export to the European Union and therefore adds to the 18.8 million tons estimated as the final European figure in terms of volume. It is an increase of 2.8 million tons. The effect is clearly visible in Euronext quotes, which are around 600 EUR/MT, and a possible horizon for the increase in the value of European rapeseed is estimated after a period of at least 60-80 days from now.
REGIONAL STATUS
THE EUROPEAN UNION increases the harvested volume level from 18.8 million tons to 19.15 million tons, which creates downward pressure on the EURONEXT NOV22 indications.
UKRAINE remains at the volume of 2.8 million tons, without changes.
RUSSIA also remains at 3.9 million tons.
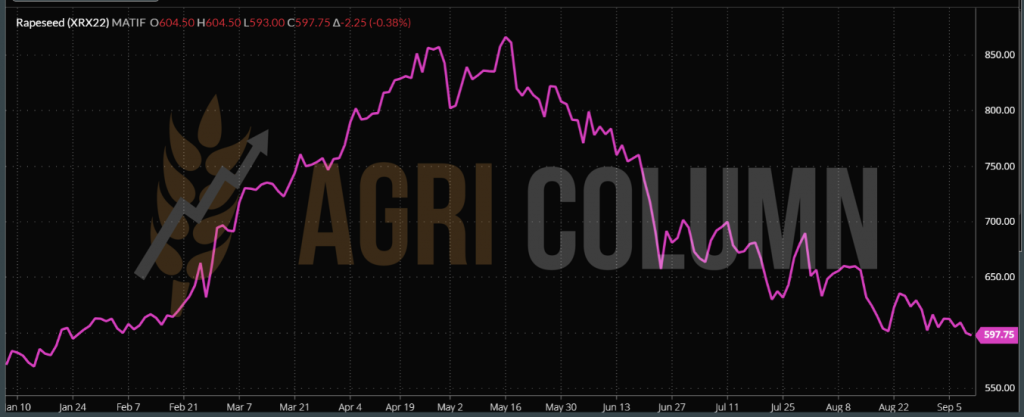
EURONEXT RPS XRX22 NOV22 – 597.75 EUR (-2.25 EUR)
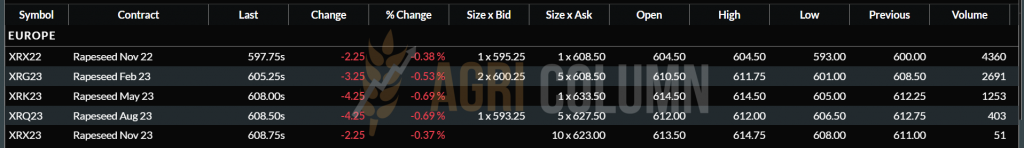
EURONEXT RAPESEED TREND CHART – XRX22 NOV22
GLOBAL STATUS
CANADA is in full canola harvest and remains in the same volume forecasts of almost 20 million tons. The Canadian harvest season closes at the end of October. Sakatchewan with 53%, Alberta with 30% and Manitoba with 16% are the main harvesting basins for Canadian canola.
AUSTRALIA maintains its forecast of more than 6 million tons, and harvesting will begin in early October. The three volume basins are New South Wales with 34%, Western Australia with 31% and the state of Victoria accounted for 20% of the volume of over 6 million tons of rapeseed.
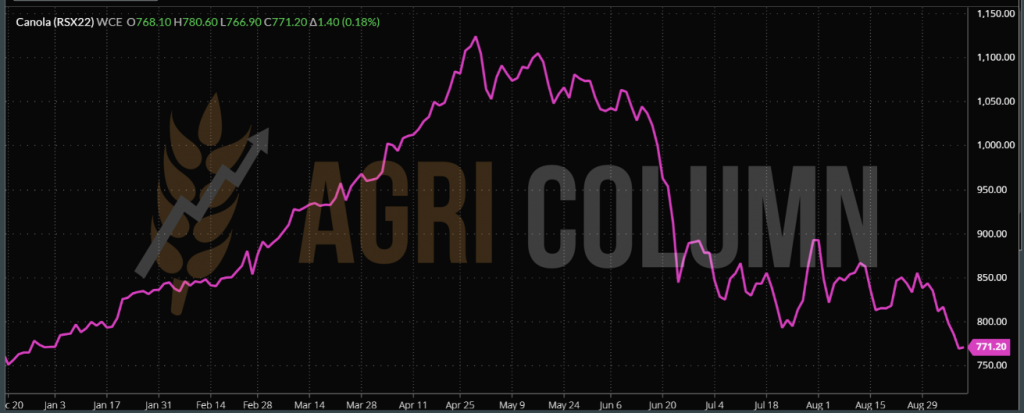
ICE CANOLA RSX22 NOV22 – 771.2 CAD (+1.4 CAD)
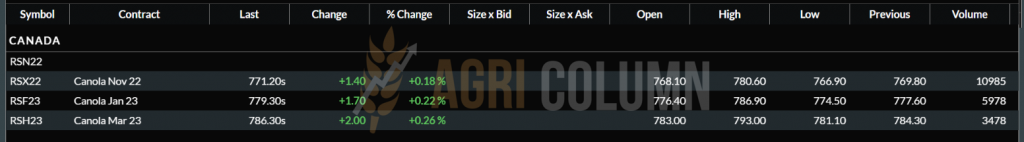
CANOLA TREND CHART – RSX22 NOV22
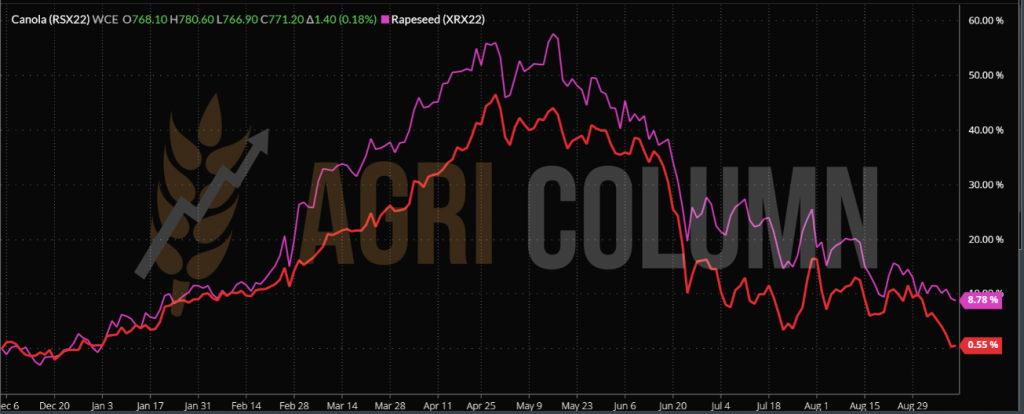
COMPARATIVE EURONEXT VS. ICE CANOLA
CAUSES AND EFFECTS
The main causes that led to the cooling of rapeseed prices are:
- Generous harvest volumes from the 3 continents (and we are talking about origins): North America, Europe, the Black Sea basin and Australia, which offset last year’s low volume liquidity generated by the drought in Canada.
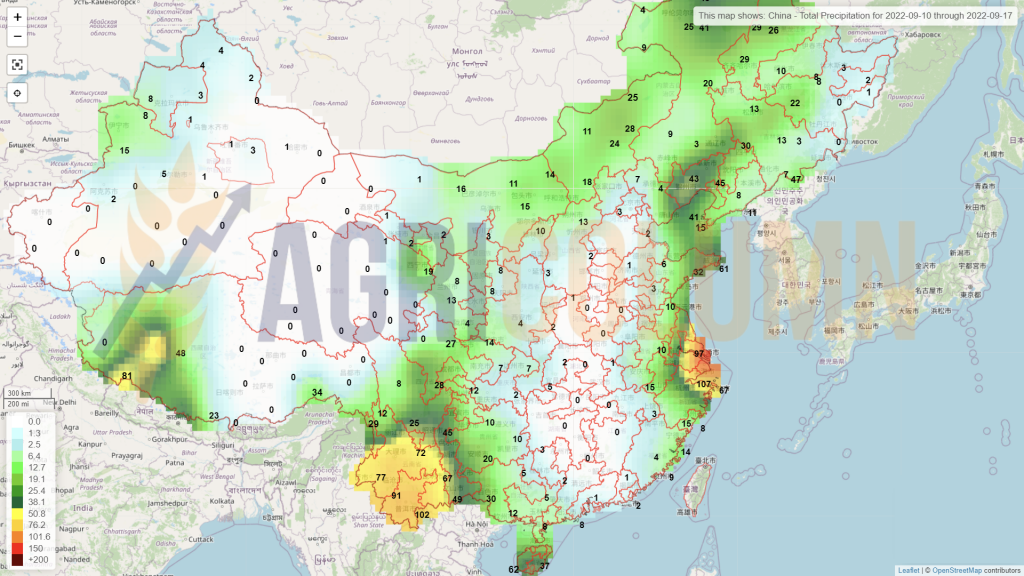
- Destination volumes: China will sow 7.1 million hectares with rapeseed, and their harvest will begin in April 2023; India will sow over 8.6 million hectares and also harvesting will begin after mid-March 2023. China will generate 14.7 million tons and India 11 million tons.
- Lower palm oil indications to around 3500-3600 MYR/MT due to high stocks in Indonesia.
- Oil prices in WTI (Western Texas Intermediate) and Brent hovering around 90 USD/barrel.
- The values by which the European Central Bank and the FED increase the value of the reference interest rate.
What to expect:
- A revival of processor interest in canola after mid-October 2022, when they will subsequently compete for quantities of canola in Europe.
- During the winter, the crops of India and China should be watched. Any problems there will boost the price of rapeseed.
- Also, everything has to be given with the price of oil and the FED’s moves to increase the monetary policy rate.

LOCAL STATUS
Indications of sunflower seeds fell extremely much, reaching the level of 540-545 USD/MT in CPT Constanța parity. Bonus quotes for high oleic sunflower seeds remain around 60 USD/MT.
Romanian processors have dramatically reduced the price level of sunflower seeds and we see extremely reduced levels for most of those who make up the profile market. 515-520 USD/MT is the level that industry processors are offering in the market.
The harvest has reached the level of 50% and the results are not gratifying from the point of view of the productions. We see major discrepancies between adjacent plots. Some generate 0.7 tons/hectare, others 2 tons/hectare. But the forecast remains unchanged at the national level – 2.2-2.3 million tons.
CAUSES AND EFFECTS
How is this drop from week to week possible? In the last issue, we warned about this dramatic drop and quoted: “Whoever sold or is selling these days is doing very well. The pullback we’re seeing in the market is coming from multiple directions.” It was exactly the directions we outlined in issue 33 that drove the price down 70-80 USD/MT over a 5-7 day period.
On top of all the causes listed in the last issue and which we do not recall here, the cost of gas and electricity has now also intervened, which has a major impact on processing. Thus, the processing units operate on a negative crush margin.
In other words, we are talking about the money you have left over after you process 1 ton of sunflower seeds and sell the crude or refined oil, meal and other by-products. From this money, however, you must ensure the variable and fixed costs of the processing unit, with all its operational, human and technological components. Today, the calculation of crush margin is negative, between minus 30-35 USD/MT.
Assuming that the price of seeds falls by the value of this economic performance indicator to offset the increased processing costs due to energy and gas, there remains one variable that is constantly hit by volatility – the sale of crude oil. This is, at the moment, at reduced volume levels amid pressure from the VEGOIL complex.
Thus, the price of palm oil positions it as a major factor in demand from traditional destinations. Indonesia has crossed a threshold of 2 million tons of palm oil stocks.
India’s palm oil imports rose 94% from the previous month to 1.03 million tons, the highest level in 11 months.
Crude palm oil is being offered at 1,011 USD/MT including cost, insurance and freight (CIF) in India for September delivery, compared with 1,443 USD/MT for soybean oil.
In August, soybean oil imports halved from the previous month to 240,000 tons, while sunflower oil imports fell 8% to 143,000 tons.
In all of the above, we have harvest pressure, which causes deliveries to processing units to be slowed by reception at the latter’s workstations. Another factor worth considering is the boost in Ukrainian seed exports, which continue to be offered at a discounted price compared to local Romanian goods.
We see a stop threshold to the downside we forecast at 490-510 USD/MT. Here, the market should stabilize in the coming period.
REGIONAL STATUS
UKRAINE remains at the same crop level of 9.5 million tons and at a surplus of last year’s crop of at least 2-3 million tons.
RUSSIA does not change the forecast, remaining at over 17 million tons.
The EUROPEAN UNION remains around 9-9.2 million tons.
CAUSES AND EFFECTS
- Due to VEGOIL complex colleagues, the price of crude oil is falling. We see a level of 1,275 USD/MT, 6PORTS.
- Gas and energy costs impact the price of the raw material.
- The low demand during this period, generated by the price pressure of palm oil, causes the price of crude oil to have a downward trend.
- A commodity price stabilization threshold will most likely be set around 500 USD/MT.
After the end of the harvest in the European Union, Russia and Ukraine, we will be able to have a complete picture of supply and demand in terms of sunflower seed volumes.
To all of the above is added the pressure of the fight against inflation generated by the ECB and the FED, which make cash-flow more expensive.
But we will still have moments of rally in the price of sunflower seeds and they must be very well exploited in the period January-March 2023.
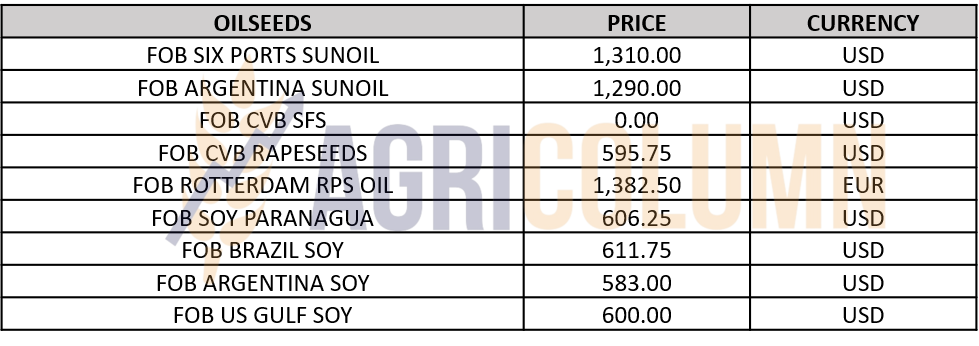
CSFO AND OILSEEDS INDICATIONS IN MAIN ORIGINS

LOCAL STATUS
Local processors’ indications for soybean fell to 570-575 USD/MT.
REGIONAL STATUS
The EUROPEAN UNION expects the 2022/23 EU rape crop to reach 2.49 million tons, down 10% from previous estimates, while yields were cut by 11% to 2.35 tons/Ha. Soybean acreage is expected to be 11% higher than in the 2021/22 season.
GLOBAL STATUS
USA. The condition of the soybean crops remains this week at 57% good to very good.
BRAZIL. For Brazilian farmers, the start of soybean planting is regulated by the government. Planting dates have been established (start planting between September 13 – October 1, 2022 and complete planting between January 31 – February 18, 2023) to help control soybean rust (Phakopsora pachyrhizae) from one growing season to another. These data are part of the National Asian Soybean Rust Control Program (PNCFS) with the goal of reducing the number of fungicide applications and slowing the development of resistance to current fungicide treatments. Soybean rust is the most important disease affecting soybeans, and in areas where the fungus is epidemic, yield losses can range from 10% to 90%, depending on the level of control.
La Nina could extend into January. The significance of this new forecast is huge for several areas of the world, but first on the list is South America. The longer La Nina persists, the greater the potential for another less-than-ideal growing season in South America. Analysts forecast total South American soybean production for 2022/23 to be 216 million tons, up from 172 million tons for 2021/22 soybeans.
BRAZIL. In its final assessment of the 2021/22 crop, CONAB raised its official soybean crop estimate by 1.5 million tons to 125.6 million tons, which was still 9.9% lower than the previous year’s record. Regarding the soybean export forecast, CONAB increased the 2021/22 forecast by almost 2 million tons, to 77.2 million tons.
ARGENTINA. By the end of August, Argentine farmers had sold nearly 52 percent of the 44 million-ton soybean crop of the 2021/22 season, according to official data, well below sales recorded in the same period of the previous season.
The Argentine government has allocated a fund of 300 million USD to grant a preferential exchange rate to farmers who sell soybeans for export. It is called dollar-soy, it will be valid until September 30 and is aimed at boosting exports and hard currency reserves.
The results were immediate, with Argentina’s daily soybean trading volume reaching its highest level in 5 1/2 years, Rosario Grain Exchange said. Farmers sold 3.1 million tons in the first 3 days after the government announced the higher exchange rate. Not all of this is necessarily for the export market, although this move should certainly increase shipments in the short term.
USA. This week, the USDA confirms the sale of 104,000 tons of soybeans for delivery to Taiwan in 2022/23. As the final volume of the US soybean crop becomes clearer, market attention will turn to demand and the upcoming South American farming season.
Top US soybean buyers 2021: China 51.5%, Mexico 9.5%, other countries 9%, EU 8%, Egypt 5%, Japan 5%.
US soybean processing remains at 61.1 million tons, but exports were revised upward from 58.11 to 58.65 million tons.
The United States is losing its soybean export advantage as Brazil closes the logistics gap. US farmers, facing supply chain bottlenecks and a rising dollar, are losing their competitive edge in the global soybean market to their biggest rival: Brazil.
In most years through 2020, it was about twice as expensive for China — the main importer — to ship Brazilian soybeans than American soybeans. But U.S. logistics problems, upgrades to Brazil’s ports and supply infrastructure and a strong dollar have almost completely eliminated that gap, USDA data show.
Soybean futures in Chicago lost ground earlier in the week as prices faced headwinds on expectations of higher sales by farmers in Argentina, one of the main producers and exporters of the oilseed.
CHINA. China’s soybean imports fell 24.5 percent in August from a year earlier to 7.17 million tons, customs data showed, as high global prices and weak demand dampened appetite for the oilseed.
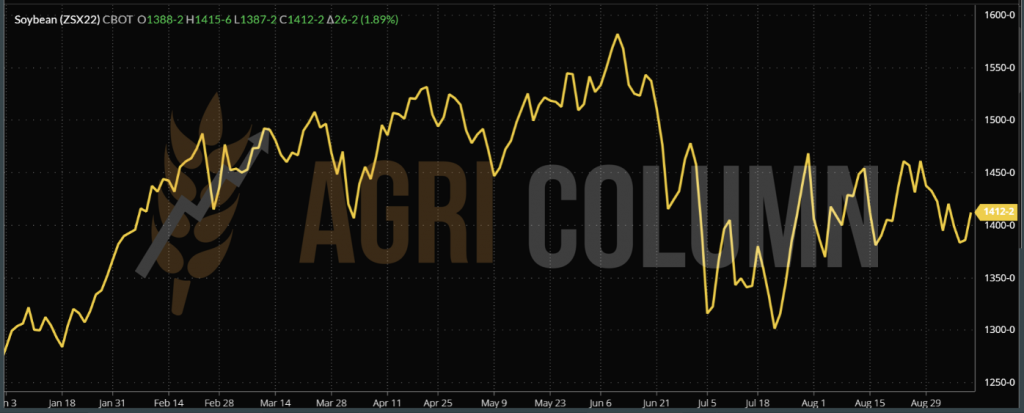
CBOT SOYA ZSX22 NOV22 – 1,412 c/bu (+26 c/bu = +9.55 USD)
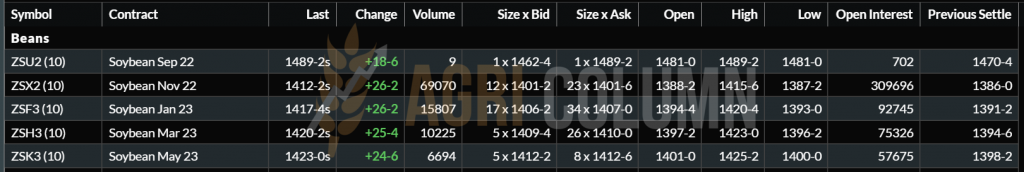
CBOT SOY TREND CHART – ZSX22 NOV22


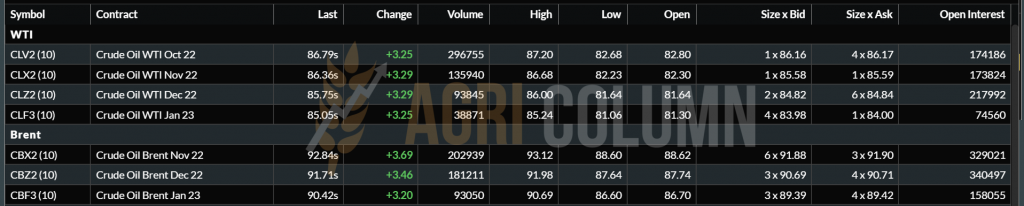
WTI 86.79 USD/barrel | BRENT 92.84 USD/barrel

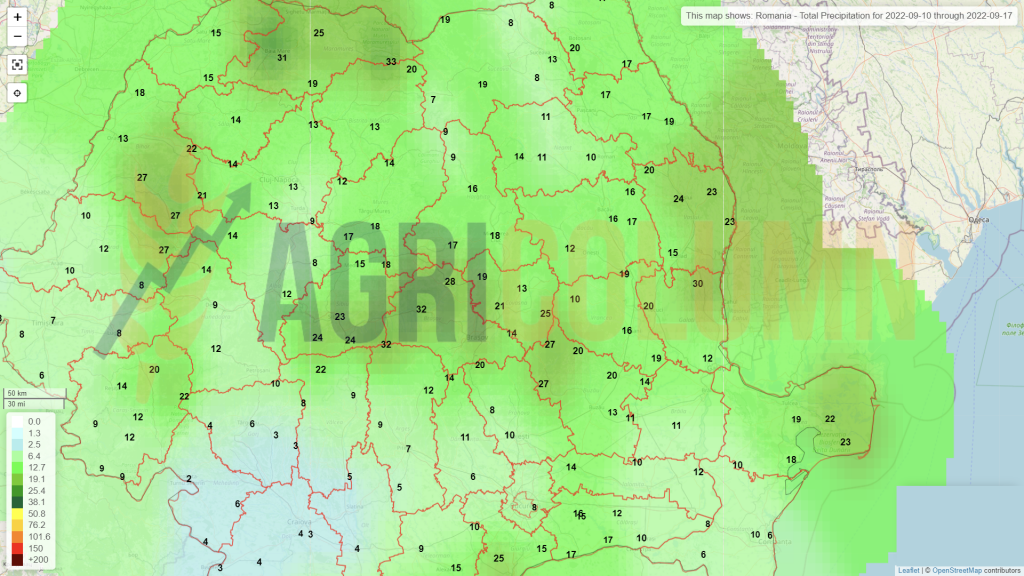
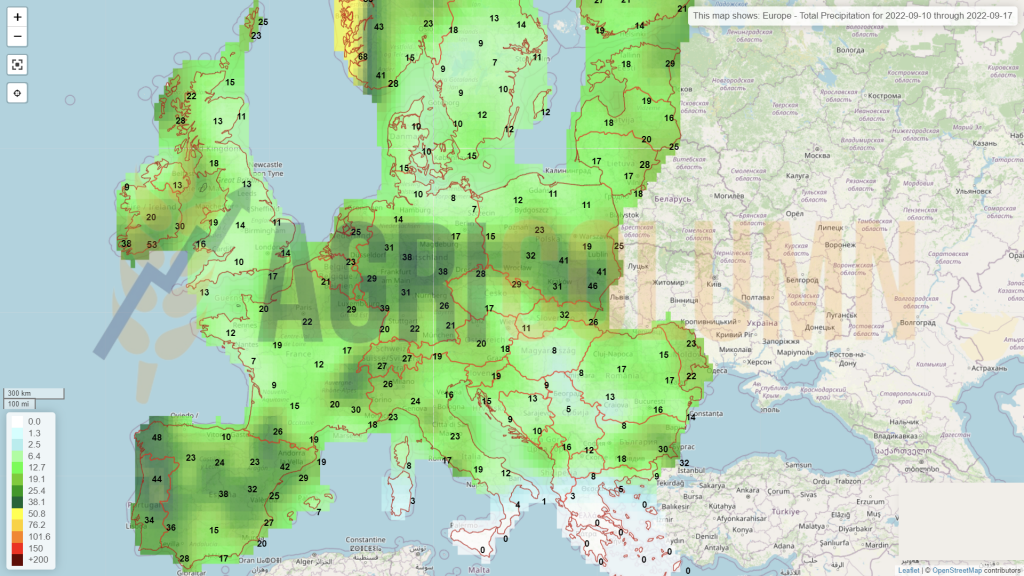
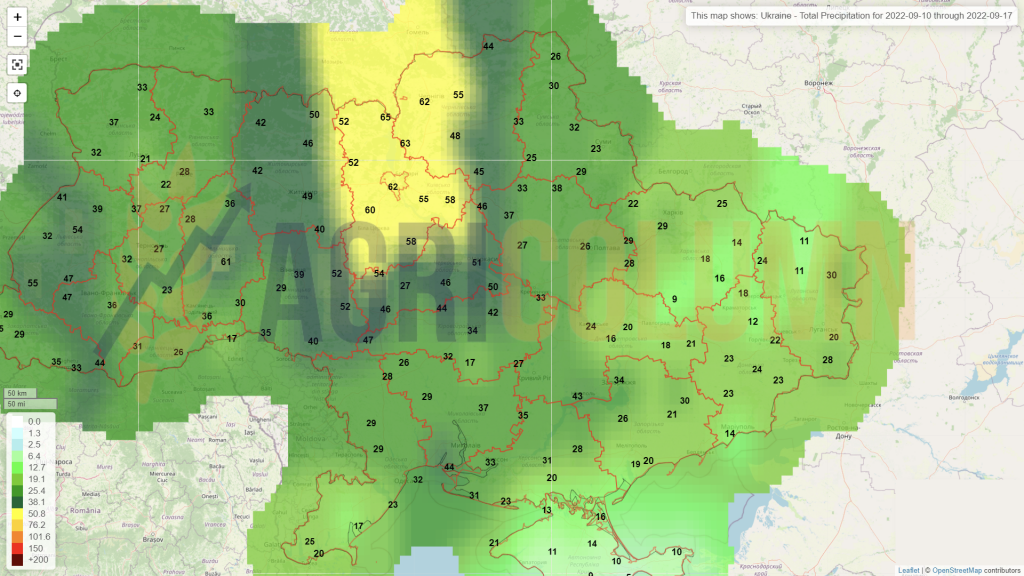
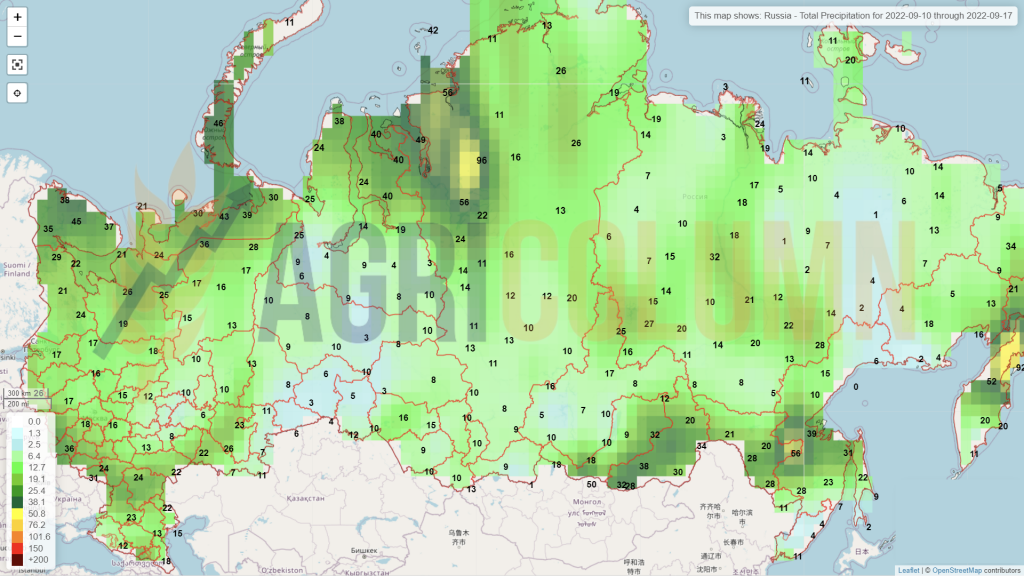
10-17 September 2022
Romania
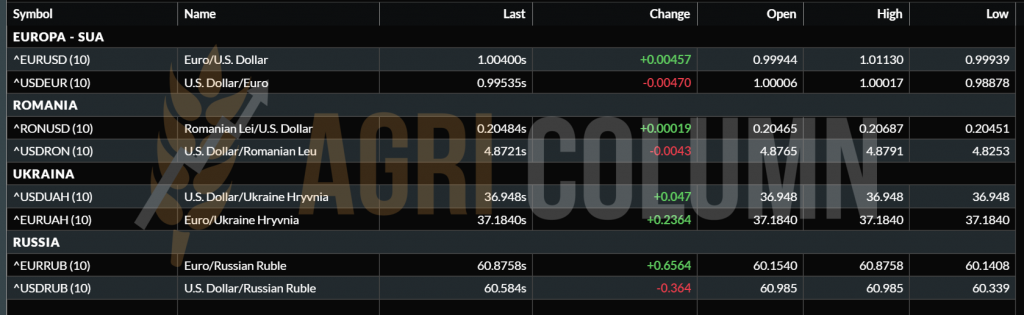
Europe
Ukraine
Russia
Canada
USA
China
Australia