This week’s market report provides information on:

LOCAL STATUS
The indications of the port of Constanța remain at the same pace, coordinated by the existing demand. We see levels of 315-320 EUR/MT. There was a single spike, which we’ll explore a little later, that lifted the level for the day to 328 EUR/MT, but everything is back to where it was. The discount for feed wheat remains at 20 EUR/MT.
In the local market, the processors fix a range of purchase prices between 327-335 EUR/MT, but everything is corrected by the contractual quality conditions. The quality specifications are not so friendly as those that form the export market standard.
Here we have a dilemma that maybe in the future will find its solution. The export market conditions the price for the quality of milling wheat, classically based on humidity, foreign bodies, protein content, test weight and the alveographic index W established at min 180.
In the quality requirements from the processors, however, there are many other elements that condition the definition of the goods as milling wheat. And these requirements sometimes significantly impact the price of the goods, so the farmer prefers to sell to an exporter because the arithmetic is extremely simple. The price of goods going to processors undergoes negative changes that can cause the final level to fall below the price shown by the exporter.
The payment term also contributes to the sale decision, which is not based on CAD (cash against documents) and can be extended up to 30-40 days, during which the farmer needs financial liquidity to support the activity on the farm. We know that in the vast majority of cases, farm selling is driven by the need for liquidity or periods when it is extremely obvious that the price level is falling sharply.
A fair solution could be agreed upon by processors and farmers alike through transparency and agreeing to some common rules and procedures that solidify the relationship between the two parts of the supply-production chain.
We would briefly mention the relaxation of the quality conditions required in the processing units, bearing in mind that wheat is not intended entirely for the extraction of flour for the manufacture of bread, but is also used in the manufacture of other products intended for consumption that do not require a specific quality condition.
In support of the above, we could ask: if the wheat that is exported has the condition of milling quality for the destinations where it arrives, why could it not also have it on the local market?
Another common procedure should take into account processors’ ability to pay and farmers’ needs. Everyone should adjust their expectations. Farmers should calculate their cash- flow requirements in stages, and processors should reduce the payment term to a level of internal comfort. We also understand the position the processor is in, given that there is a significant time frame from the time he pays for the raw material until the time he collects for the finished product. This collection term can be extended up to 45 days in some cases. And we evaluate at fair value the positive price difference that the processor displays in the raw material purchase price. It also includes a financing cost addressed to the farmer, a cost that has a financing value of at least 9-12% per year, divided by the period called the payment term.
We believe that there are solutions, we believe that only transparency and correct discussions will be able to aggregate and standardize the parameters so that we no longer go through periods of blockages like the ones we are seeing in this period. It would be proof of the maturation of the Romanian agribusiness market.
CAUSES AND EFFECTS
August 24, 2022 brought a lot of anxiety to the wheat market. The effects of a potential concerted attack by Russia on Ukraine on the day of the latter’s National Day celebration caused trading algorithms to react by raising the market level. But after the passing of this day, everything calmed down, more precisely from 17:30, local time of Romania, on August 24, 2022.
At the same time, the volume of Romanian goods destined for export did not register significant jumps. We’re seeing a gradual increase, and we’re also seeing the same latent state of buyers from the traditional destinations, who understand that there is a significant volume of wheat in the market, so the trend is one of downward pressure on the price level.
Let’s not omit the fact that Romania, through the port of Constanța, still has a very high price level compared to Russia. The reason is obvious, namely the predictability of Romanian goods, in the logistical sense. In other words, what is agreed, signed is also executed. It is perhaps the most important parameter, and exporters do their job very well in this direction.
REGIONAL STATUS
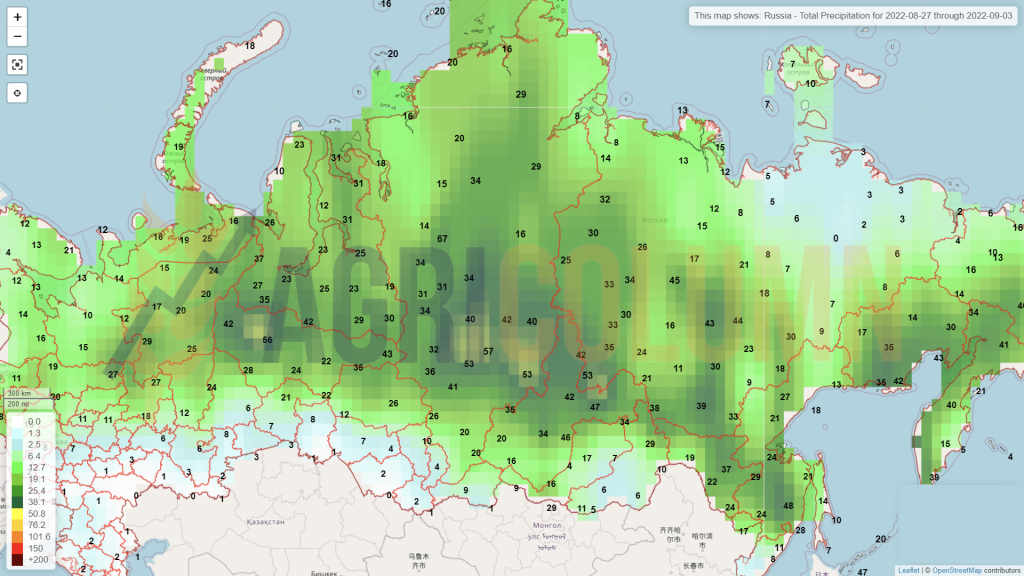
RUSSIA is at the same production level mentioned last week, of 93-94 million tons, specifying that this includes the famous bunker weight, that is, the cargo exactly as it is received at silos and bases. From here, however, we must admit a correction, due to the level of humidity and the content of foreign bodies (admixture).
We are days away from the end of August and Russia is failing to meet its stated export targets. Thus, we have a cumulative wheat export due to Russia of 5.9 million tons, calculated between July 1, 2022 and August 23, 2022. This aspect takes them very far from the initial targets, and we recall the ambitious figure of 5 million tons export in August.
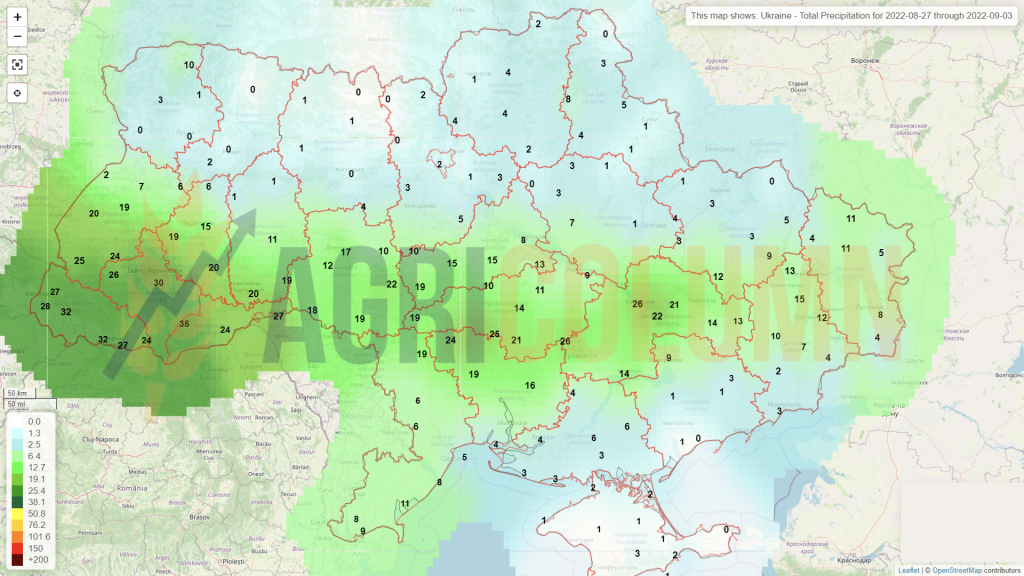
UKRAINE will remain within a wheat production limit of 17.5-18 million tons. It is a steep and obvious drop from the previous year’s level, when they had an output of 33 million tons. We know the reasons and will not repeat them. We will just mention that the vast majority of Ukrainian wheat production is in direct conflict zones and has been and is subject to destruction and theft by the Russian military.
The EUROPEAN UNION indicates an increase in production due to Germany, which comes with a surplus of 0.8 million tons, from 21 million to 21.8 million tons. France, on the other hand, announces a deterioration in wheat quality, the protein level being the affected parameter. But an increase in production means nothing more than a higher level of volume, which puts pressure on the price of wheat.
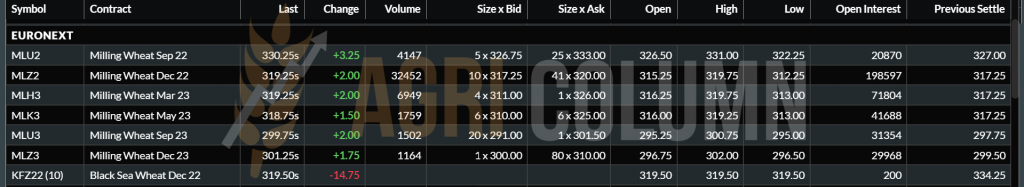
EURONEXT MLZ22 DEC22 –319.25 EUR | BSW KFZ22 – 319.5 USD
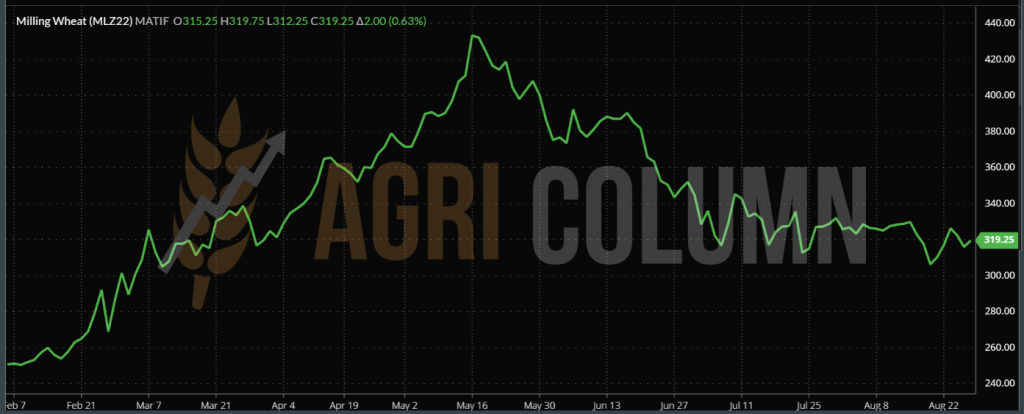
WHEAT CHART TREND – MLZ22 DEC22
GLOBAL STATUS
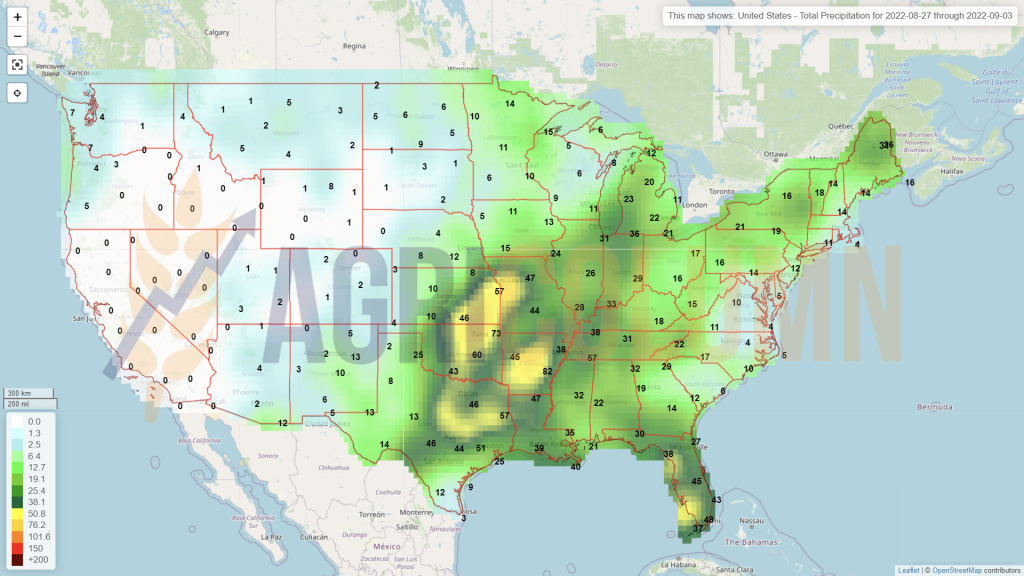
The US does not change between previous report and the current one.
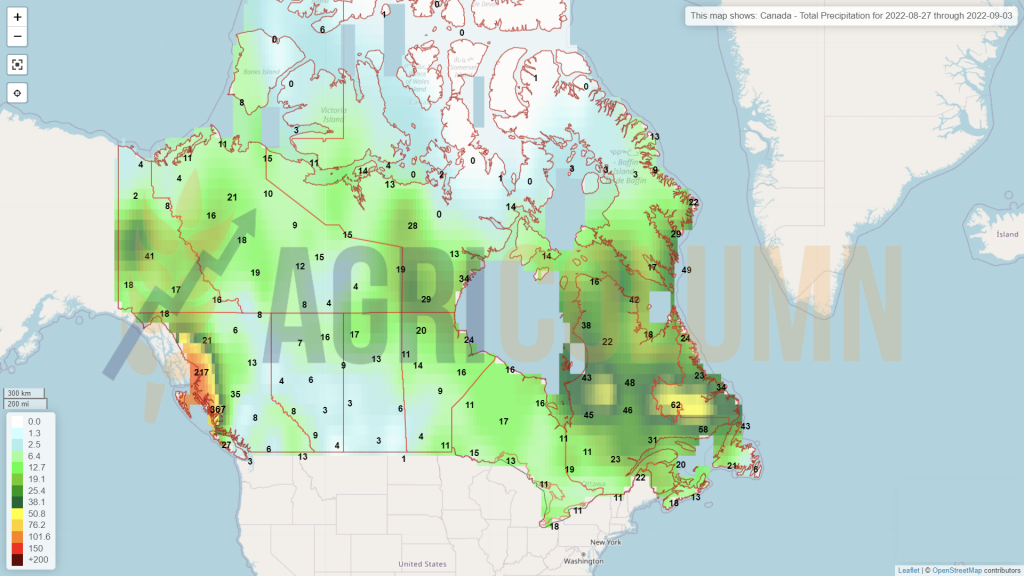
CANADA has no changes between the previous report and the current one, with the exception that they have started harvesting.
ARGENTINA undergoes no changes in the period between the previous report and the current one.
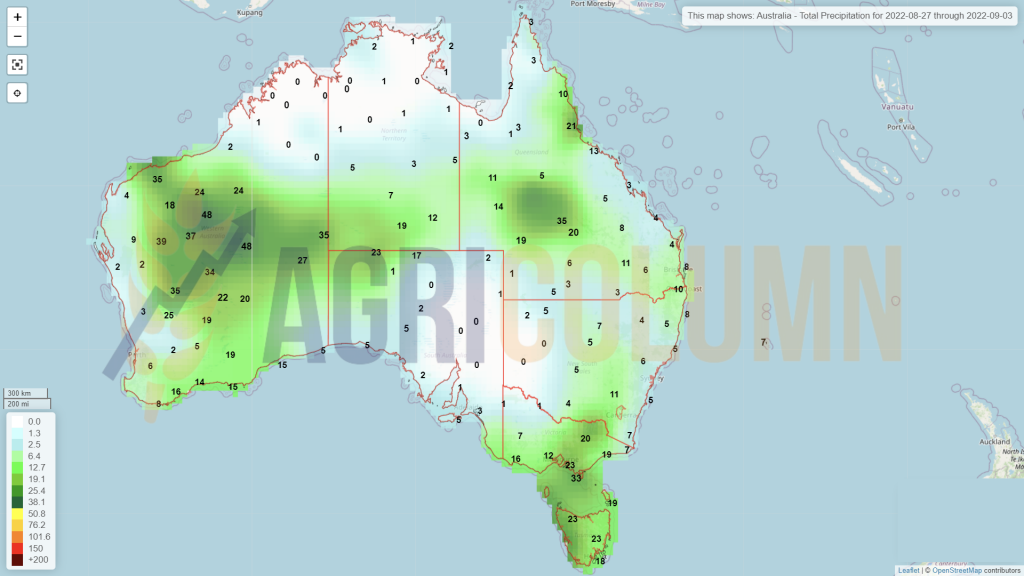
AUSTRALIA is unchanged between the previous report and the current report.
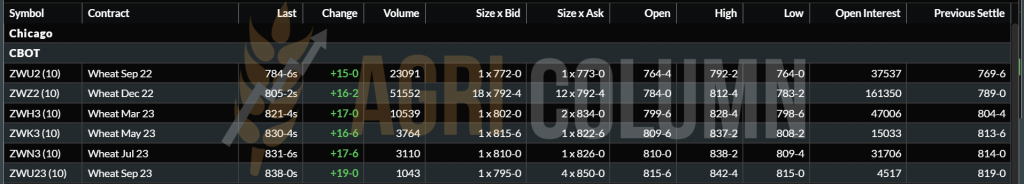
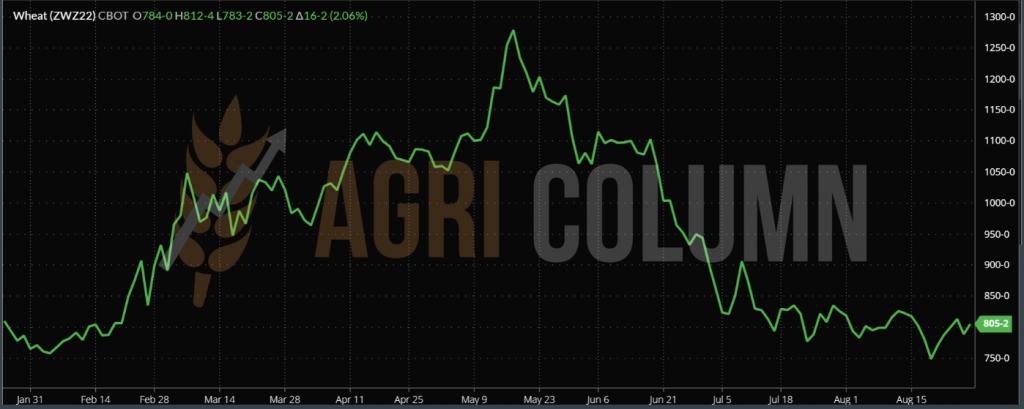
CBOT ZWZ22 DEC22 – 805 c/bu (+16c = +5.9 USD)
CBOT WHEAT TREND CHART – ZWZ22 DEC22
TENDERS AND TRANSACTIONS
EGYPT purchased by direct purchase 240,000 tons of wheat of Russian origin, at the price of 368 USD/MT CIF. The delivery period is September 1 – October 10, 2022. Seller – GTCS 6*40,000 tons, priced at 310 USD/MT FOB Russia.
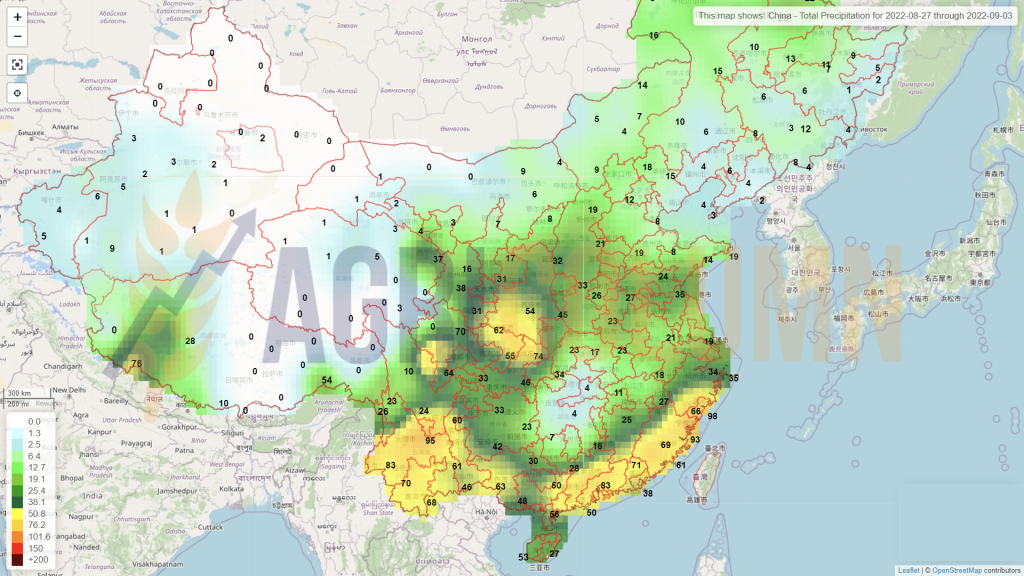
CHINA quietly purchased a volume of about 500,000 tons of feed wheat originating in France, about 10-10.5 PRO. Given the opacity of China, we have no data regarding the price level and delivery period.
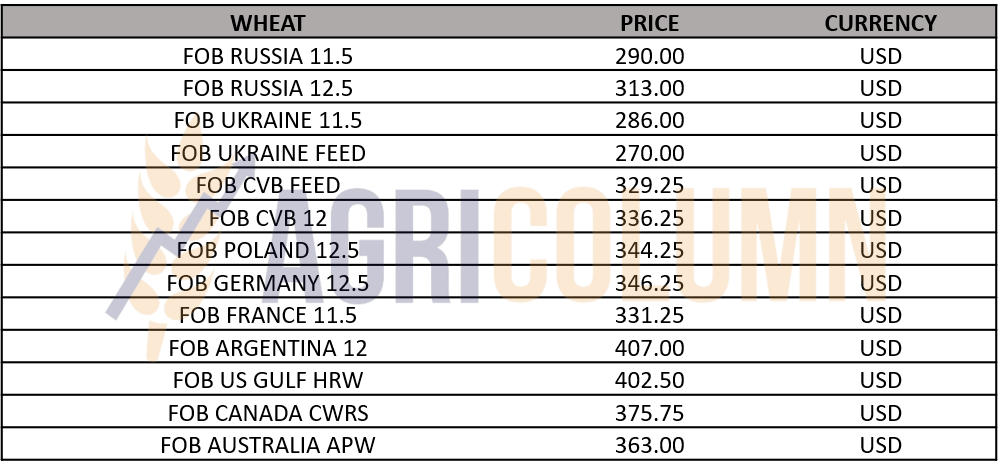
WHEAT PRICE INDICATIONS IN MAIN ORIGINS
CAUSES AND EFFECTS
Maskirovka is working again. After Egypt’s signal that it has enough wheat for a period of time, buyers began to prepare for a GASC tender. But the price being static and therefore implicitly low, there had to be a lot of merchandise to offer. Russia, on August 22, 2022, launched rumors that were picked up by Ukraine, as if there would be massive bombings on the infrastructure of the most important Ukrainian cities on the National Day of Ukraine, on August 24.
The stock market algorithms received the signals and reacted, so that the Euronext stock market rose by 10 EUR, to the level of 326 EUR. Buyers bid higher amid this assumption-induced spike, and Russia, which effectively made no move, sold at the level it wanted, eliminating competition from other origins.
It’s a textbook lesson that no one wants to learn. Repetitive and constant. Russia achieved its goal, hedge funds also took profit by exiting positions, and the market returned to where it was before Monday, August 22, 2022.
CHINA serves its own interest and silently builds its domestic food plan. We should associate this action with the cost of the commodity and the replacement level. It is a very strong signal about the price of corn vs. the price of wheat. The purchase of 500,000 tons of feed wheat from France indicates a stagnation in the price of wheat.
In the relationship with Russia, the European Union has not fully complied. The UN deal with Russia stipulated (although no one saw the deed) that Russian ships would be welcomed to their destinations and EU-wide fertilizer trade would resume. But the Union did not take over the second parameter, and the sanctions were not lifted. So, Russian stocks remain frozen in European Union countries.
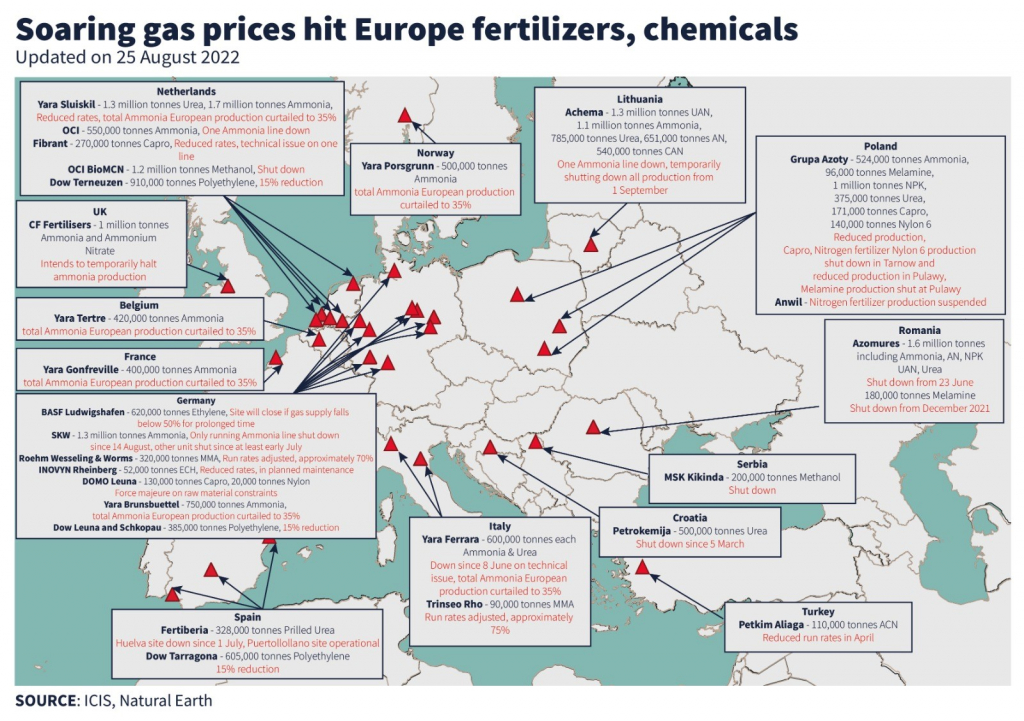
In retaliation, Russia thinned gas supplies, causing the price to rise exponentially. The effect? Many fertilizer factories in the EU have reduced their production or even stopped it. Here we effectively have a deadlock that is avoided to be discussed. The European Union is no longer giving in to Russian blackmail, it is trying to get supplies from North Africa and the Middle and Near East. Gas is essential for fertilizer production and Europe is over-exposed for this reason.
The price of fertilizers is extremely high compared to NOLA (New Orleans Louisiana), the North American market. And this current price level of fertilizers puts at risk the already high cost of establishing winter crops in the European Union. To cover a threshold of profitability of the wheat crop, you should harvest a minimum of 5-6 tons per hectare. Covering start-up costs, finance costs, variable and fixed costs and rent requires this minimum level of production.
We insert a representative map of how gas prices cause production to decrease or stop in the European Union. Source: ICIS
UN Secretary-General Antonio Guterres is rhetorically calling for sanctions on Russia to be lifted, saying the world needs Russian food and fertilizer. On the other hand, Russia is savagely blackmailing the European Union and it is time for the Union’s determination and unity in action to break this crude form of dependence on Russia. Moreover, the Union can ask: were we present or agreed when these things were discussed in Istanbul? We don’t think so.
Wheat will decline in global consumption and trade. It is a very important parameter in the price equation. First, some destinations are recording much better local productions than initial estimates.
American wheat sales are not brilliant, Russian wheat sales are not even close to estimates. GASC reached a procurement level of 2.8 million tons, compared to 1.6 million tons last season, in the same period.
It is very true that there was no war, but let’s remember that Russia had a crop level that was reduced by the USDA to only 75 million tons (the initial estimate was only 72.5 million tons, the USDA actually cutting 12.5 million tons), from the forecast of 85 million tons.
And today we have exact figures and data. The harvesting in the northern hemisphere is coming to an end. We still have Canada, which definitely shows 35 million tons, versus 21 million tons last year. Russia and Ukraine are also nearing the end of their wheat harvest. And Russia indicates 94 million tons, versus 88 million tons, the USDA estimate.
Trade will decline globally amid protectionist policies in destinations and the fact that local crop levels were somewhat higher.
To all this commercial complex we can add the fact that the price was and is the main reason for the decrease in the level of consumption and trade. When you have the same income and the price skyrockets, what do you do? You eat less and, by implication, you reduce consumption and trade.
All over the Production-Consumption-Trade and Stocks complex comes the hammer of the FED, which has clearly shown us how it corrects inflation by lowering the price. September will arrive without delay, and the question remains clear: will they impact interest rates by 0.5% or will they increase the rate again to 0.75%?
We could witness a price level stabilized at 310 EUR in the EURONEXT indications, but after the disappearance of SEP22 from the daily landscape, an indication that accompanied us from DEC21.

LOCAL STATUS
The price indications generated by the port of Constanța are at the level of 275 EUR/MT. Varna pays EUR 285/MT. The demand is there, but at this price level.
Farmers have unsold stocks, in the constant hope that the price will increase. We hate to say it, but it won’t happen. The peaks of €345-350/MT will not return.
REGIONAL STATUS
MIT JORDAN purchased 120,000 tons of barley at the price of 328 USD/MT, CFR Aqaba:
- Cargill 60,000 tons, delivery January 15-30, 2023;
- Viterra 60,000 tons, delivery February 1-15, 2023.
Summary calculations show us an equivalence of 260 EUR/MT in the CPT Constanța parity, which means that barley will drop by around 15 EUR/MT compared to today’s level. And we have to take into account that the sellers have calculated the storage costs until January-February 2023, the financing costs, the fobbing, the exporter’s margin in the selling price. So we may see a lower level than 260 EUR/MT
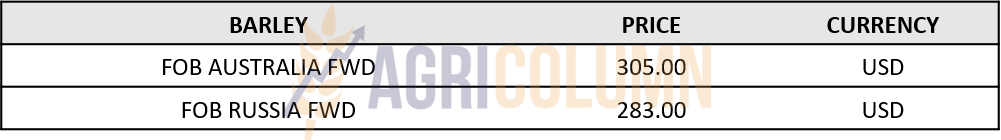
BARLEY PRICE INDICATIONS IN MAIN ORIGINS

LOCAL STATUS
Corn price indications in the port of Constanța are leveling at 295 EUR/MT. As with wheat, the spike was caused by the destructive potential of a potential Russian attack announced by Russian disinformation sources and disseminated by Ukraine. So we saw the price go up to 300 EUR/MT, but only for one day. The rebound was instantaneous to today’s level, ie 295 EUR/MT.
Inland prices are at the level of 256-264 EUR/MT offered by livestock at their own units, in the DAP parity, as well as by traders in the FCA Farm parity. It should be noted that Ukrainian goods are assimilated through indigenization and are put into processing.
CAUSES AND EFFECTS
Unpredictability is what rules the corn market today. The effect of the drought in Romania causes a high price level of corn compared to wheat. The difference of 20 EUR/MT between corn and wheat in the physical market is generated today by the last days of the indication SEP22 WHEAT. After September 1, 2022 we will see both commodities at the same level in the EURONEXT indications, NOV22 corn and DEC22 wheat, which today indicate similar levels. In other words, corn has the potential to outperform wheat in price, but under certain conditions, driven by US volumes.
REGIONAL STATUS
UKRAINE does not experience changes in the forecasted volume to be harvested in the period from last week’s report to today.
The EUROPEAN UNION does not undergo changes in the forecasted volume to be harvested in the period from the previous report until today. But France once again degrades the status of corn. And the percentage of good to very good drops to 47%, compared to 91% a year ago in the same period. French analysis sources talk about figures between 10.5 and max. 12 million tons.
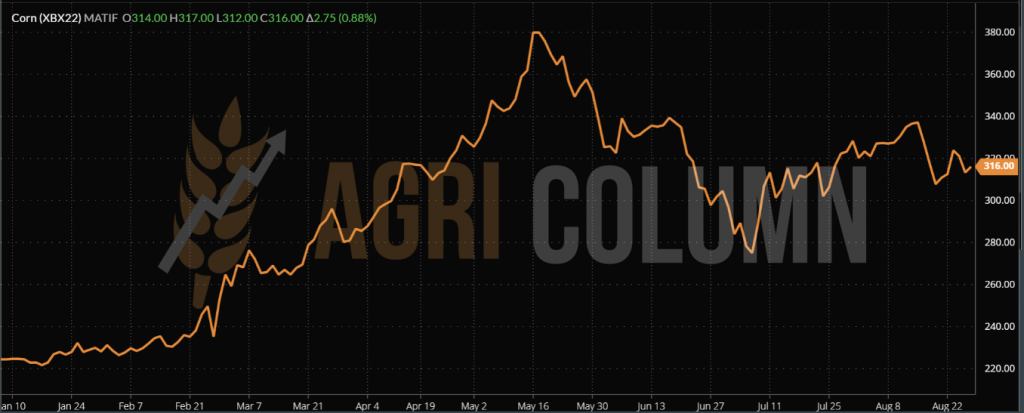
EURONEXT XBX22 NOV22 –316 EUR
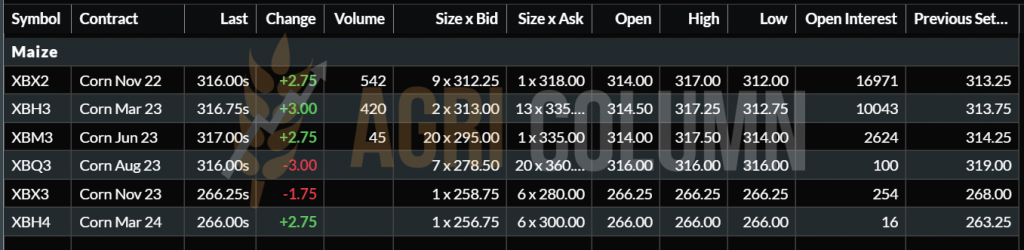
CHART – XBX22 NOV22
GLOBAL STATUS
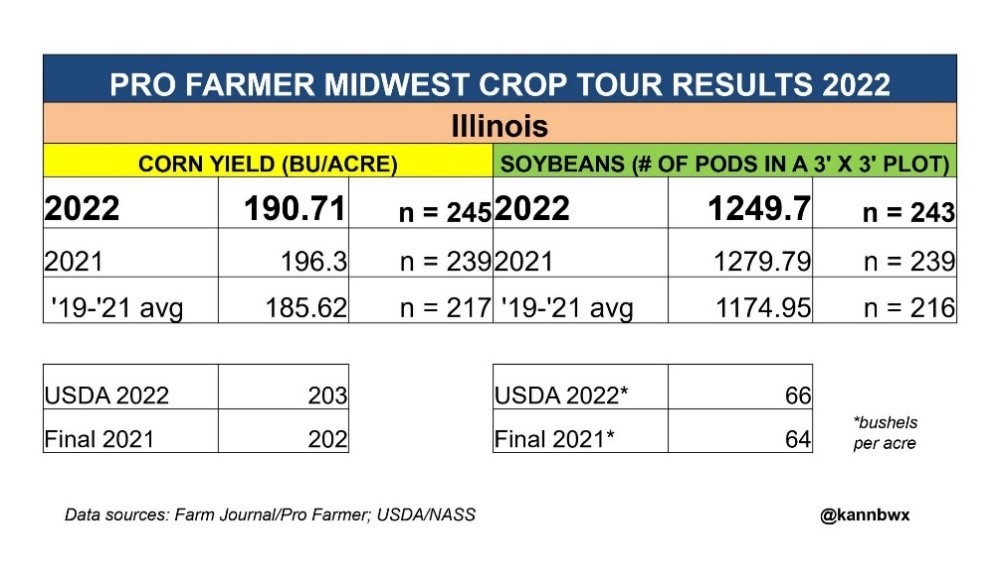
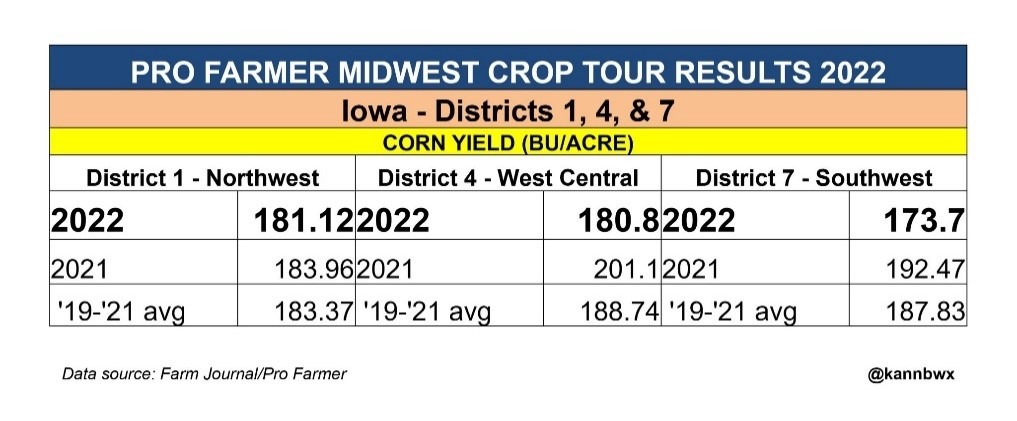
The US raises concerns following the Pro Farmer Crop Tour:
- Production per hectare decreases significantly, from 11 tons/ha to 10.54 tons/ha.
- Calculating the planted area, we have a decrease of at least 16 million tons of US corn, from 365.5 million tons to 349.5 million tons.
- Our estimate was 4% decrease, but it is 4.4%.
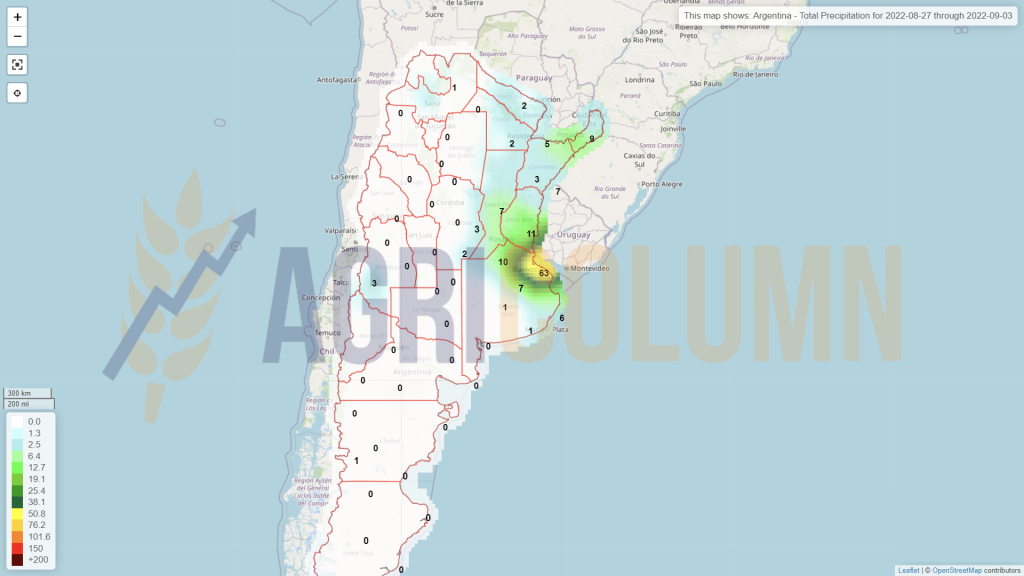
ARGENTINA, through BAGE (Buenos Aires Grain Exchange), indicates the final volume of corn at the level of 52 million tons. It is a smaller volume by 3 million tons compared to last year, but above the average of the last 5 years, of 49 million tons.
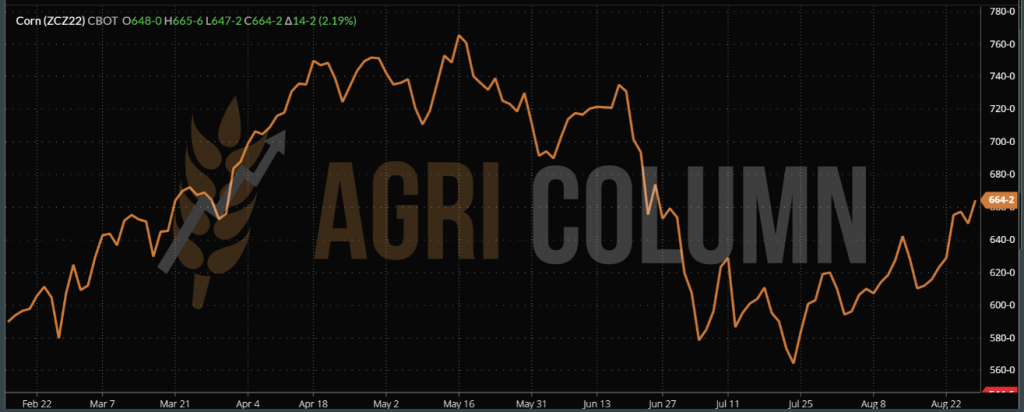
CBOT ZCZ22 DEC22 – 664 c/bu (+14 c = +5.5 USD)
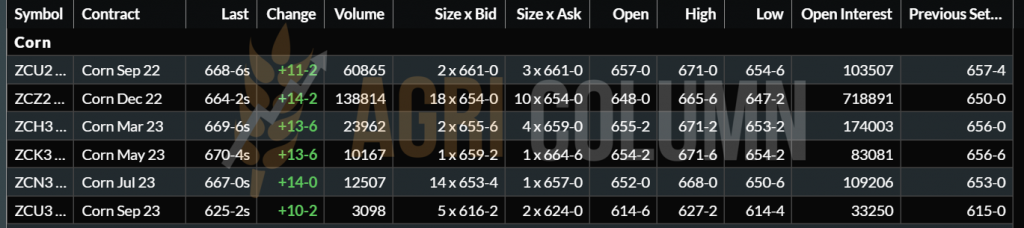
CBOT CORN CHART TREND – ZCZ22 DEC22
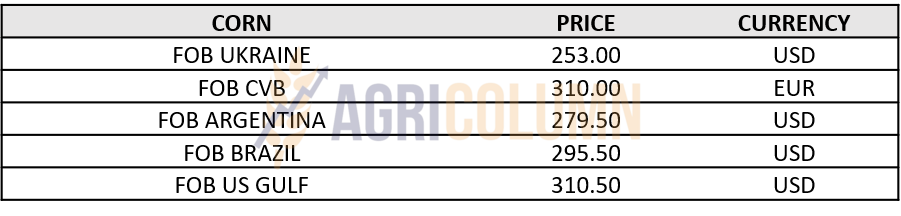
CORN INDICATIONS IN MAIN ORIGINS
CAUSES AND EFFECTS
Corn is governed by two factors today. The first is volume, which will generate price support.
We list here the US, which shows lower production potential. And if we take the numbers estimated by the Pro Farmer Crop Tour, we will see a minus 16 million tons of US corn production. Overall, USDA is not on the same wavelength as Pro Farmer and we will see lower changes in September 12, 2022. We estimate a maximum of 3%, which is only 11 million tons.
The second scenario refers to Ukraine, which is quoted and taken into account at 30 million tons. However, if it generates only 25 million tons as originally estimated, we would again have a lever to support and increase the price.
The European Union suffers in silence. One by one, Romania, Hungary, France, Spain, Poland lowered the flag. And already the European Commission sees the crop at 59 million tons. By the end, they will certainly generate 55.5 million tons. It makes sense to agree with the USDA. They don’t want to spark bullish rallies; they don’t want to wake up the vigilant watchdogs called trading algorithms.
Brazil and Argentina are certain at 116 million tons and 52 million tons of production, respectively, and their data is already taken into account. A potential balance could be brought about by the change in feed behavior from corn to feed wheat. Comparing the two raw materials, we will clearly see the advantage of feed wheat, from the price point of view.
We argued in May 2022 that corn will be the star again, and then we linked the potential effects in the US to those in Romania and the European Union. The forecasts of heat generated in the winter for the summer of 2022 have come true. The heat and drought were extreme and the yields extremely poor.
In conclusion, we will have the price of corn at least equal to that of wheat. But we must not take the wheat price plan out of context, which is a static one and will remain here on the plateau until the date of the USDA report, September 12, 2022.

LOCAL STATUS
The price indications generated by the exporters are added to the NOV22 indication minus a Premium depending of each party’s interest. This Premium varies between 10 and 20 EUR/MT. From the processors’ side, the indications are, as we mentioned in previous issues, generated by storage until November 2022.
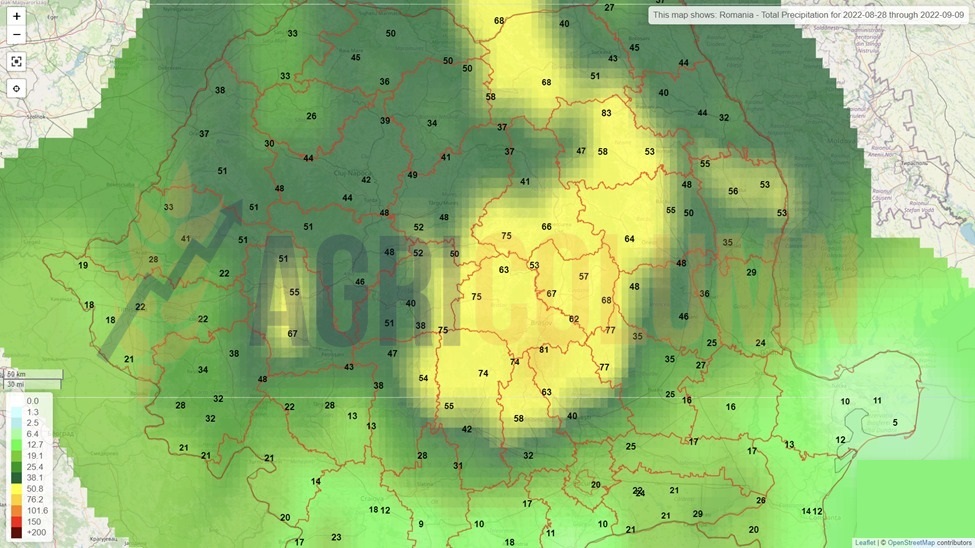
In the autumn sowing plan, we record their start and the emergence of Romanian rapeseed. The rains contributed to the emergence, which made it possible for the seeds to germinate. From this point of view, things are on a favorable track. The rains that will arrive by September 8, 2022 will be beneficial, in turn, for the 2023 rapeseed crop.
CAUSES AND EFFECTS
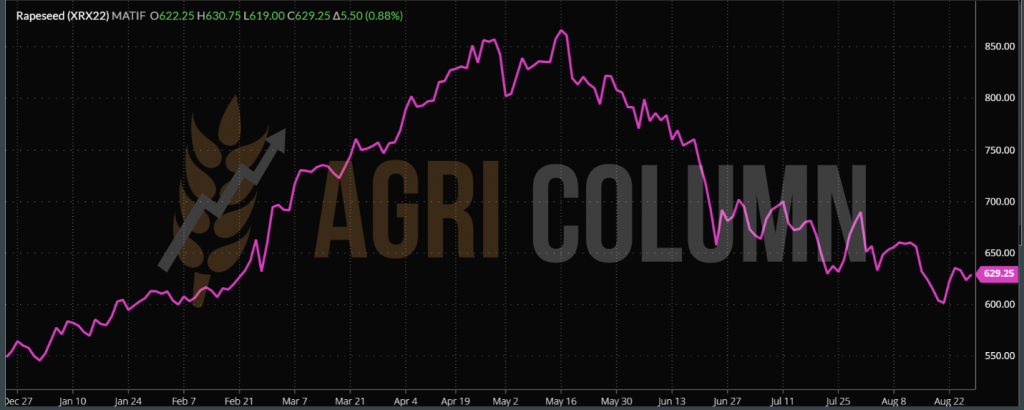
Rapeseed can no longer find its breath. It is effectively stuck at a level that amounts to a maximum of 620-625 EUR/MT in the indication of NOV22. But we can see the demand that will arrive at the end of October and that will give a small boost to rapeseed. Locally, many farmers have stocks of rapeseed that will be sold in NOV22-FEB23, but not at the price levels we had last year in March-April. Then, in addition to the liquidity deficit of the raw material generated by Canada, we also had the panic generated by the war in Ukraine. In other words, expectations must be adjusted accordingly. Astronomical prices are history.
REGIONAL STATUS
The EUROPEAN UNION comes back with a higher estimate of the rapeseed crop, up to the level of 18.8 million tons, due to higher productions in Germany and in countries such as Poland, which were less exposed to extreme soil drought.
UKRAINE remains at 2.8 million tons, and this production will go to export, without internal processing.
RUSSIA is unchanged, registering 3.8 million tons of rapeseed this season. We remind you that the USDA raised rapeseed production in Russia by 1 million tons.
EURONEXT XRX22 NOV22 – 629.25 EUR (+5.5 EUR)
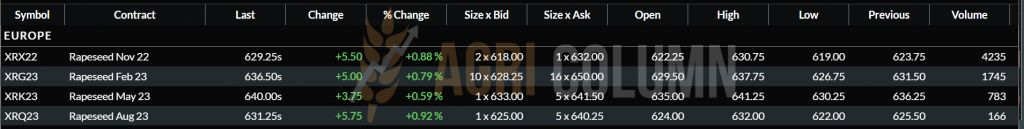
CHART – XRX22 NOV22
GLOBAL STATUS
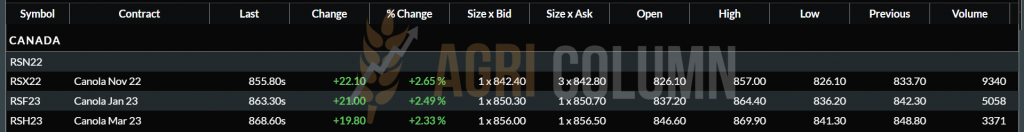
In CANADA, canola production is estimated at 19.4 million tons: Saskatchewan 9.6 million tons; Alberta 5.6 million tons; Manitoba 3 million tons. The difference comes from other regions. This update raises production by 1 million tons, thanks to a better forecast of production per hectare. The total cultivated area is 8.7 million hectares, but about 100,000 ha are compromised. However, production per hectare was raised from 2.14 tons to 2.26 tons.
AUSTRALIA remains unchanged in the forecast for now (6.1 million tons).
CHINA produced 14.7 million tons, in line with previous years, but now they are off-season. Sowing will begin in October. We mention China, although it is not an origin, because a possible deficit here could have pivoted to a more consistent demand.
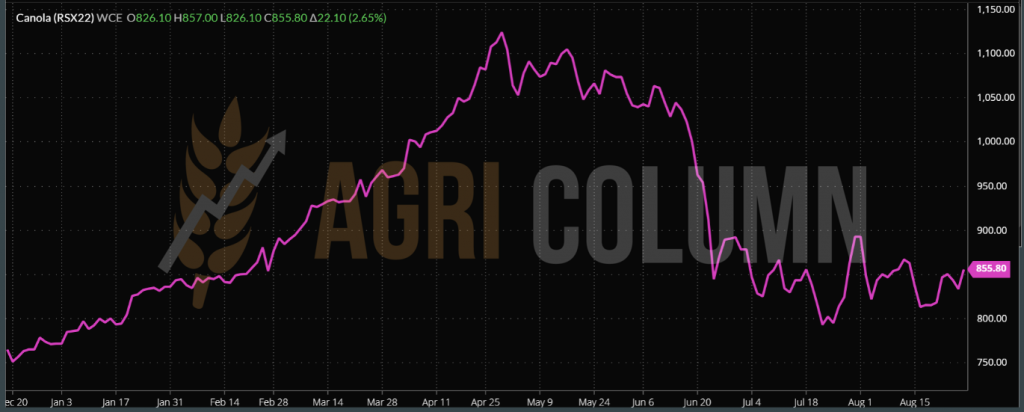
ICE CANOLA RSX22 NOV22 – 855.8 CAD (+22.1 CAD)
CANOLA TREND CHART – RSX22 NOV22
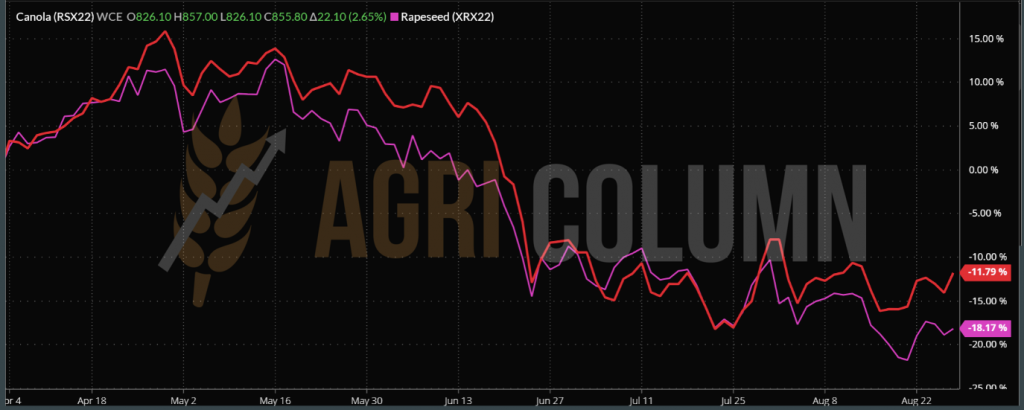
COMPARATIVE GRAPH – RAPESEED VS. CANOLA
CAUSES AND EFFECTS
Rapeseed received unexpected support from soybeans, which are rising on the CBOT as Brent oil prices hit 99 USD/barrel. Support also comes from the price of palm oil, which remains at 4200 MYR (Malaysian Ringgit).
But this support is extremely fragile. We see how the European Union is starting to import soybean oil to generate a substitute for rapeseed oil in biodiesel production. And this could weaken the price of rapeseed in the future. Of course, the replacement level is not 100%, i.e. 1:1, which means you need more soybean oil to replace, say, 1 ton of rapeseed oil. But it is quite an important signal for the price of rapeseed, which has its main use in the biodiesel component.
The coming months could bring a boost to rapeseed, but if the FED impacts the commodity market again, we could witness a wholesale decrease in the prices of all commodities, including canola.

LOCAL STATUS
The prices of sunflower seeds differ according to the buyers, and they are divided into three categories: Processors, Exporters and Intermediaries. The latter category plays, as usual, on the basis of further speculation that they will want to exploit. Processors are beginning to understand the lack of volume in Romania and are projecting indications of 610-620 USD/MT, trying to dose the financial effort in terms of the level they pay. Exporters have raised the bar with the logistics spread and we can see levels between 630-635 USD/MT for delivery in CPT Constanța parity.
Harvesting of sunflower seeds has started and indications have started to increase, as awareness of volume and quality has increased. The test weight is not compliant, it is even weak, if we can say so, and we have areas where it is at the level of 35-36 kg/hl, but also areas with 40 kg/hl. The oil content started to rise slightly. From an initial 40-41% to first cuts, today we can say that we have 43% oil content, on average.
Farmers started selling the goods. We can say that the existing bottleneck no longer exists, and processors buy according to the crop. This is a sign that the trade flow is working.
In terms of trade to processing, however, we have one parameter that clearly influences things. We are referring to the Ukrainian goods, which act as a brake on the Romanian trade in sunflower seeds. Once again, old Ukrainian goods, production 2021, circulated through the processing units on the territory of Romania. Again, at discounted prices to the Romanian commodity of 2022. Trading levels are between 575-585 USD/MT, which makes the difference quite substantial, between 45-55 USD/MT.
We raise the same question marks in terms of quality. It is possible that the storage of the commodity in conditions unknown to us has altered the quality, the level of FFA (acidity) has increased, and the resulting oil is no longer of standard quality for human consumption. Of course, mixtures can be made, the so-called blends, but these are palliative, brought to the service of an average purchase price, the so-called COGS (cost of goods).
We repeat: these are only natural and normal questions, because this parameter called the quality of Ukrainian goods does not comply. The examples are countless, starting with corn that comes loaded with mycotoxins, with a high degree of aflatoxin, cracking above the standard and dusty. European traders have repeated complaints and see Ukrainian goods as an endless source of problems. Many of them are finally beginning to understand why this commodity is cheap. As a firm response from outside the EU bloc, Turkey reintroduces from September 1, 2022 the obligation of the sanitary-veterinary certificate.
Estimates of Ukrainian goods that crossed into Romania for processing or intra-community trade exceed the level of 350,000 tons, in the period April-August 2022. And again, we raise questions about the competitiveness of Romanian goods. We understand free trade, but it must be conducted according to the correct rules.
The fact that Ukrainian seeds cross into Romania and are then sold as intra-Community crude oil is not fair trade. Many domestic processing units are subsidiaries of corporations with global or regional interests, so processing in Romania and then shipping them to the EU. Last week ‘s port line-up clearly reflects the shipment of 25,000 tons of crude oil last week, or, in other words, about 25,000,000 1L bottles of oil.
It is, in a way, an unfair competition addressed to Romanian farmers. They have much higher start-up costs than farmers in Ukraine, and this barrier is lifted for them by being restricted to a fair market. Instead, Romanian farmers are effectively cut off from a market determined by supply and demand, through the unfair competition caused by the processing of Ukrainian goods on Romanian territory.
We understand that we are in a global market driven by the financial interests of commercial giants, but the protection of farmers does not exist, especially this year. It is, if you like, total chaos. Chaos in trade, chaos in logistics and in the port of Constanța, not to mention the border crossings.
REGIONAL STATUS
UKRAINE. The sunflower seed crop is likely to be reduced to no more than 10.7 million tons in 2022, from 16.6 million tons in 2021. The decrease will cause a decrease in sunflower oil production to 3.5 million tons in the most pessimistic scenario for 2022/23, from 4.97 million tons expected in the 2021/22 season. In an “optimistic” scenario, a production of 5 million tons is foreseen. Sunflower oil exports also depend on logistics and production and can vary between 3.1-4.69 million tons.
RUSSIA. The Ministry of Agriculture has reduced the expected export tax on sunflower oil from September 1 to 85% below the August level, which coincides with the start of the new 2022/23 season, according to the ministry’s official website. The ministry set a charge on sunflower oil exports in September of 8,621.3 RUB/MT, equivalent to 143.4 USD/MT, nearly double the August level. The September charge is based on an indicative price of 1,583.0 USD/MT, down 250.3 USD/MT from the August level, the ministry said.
FRANCE predicts a minimum 20% drop in sunflower seed production. This will reach, according to this forecast, the level of 750,000 tons.
SPAIN will increase its purchases of sunflower oil by more than 40% in the 2022/23 season, despite an increase in the area planted with sunflowers, as drought led to the loss of part of the crop, market sources said.
Spain-based market sources expect an increase in sunflower oil imports of between 530,000 and 700,000 tons, while Spain’s average sunflower oil imports in recent seasons have been between 330,000 and 500,000 tons, according to European Commission figures. The annual domestic consumption of sunflower oil in Spain is about 1 million tons, while the domestic production of sunflower oil varies between 300,000 and 400,000 tons, depending on the crop. According to market sources, more than 60% of the sunflower oil imported into Spain is of Ukrainian origin.
Russia’s military intervention in Ukraine has led to the disruption of sunflower oil supply chains for buyers and non-payment, forcing Spanish buyers to seek alternative suppliers. “They have created supply chains for both seeds and oil through Romania and export from there, in some cases very cheaply”.
Spain expects a significant amount of sunflower oil to come from Romania and Bulgaria, “although the real origin will be Ukraine.”
ARGENTINA has reached the level of 15% of the total area sown with sunflowers.
CAUSES AND EFFECTS
Today, Romania is furrowed by contrary flows of goods. On the one hand, we have Ukrainian goods that enter Romania for processing without any tariff or sanitary-veterinary barriers, and on the other hand, commercial companies sell Romanian goods in Bulgaria. There are two segments that operate separately and create a lot of confusion in the market. Ukrainian goods entering processing severely distort farmers’ incomes through discounts from origin to processing, under questionable food safety conditions, without obvious traceability and accountability.
Clearly and unequivocally, financial interests come first and the processing of Ukrainian goods is carried out on the territory of Romania. The evidence resides in the behavior of some processors who do not display any price competitiveness for Romanian goods.
If this process that we anticipated in the previous numbers is carried out, given that the energy resources are consumed from Romania, we wonder what use is the financial grant granted by the Romanian state, given that it does not in any way reach where it is intended, i.e. for the Romanian farmer and consumer? The goods actually leave for intra-Community destinations.
Obviously, the effect is particularly penalizing for Romanian farmers, who will bear the cost of the “highway” of Ukrainian goods already created through Romania. The problem is that Ukrainian farmers are being harmed in turn. They have absolutely no fault. Their country’s trade systems are built to leave them no choice. They cannot control logistics, prices and have absolutely no power to oppose. The effects in Romanian agriculture will be seen sooner than we think. Farms will go bankrupt; an already fragile national ecosystem will be severely disrupted. Everything is done in the name of profit, but does anyone think about Romania’s food security in the future? Ukrainian trade networks are slowly but surely shaping the Romanian ecosystem and we do not see any action to safeguard Romania’s interests.
A drop in oil prices is already in sight. Turkey is buying 75 USD/MT lower than yesterday. Naturally, Turkey is the main beneficiary of the green corridor.
Conclusion: The reduction in the Russian tax will allow Russian oil to make its way to the traditional destinations that belonged to Ukraine until a year ago. And we list India as the first beneficiary. But Russian oil will not be sought in Europe. The Union wants predictability, and this cannot come from Russia, but neither from Ukraine. That is precisely why the direction generated by Brussels is clear: process Ukrainian goods in Romania and then ship them to the EU.
CSFO AND OILSEEDS INDICATIONS IN MAIN ORIGINS
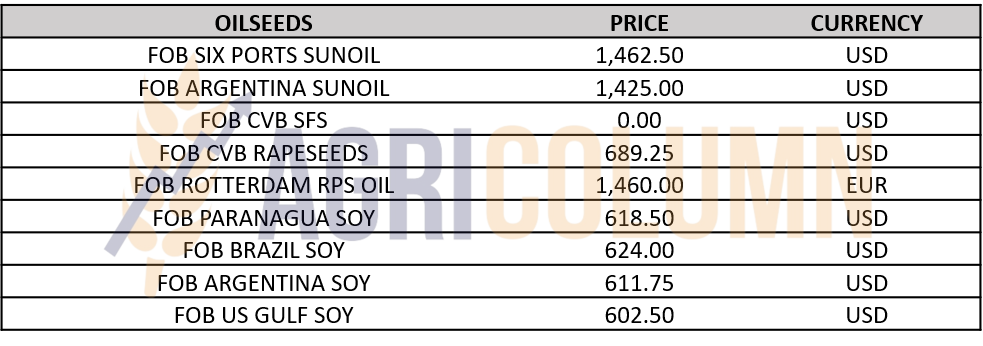

LOCAL STATUS
Indications from the main local soybean processor boil down to 600 USD/MT. If we also take into account the value of the coupled support, we get a level of 670-680 USD/MT.
REGIONAL + GLOBAL STATUS
The USA, through the Crop Farmer Tour, indicates a marginal decrease in productivity of 0.013 tons/ha. It is about the decrease in yield from 5.9 bu/acre to 5.7 bu/acre. This marginal drop brings the US soybean crop forecast to 123.42 million tons.
On the sales side, the USDA said last Monday that weekly soybean export inspections totaled 686,583 tons in the week ended Aug. 18, in line with market forecasts. The agency raised its estimate of soybean inspections from the previous week to 768,328 tons from 744,571 tons.
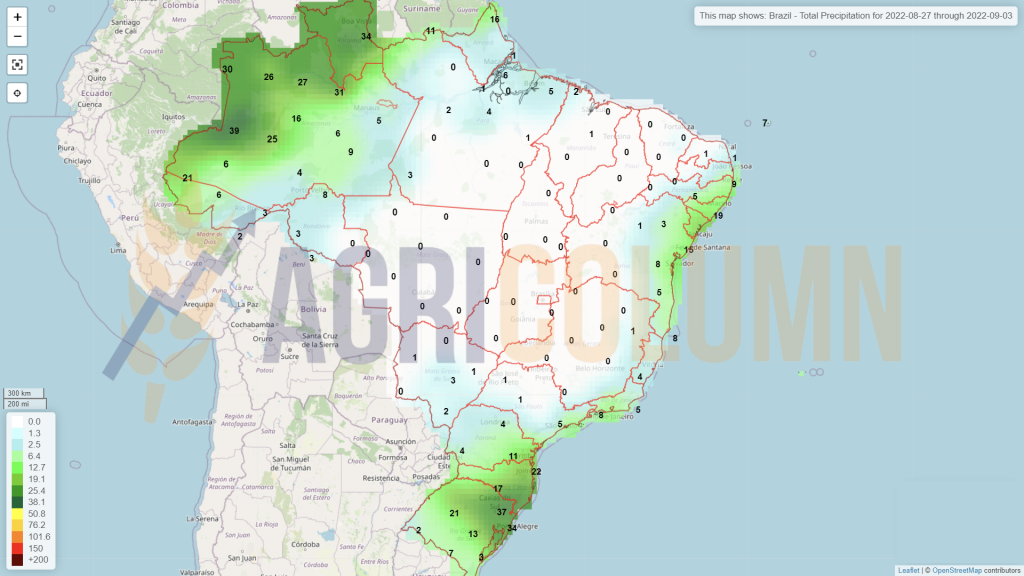
BRAZIL. In its first forecast for the next crop, CONAB said on Wednesday that the soybean harvest volume will increase by 21%, reaching a record level of 150.36 million tons. Aside from a projected 3.54 percent area expansion to 42.4 million hectares (104.772 million acres), CONAB said soybean yields are likely to rebound after drought damaged some of the old crop. An increase in soybean production in Brazil will boost exports to an estimated 92 million tons, up 22.2% from the 2021/2022 crop.
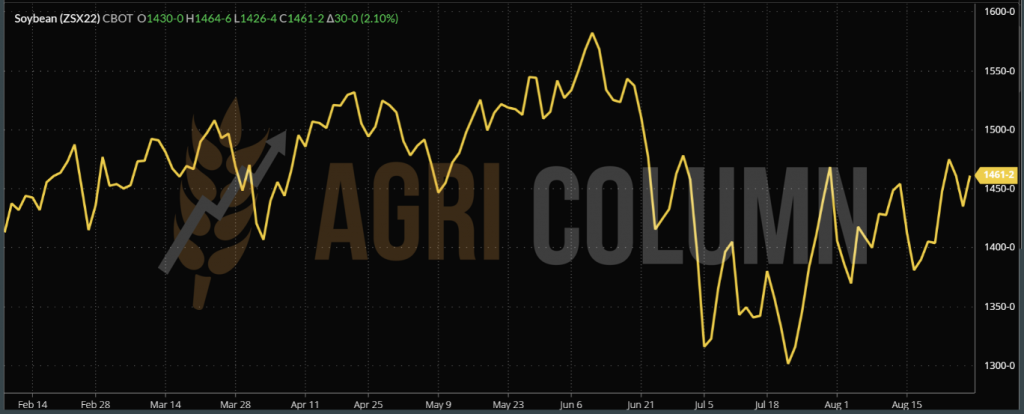
CBOT ZSX22 NOV22 – 1,461 c/bu (+30 c = +11 USD)
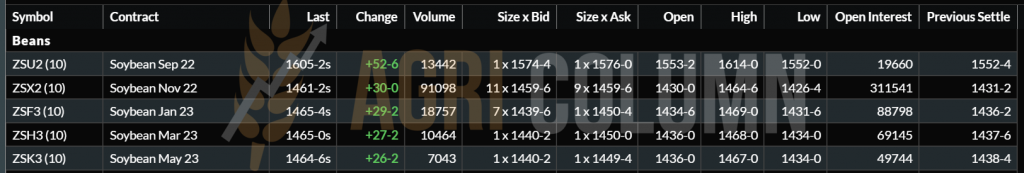
CHART – ZSX22 NOV22
CONCLUSIONS
Results from the Pro Farmer Crop Tour lift soybeans on the CBOT. However, there is a lot of technicalities, due to the SEP22 position being liquidated, and the funds performing the roll-over operation, i.e. moving to NOV22.
The Brazilian crop is estimated at more than 150 million tons and is a serious opponent for the US, due to China which has decreased the import level from 100 to 91 million tons. The competition will be extremely serious between the origins, fueled by Brazil’s favorable logistics. But there is still a long way to harvest. For now, Brazil was exporting very large volumes compared to the US.


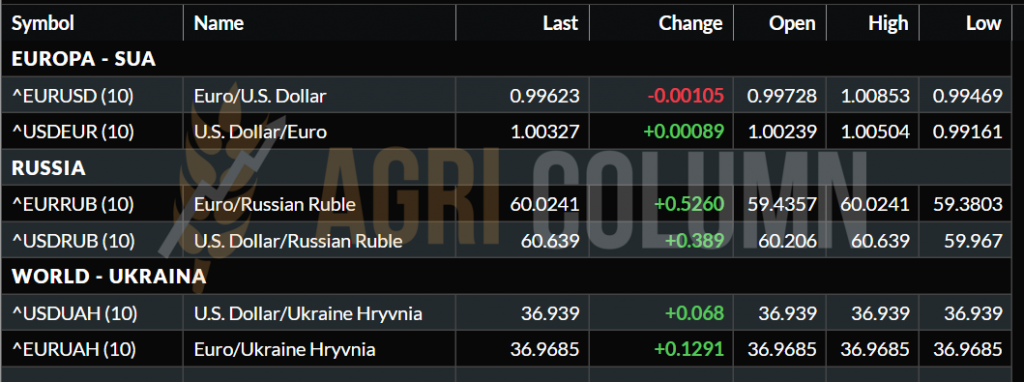
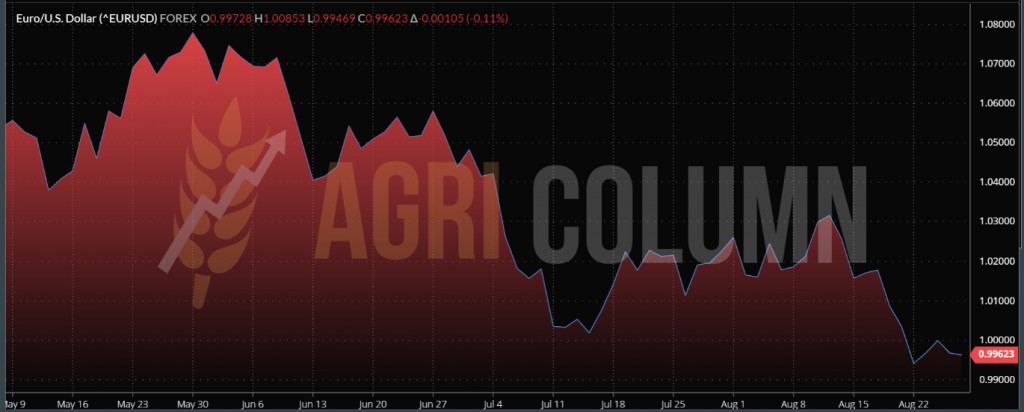
EUR/USD = 0.996EUR:1USD

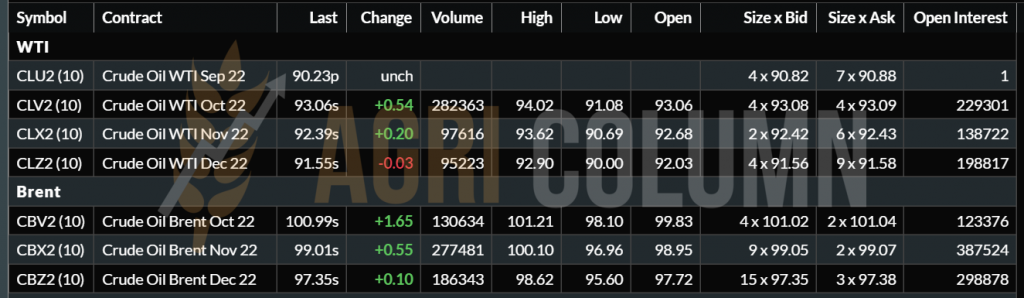
WTI OCT 93 USD | BRENT OCT 100.99 USD

August 27 – September 3, 2022
Romania
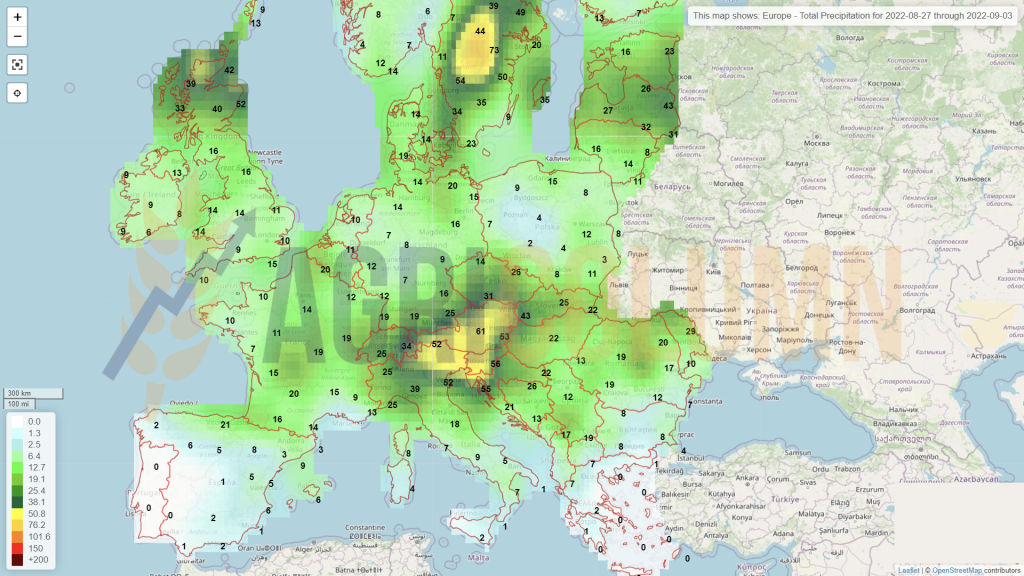
Europe
Ukraine
Russia
Canada
USA
Brazil
Argentina
China
Australia