Romanian Agri Trade Summit, one of the largest events addressed to International Agribusiness, will take place on February 22, 2023 in Bucharest.
The initiative aims to reconfirm Romania’s strategic role in global agribusiness and to bring together the most important players in the dynamic grain market – top Farmers, Traders, Processors and Distributors.

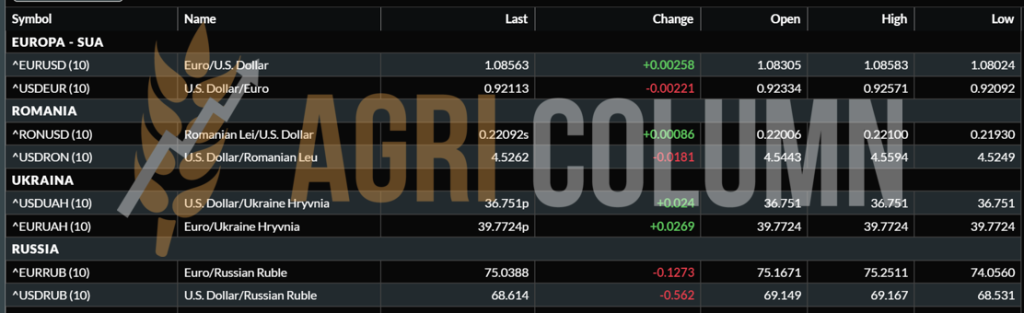
This week’s market report provides information on:

LOCAL STATUS
The indications of the Port of Constanța continue to decrease. The level of 275-278 EUR/MT, with a discount of at least 20 EUR/MT for the lower quality, feed, is the one that arbitrates at these moments.
New crop quotations remain at the same parameters, i.e., a level of 242-245 EUR/MT.
CAUSES AND EFFECTS
Farmers are finally beginning to understand that the wait has been extended too long and time is running out. Deadlines are pressing and liquidity is clearly needed to cover debts and prepare for the spring campaign. Wheat is starting to be sold and this can be seen in the activity of the port of Constanța. We observe congestion at unloading and long queues outside the port perimeter. The overlap with the Ukrainian flows is clearly visible again. This moment has been anticipated and gives rise to speculative price pressure.
The regional coordinates are ruthless, the regional market pushes to the fundamentals. We have no reasons and we do not see in the immediate period the change of the initial foundations, which we have been mentioning for a long time.
REGIONAL STATUS
RUSSIA continues to sell, but January will not bring a large volume of shipments from Russian ports. Estimates lead to a volume of 3.6 million tons.
UKRAINE is currently floating on a wave of uncertainties. Their estimates of the new crop are clouded by lack of information and their veracity. In all cases, however, the calculations lead and gravitate around the values of 4-4.2 million hectares sown in the fall of 2022.
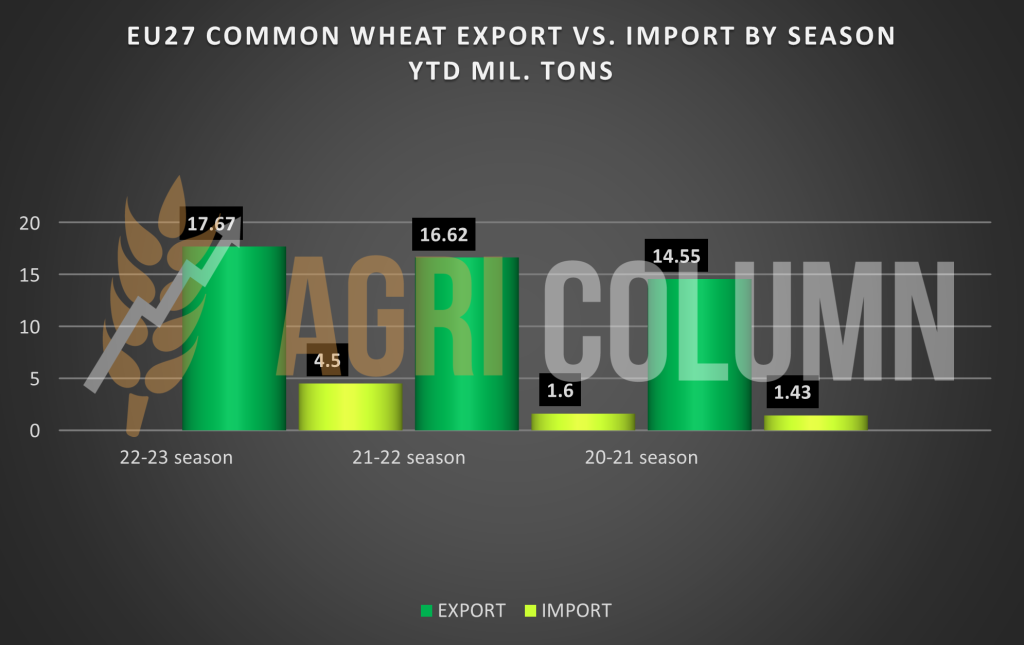
The EUROPEAN UNION remains on the same level. Export, but also import. The level of exports reached the threshold of 17.6 million tons of wheat, which is clearly above the levels of 2021 and 2020.
Regarding wheat imports, the differences between the two previous seasons and the current one are clearly visible. Ukrainian wheat is the main source of the difference between previous import levels and those of the current season.

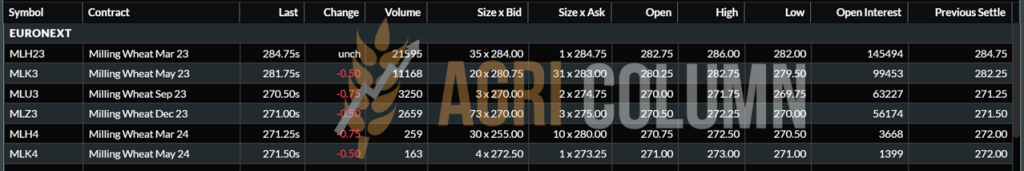
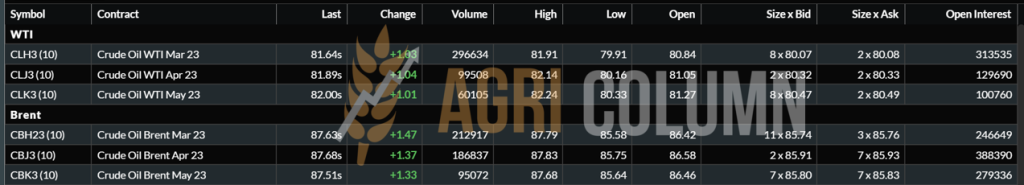
EURONEXT – MLH23 MAR23 – 288.75 EUR
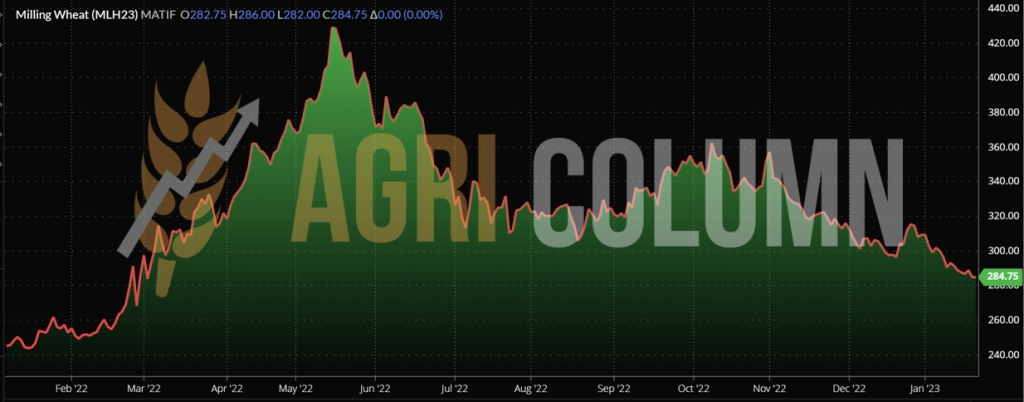
EURONEXT WHEAT TREND CHART – MLH23 MAR23
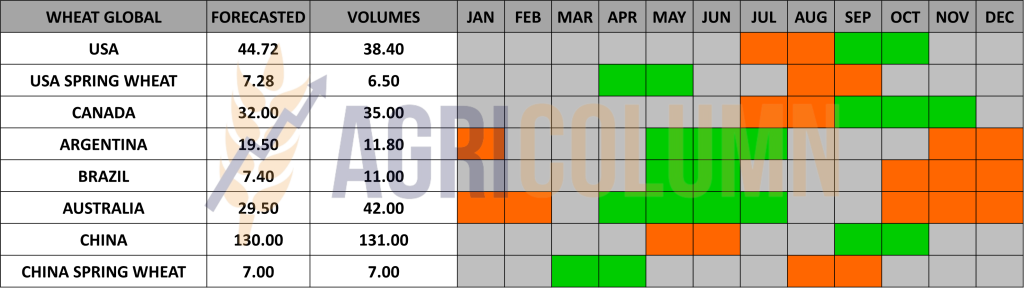
GLOBAL STATUS
The USA is in the same position for the fall seeded wheat crop – mixed conditions and essentially no change from last week.
ARGENTINA is out of season.
AUSTRALIA is out of season.
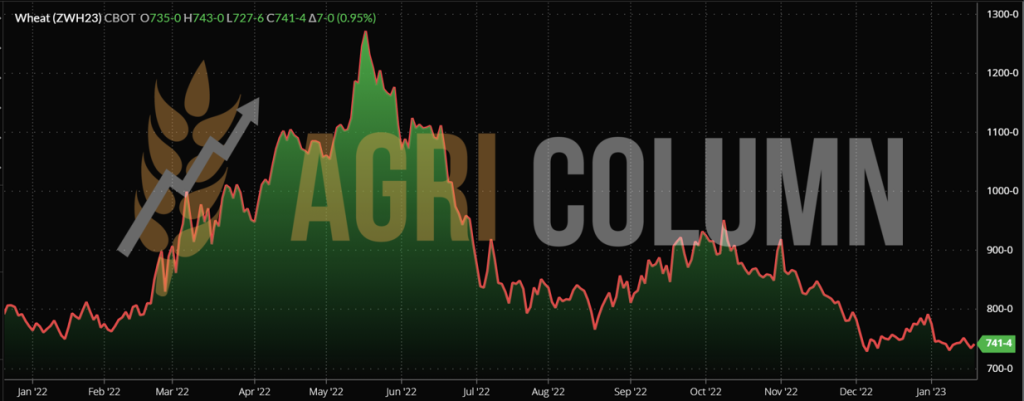
CBOT WHEAT – ZWH23 MAR23 – 741 c/bu
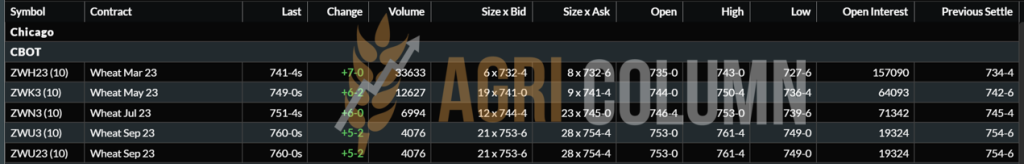
CBOT WHEAT TREND CHART – ZWH23 MAR23
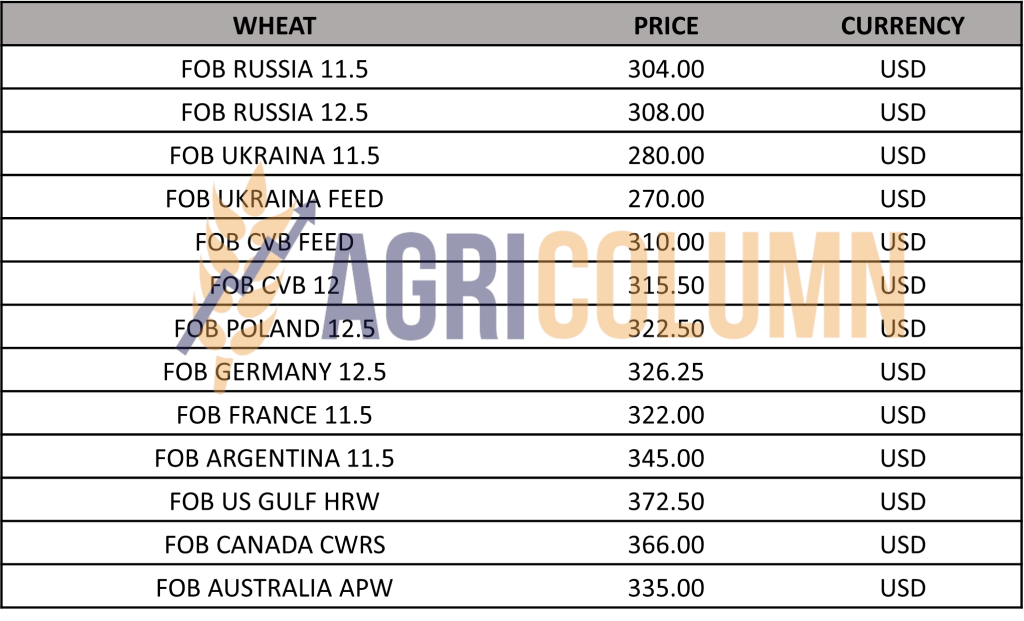
WHEAT PRICE INDICATIONS IN MAIN ORIGINS
TENDERS AND TRANSACTIONS
OAIC ALGERIA. All information points to a purchase of around 600,000 tons at an average price of 334.5 USD/MT, CFR.
Sellers: Viterra 180,000 tons | Olam 120,000 tons | CAM Negoce 60,000 tons | ADM 60,000 tons | Ameropa 60,000 tons | Lecureur 60,000 tons | Sierentz 30,000 tons
ADM and Ameropa sold wheat originating in Romania. The rest originated in France, Ukraine, or Russia.
- The Romanian offers were at the level of 317-318 USD/MT, FOB Constanța.
- Russian offers were at 308-310 USD/MT, FOB NOVO.
- French offers ranged from 320-323 USD/MT FOB.
CAUSES AND EFFECTS
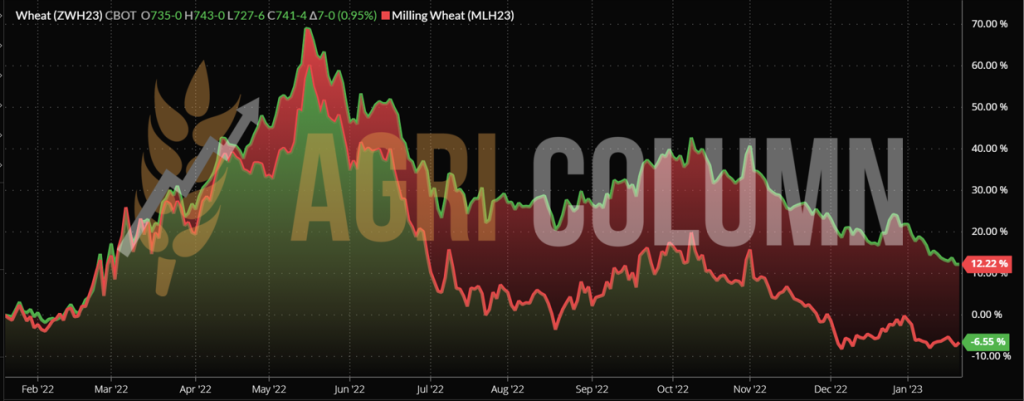
We begin causes and effects with a highly suggestive graphic. The green area with red marker represents the path of American wheat, while the red area with green marker indicates the path of European wheat.
- The components are the beginning of the conflict and the present moment.
- The first conclusion we draw is natural, namely the lack of competitiveness of American wheat. Then the moment of decoupling in price %.
- We then follow the balanced downtrend simultaneously.
And we see something else, US wheat is trading below the level of the beginning of the conflict, while European wheat remained above the level of February 22, 2022.
And now, back to causes and effects:
RUSSIA. Wheat stocks will rise to a record 16.2 million tons in Russia in the 2022/23 marketing year. Another 2.9 million tons are kept in the intervention fund. Record stocks could put pressure on the domestic market in the second half of the first quarter of 2023.
Putin’s statement: Russia must keep its food reserves in the country and must not export everything. The statement claims as the headline the price of wheat. The CBOT rose 3.2 USD.
Fundamentally speaking, what wheat stocks Russia has today and what export level it has up to this date, the statement is just a Headline.
“Much Noise About Nothing” or “As You Like It” by William Shakespeare in the interpretation of Vladimir Vladimirovich Putin, who also had to say something.
The wheat export duty was cut to 62.37 USD/MT and the seven-day average index was flat at 309.5 USD/MT, according to the Moscow Exchange (MOEX).
The path of the price of wheat remains unperturbed. There is no support at the moment and the existing stocks are effectively weights in a coherent development potential. With resources in stocks, with unsold goods, one by one, Russia and Romania must get rid of the goods of 2022, because otherwise they are already putting very big obstacles to the new crop.
And the new crop looks good in the European Union and Russia. Ukraine is clearly still in the fog. But even with a crop of only 16 million tons, compared to 21 million tons this season, the balance is not broken. Why? Because the Union will generate a surplus of at least 4 million tons, because stocks in Russia cover the shortfall in Ukraine, and because Australia has a lot of work, namely, to sell the harvested wheat, 42 million tons, from 36.6 initial estimate.
And the crop inverse between MAR23 and SEP23 (NEW CROP) stands at a healthy minus 15 EUR. which indicates confidence in the new wheat crop in the Northern Hemisphere, European and Caucasian areas.
Today ‘s compared BASIS indicates minus 6 EUR for OLD CROP and minus 30 EUR for NEW CROP. And this should be an important indicator for anyone.

LOCAL STATUS
The price indications of feed barley in the CPT Constanța parity are at the level of 242-245 EUR/MT.
BARLEY PRICE INDICATIONS IN MAIN ORIGINS

GLOBAL STATUS
CAUSES AND EFFECTS
No news on the barley market at national or regional level. Next, the premises for a decrease in the price level are in place. Will we have barley under 200 EUR/MT? Everything is possible.

LOCAL STATUS
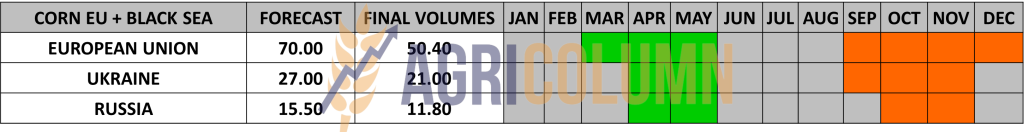
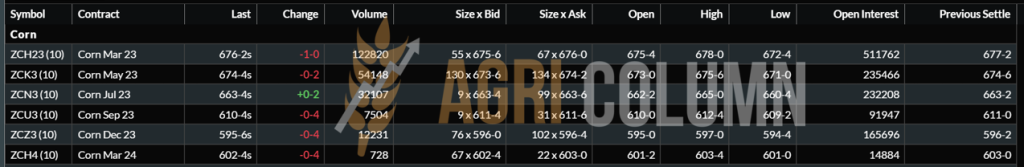
Corn indications in the port of Constanța are at the level of 265-270 EUR/MT. Some buyers have taken a small step back and are waiting.
CAUSES AND EFFECTS
The corn sits and waits. We are in a technical moment generated by possible improvements in South American conditions. But for everyone it is too early to be able to pronounce. That’s why we’re seeing this corn respite moment. But let’s not forget that wheat also moves the corn market up or down. Replacement with feed wheat is an extremely important parameter and factor.
In other words, don’t overextend the selling decision.
REGIONAL STATUS
UKRAINE shows no change between last week and today.
RUSSIA, on the other hand, admits that it has not reached the estimated crop level, namely 15.2 million tons. It stopped at 11.8 million tons. The volume of Russian exports, which was quoted at 3 million tons, will be affected.
The corn export duty was cut to 12.91 USD/MT, while the core index rose to 221.9 USD/MT. The calculation of the corn index currently takes into account transactions recorded on the basis of loading from the ports of the Caspian Sea, as well as from the ports of Azov and the Black Sea.
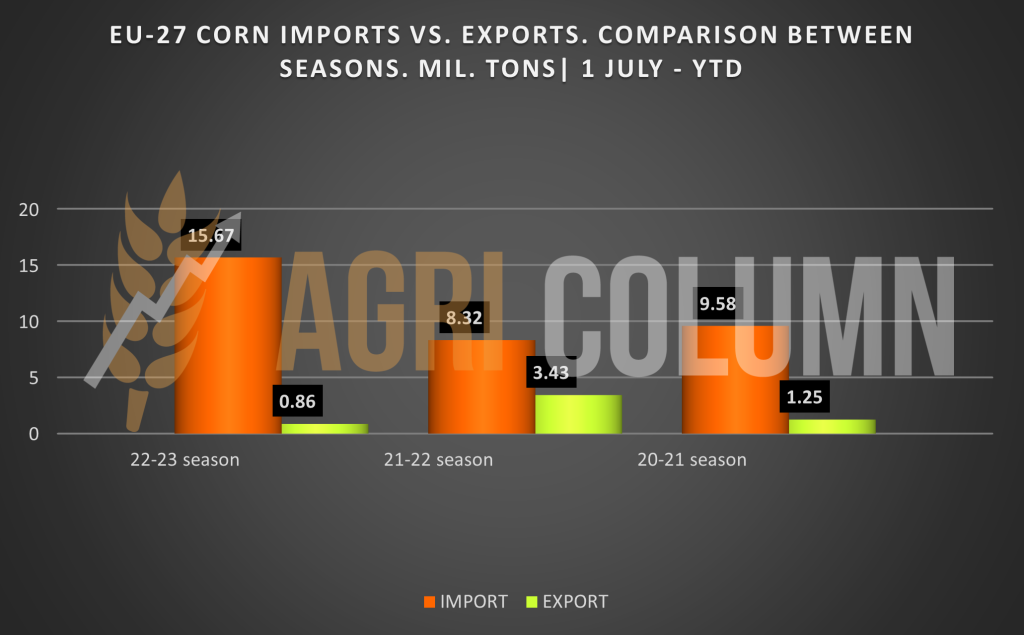
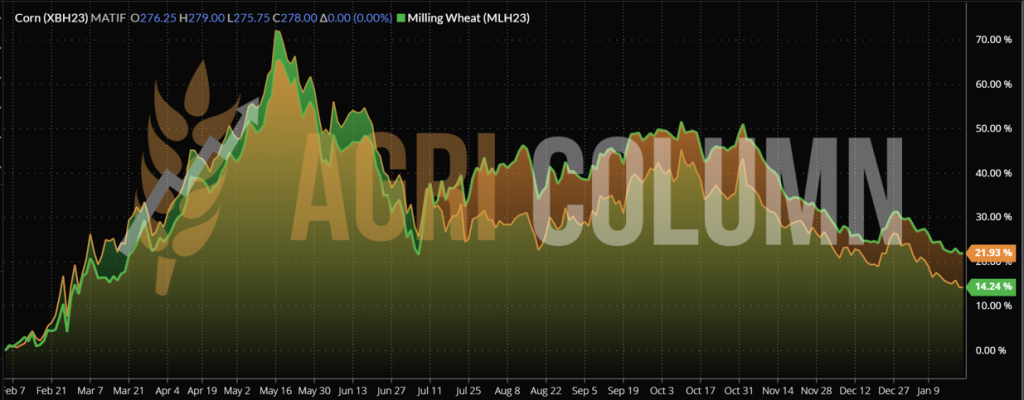
EUROPEAN UNION reached the level of 15.6 million tons in terms of corn imports. We insert a graph to be able to compare previous years (previous seasons). We consider, as always, the beginning of the season, that is, July 1, 2022, and today.
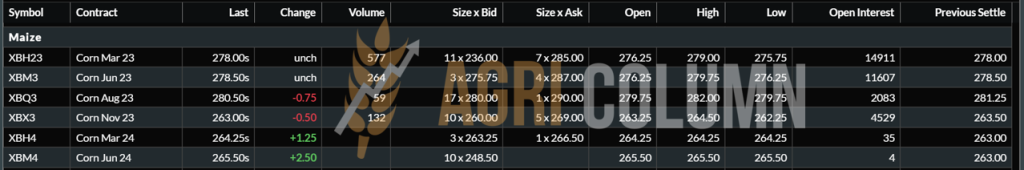
EURONEXT CORN – XBH23 MAR23 –278 EUR
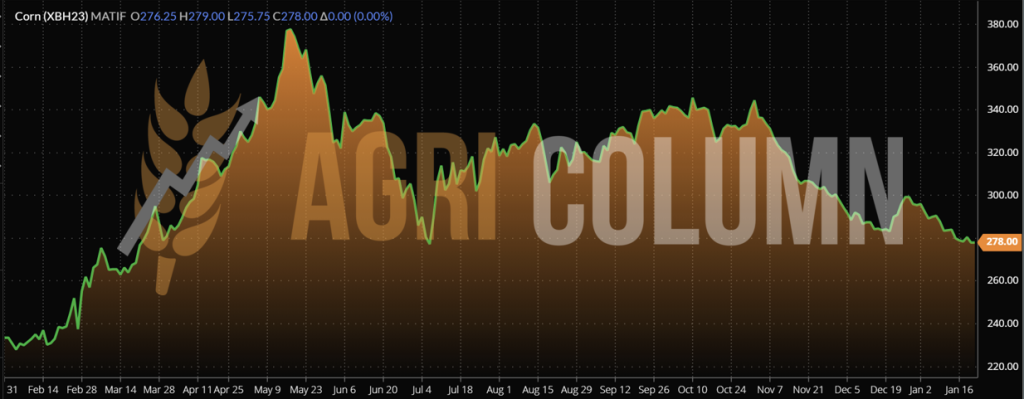
EURONEXT CORN TREND CHART – XBH23 MAR23
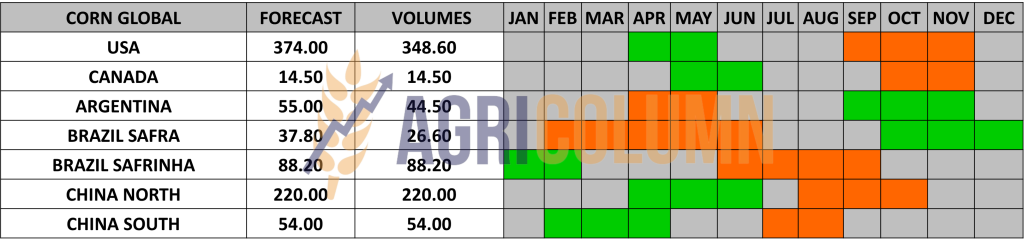
GLOBAL STATUS
ARGENTINA (through BAGE) admits 44.5 million tons of corn crop. It is close to what I wrote in the last issue, namely that the consolidation will take place at 42-43 million tons. There is still time.
Argentina also reduced the area cultivated with corn, from 7.3 million to 7.1 million ha. Vegetative state: Sown 90% | G/E 5% | G 48% | P 47%
- G/E = good to excellent
- G = good
- P = poor
BRAZIL. As January advances and rains delay soybean harvests in major producing states such as Mato Grosso, Brazilian producers are beginning to worry about the potential impact prolonged rainfall will have on the planting of Safrinha, the second corn crop.
Brazil’s second corn crop is planted immediately after the soybean harvest, usually in January and February, and has grown larger than the first corn crop.
The main factor limiting the progress of sowing is the delay in soybean harvesting, caused by the high volume of rain, Imea stated in its latest report.
According to soybean analyst Eduardo Vanin of Agrinvest in Brazil, farmers are becoming worried about excessive rains in the state as the start of the soybean harvest is 7 days late.
Not a big problem so far, but weather models are showing a lot of rain through January 23rd, which will be a problem for corn.
Prolonged rainfall could cause maize production to suffer for the second crop of maize planted after February 20.
In the next 30 days, about 200 to 300 mm of rain is expected in most regions of the state, which could further complicate field work, Imea added, citing data from weather consultancy TempoCampo.
US is at the point where it could lose the world’s top spot in corn exports to Brazil.
CHINA. China’s imports are 27% behind last year. More precisely, at 20.6 million tons, compared to 28.35 million tons last year. The import curve was driven by Covid measures and low demand for ethanol.
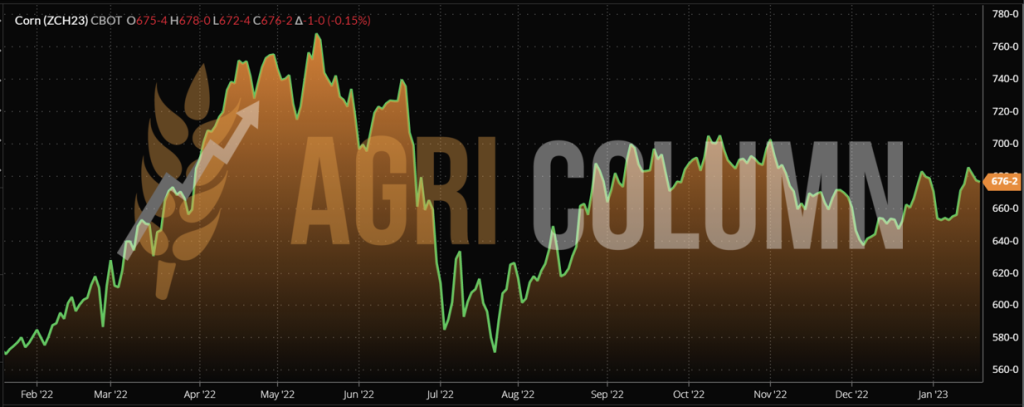
CBOT CORN ZCH23 MAR23 – 676 c/bu
CBOT CORN TREND CHART – ZCH23 MAR23
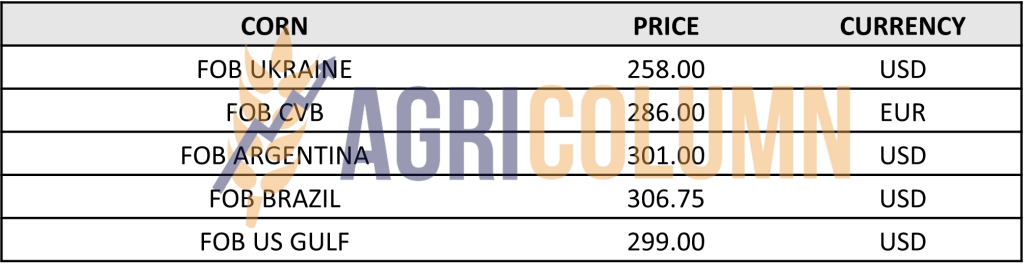
CORN PRICE INDICATIONS IN MAIN ORIGINS
CAUSES AND EFFECTS
Let’s look together at a comparison of the wheat and corn path and see how the orange area above is the corn. Until around July 1, wheat had price traction, then the ratio reversed, and corn held steady, while wheat began to decline. However, they go simultaneously as wheat is the price driver due to the ‘ replacement ‘ factor.
In its January report, the USDA cut global corn production and exports in the 2022/23 marketing year from last year.
- According to experts, the forecast for world maize production in 2022/23 will fall to 1,155.93 million tons, which is 5.93 million tons less than the December forecast and 58.94 million tons less than the indicator from 2021/22.
- This was due to a drop in grain production in the US by 34.14 million tons to 348.75 million tons, in the EU by 16.7 million tons to 54.2 million tons and in Ukraine by 15.1 million tons, up to 27 million tons.
- World corn exports will fall to 178.17 million tons, which is 3.4 million tons less than previous data and 25.8 million tons less than the export result of the previous season.
China’s imports are 27% behind last year. More precisely, at 20.6 million tons, compared to 28.35 million tons last year. The import curve was driven by Covid measures and low demand for ethanol.
The question is whether China will recover the gap in corn imports, as their intention is to curtail pork production. By default, it means less corn for feed. We believe that China will still reach 26-27 million tons of imports, but for the whole season, going down to June 30, 2023.
| As a sum of the conclusions, we can say:
Will China, after emerging from the pandemic peaks, generate demand or curtail it? The GASC corn tender in Egypt, of 50,000 tons, which gave Romanian corn a win, has a parameter that cannot be ignored in any way, namely the fact that corn is more expensive than wheat. A few days before, Egypt, also through GASC, had purchased 120,000 tons of wheat at the price of 337 USD/MT. And corn was purchased at 339 USD/MT. Numbers are numbers and any other argument, such as that this corn had some tighter specifications, falls flat. Corn is corn, and apart from a test weight (TW) of at least 70-72, we don’t see what else could have been so special. So, Corn was sold more expensive than Wheat. SOUTH AMERICA + CHINA will determine the price path in the very near future. But there is not much time, and we will be able to have two scenarios: · South America not delivering volume and China will demand = price support. · South America doesn’t deliver volume, but China curves demand = flat price. |

LOCAL STATUS
Rapeseed quotations in the port of Constanța are at the level of MAY23 minus 25 EUR/MT. This indication calculates a level of 510-514 EUR/MT. At the processing level, the quotations are MAY23 minus 35 EUR/MT, a fact due to the logistics cost (the difference between Constanța and the Processing Units), i.e., a level of 500-502 EUR/MT.
The new crop is also quoted. Primary indications are AUG23 minus 30 EUR/MT. It is an initial indication that provides support in estimating farmers’ incomes.
CAUSES AND EFFECTS
Rapeseed is, at this moment, under the effect of two factors, the political one and that of the foundation called volume (Origin).
Germany’s Federal Minister of the Environment has announced plans to reduce the use of crop-based biofuels (wheat and rapeseed).
The gentleman in question is a member of the Green Party and has already alarmed the agricultural and biofuels sectors. It is another example of the Political factor that has lowered rapeseed quotes just a week before the meeting of biodiesel producers and German politicians, who will discuss the biofuel industry in Berlin.
The second foundation comes from the Origin and concerns the very rich crop of Australia which floods Europe.
!! The two aggregates cause rapeseed to lose ground sharply, registering a minus of 34 EUR in a few days. We are clearly at the January 2022 level.
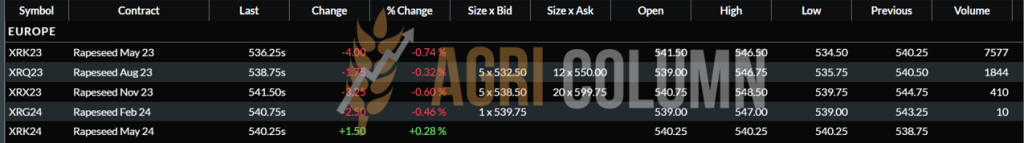
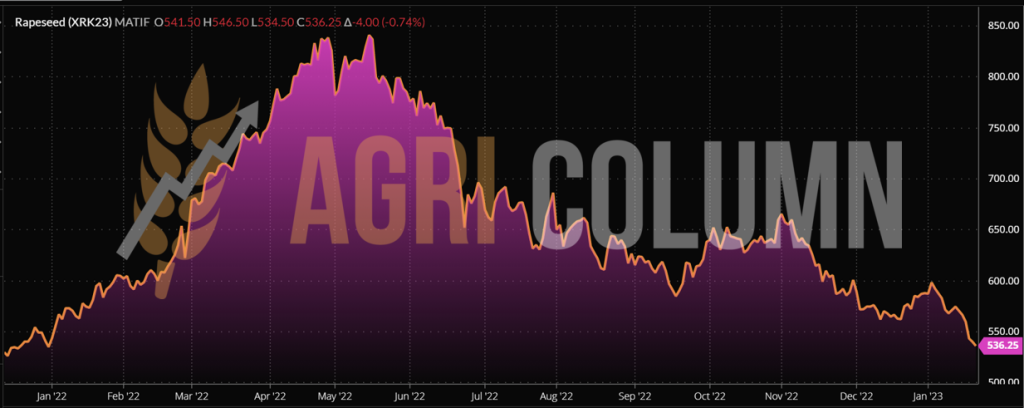
EURONEXT RAPESEED – XRK23 MAY23 – 536.25 EUR
EURONEXT RAPESEED TREND CHART – XRG23 FEB23
REGIONAL STATUS
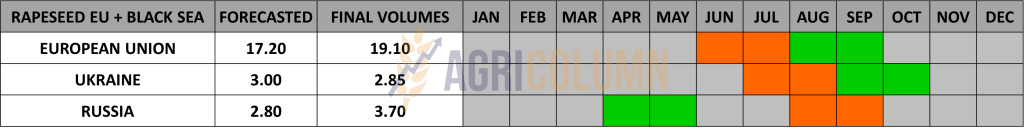
No change compared to last week in the European outlook, nor in Ukraine and Russia for rapeseed. The state of vegetation is in the same normal regime for this period. The coverage request is executed at a normal rate, referring to the processing units.
GLOBAL STATUS
CANADA, off season
AUSTRALIA, off season.

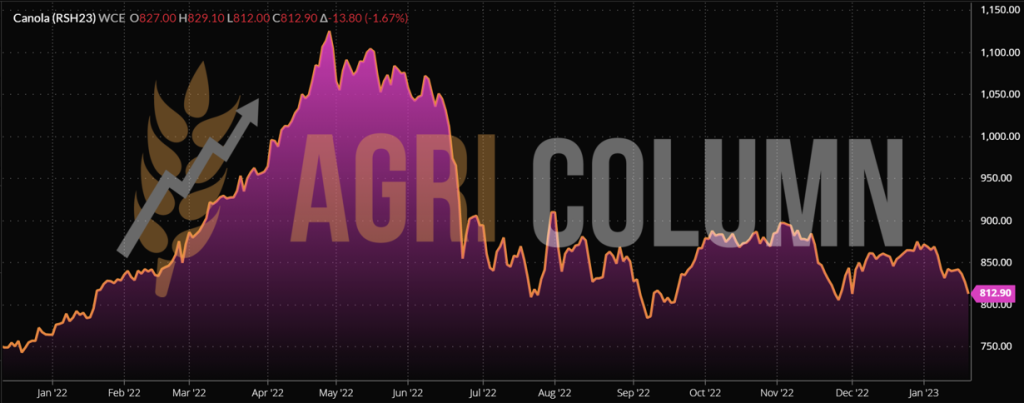
ICE CANOLA RSH23 MAR23 –840 CAD
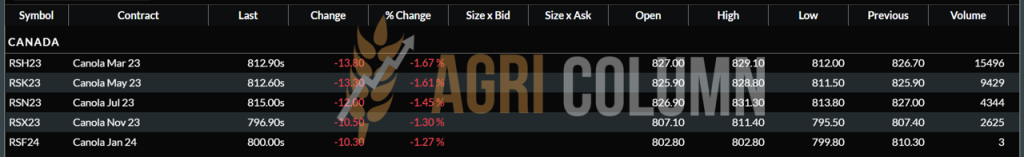
ICE CANOLA TREND GRAPH – RSH23 MAR23
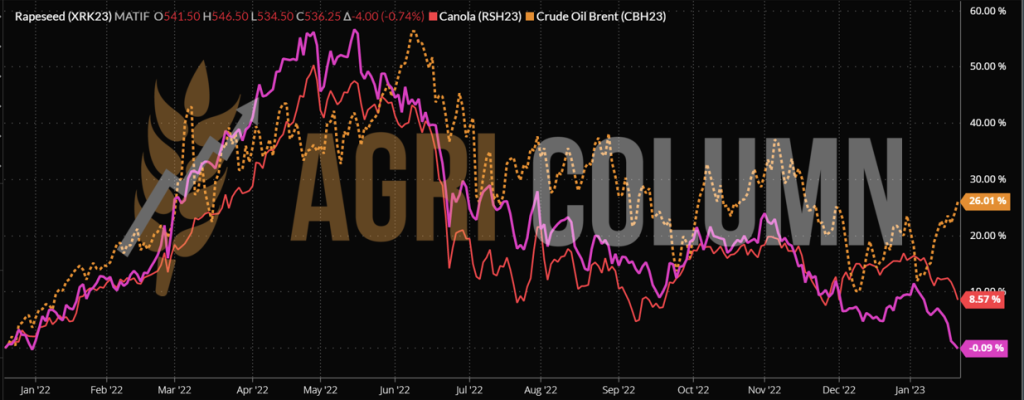
COMPARATIVE GRAPH. PETROL-RAPESEED-CANOLA CORRELATION
CAUSES AND EFFECTS
The Political Factor penalizes the work of farmers once again. With his statement, Germany’s environment minister, a member of the Green Party, is blowing up farmers’ incomes. It is a statement that wants to be sustainable but does not take into account the investments of farmers, the investments in processing, storage and transfer units.
The situation is identical in the US, where the EPA has effectively cut off soybean oil processing for biofuel.
The best example of failure in such green and sustainable initiatives without a transition state and effective alternative sources is Sri Lanka, which has collapsed and succumbed, due to eco and bio sustainable policies.
Another effect is given by the record Australian crop, which has invaded Europe with a volume of 1.4 million tons so far. Combined with rapeseed from Ukraine, which registered a volume of 2.5 million tons, we have a level of 20% of the European production that was imported extra, given that European farmers practice agriculture according to strict rules.
And the 2023 crop in the Union is developing under very good auspices, but it was established with prohibitive costs, generated by the war in Ukraine. Moreover, the sown areas are larger than last season.
Protection solutions? Hedging is the only resource to cover the risk of price decline.

LOCAL STATUS
Port Constanța remains for the moment in the area of 560-565 and even 570 USD/MT for sunflower seeds.
HIGH OLEIC sunflower seeds are quoted at a base level of 580-585 USD/MT.
Processors are correlating and indicating a trading base of 555-560 USD/MT at DAP Processing Units parity.
The processors in Bulgaria had already raised the price bar to 580 USD/MT, but for the time being, those on the banks of the Danube reduced the quotations by 10 USD/MT.
CAUSES AND EFFECTS
Current levels are encouraging for those looking to sell. A level of 580-585 USD/MT can be reached through some domestic negotiations and we have recorded by calculations these levels practiced by traders, who will move the goods to processing in Bulgaria. The sales window is open, and the demand is there.
REGIONAL STATUS
UKRAINE. Sunflower seed stocks in Ukraine as of January 1, 2023, are down 26-32% compared to the previous season amid stable demand, low sunflower seed quality and high exports putting pressure on the market.
According to analysts of the Ukrainian company, stocks of sunflower seeds as of January 1, 2023, varied between 7-7.3 and 8 million tons.
Estimates of the sunflower stocks ratio at the beginning of the 2022/2023 season range from 2.3 to 4 million tons, making it difficult to estimate current sunflower stocks, but suggesting that they do not exceed 8 million tons.
Steady demand for sunflower seeds from processors and exporters is supporting the market.
Over the past week, sunflower processor prices rose by an average of 6% to 17,000-17,500 UAH/MT (421-433 USD/MT) including VAT, with bid prices announced at 20,000 UAH/MT CPT (495 USD/MT).
At the same time, high rates of sunflower exports, provided that processing rates remain at the same level, caused concern among market participants.
Analysts at the industry association Ukroilprom suggested that Ukraine’s consistently high sunflower seed export may lead to a sunflower seed shortage for Ukrainian processors from April 2023.
At a board meeting on January 18, the association gave a pessimistic forecast for local supply, according to which Ukrainian sunflower exports could reach 3.5 million tons, which is 84% higher than last year last.
RUSSIA maintains zero duty on crude oil exports and registers new sales in Turkey, their traditional partner.
The EU is in the off-season and demand for raw materials has started to show.
GLOBAL STATUS
ARGENTINA indicates nothing new in any sense in the period between the two reports.

PRICE INDICATIONS FOR OILSEEDS AND CSFO IN MAIN ORIGINS

CAUSES AND EFFECTS
The balance of regional stocks is fragile, and this is very clear from today’s price threshold compared to the one before the Winter Holidays. There is a lot of seasonal movement in Ukraine, with processors trying to keep raw material in the country while exporters are tempted by higher price levels.
If we look through the lens of the exchange rate, we see that local trading is penalized by the USD|RON exchange rate. A weaker dollar automatically means a weaker price level in the national currency, RON. By comparison, a level of 530 USD/MT at an exchange rate of 4.8 had a value of 2,544 RON/MT, and a level of 570 USD/MT at an exchange rate of 4.55 has a value of 2,593 RON/MT. The difference between the exchange rate of 4.8 and 4.55 is 143 RON or about 30 USD in the minus. The same principle applies to the EUR against the USD as well as countries with their own currency.
Normally, sunflower seeds need support. But collaterally, the demand for crude oil must become more prominent. The same system where palm oil plays at a discount due to stocks and competition with soybean oil, however, causes the demand for sunflower oil to stagnate. But there is still a window of time, at least until March 10, 2023.

LOCAL STATUS
In Romania, the price indications for soybeans are at the level of 530 USD/MT DAP processing units for non-GMO soybeans with delivery after February 1, 2023. Between July 1 and December 10, 2022, approximately 146,000 tons of soy.
REGIONAL STATUS
THE EUROPEAN UNION. Weekly imports of soybeans in EU countries were 189,723 tons. Most soybeans were shipped to Germany (63,562 tons) and Spain (61,439 tons). Total soybean imports rose to 5.97 million tons, down 16.7% from the same period last year.
Weekly EU soybean meal imports were 320,207 tons, bringing total imports to 8.7 million tons, 1.8% lower than last year. Almost half of the imported volume was delivered to Germany (113,838 tons).
Ukraine. Since the beginning of the 2022/2023 season, soybean exports have reached 1.4 million tons. The Netherlands (77,838 tons) and Turkey (76,502 tons) bought almost 60% of January’s export volume.
RUSSIA will impose an export tax on soybeans between 30-50% to favor domestic processing. But most soy grows and is produced in the Far East, that is, in Southern Siberia, and the transfer after processing to the area of large urban agglomerations, because that is where the animal husbandry units are, is a logistical and implicitly financial problem.
GLOBAL STATUS
USA. Weekly US soybean export inspections hit 2 million tons, and total inspections at the start of the 2022/23 marketing year reached 32.1 million tons, down 4.3% from the previous year.
The USDA’s weekly data on net sales rose in the week ended Jan. 12, in line with analysts’ expectations. The USDA reported net sales of 986,200 tons for the 2022/23 crop, up from 717,400 tons last week.
China was the main destination with 507,000 tons reported, followed by Mexico (262,300 tons), Spain (244,300 tons), Vietnam (67,200 tons) and Pakistan (66,000 tons).
No sales were reported for the 2023/24 marketing year, and analysts’ expectations ranged from 0 to 100,000 tons.
BRAZIL. Soybean sowing in Brazil is coming to an end. In the Brazilian state of Rio Grande do Sul, it reached 98 percent in the week ending Jan. 19, according to state agency Emater/RS. Many areas benefited from sparse rains last week, which allowed soil moisture to improve, although not as much as needed. Emater/RS did not change the production estimate in Rio Grande do Sul, at 20.5 million tons, which would represent an increase of 124.4% compared to last year, on an area of 6.5 million hectares, up 2.8%.
In Parana, soybean crop conditions have remained stable, with those considered good being 80%, those considered average being 15%, and those considered poor now at 5% of the total sown area, according to the state’s agricultural agency, Deral.
The rains have helped reduce water stress on crops, despite damage to some early-sown areas, which is still expected to reduce yields.
Soybean production in Parana is estimated at 21.4 million tons, up 74 percent from last year’s total of 12.3 million tons on 5.7 million hectares.
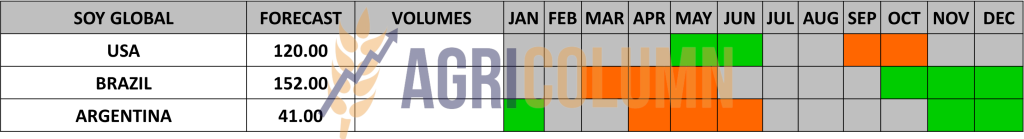
ARGENTINA. Soybean planting in Argentina has reached 95.5% of the expected area of 16.1 million hectares. Soybean production forecast for Argentina is 41 million tons, and rains remain insufficient to improve growing conditions, according to BAGE.
Crops rated good to excellent reached 3%, while 60% of the area was rated poor, and areas rated good are now at 37%.
Areas considered dry are now at 70%, while areas considered optimal and adequate are now 30%.
New-crop soybean sales rose 148% last week to 82,000 tons, on the opposite track to the 2021/22 crop, which fell 65.7% to 49,000 tons. This brings total sales of the 2022/23 crop to 2.7 million tons, while at the same time last year, sales totaled 5.4 million tons.
Argentina’s soybean exports reached 4.8 million tons in 2022, down 0.9 million tons from the previous year. However, soybean production in Argentina is mainly for processing.
CHINA. China was the world’s largest soybean producer until the War of Resistance Against Japanese Aggression (1931-1945), but now buys up to 60% of its needs on the world market. After the founding of the People’s Republic of China, the area under soybean cultivation reached a maximum of 12.73 million hectares in 1957. Cultivation of this crop began to decline in the 1990s, after being overtaken by more profitable cash crops such as corn.
Last year, 10.26 million hectares of soybeans were cultivated, the largest area since 1958 and an increase of 1.82 million hectares from the previous year, according to the statement of the chief agronomist of the Ministry of Agriculture and Rural Affairs. He also stated that the ministry aims to expand the cultivation areas of soy and oil crops by at least 660,000 hectares.
The volumes of processed soybeans reached 2.08 million tons this week, according to data from the National Cereals and Oil Information Center (CNGOIC). That was 4.5 percent higher than the level reported a week ago, despite lower activity ahead of the Lunar New Year when processing plants close earlier for the holidays.
soybean volume continued to hold steady at around 2 million tons for eight straight weeks as higher import arrivals helped support higher processing volume. CNGOIC expects imports to reach 8 million tons in January.
Inventories in the soybean complex were flat or lower amid higher processing volume, with soybean stocks falling 4.05% on the week to 4.26 million tons. This was 2.65% higher than last month and 9.51% higher than a year ago. The decline came after three straight weeks of gains as the processing rate outpaced soybean arrivals.
Stockpiles of soybean meal last week fell 18.64% from the previous week to 480,000 tons for the first time in eight weeks as uptake by domestic consumers increased ahead of the winter holidays. This was 29.72% more than last month and 25% less than a year ago.
However, sales are expected to be slow this week and post-holiday consumption is likely to be sluggish as hog growing margins remain unfavorable.
Finally, soybean oil stocks were unchanged from the previous week at 710,000 tons as high processing levels and increased consumer uptake offset each other.
Market activity this week was largely moderate as most of the country prepares for the Lunar New Year and the holiday will last most of next week.
According to data from the General Administration of Customs of China, Chinese soybean imports from Brazil fell in 2022 for the second year in a row. Soybean volumes in Brazil reached 54.39 million tons in 2022, down 6.45% from the previous year. Imports from other key suppliers, the US and Argentina, also fell as weaker demand amid a year of Covid-related disruptions and higher domestic production weighed on imports.
In 2022, China bought 29.5 million tons of soybeans from the US, down 8.48% from the previous year, and imports from Argentina fell 2.08% to 3.65 million tons.
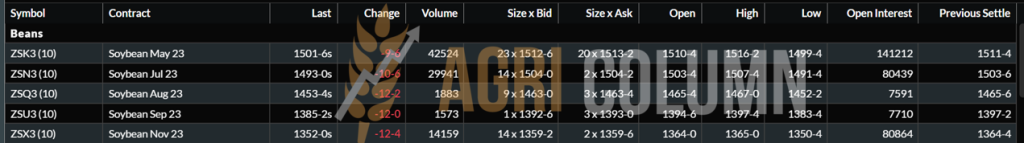
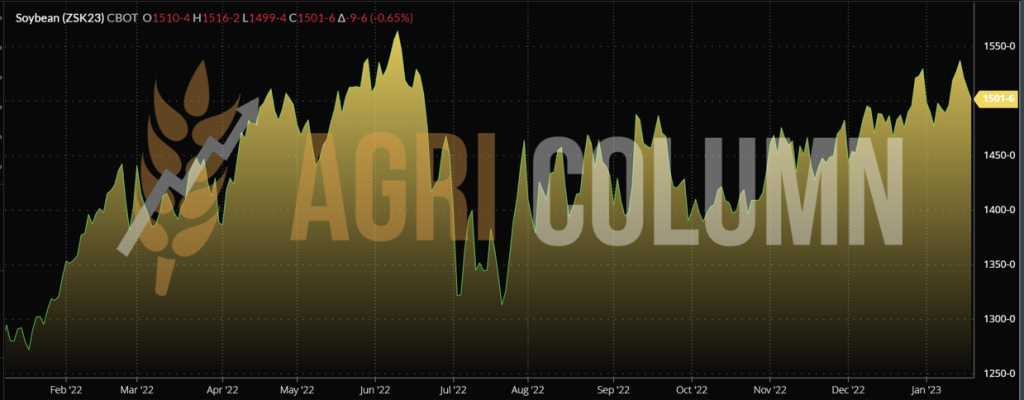
CBOT SOYBEAN ZSH23 MAY23 – 1,501 c/bu
SOYBEAN TREND GRAPHIC– ZSH23 MAY23
CAUSES AND EFFECTS
Soy creates uncertainty in the market. Argentina will drop dramatically, but will it be compensated by Brazil? Will China generate strong enough demand? Indications from this country show that they want to reduce pork production, which could be an indicator of reduced demand for imported soybeans.
Today’s parameters, however, keep the grain price level high. But it does not help soybean oil, a by-product of soybeans, as the oil is penalized by its restriction in biofuel and by weaker demand in direct competition with palm oil.


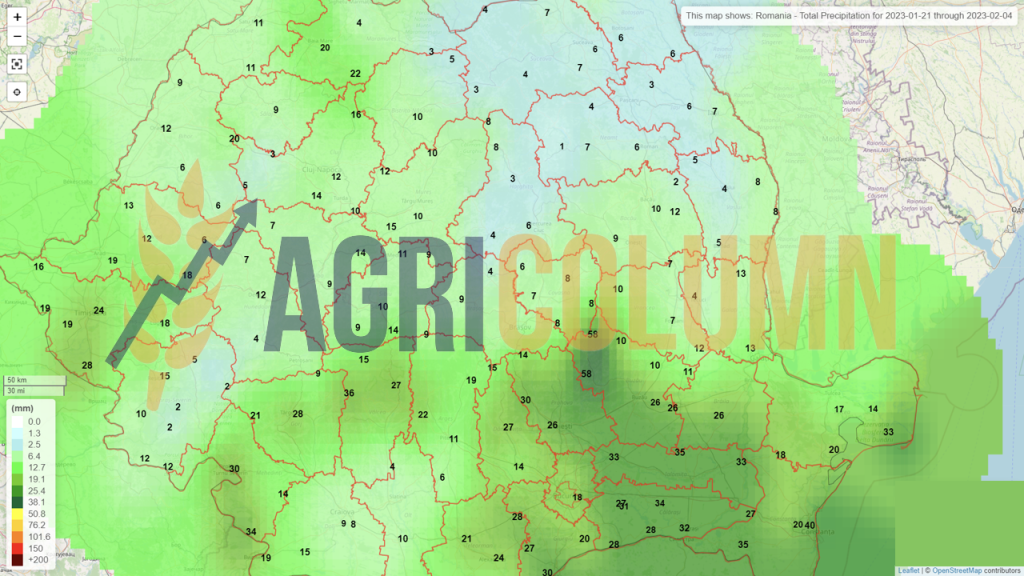
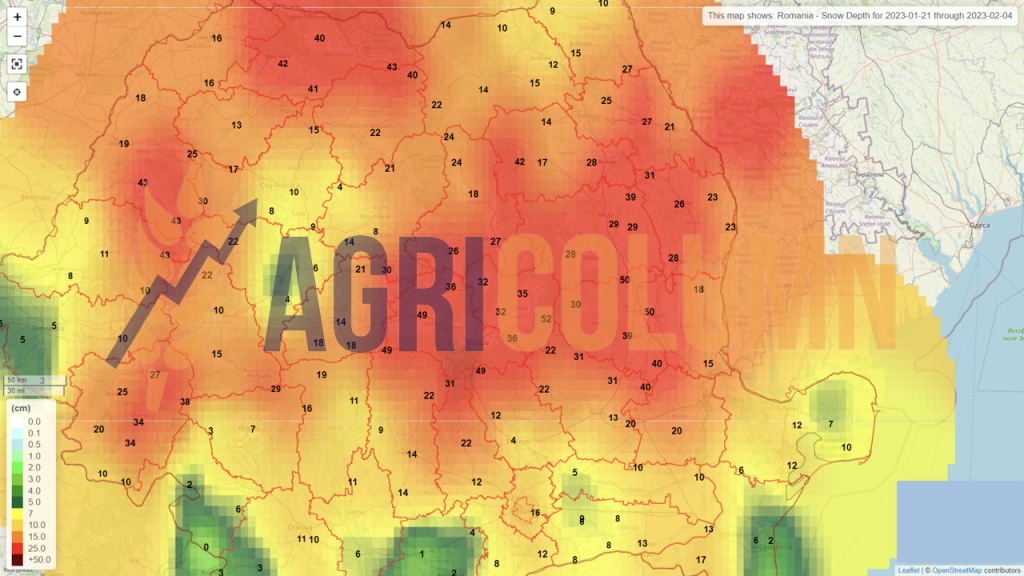
21 January – 4 February 2023
Romania (rain)
Romania (snow)
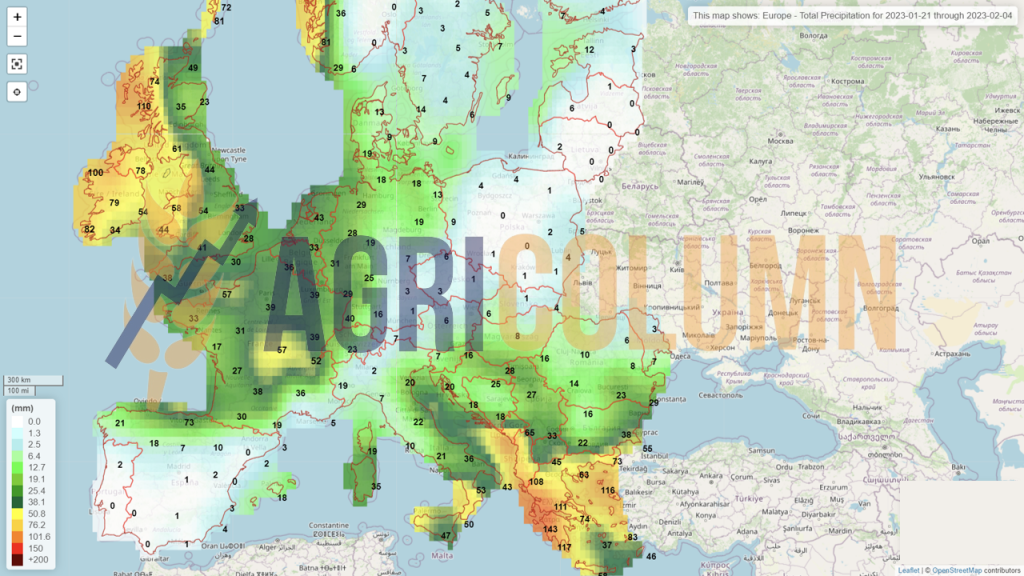
Europe (rain)
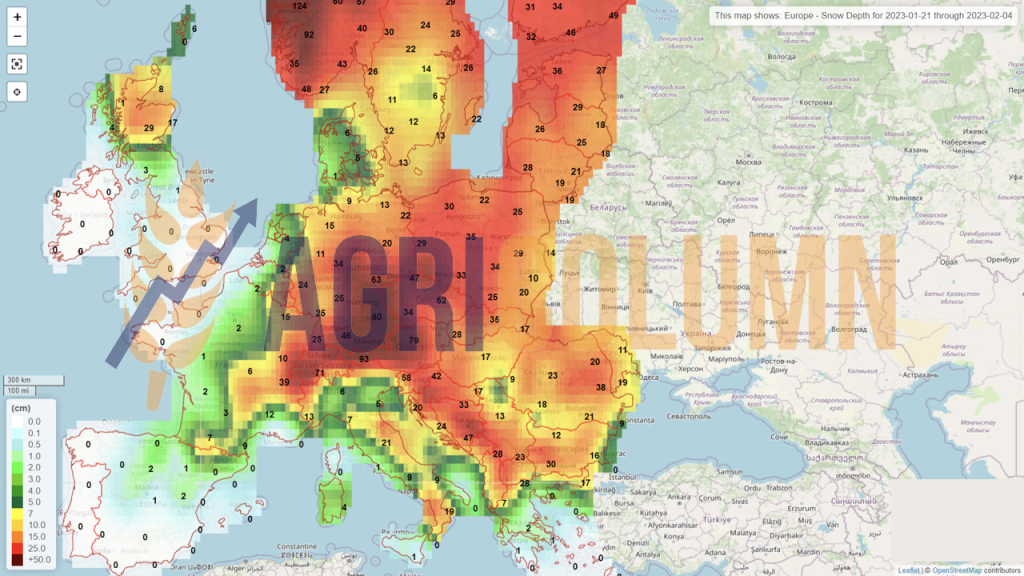
Europe (snow)
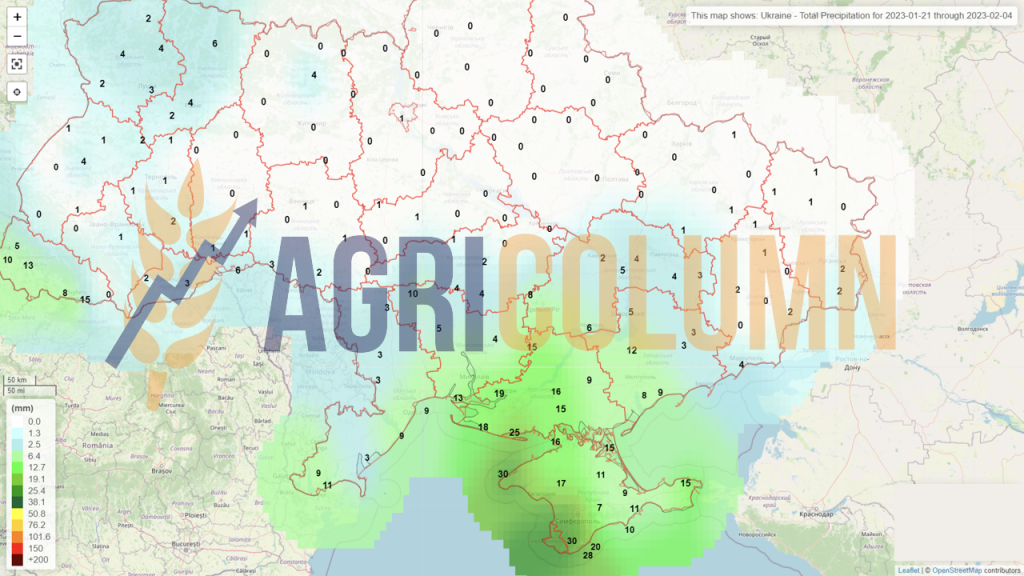
Ukraine (rain)
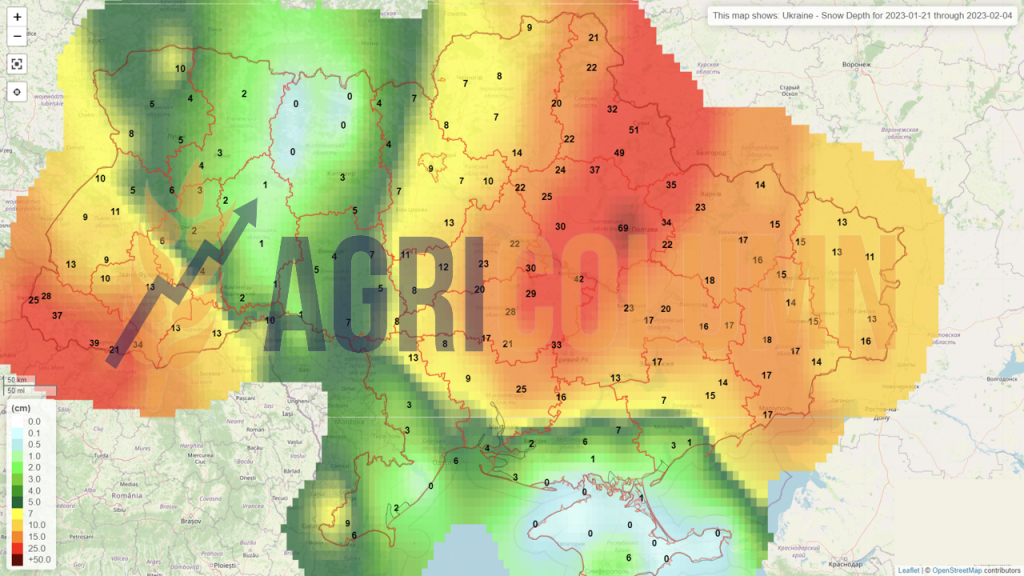
Ukraine (snow)
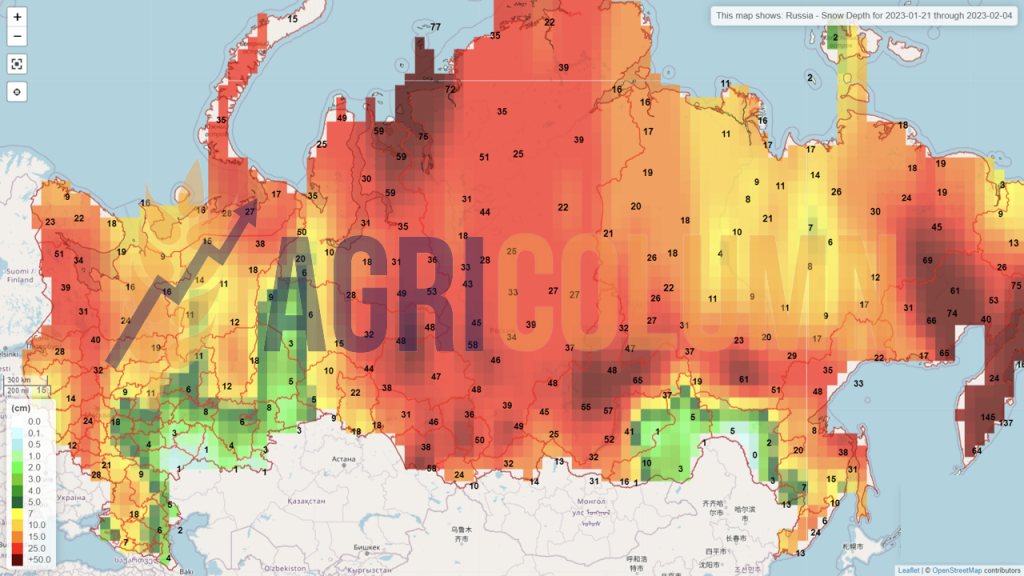
Russia (snow)
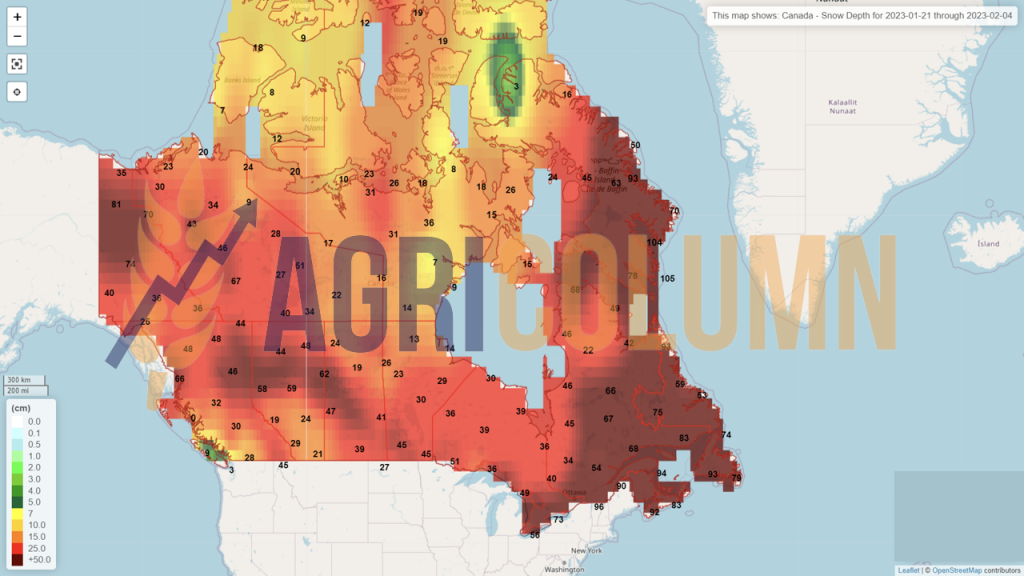
Canada (snow)
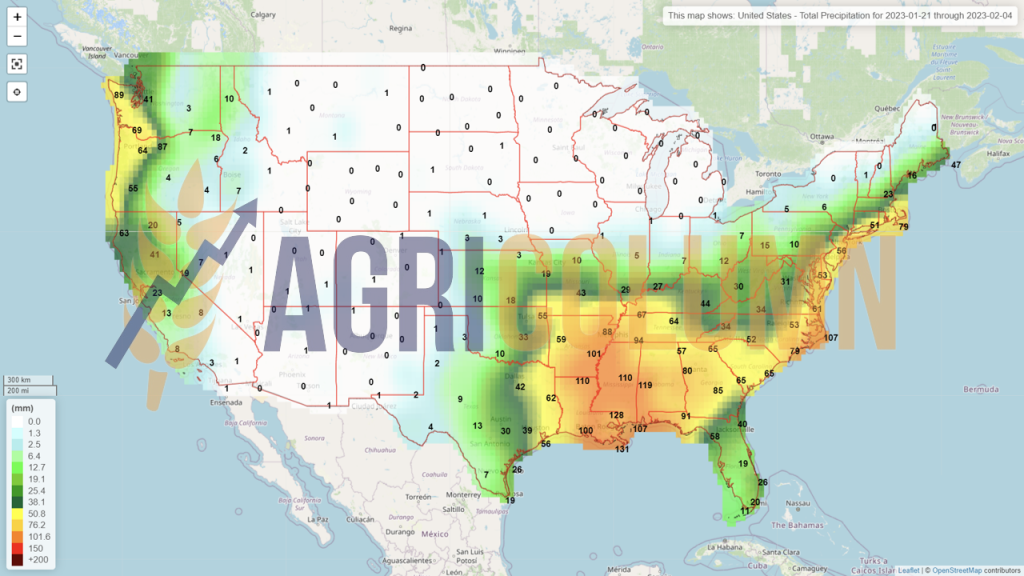
USA (rain)
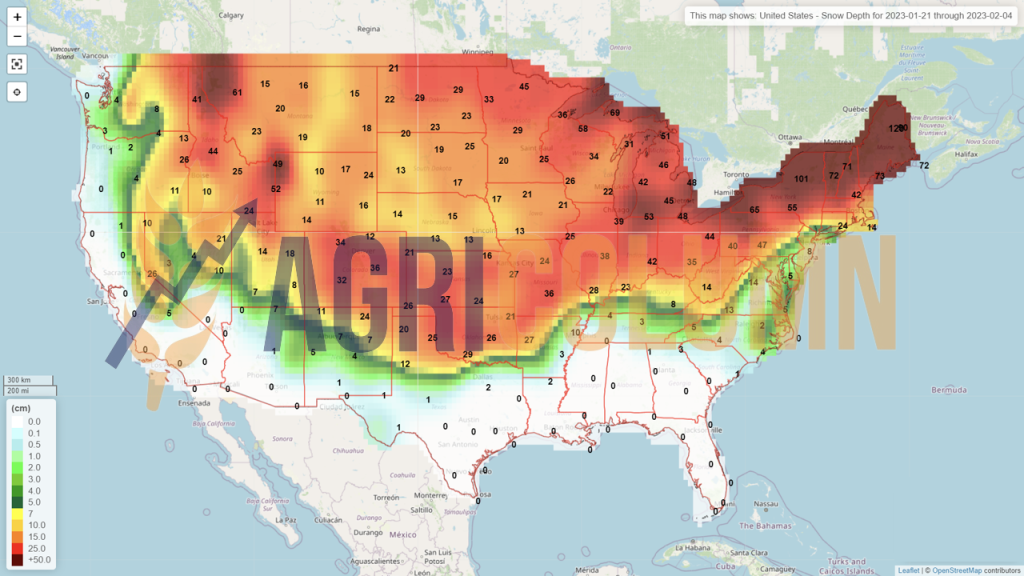
USA (snow)
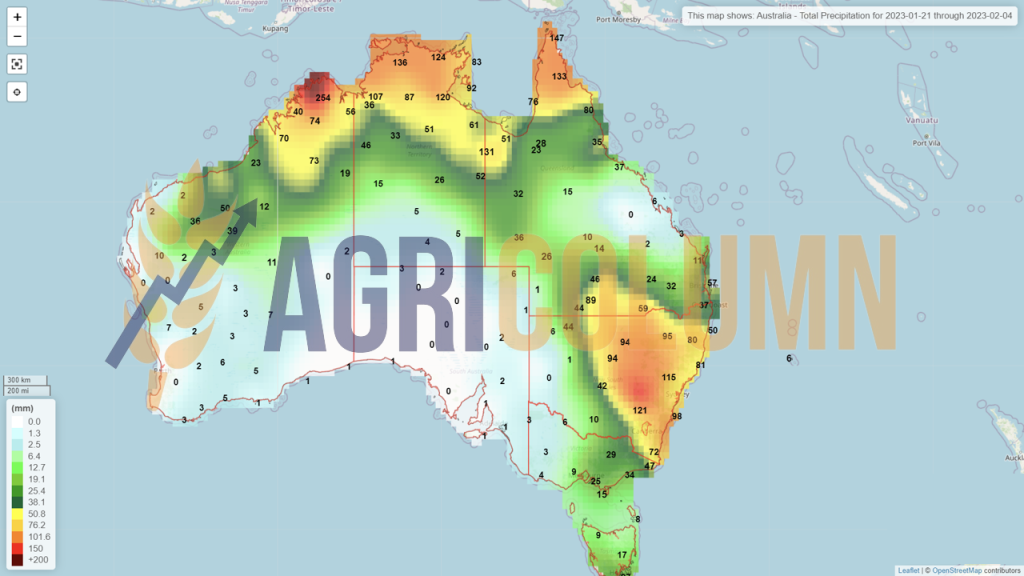
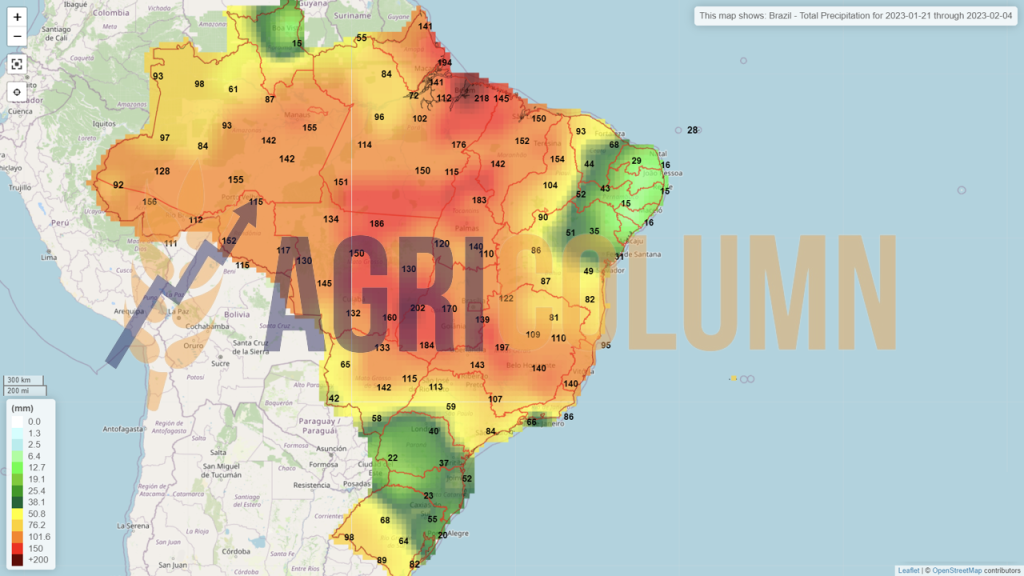
Brazil
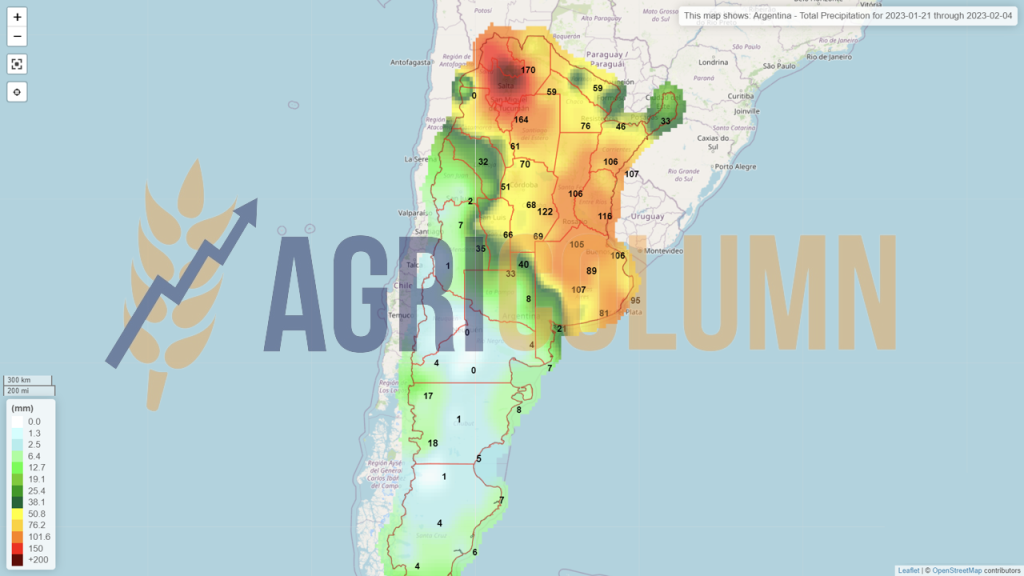
Argentina
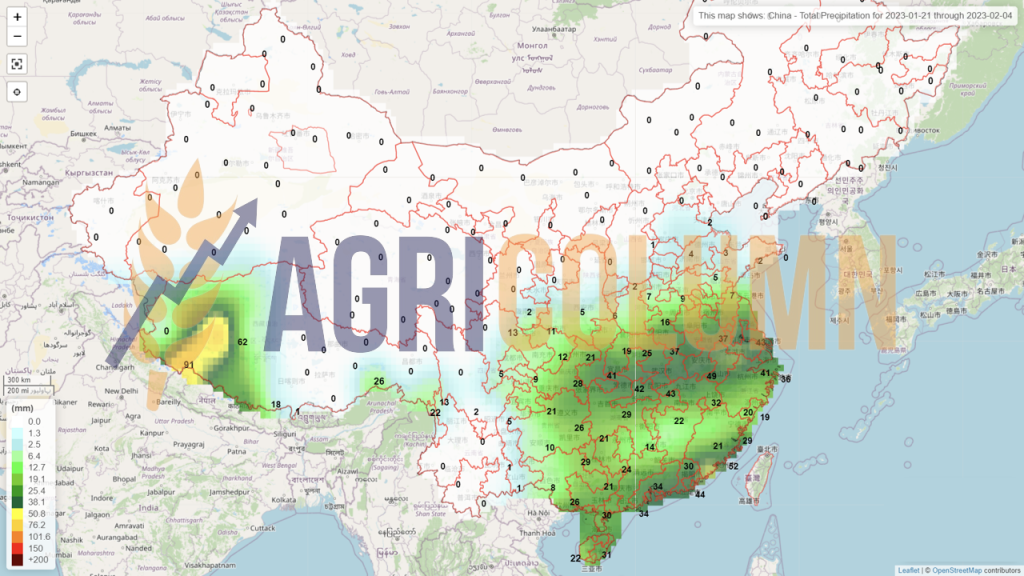
China (rain)
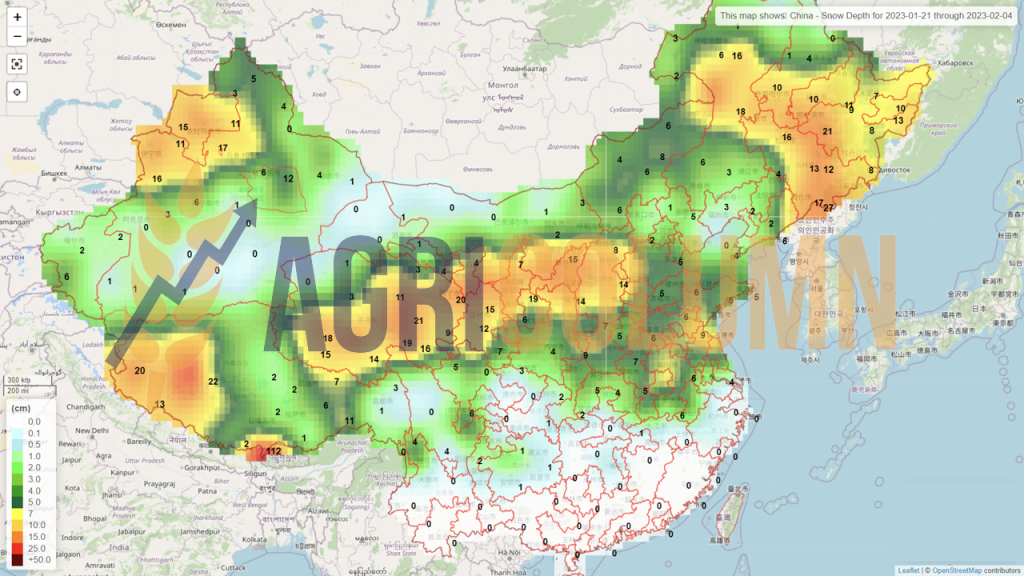
China (snow)
Australia