This week’s market report provides information on:

LOCAL STATUS
Wheat quotations in the CPT Constanța parity are 207-210 EUR/MT. Feed wheat has a difference of minus 10-12 EUR/MT in discount.
Market conditions remain broadly the same. The only argument that intervened and conditioned the market to go up by 7 EUR/MT is clearly the dynamiting of the Nova Kahkovka dam in Ukraine. We do not insist on the event, but only indicate the source of the price increase for wheat in the CPT Constanța parity. It is a geopolitical conditioning factor, as panic instantly gripped the stock market and reverberated through the physical market. Remember May last season. The scenario is with repetition, but not to the same magnitude. The primary source of price indications remains the physical market.
Witnesses are physical fundamentals, and they remain anchored in volumes, not events that come and go. Even in the event of the closure of the Corridor, wheat from the Black Sea basin will cross through the Bosphorus. That he will do it through Romania, through Odessa partially or through Novorrosysk, the goods will come out one way or another. So, the fundamentals of the physical market will destroy the logic of the momentary panic established, because, as you will see in the WASDE report that is generated together with this market report, things take a different turn in terms of fundamentals.
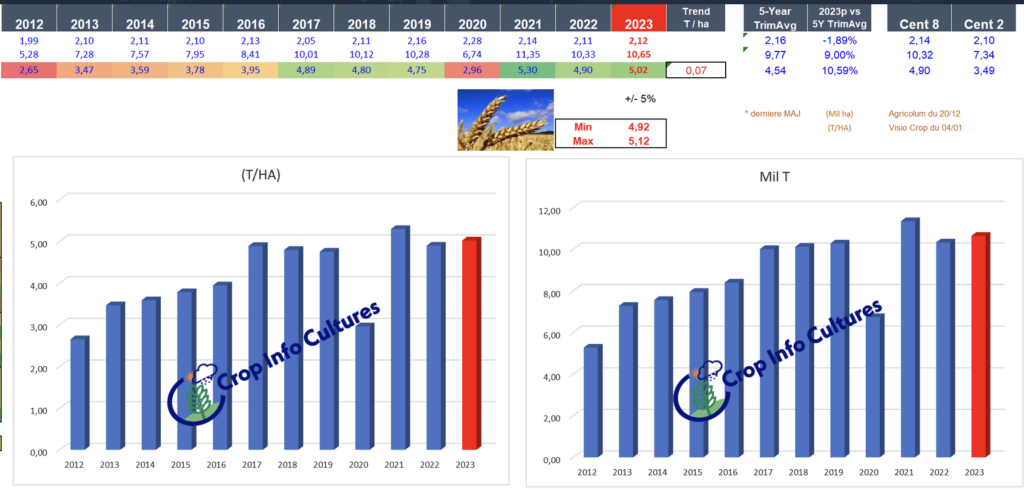
For several months, we have announced a wheat crop of 10.5 million tons, and the confirmations that arrive repeatedly confirm, as every year from 2020, the results of our analyses. Courtesy of Visio Crop, https://www.visio-crop.fr/, we indicate once again the certification of the figure of 10.5 million tons of wheat as production in Romania.
REGIONAL STATUS
RUSSIA is playing all its chances. It conditions the 240 USD/MT threshold as the price level for the new crop commodity, and the extinguished tender in GASC showed exactly that. But the increase in the volume of goods indicated by the WASDE report creates pressure, and Russia still has unsold stocks of about 15 million tons, which penalizes its efforts to condition the market, especially since inside the Russian Federation there is an iron hand, namely the Russian state. Free trade is a word that no longer has a place in Russia. Multinational companies have left the scene, giving way to those originating or allied with the Russian state, in a centralized state monopoly.
UKRAINE indicates a cargo volume that is rapidly approaching our forecasts. Certainly, the initial figure of 16.5 million tons could not be realistic, and the increase indicated by the WASDE report is approaching reality. But let’s not forget the unsold Ukrainian goods that will have to be moved for export, through the lines of solidarity and partly through the Corridor.
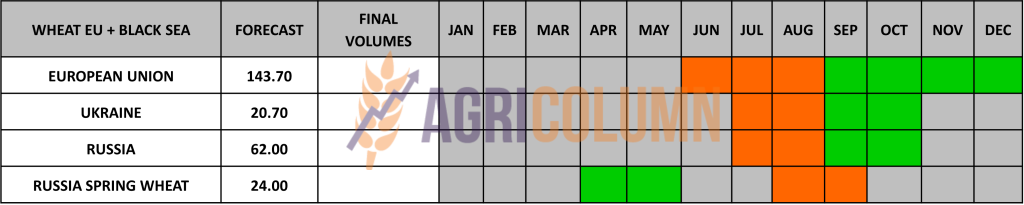
THE EUROPEAN UNION generates a forecast of a generous wheat crop, if we judge by the analyzes of reputable houses at the European level. Despite some obvious problems in the northern countries, the total wheat forecast reaches 140 million tons.

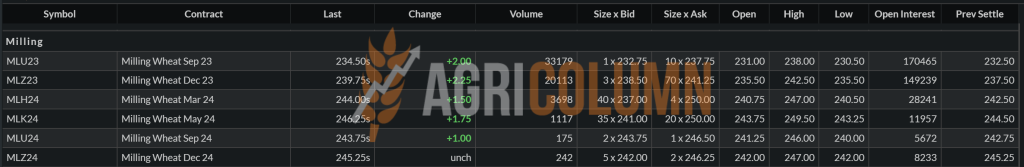
EURONEXT – MLU23 SEP23 – 234.5 EUR (+10.5 EUR vs. last week)
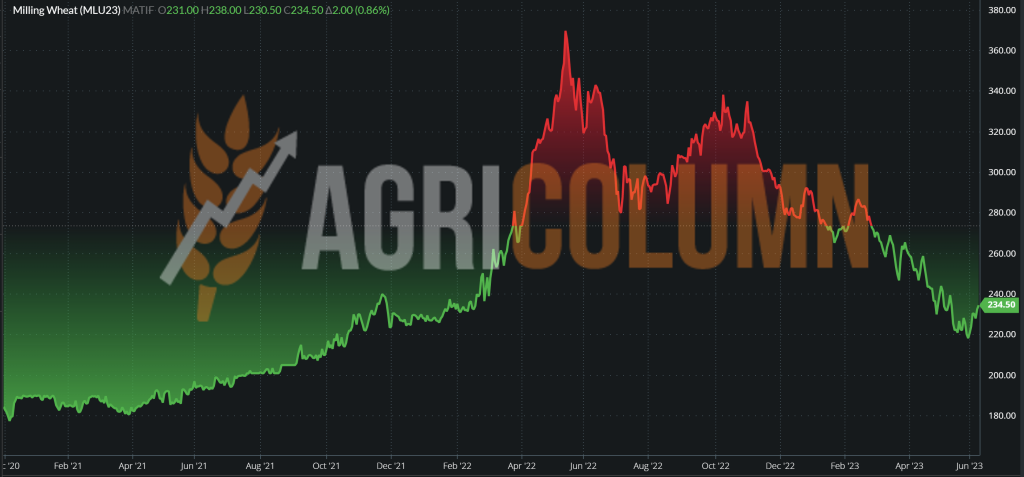
EURONEXT WHEAT TREND CHART – MLU23 SEP23
GLOBAL STATUS
The USA indicates an increase in the wheat production forecast by about 163,000 tons. It’s not a big number, but it does indicate overcoming some weather-related issues at the moment.
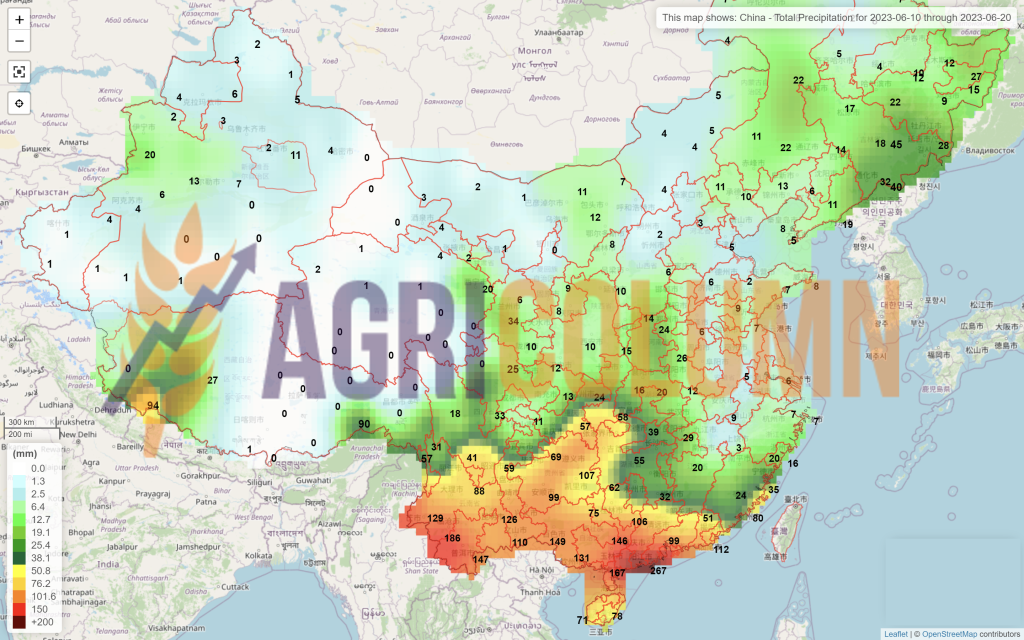
CHINA, according to what was written in the previous issue, remains standardized as a cargo volume at the level of 140 million tons. Indications of the effect of the floods have not yet crossed the country’s borders. But as I said, lower quality goes to the feed industry.
INDIA confirms and is pardoned an additional 3.5 million tons to 113.5 million tons.
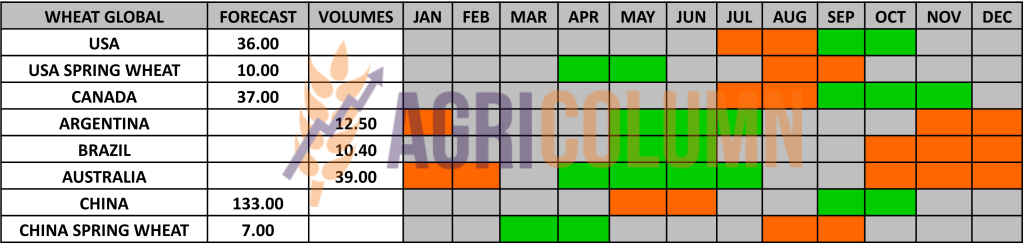
CANADA remains in the same volume forecast of 37 million tons, despite the negative projection created by the lack of water and the wildfires occurring in the forested areas of the province of Alberta.
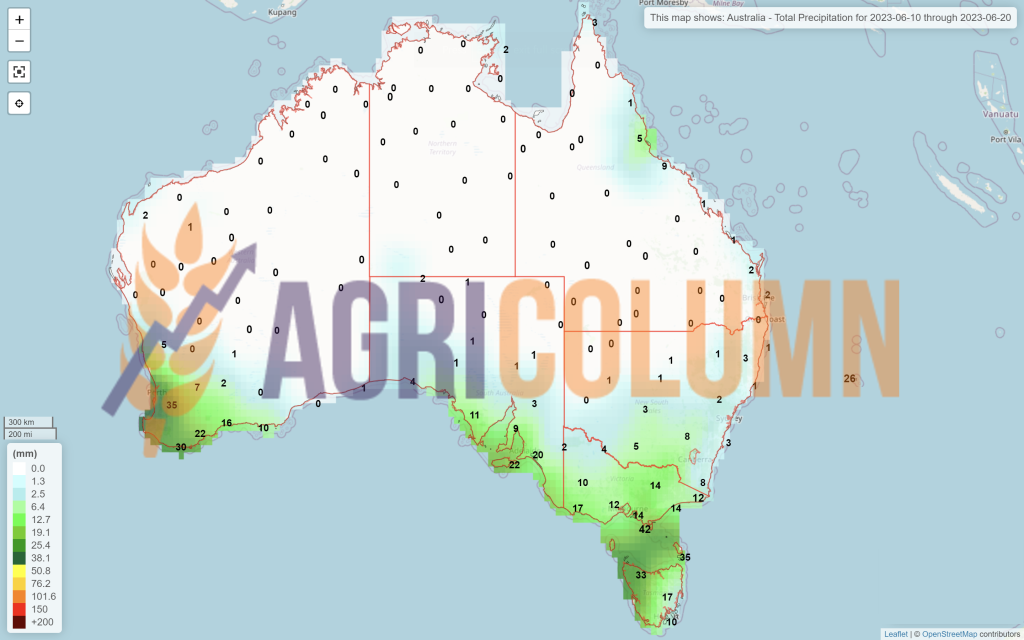
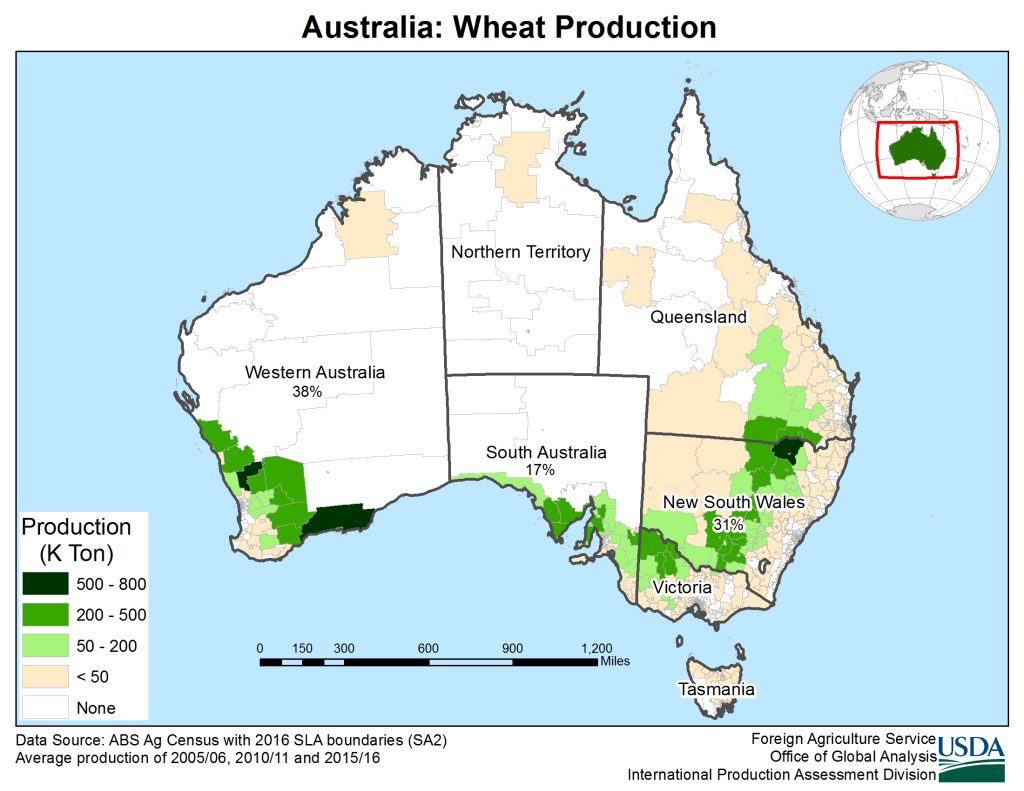
AUSTRALIA remains fixed at 29 million tons. There is still time for the crop to develop and the weather forecast shows rainfall in the south, Victoria, New South Wales, the southern part of Western Australia, South Australia and parts of Queensland. For reference, here are the wheat growing areas and their percentage share. Source: USDA.
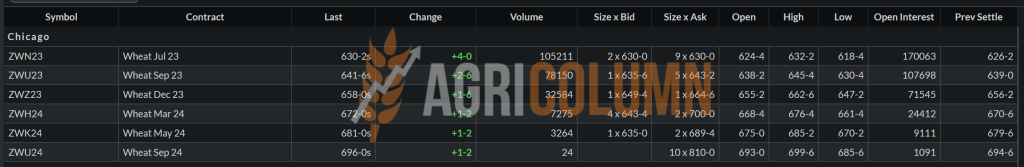
CBOT WHEAT – ZWU23 SEP23 – 641 c/bu (+9 c/bu vs. last week)
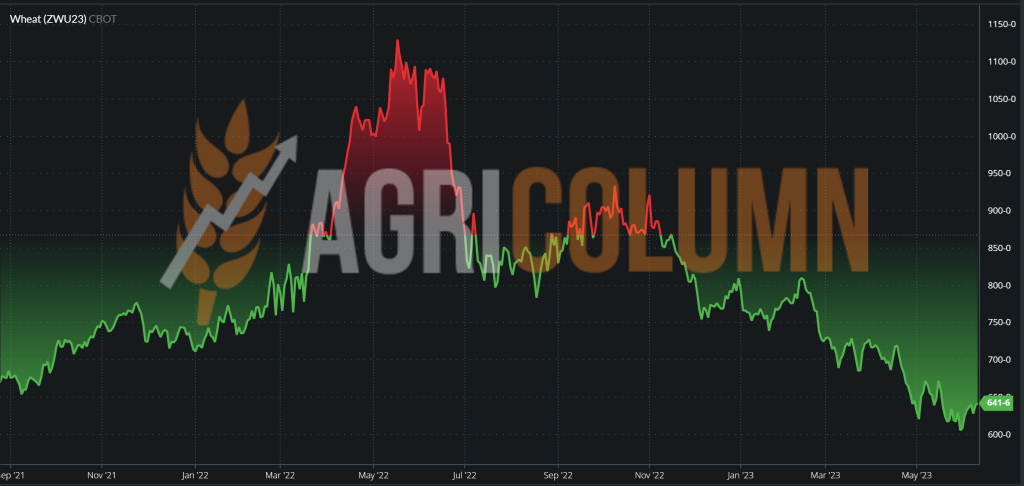
CBOT WHEAT TREND CHART – ZWU23 SEP23
TENDERS AND TRANSACTIONS
GASC EGYPT – tender concluded in an absolutely embarrassing silence. In the first scenario, all Russian companies lined up to order at 240 USD/MT FOB. The shipping cost was that pseudo-cost, because we know how the Russian state works. The subsidized fuel (because they have no way to export because of the sanctions) fuels the tankers of the ships that come to load and thus cuts in half the cost of the transfer from the Russian ports to Egypt. The reputation of “Russia is a gas station run by…” precedes its time and is extremely current.
However, a rebel broke from the line, AGRIC, which posted a sale price of 229 USD/MT FOB. In silence, GASC took the 55,000 tons as a valid offer and ignored the rest.
But behind closed doors in Russia, the rebel was forced to drop the bid, and so, an awkward silence fell over this tender. The logic of things was that Egypt could not buy above Saudi Arabia’s purchase level, that is, above the level that was set by another purchase tender of over 600,000 tons at 261.67 USD/MT, CIF YANBU and JEDDAH. 240 USD/MT meant a price level much higher than the actual cost of the goods, not counting their transfer to the Destination.
But the Russian comedy continues:
CAIRO, June 10 (Reuters) – A Russian wheat supplier that sold a 55,000-ton cargo to Egypt has made a “commitment” to deliver but may look to source its grain from another country, an Egyptian minister said on Saturday, amid confusion over a minimum price imposed by Russia. Egypt’s state grain buyer bought the wheat from Russia’s Agric SA in an tender last week at 229 USD/MT FOB, but traders said the supplier tried to withdraw the offer because it was below an unofficial price level. The tender shows Russia’s declining flexibility with the minimum export price policy it has followed to protect its farmers because the supplier failed to get approval from Russia’s Ministry of Agriculture, traders said. In March, the unofficial price floor was set at or above 275-280 USD/MT, but according to traders, it was 240 USD/MT at the time of Egypt’s tender.
…If the supplier fails to deliver the goods to Egypt’s General Authority for the Supply of Commodities (GASC), it faces stiff penalties, traders said. Egypt’s Minister of Supply, Ali Moselhy, told reporters that “the supplier is engaged. He [Agri ] only asked to diversify the origins”. Egypt’s state buyer has relied heavily on Russian wheat imports since the start of the Ukraine war. Moselhy also said the International Islamic Trade Finance Corporation (ITFC) approved a $700 million financing tranche to Egypt this week to finance grain imports. The financing is part of a 2018 financing agreement with ITFC, which was renewed last year for another five years, with the credit limit doubled to $6 billion. Egypt has recently been forced to delay payments to wheat suppliers due to a shortage of foreign currency, Moselhy told Reuters last month. The war in Ukraine initially caused a disruption in Egypt’s wheat purchases, but stocks currently stand at 5.9 months. The country also purchased 3.4 million tons of its local crop and plans to end domestic purchases in August, Moselhy said.
ODC TUNISIA initiated a tender for the purchase of 100,000 tons of wheat, but it was cancelled. Of course, the USDA forecast was effectively “smelled” and the retreat was necessary to wait for another price level, because amid the panic and excitement generated by the dynamiting of the dam in Ukraine, the market had risen by 10 EUR.
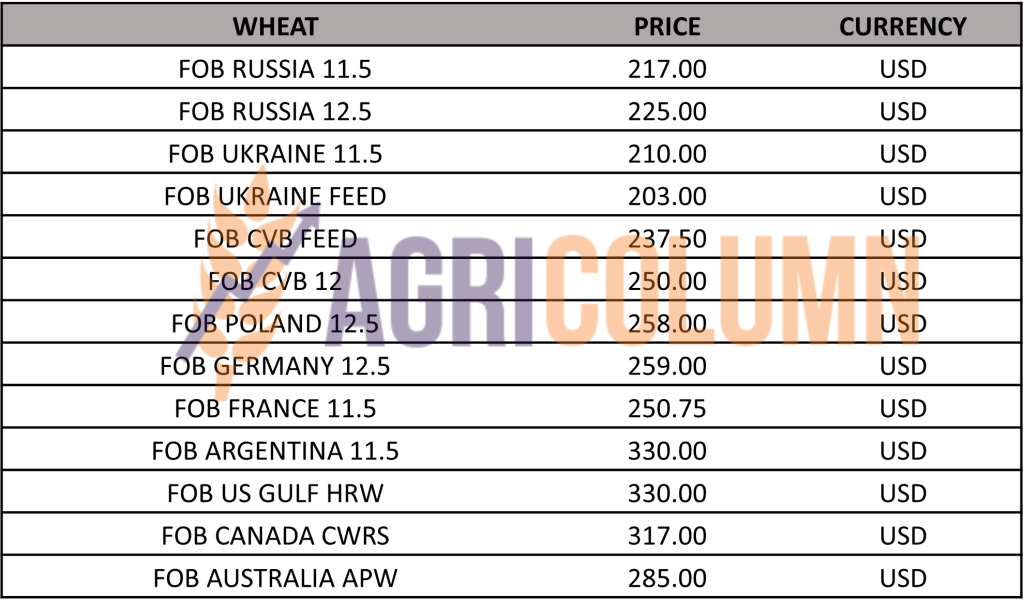
WHEAT PRICE INDICATIONS IN MAIN ORIGINS
CAUSES AND EFFECTS – THE STORY
Events of a geopolitical nature shook the markets in the previous week. The dynamiting of the dam in Ukraine generated an amplitude movement in the wheat price level.
The corridor is a passenger option anyway, Ukraine doesn’t ship much cargo through Odessa, and solidarity lines remain the most solid options, as well as the Danube ports. Effectively, the focus shifts so, that Russia can no longer generate the blackmail we see daily regarding the functioning of the Corridor. And, one more detail, one way or another, the famous liquid ammonia pipeline, which Russia wanted operational in exchange for releasing its grip on the Corridor, is no longer operational. She was extremely seriously damaged in two places. No one is able to give details, but the Togliatti-Odessa blackmail can no longer be taken into account. A lever in the negotiation that was articulated by Russia has disappeared. And blackmail options remain extremely limited.
VTB, Russia’s second-largest bank, will sell its stake in one of Russia’s biggest grain traders, Demetra-Holding, and is in talks with both Russian and foreign buyers, it said general manager Andrei Kostin in an interview. Demetra has a network of grain elevators, major deep-sea grain terminals and its own logistics. It owns a non-controlling interest in major grain trader United Grain Company (OZK). VTB has a 45% stake in the holding.
Kostin said VTB saw little prospect for itself in the grain business, adding that a bank sanctioned in the shares prevented participation.
Here’s another reason why we see very few Russian blackmail options in the near future. The essence of any transaction remains money, and the impossibility of its transfer strikes deep into Russian financial interests. Through this move by VTB, we have confirmation that the blackmail leverage has decreased, and Russia’s only option is to be competitive in the wheat market, a fact guaranteed by the reduction of the export tax. The interest in selling is therefore extremely high.
The headlines generated the movement in the trading algorithms, and the beneficiaries were the long positions. But on the evening of June 9, 2023, the USDA, through the WASDE report, generated a counteroffer to the wave of emotion generated by the news:
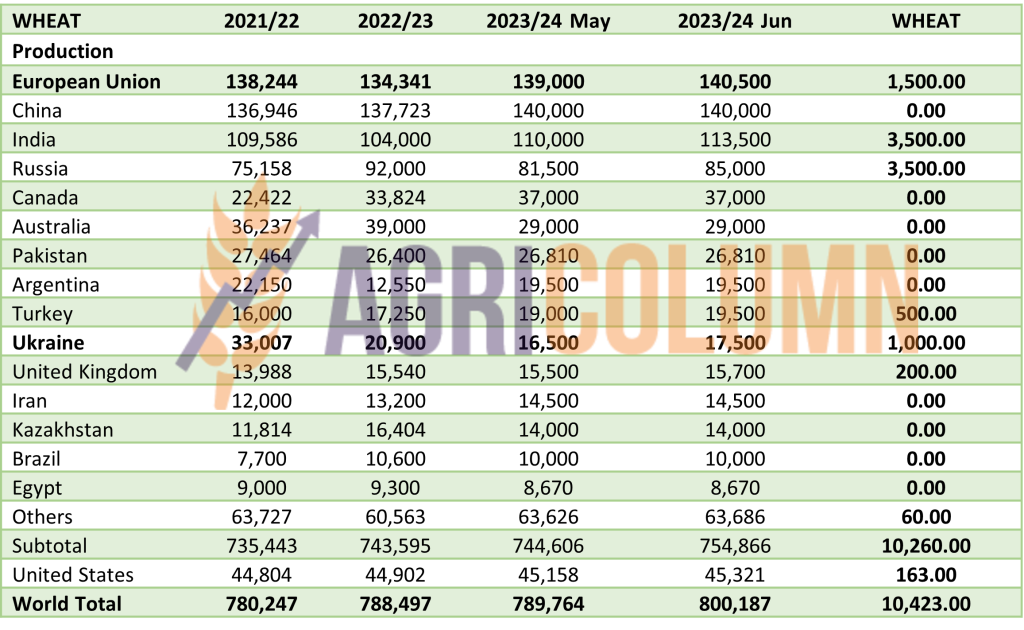
- Russia + 3.55 million tons,
- Ukraine +1 million tons,
- European Union +1.5 million tons,
- India plus 3.5 million tons,
- Turkey plus 0.5 million tons.
In addition, global wheat stocks increased by 6.4 million tons. so, arithmetically we have an increase in production of 10.4 million tons, to which we attach a growing stock of 6.4 million tons. However, the Euroenxt and CBOT algorithms closed positive, with many trying to position themselves short and thus the support remained… for a while…
But here is what a forecast of over 800 million tons of wheat looks like globally, a volume that has not been reached before and which establishes the foundations of the physical market. Naturally, we will enter a technical area where the futures market will not move like the physical market, so, the basis will widen in the next period.
We believe that the chart we are going to insert is highly suggestive of the moment we are in and can generate inspiration for those trading wheat, a signal that does nothing but predict the future.
As a footnote, we note that the FED has no intention of raising interest rates in June.

LOCAL STATUS
The price indications of feed barley go up to the level of 177 EUR/MT in CPT Constanța parity.
The traction was influenced by wheat, naturally, and by the weather, as the barley harvest will start in 1-2 days, in the south of Romania, if the weather permits.
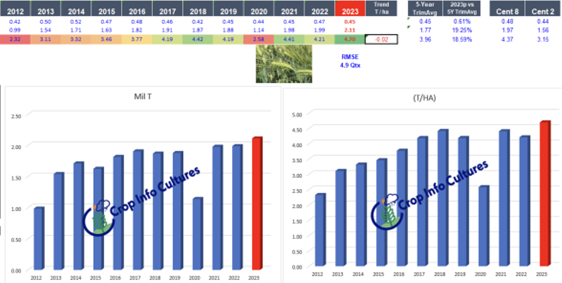
And Romania will generate over 2 million tons of barley production. Our forecast of 1.8 million tons has been revised for some time, and courtesy of Visio-Crop, https://www.visio-crop.fr/, we point you to this positive revision.
REGIONAL STATUS
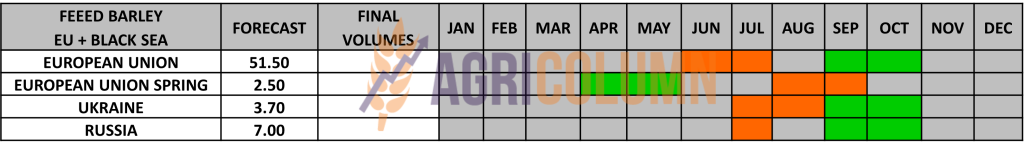
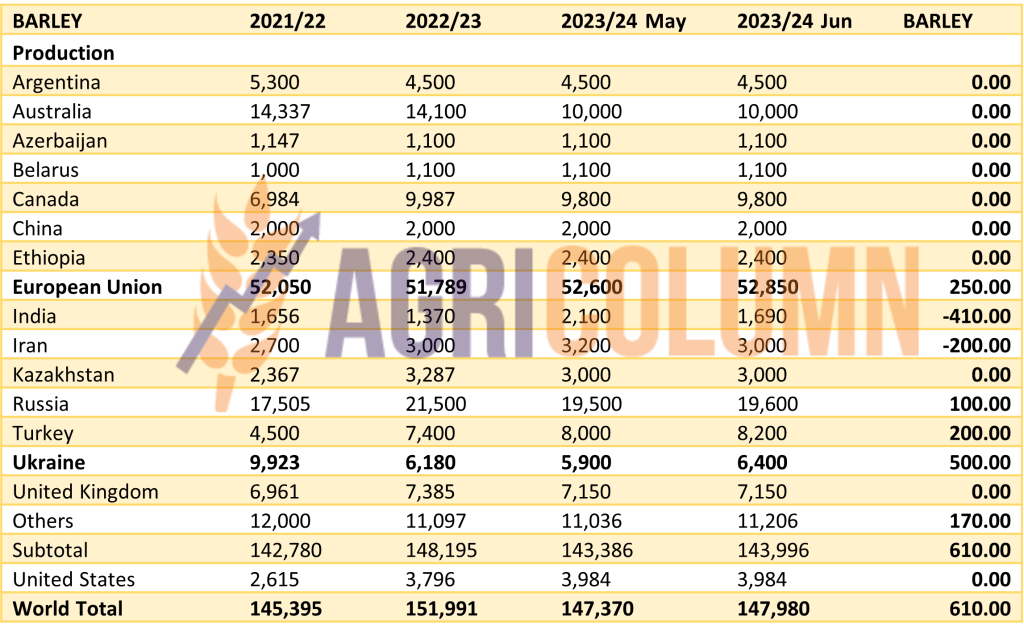
THE EUROPEAN UNION, despite some “first cuts” in the south of France which were disappointing, is quoted by the USDA at the level of 52.85 million tons, up from month to month by 0.25 million tons.
UKRAINE will also produce 6.4 million tons, up by 0.5 million tons. The sowing forecast and favorable timing generated these increases.
TURKEY is also increased in the forecast by 0.2 million tons, to the level of 8.2 million tons.
BARLEY PRICE INDICATIONS IN MAIN ORIGINS

GLOBAL STATUS
INDIA cuts barley crop forecast to 1.69 million tons from 2.1 million tons, down 0.41 million tons.
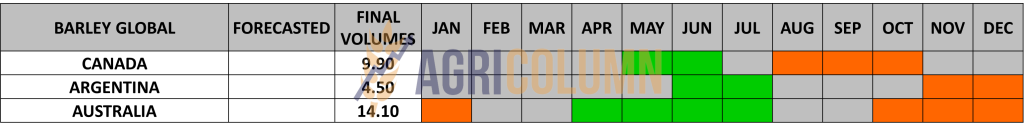
We insert global barley production levels, major players, as well as their volume forecasts, updated month by month, according to the USDA. so, we have an increase of 0.61 million tons from month to month.

LOCAL STATUS
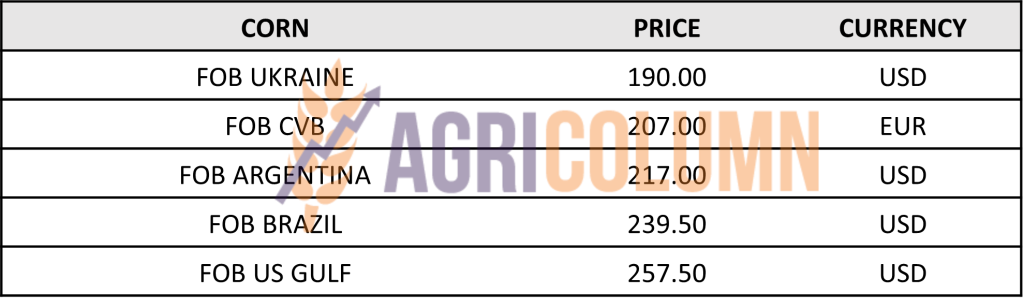
Corn price indications are at the level of 180-182 EUR/MT for the new crop in the CPT Constanța parity.
CAUSES AND EFFECTS
The corn trend has not diluted in the previous week and we estimate the same price level. We remind you that Romanian farmers must start taking their place in the domestic market. The extension of import restrictions until September 15, 2023 is about the last extension, in our estimates, for the simple reason that corn and sunflower seeds from Ukraine start to arrive then. And corn is wanted in the European Union.
Let’s not forget the level of EU corn imports from the previous season, which amounted to 24.6 million tons so, far, and we are 15-16 days away from the end of the season. For the next season, the EU’s interest is not hidden, but clearly stated.
And the date of September 15, 2023 is closer than we could imagine. Moreover, the functionality of the Corridor is extremely limited, so, the brunt of this season will undoubtedly be borne by the Lines of Solidarity.
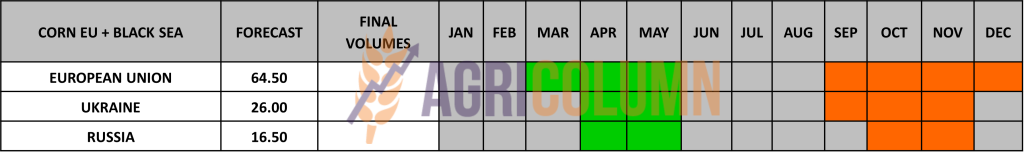
REGIONAL STATUS
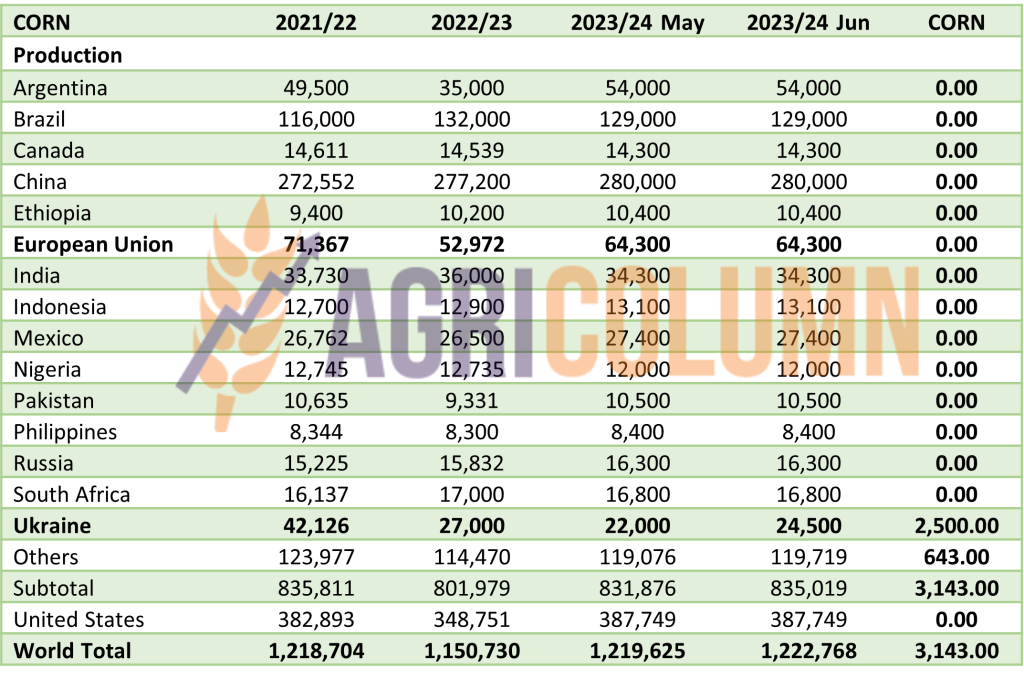
THE EUROPEAN UNION remains in the same forecast regime, 63-65 million tons, with a normal planting rate. The USDA generates a forecast level of 64.3 million tons, and the import of the European Union reached 24.6 million tons, of which the origin of Ukraine holds a share of 13.85 million tons.
UKRAINE has sown a record level of corn. And now let’s remember, our figure of 26 million forecast tons compared to the 22 million that Ukraine was generating. Well, the balance is tipped in favor of our numbers. The USDA raised Ukraine’s forecast by 2.5 million tons to 24.5 million tons. Time will certify if we were right in our estimations.
RUSSIA, for its part, will generate a volume of more than 16 million tons of corn and announces itself as a serious competitor in the destination of China. USDA kept Russia at 16.3 million tons forecast.
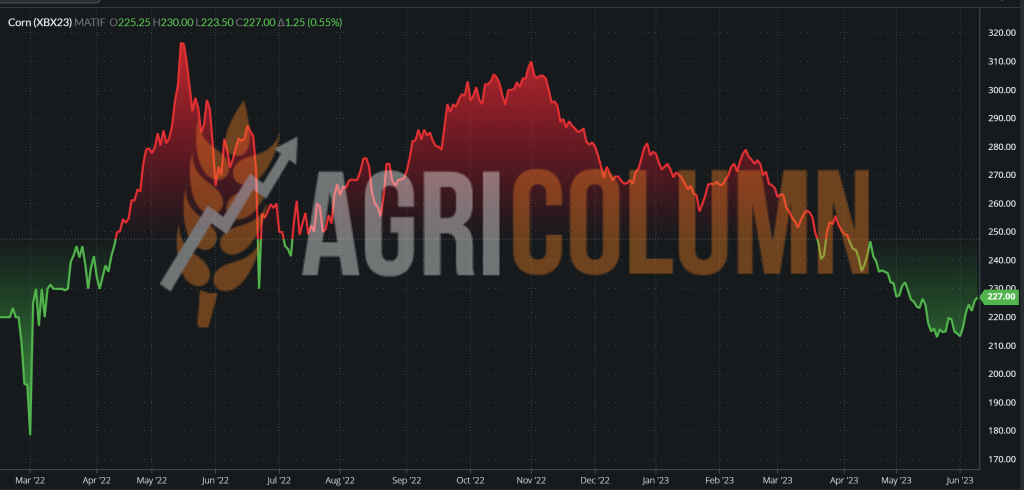
EURONEXT CORN – XBX23 NOV23 – 227 EUR (+10.5 EUR vs. previous week)
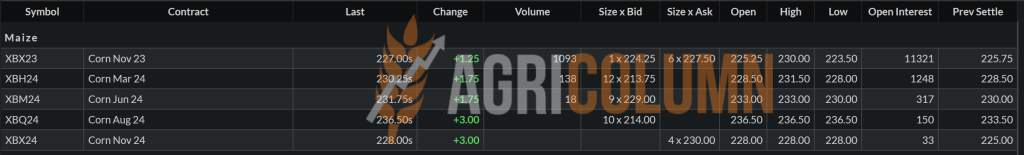
EURONEXT CORN TREND CHART – XBX23 NOV23
GLOBAL STATUS
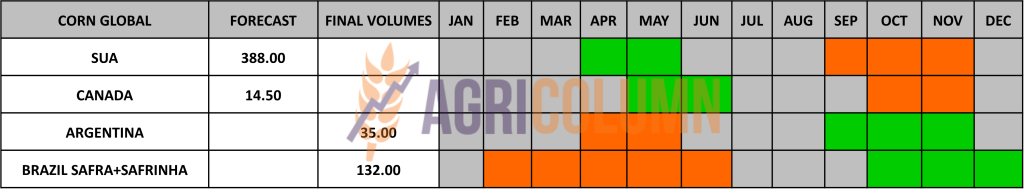
BRAZIL remains unchanged in estimates. However, we have a difference between CONAB and USDA. The premium indicates 132.7 million tons, while the USDA maintains the level of 132 million tons.
The USA maintains the level of 388 million tons, according to the WASDE report. No movement in the negative or positive direction at the moment.
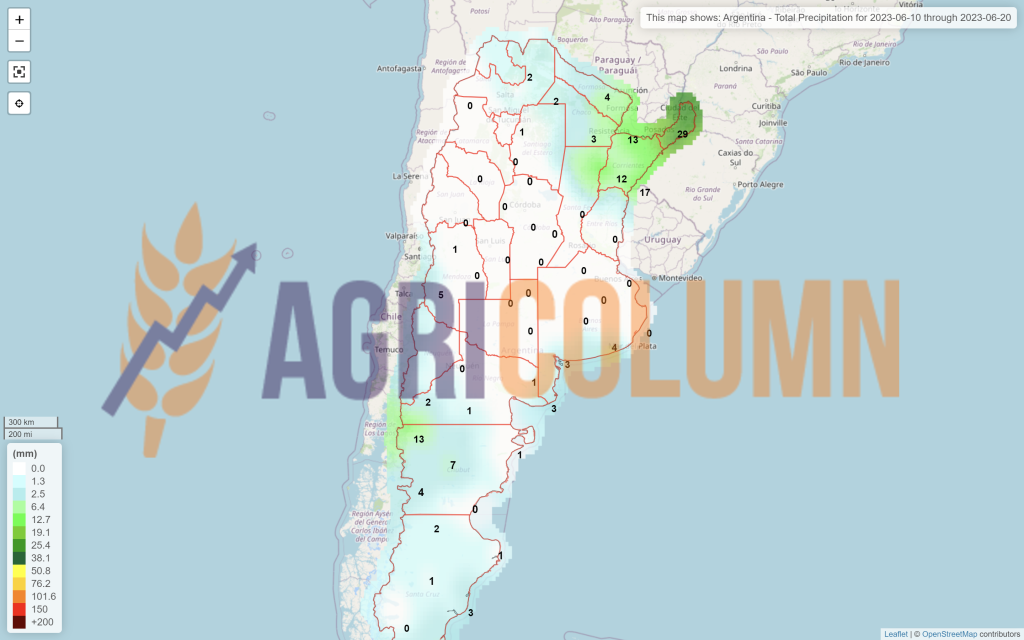
ARGENTINA is down at 35 million tons, a cut of 1 million from the previous USDA report.
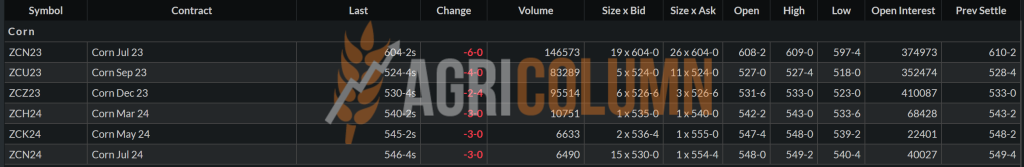
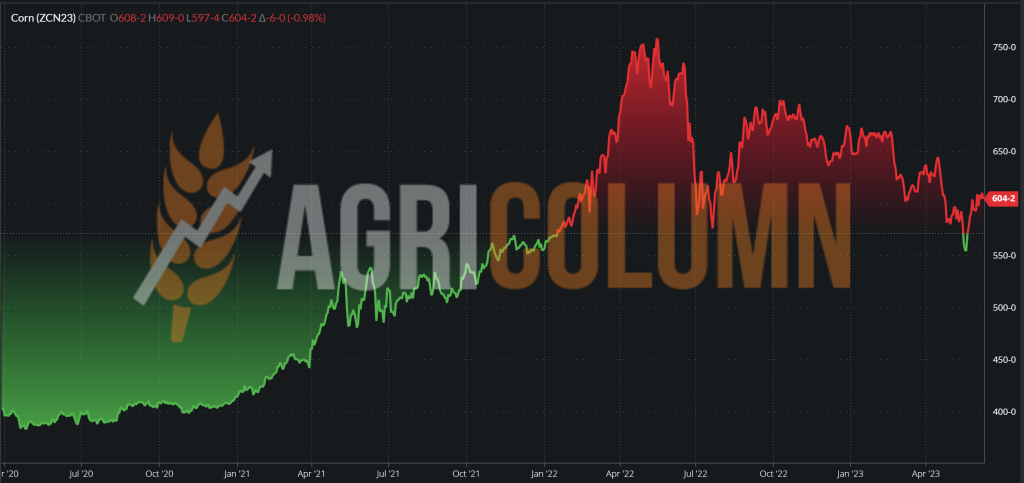
CBOT CORN ZCZ23 JUL23 – 604 c/bu (45 c/bu = +17 USD/MT vs. last week)
CBOT CORN TREND CHART – ZCZ23 JUL23
CORN PRICE INDICATIONS IN MAIN ORIGINS
CAUSES AND EFFECTS – THE STORY
In the case of corn, we remain in the Weather market. It is the basic condition of pricing. For corn, there is still a long time until harvest and many things can happen. But, for the moment, we note the imminent arrival of El Niño with all its effects, which will turn into rains or droughts all over the world.
However, we note and nuance the fact that the European Union will buy a lot of corn from Ukraine, and this is indicated by the extension of the restriction on the import of Ukrainian origin in the 5 neighboring countries until September 15, 2023, when, naturally, Ukrainian corn will be harvested and its shipment to the EU consumption plateau will begin.
And Ukraine was raised in the production forecast by 2.5 million tons, compared to the initial estimate of 22 million tons, so, over 10%. We have, therefore, a picture that will generate volumes of goods through the Lines of Solidarity, the Corridor being an annex that generates nothing but costs (war premiums and stationary time at the Bosphorus). Ukrainian corn exports could thus have a single and large destination, just like the previous season, i.e. the European Union.
Globally, the estimated level of production has been increased, by about 3 million tons, and US stocks have increased, not by much, but they are positive.
Maize is stable for now, it is on a platform that is supported by Weather. We insert a table with global production and a total final figure, higher than the previous WASDE report.

LOCAL STATUS
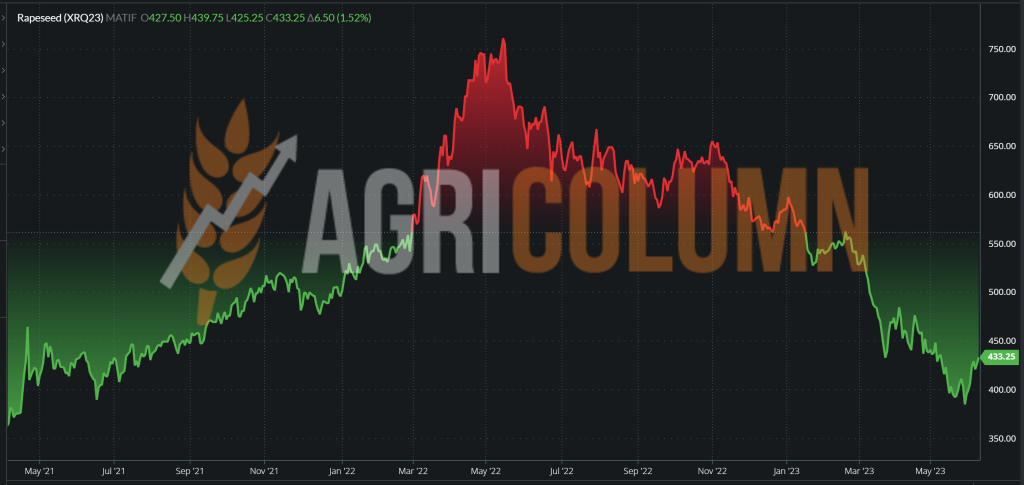
Rapeseed indications are at the level of AUG23 minus 35-40 EUR/MT. Basis is rising again with increasing indications of AUG23.
CAUSES AND EFFECTS
Last week I asked, not just rhetorically, how long the support threshold of rapeseed will hold at the level of 400 EUR/MT and the answers were not slow to appear. A mix of factors has generated a 27 EUR increase in the AUG23 indication, which represents a window of opportunity for farmers.
It is not known how long this growth will last, but we all know the carousel generated by rapeseed, so, the moment must be seized. At the same time, contracts signed at levels lower than this must be fulfilled without fail. Credibility is the last thing we want to be shaken.
And let’s not forget, Romania will generate over 2 million tons of rapeseed in terms of production. This volume is the highest that Romania has generated, historically speaking.
EURONEXT RAPESEED – XRQ23 AUG23 – 433.25 EUR (+26.75 EUR vs. previous week)
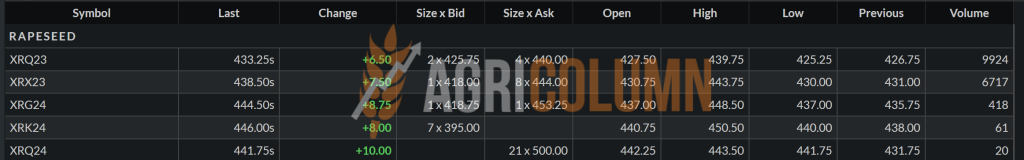
EURONEXT RAPESEED TREND CHART – XRQ23 AUG23
REGIONAL STATUS
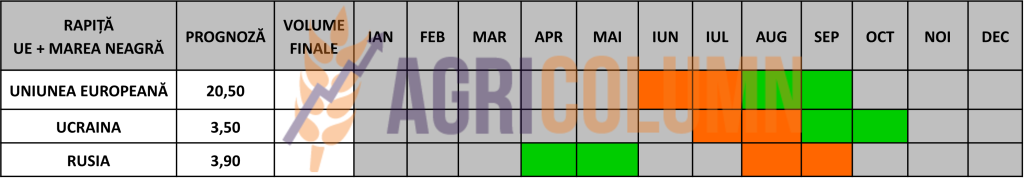
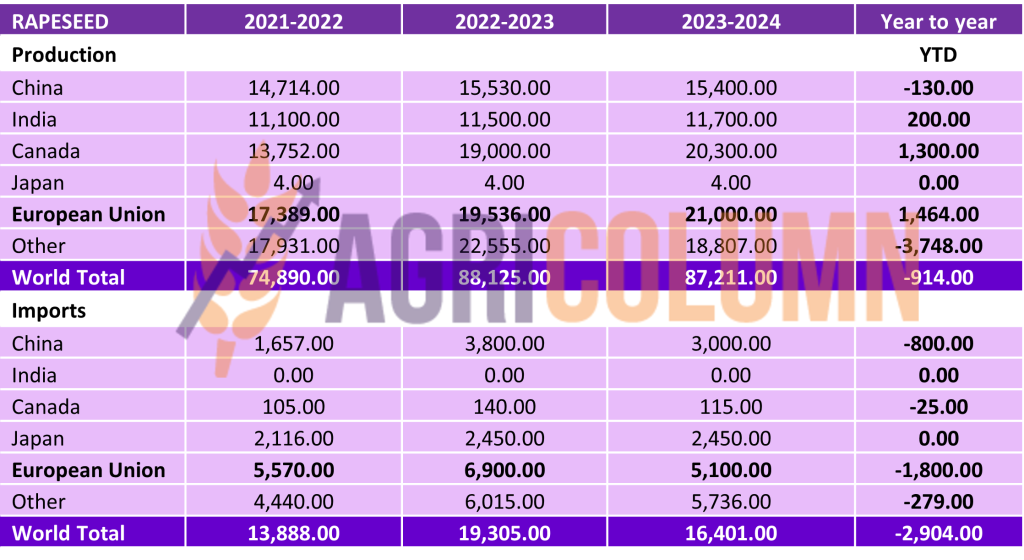
The EUROPEAN UNION indicates the same volume of more than 20.5 million tons. Some reputable analysis houses generate as much as 21.5 million tons.
RUSSIA remains at the forecast level of 3.8 million tons.
UKRAINE indicates 3.5 million tons, a sign that rapeseed was in a good vegetative condition.
GLOBAL STATUS
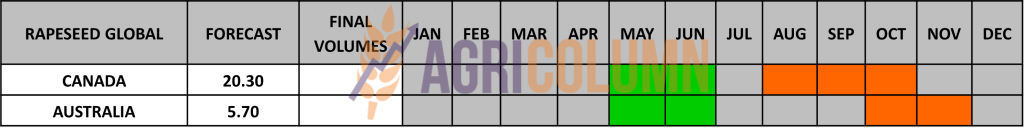
CANADA, according to the USDA, indicates a 20.3 million ton crop forecast.
AUSTRALIA. A question mark remains. Will EL Nino drive production to 4.9 million tons or stay at 5.7? Under observation.
CHINA generates 15.4 million tons, but the entire amount is intended for domestic consumption.
INDIA generates 11.7 million tons also for domestic consumption.
ICE CANOLA RSX23 NOV23 – 656.3 CAD (+22.6 CAD vs. previous week)
ICE CANOLA TREND CHART – RSX23 NOV23
CAUSES AND EFFECTS – THE STORY
Three factors drove rapeseed to the level we see today, and they need to be explained:
OPEC+ has generated a cut starting January 1, 2024 by 1 million barrels per day. But after the OPEC+ meeting ended, Saudi Arabia announced that they will voluntarily test and cut 1 million barrels per day starting July 1, 2023, just as they said, to test for a period of 1 month and, if they see that this will support the price, they will continue to do so, until January 1, 2024.
Within OPEC+, tensions were evident. Russia was considered a ” Free Rider ” who doesn’t follow the rules and sells how and how much it wants and especially where it wants.
But Russia sends oil to Saudi Arabia, which produces diesel, which in turn is exported to Europe. What penalties? What sanctions?
Poor African countries such as Nigeria and Angola have resisted production cuts, financial needs (ie the need for volumes) being far more important than price maintenance in their case.
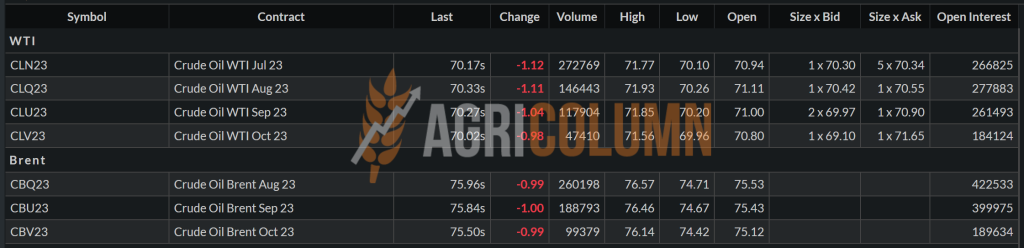
So, we reached the result that I explained above, a fact that provided support for the oil price in Brent and WTI, with direct repercussions in the rapeseed price on Euronext.
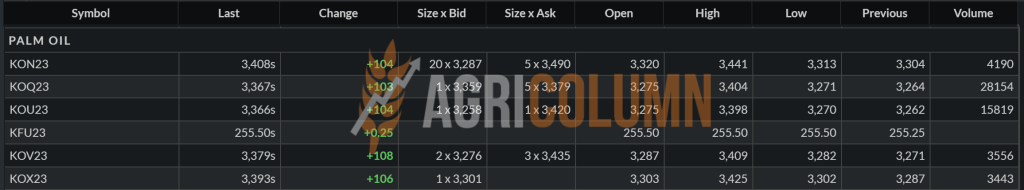
CPO palm oil rose sharply on Thursday and Friday on the Malaysian stock market, fueled by no fundamentals other than stock market regulation in Indonesia, as production and stocks in the two origins are otherwise sufficient. 104 MYR = 22.5 USD.
The final and most impactful factor, however, comes from the demand for Rapeseed Methyl Ester or RME. RME/FAME biodiesel is applied as a biocomponent in the production of traditional diesel fuel. FAME biodiesel is produced in the process of transesterification of vegetable oils with methanol, while RME biodiesel is produced from rapeseed oil.
In Europe, rapeseed futures on the Euronext exchange rose on Friday amid strong gains in rapeseed methyl ester (RME) prices and tensions in the Black Sea.
What’s next? A consolidation of the price of canola until close to the harvest. Because the demand must be covered, and the volumes once validated by harvesting will generate a relaxation of the coverage intention.
From the USDA report, however, we see some imbalance in global canola production. Namely, the lower production this season, but not in traditional Origins, but from distant Australia, which falls in the future forecast from 5.7 to 4.9 million tons.
They even remain firm and with production growth, if we look at the European Union with a year-on-year increase of 1.47 million tons, and Canada with an increase of 1.3 million tons. From other areas, including Australia, we have an offset leading to a reduction of 0.92 million tons in global production year-on-year.
And the import is, in turn, also penalized by 2.9 million tons, the European Union reduces its dependence on imports by 1.8 million tons. Here we are definitely talking about the Australian volumes that will no longer have such a high weight in EU imports, but, for sure, Ukraine will keep its role and place as a supplier for the European Union.

LOCAL STATUS
Port Constanța is quoting old/new crop sunflower seeds at 385-390 USD/MT.
CAUSES AND EFFECTS
Sunflower seeds are once again building a bridge towards the 400 USD/MT level, fueled by the fuel from soybean and palm oil, fellow Vegoil complex.
Today, the state of vegetation in Romania is very good and the forecasts we reaffirm on this occasion lead to an excellent crop of over 3 million tons, more precisely 3.3 million tons.
In the same context, we must understand that the price support is also given by the ban on the import of seeds from Ukraine, an aspect that strengthens the demand from Romania, and we believe that it is a very good moment for Romanian farmers to capitalize on this time. Because after September 15, this restriction will no longer be extended. The Union needs Corn and Sunflower Seeds, so, surely there will be no further extension of the extension. And the processing units need the goods, so, the demand is there.
REGIONAL STATUS
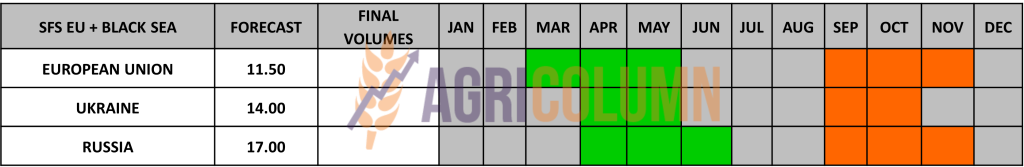
UKRAINE remains firm in the same forecast of 14 million tons, with potential for growth, according to the weather factor.
RUSSIA has finished sowing 9.3 million hectares of the 9.5 allocated to the sunflower crop. With a yield close to 1.8 tons/ha, they will generate 17.1 million tons. Everything that will exceed this yield per hectare will be a bonus for Russia, which will consolidate, to the detriment of Ukraine, its market share in the sale of crude oil.
EUROPEAN UNION remains stable at a volume forecast of 11.5 million tons. Vegetation status is satisfactory to good at this time and no problems are indicated in the near term.
GLOBAL STATUS
Out of season.
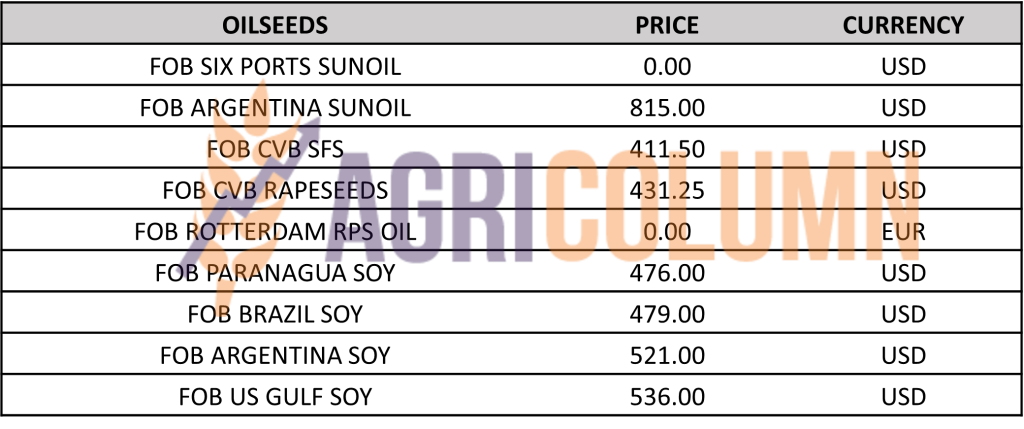
PRICE INDICATIONS FOR OILSEEDS AND CSFO IN MAIN ORIGINS
CAUSES AND EFFECTS – THE STORY
Seed prices have benefited from price support, 10-15 USD/MT, for two reasons that fall under the category of Agribusiness market factors, namely Supply and Demand and the Political factor.
Thus, the Vegoil complex supported the price of sunflower oil. Ukraine sunflower oil prices were also slightly firmer on a CIF Turkey basis, with offers reported at 785 USD/MT CIF Mersin, 770-775 USD/MT CIF Izmir and 770 USD/MT CIF Marmara, while what buying interest was observed at USD750/MT CIF Izmir. Call me Six Ports was quoted at 890 USD/MT for Q3 and 940 USD/MT for Q4 2023.
And the political factor strengthens the price of seeds. The ban on the import of Ukrainian goods, including sunflower seeds, has caused Processors and Traders to shift their focus to domestic origin.
These two factors combined may team up for a while in sunflower seed prices. But for how long? Because September 15 is extremely close and surely the import restriction will not be extended any longer. The Union needs corn and sunflower seeds as well as crude oil. The corridor is no longer a viable option. The lines of solidarity are the perfect screen for the origin of Ukraine.
Globally, sunflower seed production remains within the same parameters, i.e. 54 million tons, but is 3 million tons higher than the previous season. And the competition in VegOil is extremely high between palm oil, soybean oil and sunflower oil.

LOCAL STATUS
In Romania, the price indications for soybeans are at the level of 475 USD/MT, DAP processing units for non-GMO soybeans.
REGIONAL STATUS
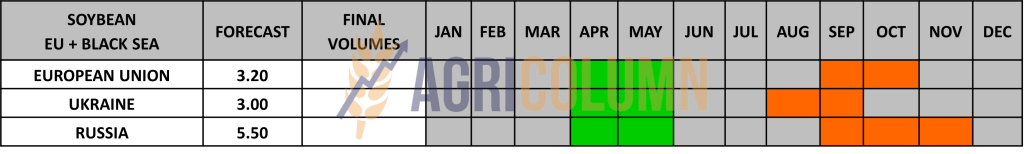
THE EUROPEAN UNION. Total imports of soybeans in this trading season reached 12,033,000 tons, and soybean meal exceeded the level of 14.64 million tons.
GLOBAL STATUS
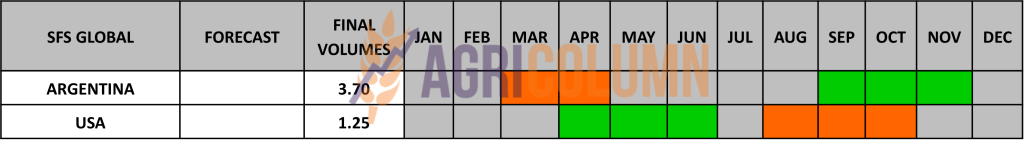
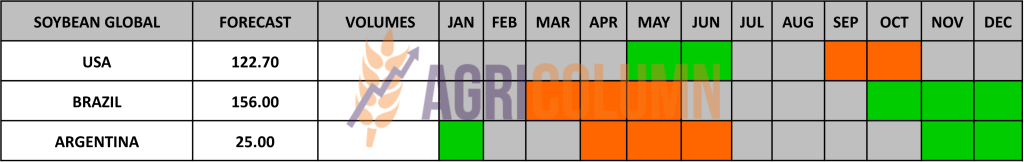
ARGENTINA is already a closed case; 25 million tons is the end of an extremely sad season for Argentine farmers.
BRAZIL rises to 156 million tons, partially offsetting Argentina, which drops 2 million tons, according to the USDA.
The USA sees no material changes in the production forecast and remains stable at 122.7 million tons.
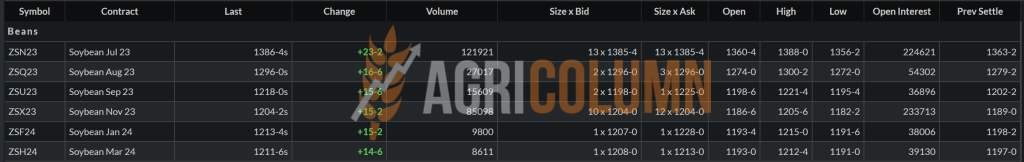
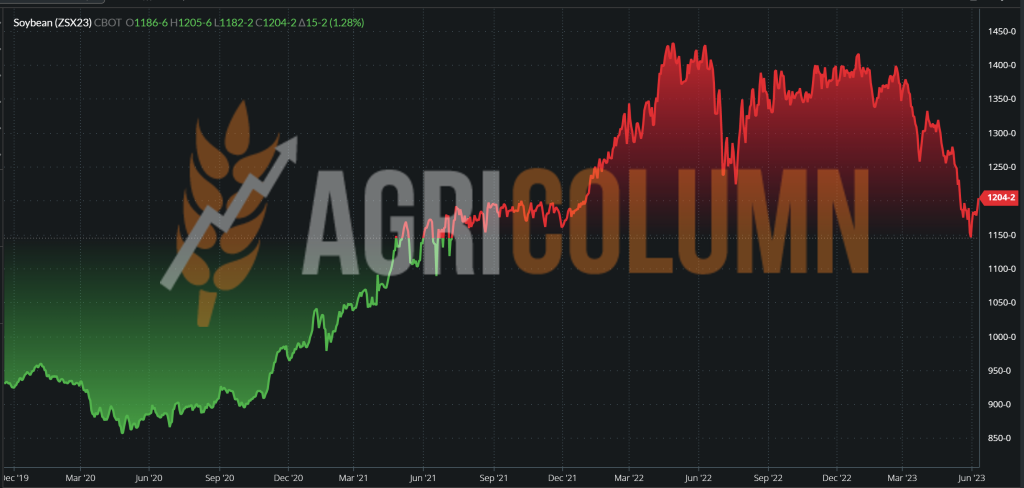
CBOT SOYBEAN ZSX23 NOV23 – 1,204 c/bu (+20 c/bu vs last week)
SOYBEAN CHART TREND – ZSX23 NOV23
CAUSES AND EFFECTS – THE STORY
The forecast of 410.6 million tons for next season stands. Today, however, the price of soybeans is fueled by the drop in production levels in Argentina by another 2 million tons, which generated the rally in the stock market immediately after the report. Brazil compensated by 1 million tons, but not enough for demand for soybeans and soybean oil, which in turn provided support in the VegOils complex.
The weather remains the main risk factor in the coming period. The return of El Niño is the major sign that all farmers in the northern and southern hemispheres of the Americas are waiting for.
The Weather Market for soybeans, as for corn. But if the Weather plays its part correctly, today’s price level could easily be just a memory.


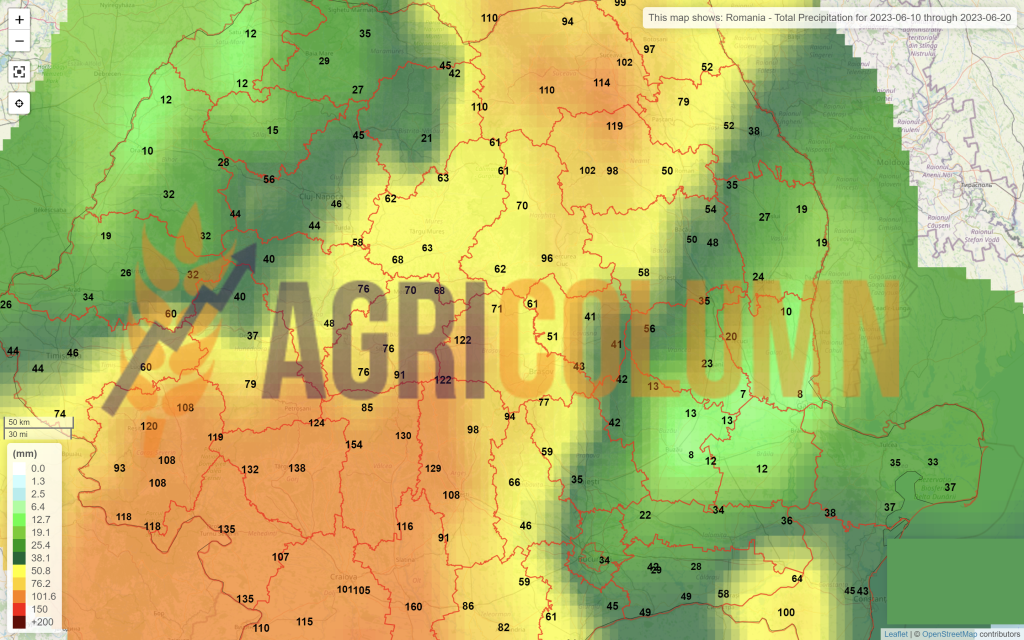
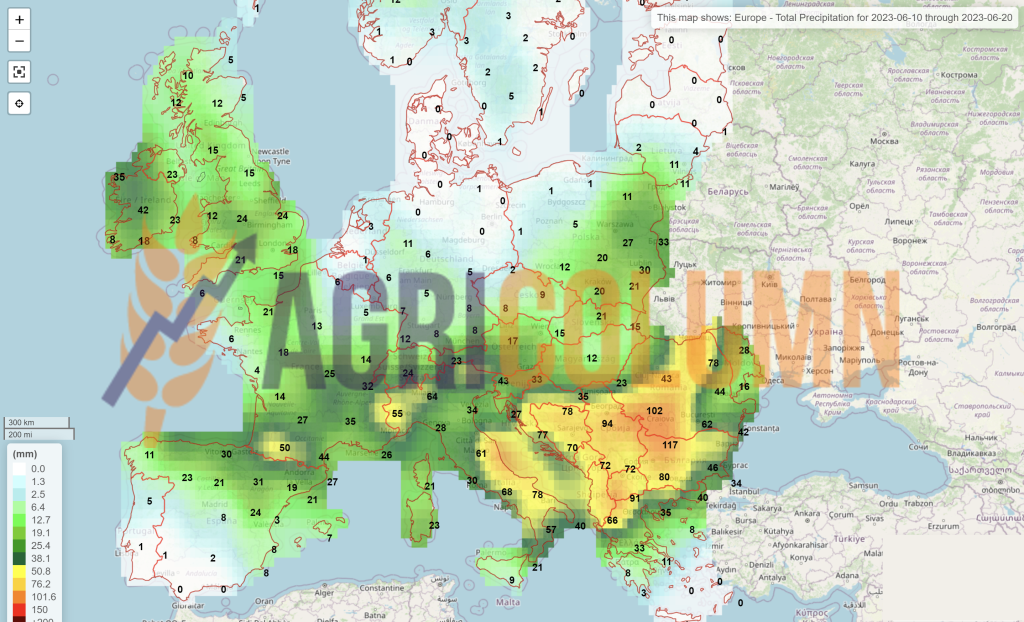
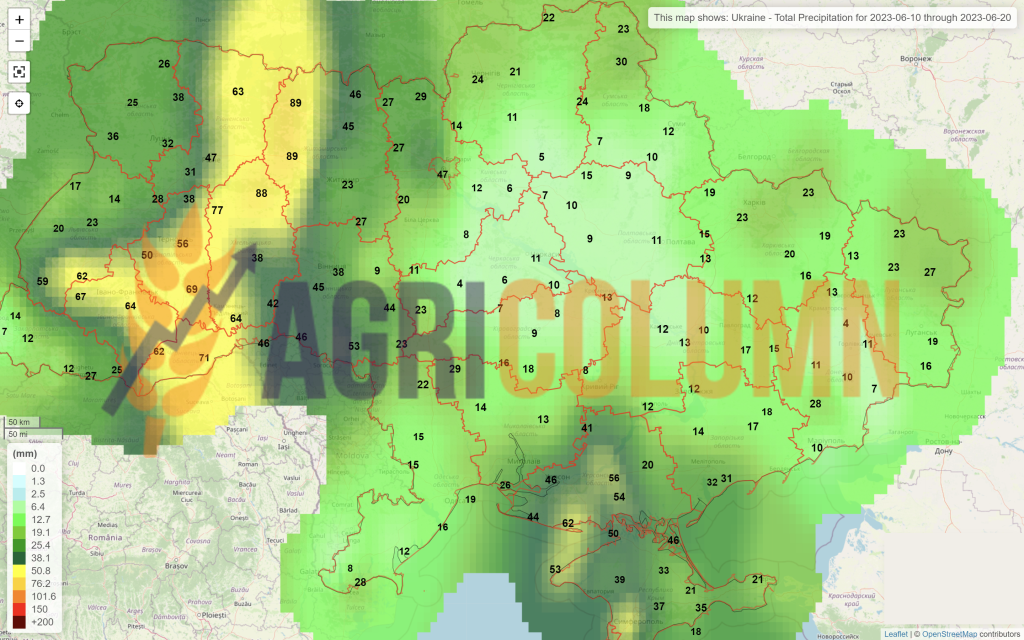
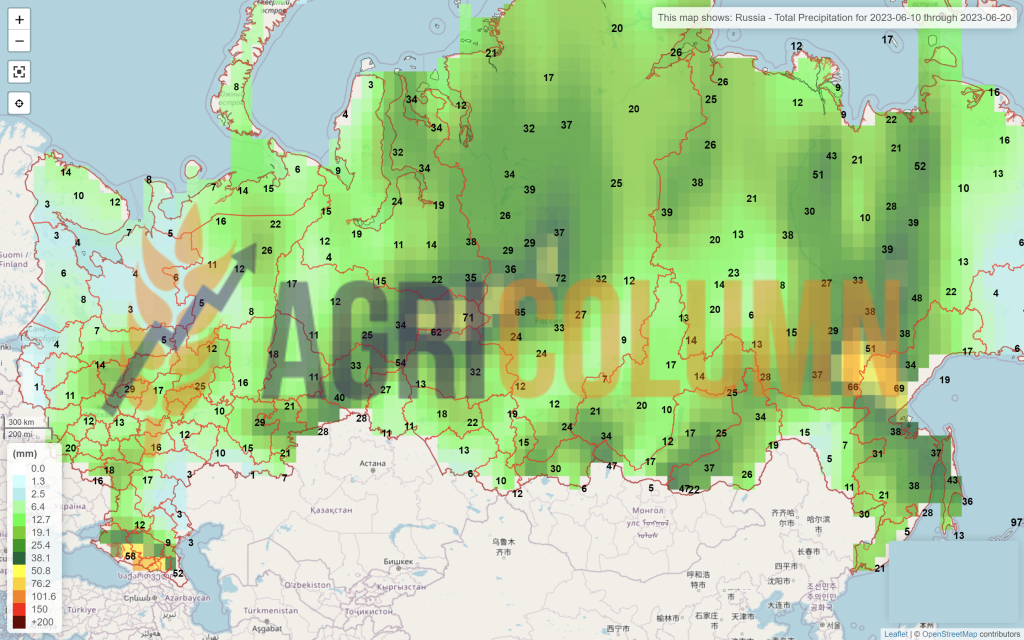
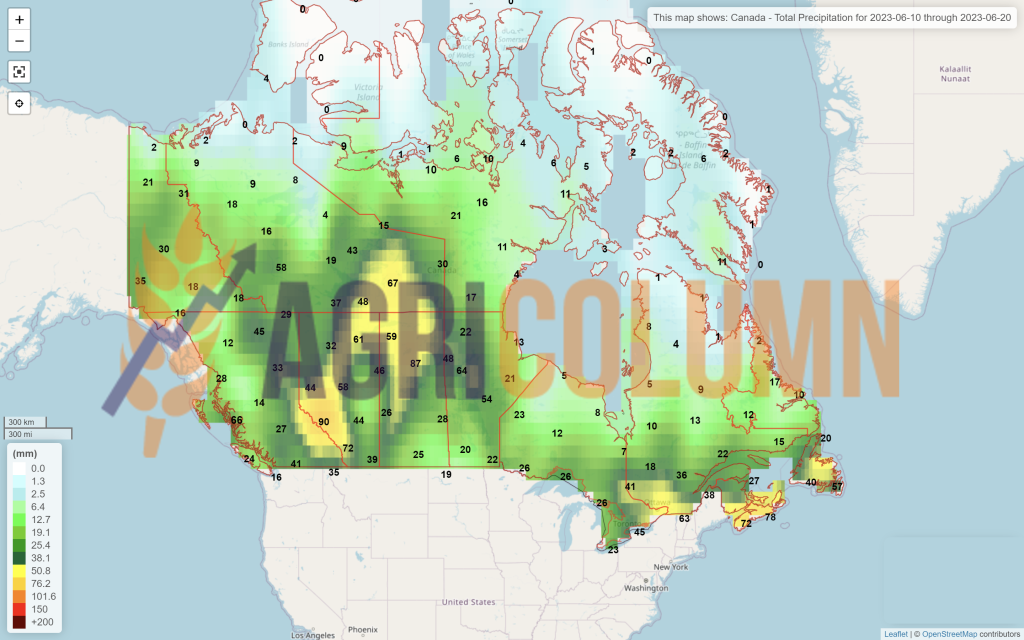
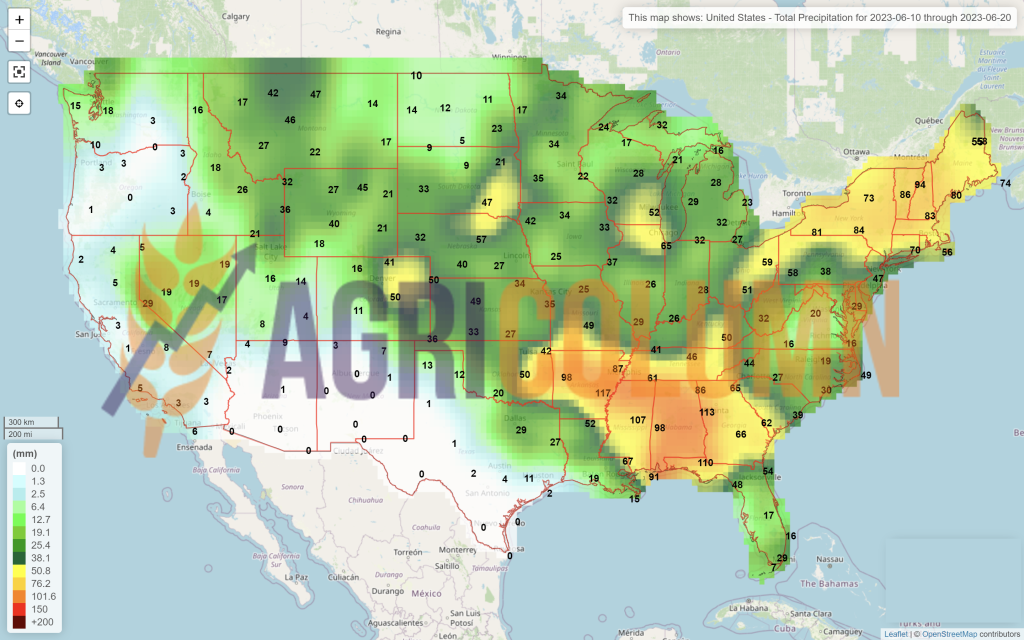
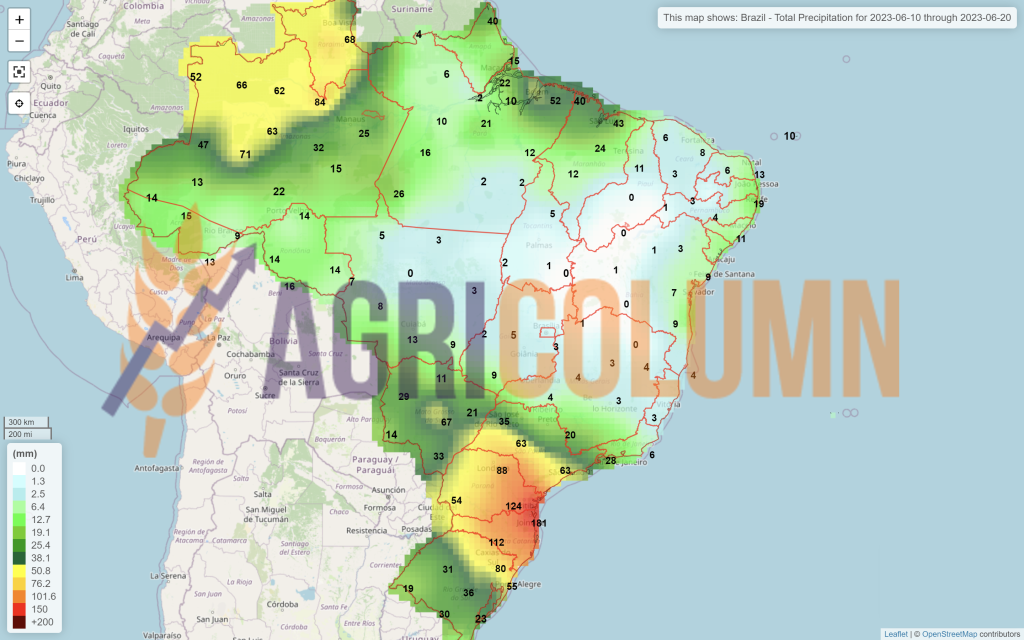
10-20 June 2023
Romania
Europe
Ukraine
Russia
Canada
USA
Brazil
Argentina
China
Australia