This week’s market report provides information on:
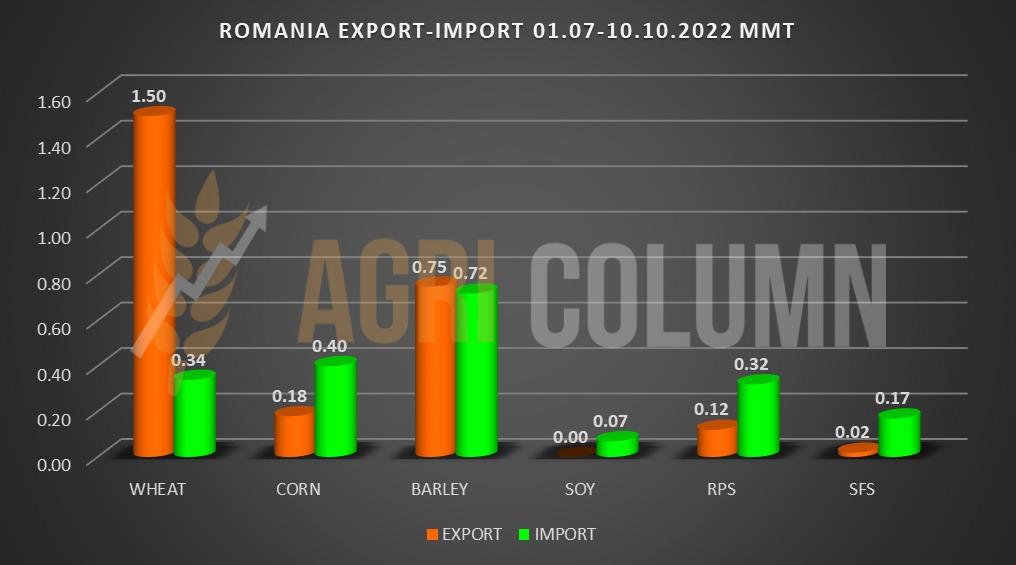
ROMANIA. EXPORT-IMPORT BALANCE

LOCAL STATUS
Milling wheat price indications followed a downward path, based on Euronext developments. The established formula DEC22 minus 16-17 EUR/MT formed the basis of the price offers in the CPT Constanța parity. In other words, the price of 325-327 EUR/MT is a negotiation basis for the sale of goods. The discount for the feed quality is kept at the same level of minus 25 EUR/MT compared to the main quality (milling). It’s a very high level of discount, but it has reverberations from other areas of the world where the potential for low-quality harvests is growing stronger by the day.
The domestic market is also particularly active these days. We note indications of 335 EUR/MT FCA Farms for very good quality, implicitly protein over 12% and a test wieght over 80 kg/hl.
CAUSES AND EFFECTS
At least a week from now we shouldn’t see much movement in the market. The main reason is the regional concern for the Middle East tenders. And their suite is completed by demand from Asia, more precisely Pakistan. The polarization of interest in local wheat will manifest itself, but the price regime will not know higher values than what is being traded these days.
And this decrease parameterized by Euronext makes the Romanian wheat competitive in the regional transactions. An illustrative example is an attempt by Egypt to buy directly that did not materialize. There, Romanian wheat indicated better values by 4 USD/MT for CIF Egypt deliveries, compared to the number 1 competitor in the basin, Russia. Comparatively, however, in FOB parity, Russian wheat was much cheaper. The difference that created an advantage for Romanian wheat was generated by Romanian logistics, which implied lower costs by 20-30 USD/MT. Once again, Romania indicates iron health and predictability in the Black Sea basin. Unfortunately, the sale has not yet materialized and the parties are still debating.
REGIONAL STATUS
RUSSIA becomes particularly competitive and the month of October positions it at an extremely high export level of around 4.5 million tons. The discounts applied and its “friendly” destinations favor it in this whole. TMO’s last tender channeled around 500,000 tons of Russian wheat at 295 USD/MT FOB parity. Of course, there is still a long way to go before the expected export norm is met. The values of 47.5-50 million tons are still far away. So far, we have values of approximately 14.5 million tons in the Russian export basket.
Another favorite destination of Russia is Iran. Through traffic on the Caspian Sea, Russia will generate 5 million tons of export level to this destination. And as payment, Iran will generate drones and missiles to Russia. These tools of war are cheap and aid the Russian war machine in its attempts to systematically destroy Ukraine’s energy infrastructure.
With many promising destinations already in its portfolio, Russia is changing the export tax. The MOEX (Moscow Stock Exchange) index is up at 310 USD/MT and the fee rises to 49 USD/MT for this week starting Wednesday, to be precise.
At the level of carry-over, i.e. extra goods accumulated from the rest of the past crop and surplus of the current crop, Russia has a surplus of 25 million tons. This coupled with problems in sowing times and farmers’ reluctance to see the profitability of the wheat crop lead to an estimate of the future harvest volume of only 82-84 million tons (summer 2023). Thus, Russia loses about 0.7-0.9 million hectares intended for sowing with wheat in the fall of 2022 and summarizes the sowing at the level of 18.8 million hectares.
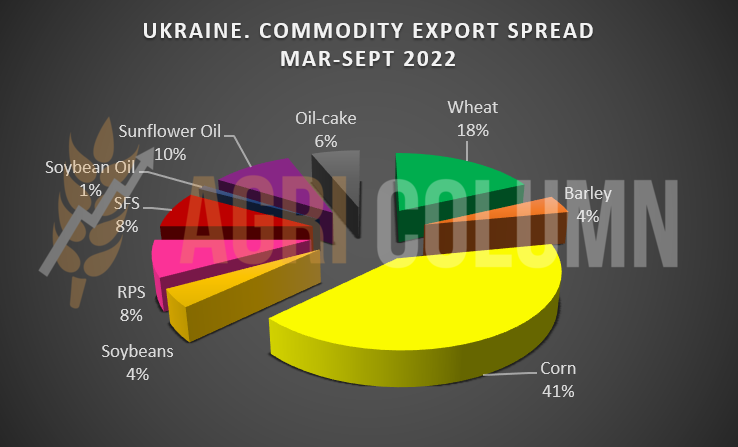
UKRAINE also develops sales of wheat. With a completed harvest and a March-October wheat export level of around 5 million tons, we believe that they did exceptionally well under the given conditions, with a Russian invasion of the wheat-predominant territories.
UKRAINE EXPORT CHART. MARCH-OCTOBER 2022
EUROPEAN UNION is still in full sowing season, and in the next issue we will present the data from each member country in terms of hectares sown in the autumn of 2022.

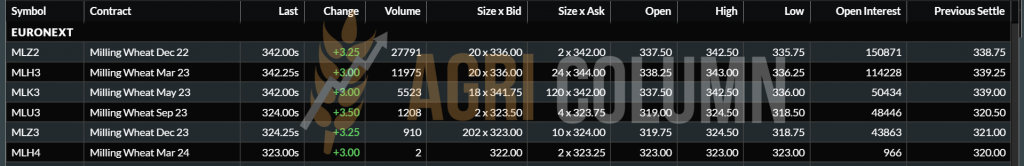
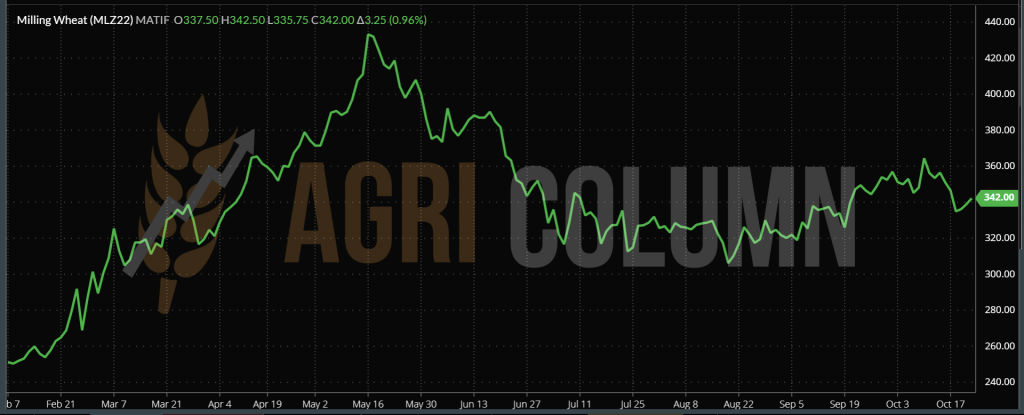
EURONEXT MLZ22 DEC22 –342 EUR (+3.25 EUR)
WHEAT TREND CHART – MLZ22 DEC22
GLOBAL STATUS
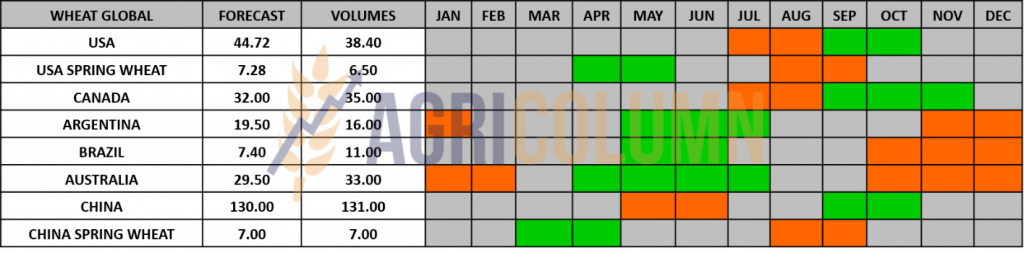
CANADA closes harvest with the estimated level of 35 million tons
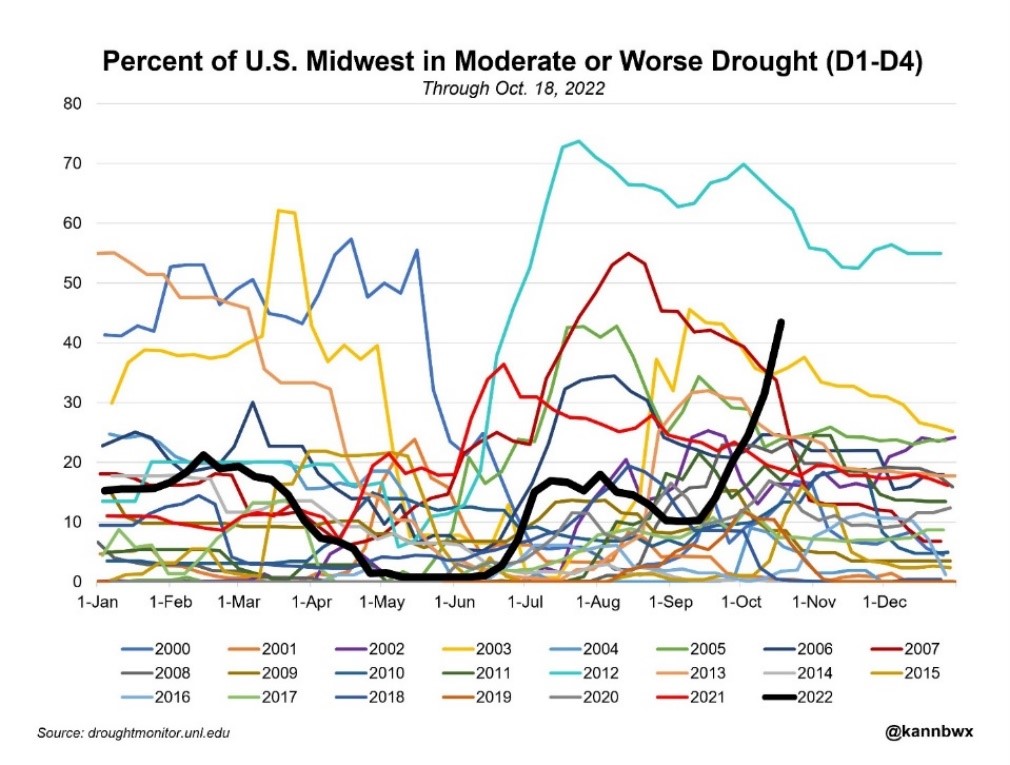
The US is having particular problems with winter wheat, as they call it, because of the drought. The most affected area is Kansas, where wheat has an extremely high share. The development of the drought phenomenon is progressing and dark clouds are already being announced for the American wheat season of 2023. La Nina is once again a merciless arbiter, penalizing the world’s food in characteristic style. With planting about half complete, the 2023 US SRW winter wheat crop is already affected by drought in the central Southern Plains.
Seeding plans could be scaled back in the US despite high prices. The drought threatens Kansas, the top winter wheat growing state, and Oklahoma in two ways: it discourages farmers who haven’t yet seeded to try, while it threatens already-sown crops to develop properly.
“It’s kind of a bleak situation,” said Kent Winter, who farms in Andale, Kansas, outside Wichita. He said he normally plants by mid-October but has yet to plant wheat this year.
If there is no rain in the next 10 days, the crop will begin to decay.
MidWest US drought graph – black line indicates 2022. Via Karen Braun
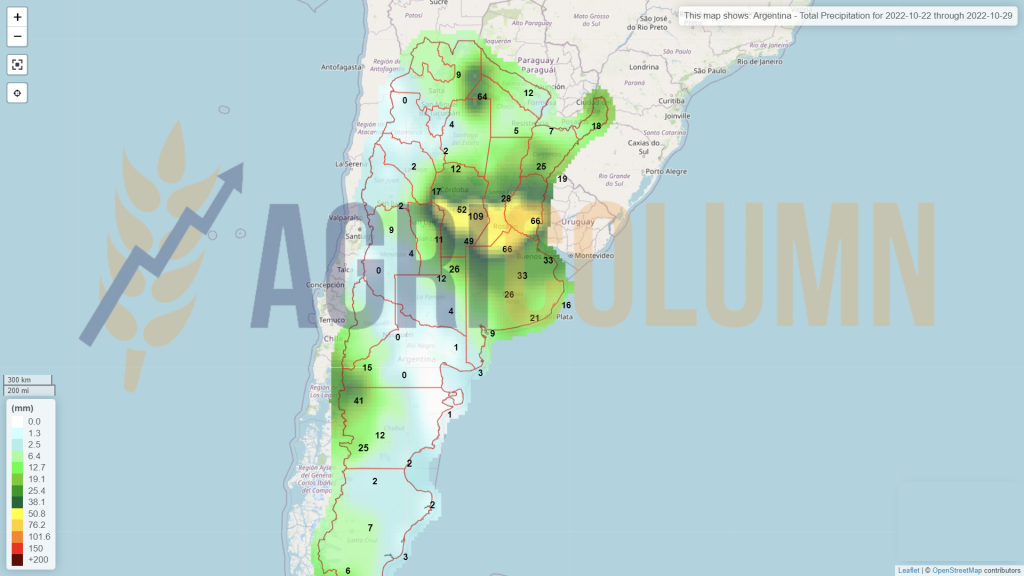
ARGENTINA declines further in terms of wheat harvest volumes. The latest indication is only 15 million tons, compared to 16 million the previous one. And the degradation will continue, for sure.
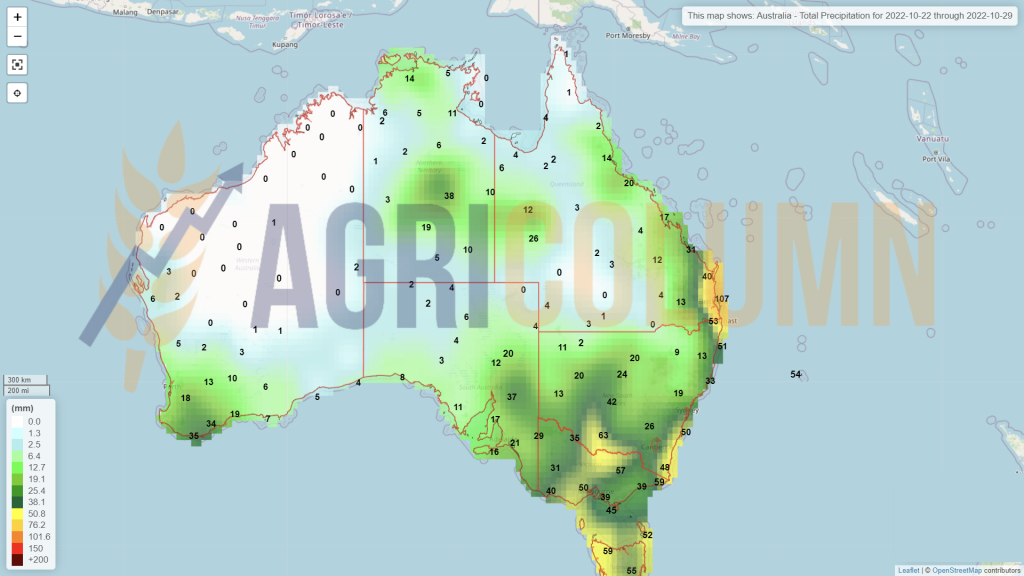
AUSTRALIA is experiencing rainfall issues and New South Wales is a telling example of this. The quality of Australian wheat is clearly degraded, even though volumes will perhaps exceed 33 million tons. But incessant rainfall also jeopardizes the harvest season by delaying it, which will favor mold and sprouting in the field.
IRAK generates a demand of 5 million tons of wheat. Much of it will certainly be an American affair, for already Russian wheat is completely excluded.
PAKISTAN in turn generates demand of 500,000 tons through a tender.
SAUDI ARABIA also enters the game and generates demand for 535,000 tons of wheat. But appearances also lead to a Russian origin, taking into account its OPEC+ partnership with this origin.
INDIA, which claims the sufficiency of domestic wheat stocks, has just purchased a batch of 50,000 tons of wheat from Australia, a sign that things are not exactly as they say. And it should be so, if we remember the killer heat wave that destroyed much of India’s wheat crop.
JORDAN sees its strategy and has purchased a batch of 60,000 tons of Romanian origin at the level of 374 USD/MT in CIF Aqaba parity for delivery in March 2023, after two unsuccessful purchase attempts.
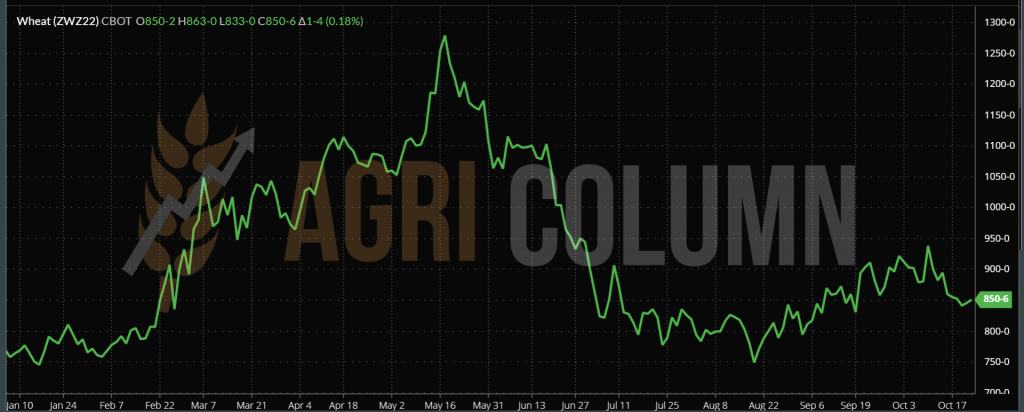
CBOT ZWZ22 DEC22 – 850 c/bu (+1 c/bu)
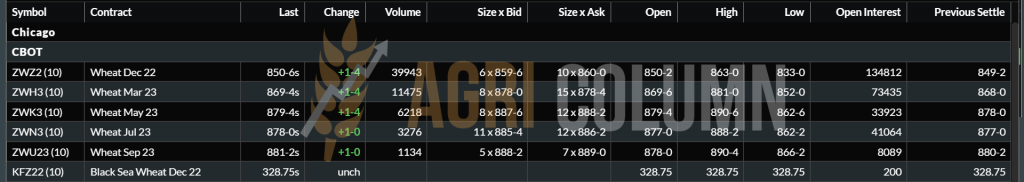
WHEAT TREND CHART – ZWZ22 DEC22
WHEAT PRICE INDICATIONS IN MAIN ORIGINS

CAUSES AND EFFECTS
BLACK SEA BASIN
The Black Sea basin begins to boil, in the context in which the sabotage of the green corridor by Russia is extremely visible. The delay and lack of interest in carrying out inspections at the Bosphorus entry level for Ukrainian goods from the Humanitarian Corridor creates delays of 23-25 days from the moment of shipment by Ukraine through the created corridor to the crossing of the Bosphorus. Thus, we have clusters of ships that are actually anchored or drifting near the Bosphorus channel. Their number is already 160-170.
Russian inspectors generate only 6-7 inspections per day, which seriously damages shipping convoys. Shipowners are already no longer interested in sending ships to Odessa-Chornomorsk-Pivnyi. Every day we are getting closer to the expiration of the 120 days and we may see no more ships calling at the three ports starting November 1, 2022. The loading time and extremely long inspection time will lead to exceeding on November 22, the deadline for the green corridor. And until this moment, we have no certainty that this Istanbul Agreement will be extended, and in this case, no one will risk sending ships that will be arrested in the three ports by conducting a blockade by the Russian navy.
Moreover, the accusations flow from the Russian side, starting with the absolutely absurd hypothesis that the explosive that detonated the bridge over the Kerch Strait would have been trafficked on a ship from the green corridor, passing over those related to the destinations of goods leaving Ukraine and reaching those related of the fact that the explosion at the bridge in Kerchi endangered the Russian green corridor.
Let’s take them one by one and explore them, as analysis is necessary at this point:
- The explosion of the bridge over the Kerch Strait. The allegation that the origin of the explosive is from a ship in the corridor is completely absurd. We don’t think there was a need for a ship to bring the explosives to Odessa. Ukraine has enough explosives from other sources. There was no need for someone to bring them in a ship from the humanitarian convoys.
- Destinations of goods. These are varied and indeed do not favor poor countries. But if we look at Turkey, we will see that it is a major beneficiary. Therefore, Russia should not generate such accusations, given its close relations with Turkey, which will also generate a gas distribution hub in the future.
- The explosion in Kerchi endangered the Russian green corridor. We would simply ask: which Russian green corridor? No one knows what Russia signed with the UN and Turkey in Istanbul in July. Which Russian Green Corridor? This statement is completely absurd.
THE AGGLOMERATION OF THE BOSPHORUS. Bottom left. Source: marinetraffic.com
As a summary of these multiple causes, we would say the following:
- Russia must sell wheat and fertilizers.
- Russia has no sanctions on the export of wheat and fertilizers.
- Russia, on the other hand, has sanctions targeting bank transfers, being disconnected from payment systems.
- Russia also has sanctions imposed on the oligarchs who own the large fertilizer production complexes, and they cannot generate commercial traffic and by default banking for receiving the money resulting from the transactions.
- The Americans would agree in principle to take liquid ammonia from the Russian border with Ukraine and operate it through Odessa-Pivnyi-Chornomorsk thus favoring one of the Russian demands.
- The UN is trying to negotiate between the parties to harmonize commercial interests with humanitarian ones, but the problems they encounter are quite big, because the money resulting from the Russian wheat trade via the Caspian Sea returns drones and missiles of Iranian origin. And Russia declared that if the UN sends teams of experts for the definite identification as being of Iranian origin, they will stop the negotiation process for the extension of the green corridor. But today, the end of the war seems extremely far away. The war in Ukraine will last long and well.
Russia attacked Ukraine’s energy infrastructure.
Factories will only work according to a predetermined schedule, including sunflower seed processing units. Armament productions destined for Ukraine have delivery dates in the summer of 2023. There will be another 2-3 weeks of fighting. Then at minus 35 degrees everything will freeze. The thaw will bring the swamp from the thaw through which no one passes.
Russia mobilized not only 300,000 reservists, but 1 million. Ukrainian marketing only points to Russians’ stupidity and losses. They also have the same death toll as the Russians – 60,000. The current problem is the Iranian drones which are very cheap and cause immense damage. It doesn’t matter that the Ukrainians shoot drone swarms with Kalashnikovs, the drones’ 40% efficiency and low price make them effective, very effective.
ARGENTINA and AUSTRALIA are two other areas of impact in the future development of the wheat price trajectory. The first will generate a minus in overall production, and the second will generate poor crop quality, compounded by a delay in harvesting.
CONCLUSIONS
Russia has no standing in the Istanbul Agreement signed between Ukraine-UN and broker Turkey. It has its own separate agreement. Russia can block the continuation of this agreement, which can continue if none of the signatories denounces it, only by the typical aggression, that is, the establishment of a naval blockade in front of Odessa.
Russia is interested in selling wheat and fertilizers, but the European Union does not seem willing to give in to the usual Russian blackmail, and thus the desire to sell fertilizers on the territory of the European Union is met with total opposition. Moreover, the Union admitted that the drones attacking the cities and infrastructure of Ukraine are of Iranian origin and are preparing sanctions against the regime in Tehran.
Turkey has every interest in Russia developing a gas distribution hub on its territory with its competition, and thus will try to convince Russia not to block the continuation of the Ukrainian corridor.
The tension will continue until around November 10-15, when we assume that Russia will agree to keep the corridor open, with certain conditions, of course. Why do we have this assumption? Winter is approaching, and battles and deployments will no longer be possible in the operational theaters. At minus 35 degrees, things will calm down. Both sides will go into conservation, and hostilities will resume in the spring, more precisely March 2023. Meanwhile, Russia will strengthen its military and potential, and Ukraine will receive investments in armaments and training of its own soldiers. All the while, the economy needs to work, and Russia cannot afford new sanctions. What they are doing now is nothing more than blackmail to get something they want, which is the fertilizer trade, because their wheat is moving to destinations.
It is extremely simple. Russia has wheat and Ukraine has corn. Interests diverge in this regard and winter creates a lot of problems in Russian and Ukrainian ports. Azov freezes, parts of the Black Sea become impassable, and both combatants need to restore their weakened financial systems.
All this time, the trading algorithms have been long-positioned waiting for the tension that will lead to an increase in the price level on the stock exchanges, so that Profit Taking can take place and thus the profit of the hedge funds can be consolidated.

LOCAL STATUS
The price indications of feed barley in Constanța decreased by a level of 10 EUR/MT. From 295 EUR/MT, it is now at 285 EUR/MT, in line with the price of milling wheat.
REGIONAL STATUS
Jordan cancels another barley tender. Participants: Cargill, Viterra and Olam. The next auction will be held on October 26 for delivery in the second half of December 2022 and January 2023.
BARLEY PRICE INDICATIONS IN MAIN ORIGINS

GLOBAL STATUS
This year Argentina will reach a new record of barley exports. From 1.6 million hectares planted and 5.2 million tons harvested, exports could exceed 4.1 million tons between malt, barley and feed barley, surpassing the 2012 record.

LOCAL STATUS
The indications of the port of Constanța are maintained at the level of 300 EUR/MT. Maize is on a price platform well cemented by global factors and is not losing more than 5 EUR/MT in the current context of falling wheat prices (generated by the tempering of emotions caused by Russian missile attacks on Ukrainian infrastructure). Domestic market quotations remain at the level of 270-275 EUR/MT, depending on the positioning of the farm selling these quantities of goods and the logistic access.
CAUSES AND EFFECTS
Reduced availability creates the conditions to support the price of corn at the local level. Even if the Ukrainian flows plow Romania, the potential of Romanian corn remains in its place due to its origin, i.e. the fact that Romanian corn is not genetically modified. Regional factors are supporting the current price level and even if we see some bumpers, the small size of the crop will continue to generate demand.
REGIONAL STATUS
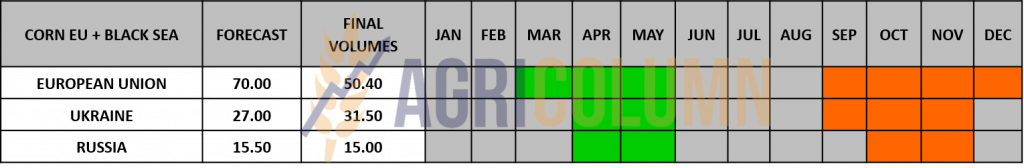
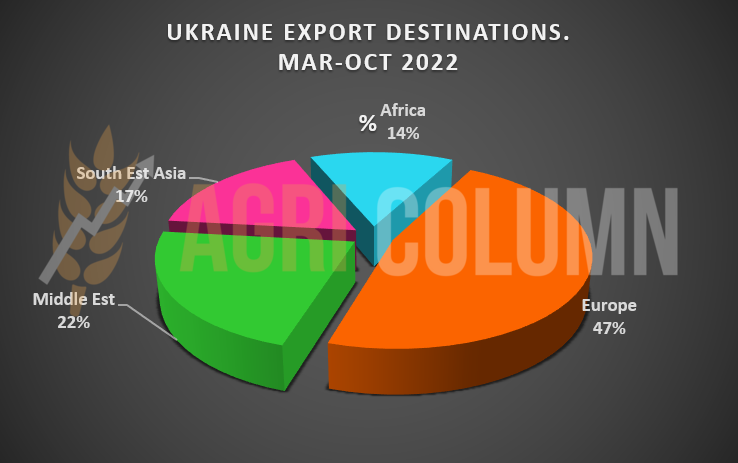
UKRAINE remains unchanged in the crop forecast of 31.5 million tons, but the effort to get the mass of corn across the border is the same as before, that is, extremely expensive and difficult. In fact, from the graph we insert, you can easily see the share of corn in Ukraine’s exports.
The EUROPEAN UNION is further downgraded by Strategie Grains analysis house. Thus, it loses another 2.5 million tons, from 52.9 million tons to 50.4 million tons. We will also adjust these estimates in our figures to match reality. The figure of 55.5 million tons that we maintained for many months is already altered by the reality on the ground.
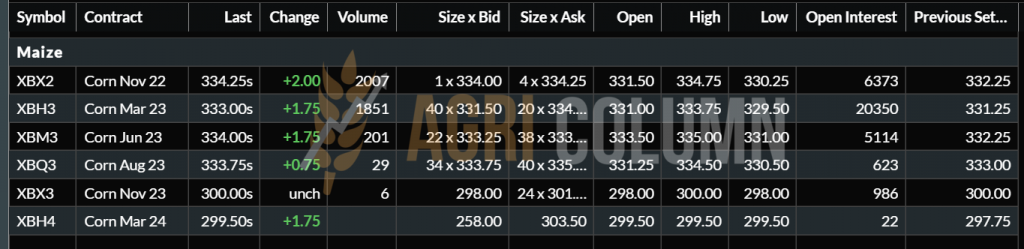
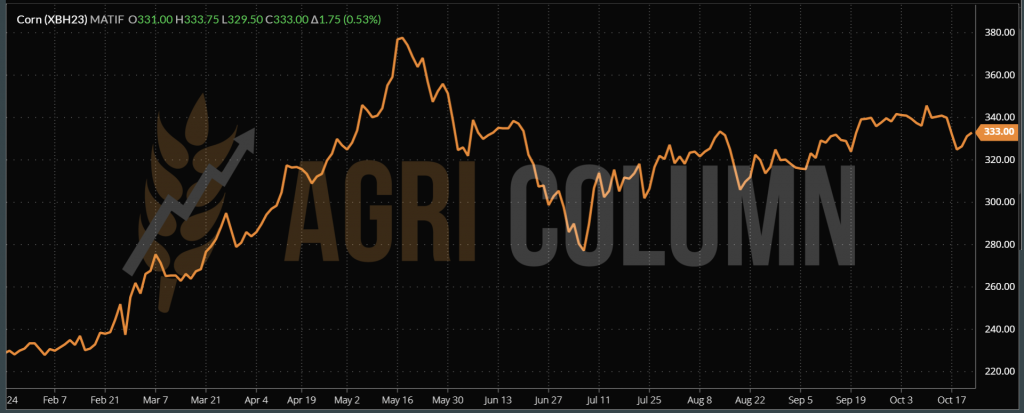
EURONEXT XBH23 MAR23 –333 EUR (+1.75 EUR)
CORN TREND CHART EURONEXT – BH23 MAR23
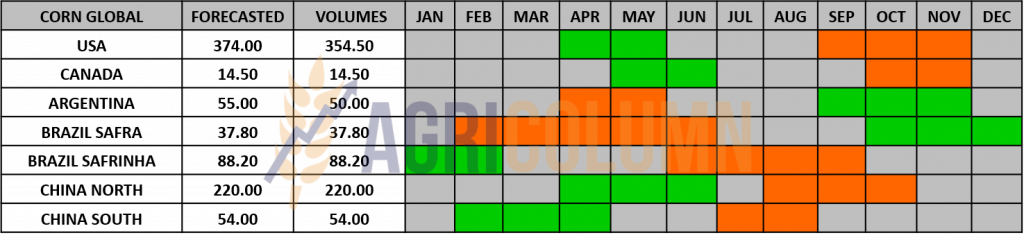
GLOBAL STATUS
The US is halfway through the harvest process. Right now, dry weather is a boon for the North American corn crop. No other degradations of harvest volume are noted.
BRAZIL is in the process of planting corn.
ARGENTINA has big enough problems in the corn segment as well. Planting proceeds at a very slow pace. The persistent drought is making the process difficult, and we are already predicting particular problems for the Argentine corn crop.
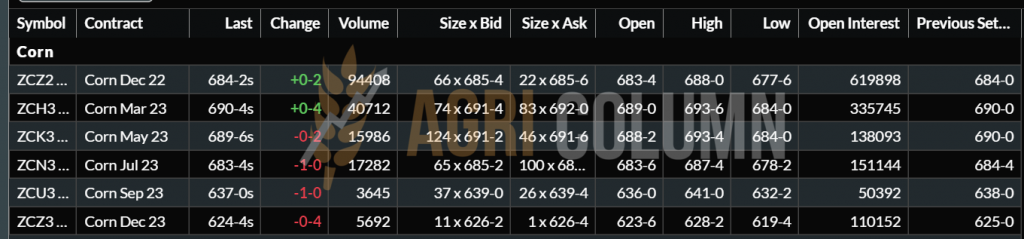
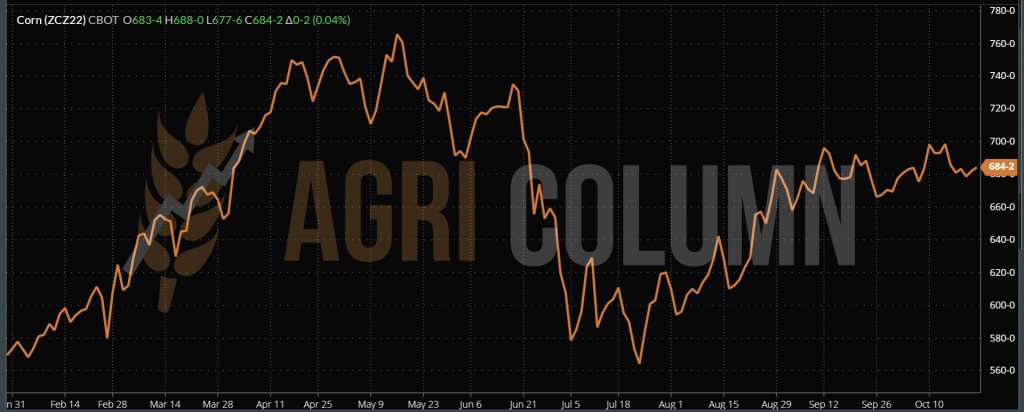
CBOT CORN – ZCZ22 DEC22 – 684 c/bu ( ± 0 c/bu)
CBOT CORN TREND CHART – ZCZ22 DEC22
CORN PRICE INDICATIONS IN MAIN ORIGINS

CAUSES AND EFFECTS
Maize is positioned on a platform supported by the factors Ukraine and South America. Both areas generate uncertainty, along with the European Union, which is degraded once again by 2.5 million tons. But we also have a balance by decreasing the consumption generated by the substitution with feed wheat and the US factor that harvests, and the size of its harvest can cover the potential gaps that could come on the Black Sea basin chain.
And we are clearly referring to Ukraine, whose preferred destination is the European Union. Ukrainian corn will generate support for European processing, and the green corridor factor does not have an extraordinarily large impact in this process. Crossing through Romania, Poland and Hungary is already a habit, the via Sulina barges are already a common process. What we want to say is that in the event of a total closure of the green corridor, Ukrainian corn will make its way to the European Union and cover its degradation.
Chart of Ukraine destinations in the period March-October 2022:
The price of corn remains stable. Harvest and drying factors in Ukraine, as well as the potential for a future disaster in Argentina, keep corn stable in the short to medium term.
Also in the corn section of our report we see information that gas prices have fallen enough to make European fertilizer production profitable again. Therefore, the premises of the spring of 2023 indicate a reduction in the cost of fertilizers.

LOCAL STATUS
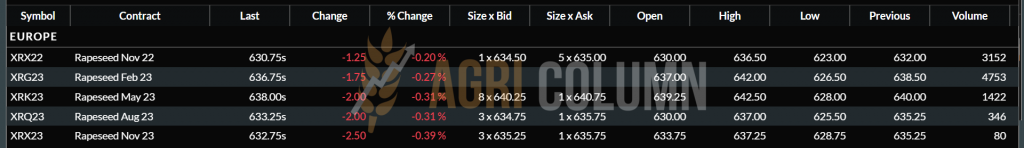
Rapeseed prices in the CPT Constanța parity are in terms of FEB23 minus 25 EUR/MT, i.e. they are at levels of 605-610 EUR/MT. The fluctuation is given by EURONEXT through its daily oscillations.
The local market is still in demand for canola and processors are offering competitive price indications. Values of FEB23 – EUR 20/MT are normal for this period and reflect the volume of rapeseed still stored in Romanian farms.
CAUSES AND EFFECTS
During this period, fluctuations are given only by the correlation with oil and its daily indications, Brent and WTI. Calming oil fluctuations in turn eases rapeseed prices.
REGIONAL STATUS
RUSSIA is out of season.
UKRAINE is out of season.
UNION EUROPEAN is out of season.
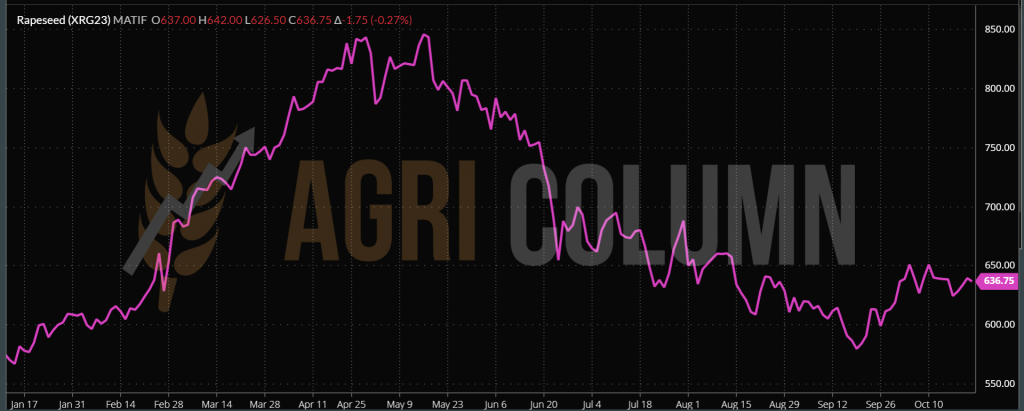
EURONEXT XRG23 FEB23 –636.75 EUR (-1.75 EUR)
EURONEXT RAPESEED TREND CHART – XRG23 FEB23
GLOBAL STATUS
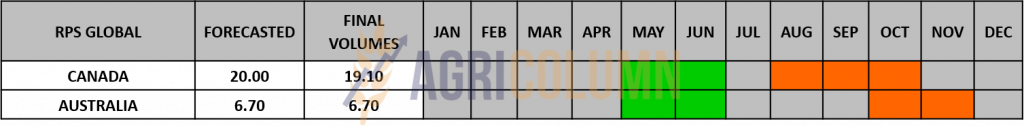
AUSTRALIA generates emotions. Abundant rainfall calls into question the harvest of rapeseed. The 6.7 million ton crop is in question as excess water damages and delays harvest.
CANADA closes canola harvest without emotion.
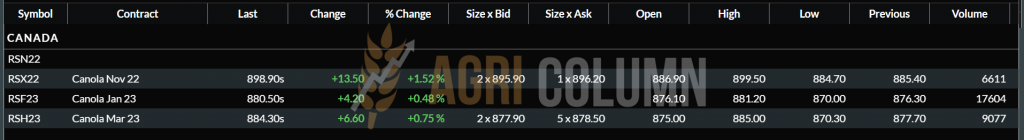
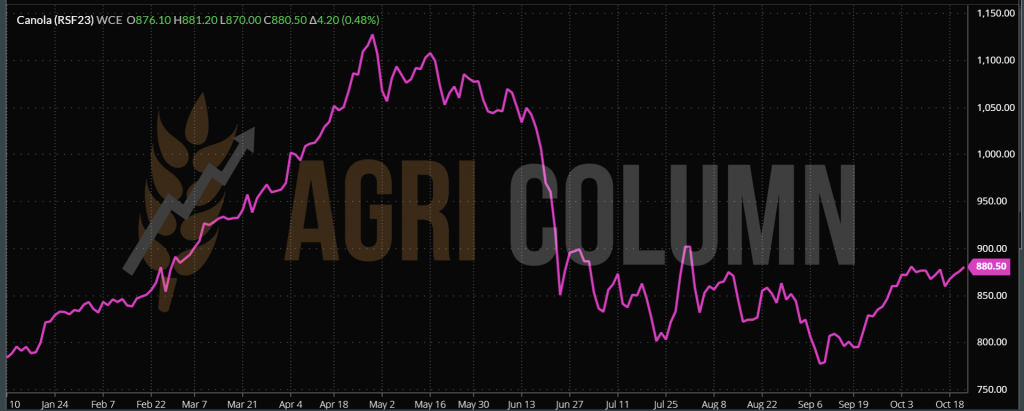
ICE CANOLA RSF23 FEB23 – 880.5 CAD (+4.2 CAD)
CANOLA ICE TREND CHART – RSF23 FEB23
COMPARATIVE CHART – EURONEXT, ICE CANOLA, PETROL
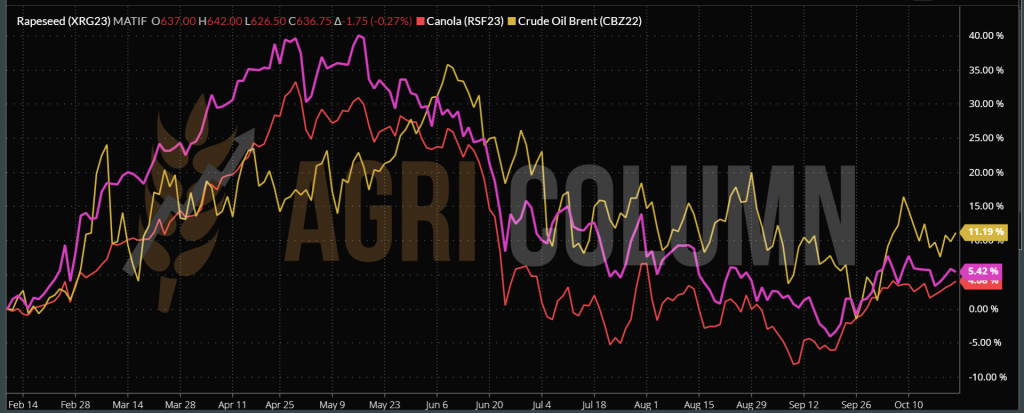
CAUSES AND EFFECTS
- The rapeseed price path shows a stabilization driven by steady demand and correlation through fossil energy.
- AUSTRALIA could become a price driver if it generates a lower crop volume due to unabated rainfall (La Nina and its effects). The situation will last until February 2023, when you we the ENSO phase.
- We do not rule out future increases in the price of rapeseed, with values between 10-20 EUR/MT.

LOCAL STATUS
The local processing industry has been creating steady demand lately and price offers for the delivered commodity are around 545-555 USD/MT. Constanța port is not slowing down either and 570-575 USD/MT is a constant benchmark of the price level that can be obtained for deliveries in CPT parity.
So we have a very dynamic transaction picture these days. The price trajectory remains at the same height, even if it has stabilized. Trading times are very good for both sides, sellers and buyers, a fact generated by farmers’ payment deadlines on the one hand, and demand generated by processors and buyers on the other.
CAUSES AND EFFECTS
The market potential that we see these days is generated by the approaching expiration of the 120 days intended for the Ukrainian Green Corridor. Uncertainty about its extension means that seed quotes remain supported further.
Factually, the effect will be felt after November 10-15, 2022. Then we will have more certainty about the extension or not of the green corridor for Ukrainian goods. Then we will see if the seed price support remains and takes on other dimensions or declines as the timing occurs through the effect of the extension of the Istanbul agreement.
REGIONAL STATUS
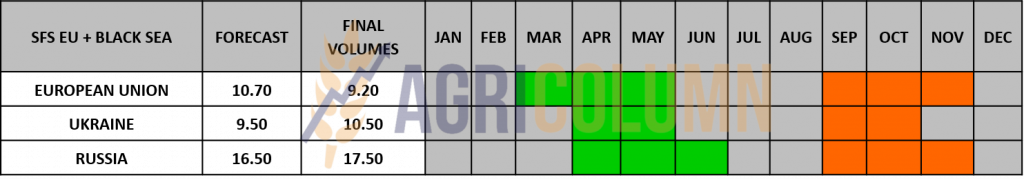
UKRAINE. In an online meeting on October 17, representatives of the Ukrainian oil and fat industry discussed with the Ministry of Agrarian Policy and Food the possibility of limiting the export of sunflower seeds, against the background of a reduction in the harvest volume in Ukraine and a large flow of the sunflower seeds exiting the country, which threatens the supply of domestic processing units with raw materials.
The representatives of the processing industry applied to the ministry with an initiative to limit sunflower exports. “One of the options could be an export surcharge,” said one representative of the processing industry. The ministry’s representative ruled out that option because of a tariff-free trade deal with EU countries, however, prompting others to come up with alternative solutions.
“Controlling the minimum price for sunflowers could be a solution,” said a multinational trader.
Representatives of the Agrarian Rada across Ukraine opposed the restrictions, as did some representatives of farmers and trading companies, arguing that they limit the right of farmers to receive a decent profit for their crop. “According to our calculations, the cost of sunflower cultivation is on average 660 USD/MT per hectare, while the price of sunflower crushers, including the cost of delivery to the enterprise, does not exceed 465 USD/MT including VAT,” a representative al All told the Ukrainian Agrarian Rada.
Opponents also suggested that with an average sunflower crop estimate of 10.5-11 million tons and sunflower carryover stocks of up to 3 million tons, the industry will have enough raw materials.
At the same time, taking into account the weather conditions and the late harvest of the sunflower, as well as the reduction of the area dedicated to it, some representatives of the industry estimate that the harvest volume does not exceed 10 million tons.
Another argument of the opponents of export restrictions was that there is already a 10% tax on sunflower exports to Turkey, which does not stop either sellers or buyers.
According to the Ministry of Agrarian Policy of Ukraine, sunflower exports in the 2021/22 season exceeded 1.6 million tons, which is 8.5 times higher than the previous year.
RUSSIA is not beyond its current condition. The bountiful crop will not be fully processed and raw material export will become a reality.
TURKEY institutes an import tax on sunflower seeds as well, sensing well the Russian volume that will become a reality in the next two and a half months. The tax level is 5% of the price of the raw material.
The EUROPEAN UNION continues to rely on raw material from Ukraine. Processing facilities in the Union must be active, and the effects of Russian bombing on Ukraine’s energy infrastructure will force sales of raw material to the detriment of processing. The rationing of electricity supply in Ukraine is a painful reality and it also applies to oilseed processing units. The direct consequence is reduced processing.
GLOBAL STATUS
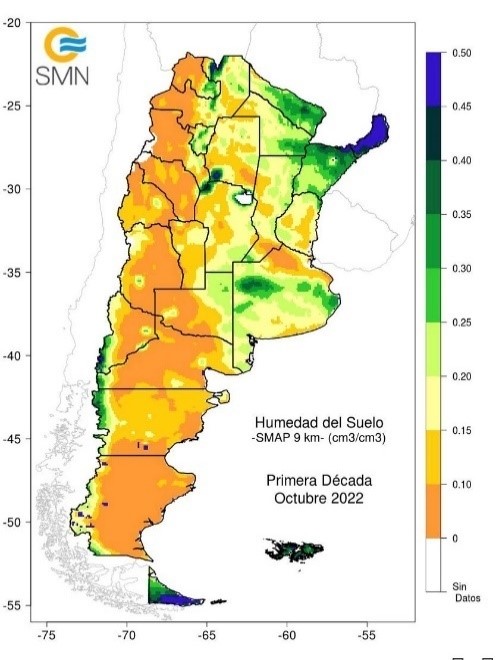
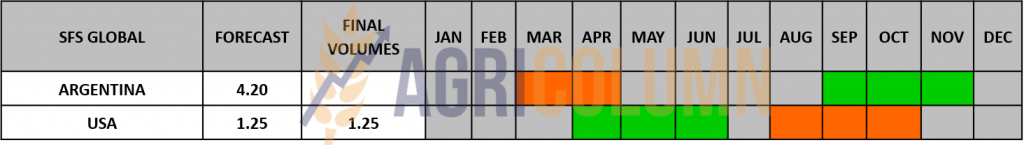
ARGENTINA certifies a negative record that will impact the global volume of sunflower seeds. It’s extremely quiet in the drought in Australia and they had 4.2 mil. tons forecast. They certainly won’t be able to deliver this volume. Photo source: USDA
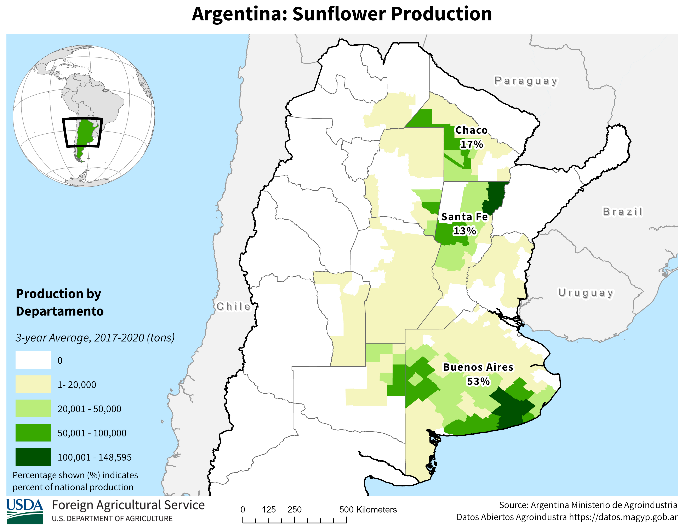
Water reserve in the soil – Argentina
PRICE INDICATIONS FOR OILSEEDS AND CSFO IN MAIN ORIGINS

CAUSES AND EFFECTS
The current and anticipated support comes from Ukrainian uncertainties, as they are undecided on how to protect domestic processing.
To this we add palm oil, which rises to levels of 4,200 MYR (Malaysian Ringgit). The causes of the increase in the price level can be found in the weakening of the national currency against the US dollar and the increase in demand from Asia. China’s Dalian Stock Exchange also points to rising price indications amid rising demand.
Another potential future price support factor in the vegetable oil complex is Indonesia, which is experiencing flooding in Kalimantan, creating particular problems for palm oil production.
But, in the future, the price level remains at the same level. Constant processing and traded volumes generate a dynamic market, but without jumps from the need for hedging.

LOCAL STATUS
Price indications are around 570-580 USD/MT at DAP Processor parity. Between July 1 and October 16, 2022, approximately 66,000 tons of soybeans were imported.
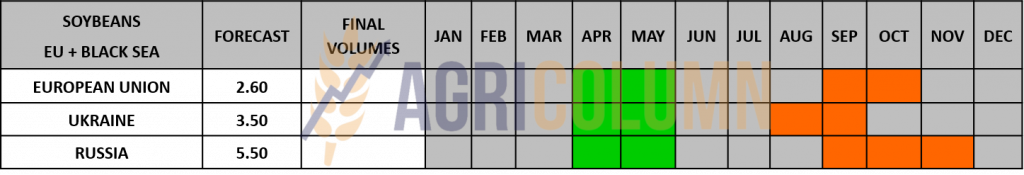
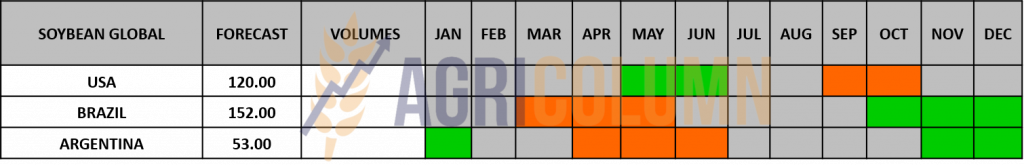
GLOBAL STATUS
USA. The pace of US soybean harvest was strong, with the harvest level reaching 63%.
USDA confirms sale of 201,000 tons to China and 132,000 tons to unknown destinations.
The USDA also announced that soybean export sales totaled 2.3 million tons in the week ended Oct. 13, the highest weekly total in a year.
Soybean futures fell on Friday, although the market was poised to end the week on a positive note as strong US export data boosted demand hopes.
BRAZIL. Brazilian farmers planted 6 million soybeans last week, thanks to rains in the country’s center-west. Thus, they reached a seeding level of 24%.
Farmers in Mato Grosso have sold just 29% of 2022/23 soybeans so far this month, down from 40% last year.
In Mato Grosso, the cost of soybean production is expected to be 47% higher than last year due to increased fertilizer costs. Fertilizers are likely to account for 32% of total soybean spending, up from 22% in previous years.
ARGENTINA. Rosario Grain Exchange maintained its 2022/23 soybean crop projection at 48 million tons.
Last week, farmers in Argentina sold just 55,000 tons of soybeans, well below the weekly average of about 1 million tons since September when the dollar-soybean program was in effect.
CHINA. The price of soybeans in China remains high due to low stocks. The lawsuit was caused by logistics by delaying deliveries from the United States (problems along the Mississippi River due to low water levels) by about 15-20 days for about 3 million tons of cargo. Thus, the shortage of soybean meal increases.
Since September, the price of soybean meal has remained high. The domestic spot price of soybean meal recently exceeded 699 USD/MT. China’s dependence on soybean imports is up to 70%, with the US being the second largest source. Amid global uncertainty and the need to stabilize supply and price, China has reduced the amount of soybean meal imports.


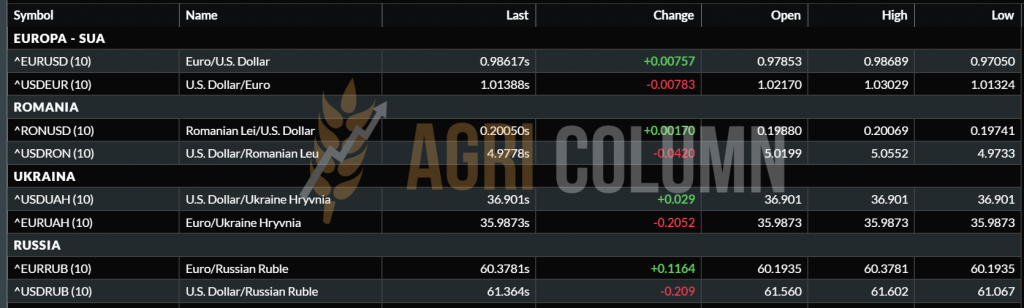
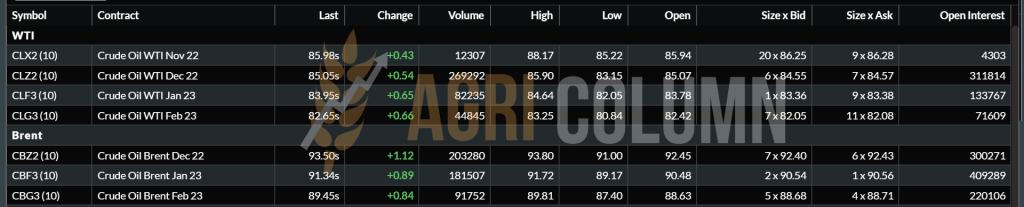
EUR:USD 0.98:1

BRENT DEC22 – 93.5 USD/barrel | WTI DEC22 – 85 USD/barrel

22-29 October 2022
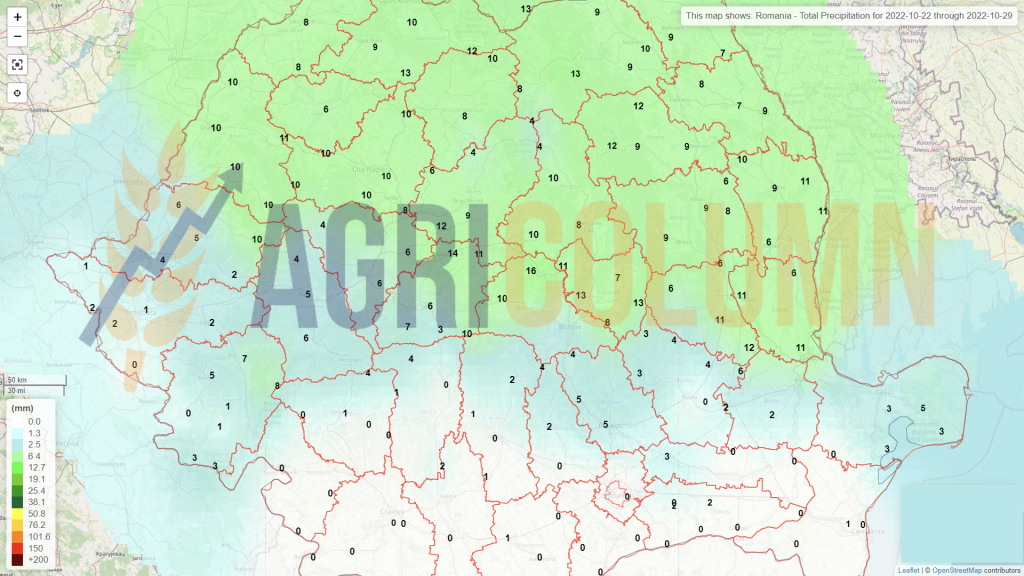
Romania
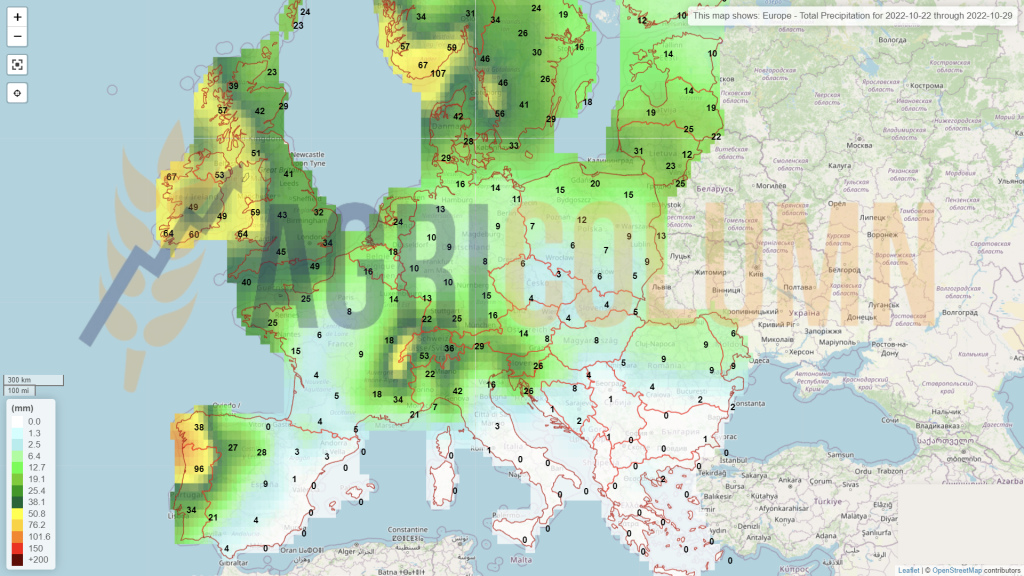
Europe
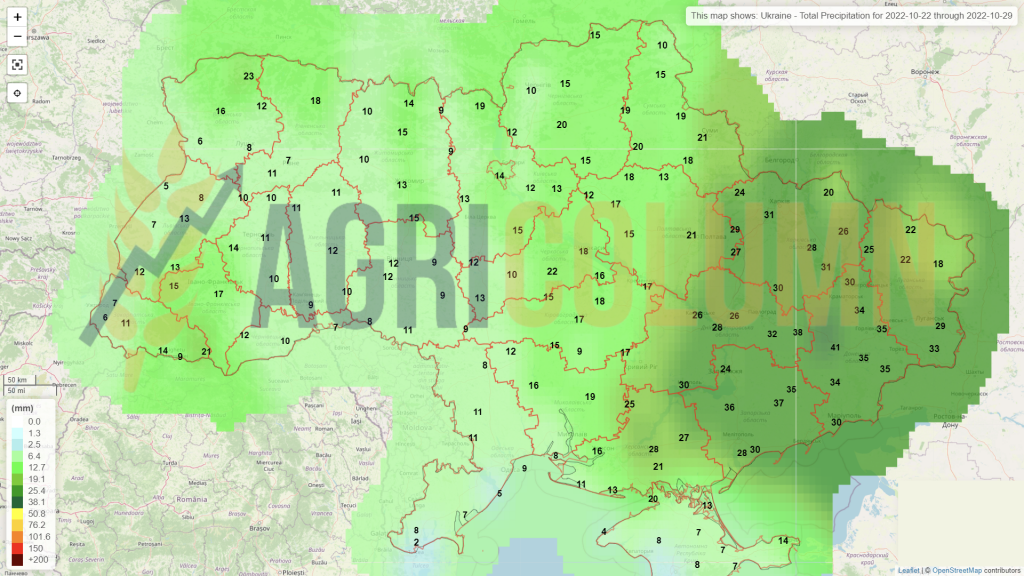
Ukraine
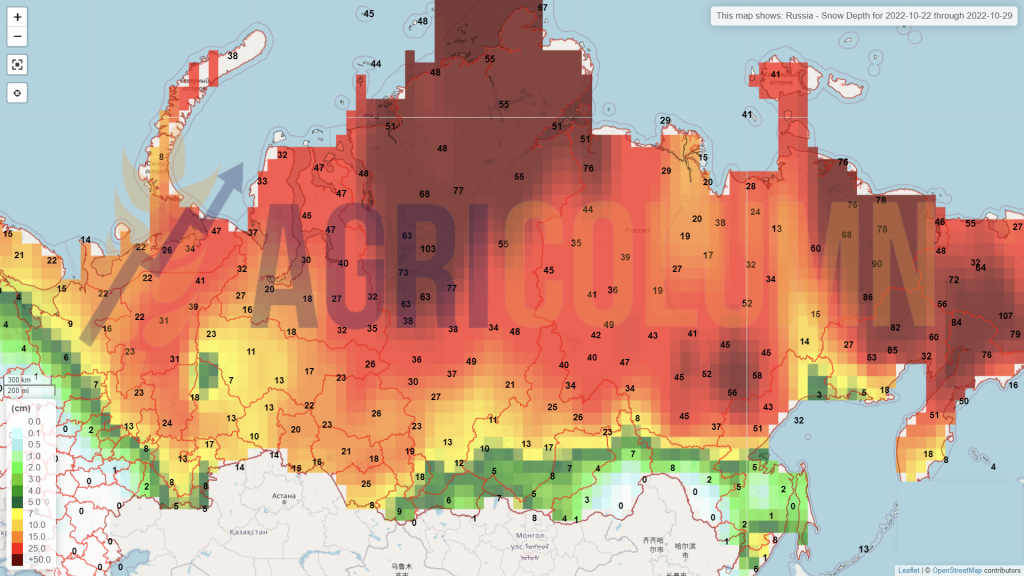
Russia (snow)
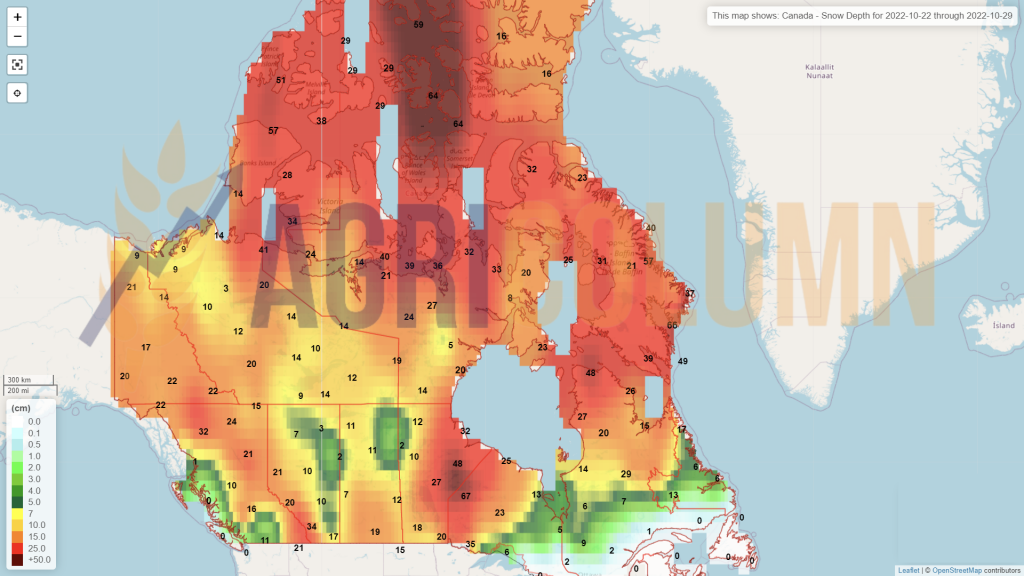
Canada (snow)
USA
Brazil
Argentina
China
Australia