This week’s market report provides information on:

FAO REPORT (April 8, 2022). FOOD PRICE INDEX
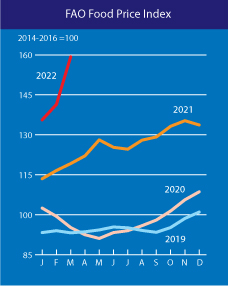
The FAO Food Price Index* (FFPI) averaged 159.3 points in March 2022, up 17.9 points (12.6 percent) from February, a huge leap to a new highest level since its inception in 1990. The latest growth reflects new historical highs for vegetable oils, cereals and meat sub-indices, while those for sugar and dairy products have also increased significantly.

LOCALLY
The price of wheat in the CPT Constanța parity was on Friday, April 8, 2022, at the level of 330 EUR/MT, with a discount of 20 EUR/MT for feed quality. Everyone was waiting for the USDA report, which brought changes in the volume available in the Black Sea basin. Our stocks have been reset and our estimates for the market starting today are of the level of 335 EUR/MT in the CPT Constanța parity.
At the local level, the problems caused by the drought are not fading in the region of Moldova, starting with the Focșani area, Vaslui-Galați area and the Bacău area, the drought continues and is persistent. This phenomenon is also present in certain areas in southern Romania, as well as marginally in areas in the west of the country (Arad) and in Dobrogea.
Here are some of the problems and effects of prolonged drought:
- The drought has been in place in Romania since the fall of 2021.
- For this reason, the sowing season with wheat has been greatly extended. This has led to a degree of non-emergence and uneven emergence at the national level
- During the winter, the lack of precipitation has left its mark again, the water level in the soil being very low.
- In the area delimited to the south by Focșani, to the north by Bacău and to the east by Brăila and Vaslui, an area has developed in which the pedological drought has started.
- In the region mentioned above, the winter crops, in this case, wheat, barley and rapeseed, will have drastically reduced yields (eg: if they harvested 5 tons/ha for wheat, they will now have 2-3 tons/ha).
- From discussions with farmers, some areas sown in autumn with barley and rapeseed will be sown now with sunflower and corn.
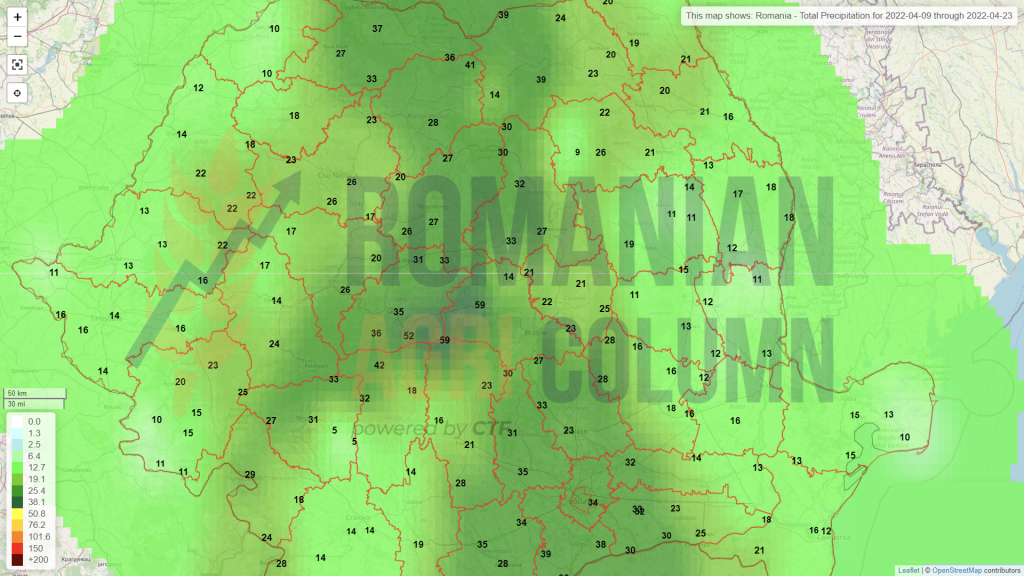
- In the next period (until April 20), precipitation is expected throughout the country (10-14 l/sqm), but the contribution of these rains will not be enough to restore the water supply from the soil, especially in the area of Moldova mentioned above.
- This will call into question the production of maize and sunflower seeds in that area.
In conclusion, we have questions about the value of production in Romania, both in autumn and spring crops, due to the persistent lack of water.
The price of the new wheat crop is still at 320 EUR/MT, but according to the WASDE report, it could exceed 323 EUR/MT on Monday in the CPT Constanța and DAP Processor parity.
REGIONALLY
In the Black Sea basin, things are not moving in the right direction. The Russian invasion continues to grind Ukrainian territory, even as withdrawals from the Kyiv area have given this nation a breath of fresh air. Russia retreats to counterattack on Southeast Corridor. The intention to cut off the nominated part would implicitly lead to a total cancellation of Ukraine’s access to the Black Sea.
UKRAINE WHEAT COMPARISON: 2021-2022 VS. 2022-2023
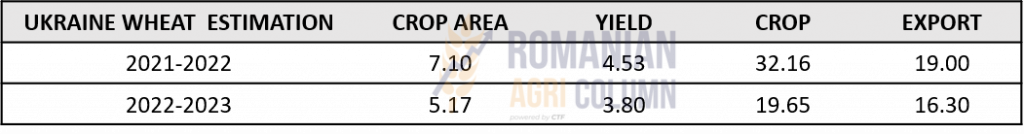
Let’s explain the numbers, for a good understanding:
- We will have a minus of 1.93 million hectares.
- We will have a decrease in yield per hectare of 0.73 tons/ha.
- The decrease in total production will be dramatic, from 32.16 million tons to 19.65, i.e., a minus of 12.51 million tons.
- The estimated export level for 2022-2023 will be 16.3 million tons. It is a decrease of 8.3 million tons compared to the initial forecast 2021-2022 of 24.6 million tons, as Ukraine’s exports stopped at 19 million tons. In other words, they still had about 5.6 million tons to export. This remainder will be included in the 2022-2023 crop.
Russia will generate, as we mentioned in past issues, a crop of 80-82 million tons, with an export level of around 37-38 million tons. For the old crop, they continue the export pace mentioned in the last issue, the month of March 2022 being much higher than March 2021 in terms of export tonnage.
But in terms of logistics, things are not that simple. Simply passing through the Kerch Strait is not enough. Ships must be insured, as must their cargoes. And here things get complicated for Russia. The maritime insurance market in London has declared all maritime waters of the Russian Federation a “military zone”. When a ship is about to enter this territory, the shipowner MUST notify its insurer and pay a “war premium”. According to other market analysts, the cost of insuring a ship entering the Black Sea gets out of hand as the risks of war increase (including mine drifting). And we’re talking about insurance premiums in excess of millions of dollars.
This does nothing but bite the price that Russia gets on wheat and the other goods it exports. At the same time, the ruble is strengthening against the US dollar and this is making the local market extremely confusing. The dollar converted to rubles in the price of wheat makes the level that an exporter receives unmotivating compared to the local Russian market. In other words, the local market competes with exports, if we add up the effects of the exchange rate and the costs of insuring ships and goods.
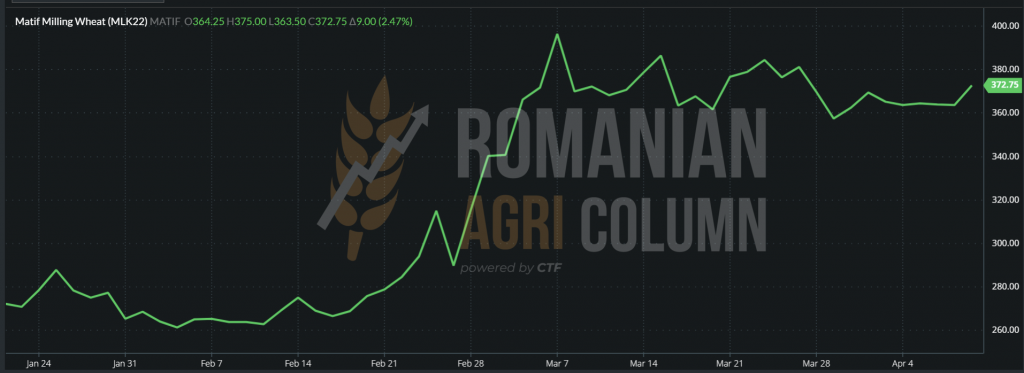
EURONEXT posts the volatility generated by the WASDE report by increases in the price level of wheat at the end of April 8, 2022, with direct reference to May 2022. Subsequently, it also gains the quotation of the new crop, but not at the same level.
What we must not forget, however, is the date we are on and the fact that the business days in April are very few. We are in Ramadan, the Catholic and subsequent Orthodox Easter holidays are coming in a few days, which will lead to the total exit from the business for a period of at least two weeks, from April 14 to April 26, 2022.
We must also take into account the times when the indication MAY22 will expire on wheat and, as we are accustomed to, this will start around April 20, 2022. Practically, towards the end of April, we will move with the wheat indications directly to SEP22 as reference.
Until we see the closing quotations of EURONEXT, it is worth mentioning a not at all positive thing about the European wheat crop (soft wheat), which falls in estimates from a forecast level of 137 million tons to 134 million tons, representing a minus 3 million tons. This is an extremely important parameter in the calculation of the crop and, implicitly, of the price, especially if we add with the disappearance of the volumes in Ukraine and the state of the crop in the USA (as we will see in the global chapter).
EURONEXT MLK22 MAY22: 372.75 EUR (+9 EUR) at the close of April 8, 2022
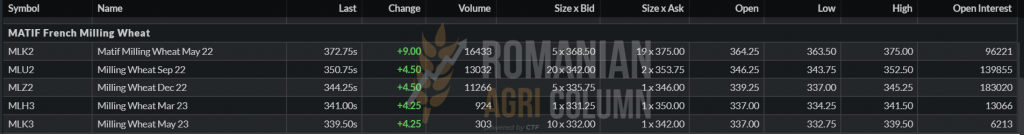
WHEAT TREND GRAPHIC – MLK22 MAY22
All the while, however, BSW (Black Sea Wheat) decreases in quotations. The month of May is trading down to 390.75 USD (358.8 EUR) at a parity of 1.1087 EUR/USD. This is the price paid for the lack of predictability and sustainability by the Black Sea basin. Unfortunately, Romania is a component of the basin and is directly affected by this. In a simple calculation, the price in euros indicated for the month of MAY22 discounted by the costs of fobbing and the exporters’ margin generates the low price level that we displayed at the beginning of the report, namely 335 EUR/MT. Romania, in turn, is affected by the costs of insuring goods and ships entering the Black Sea. Mines and the war zone are costly arguments.

GLOBALLY
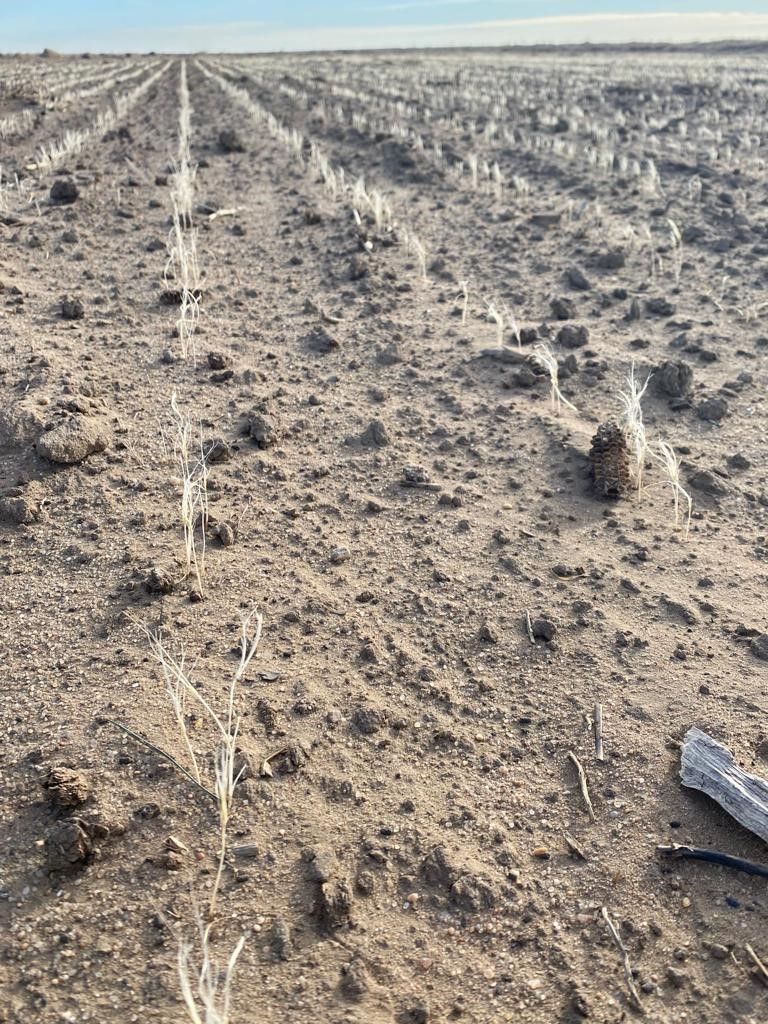
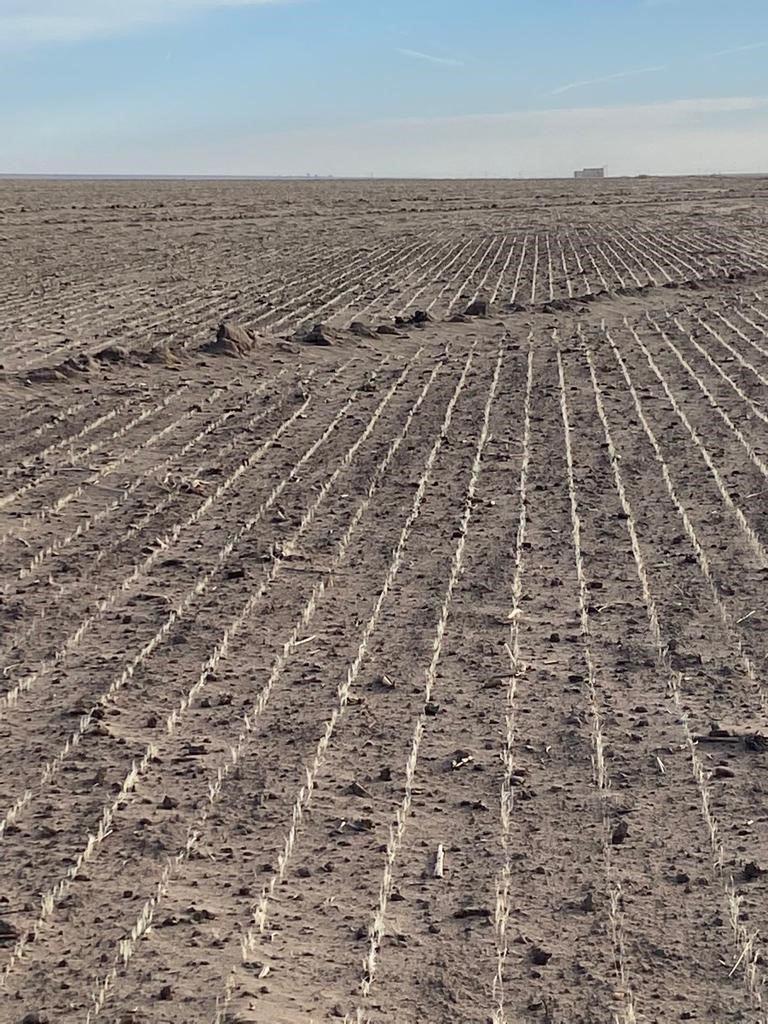
HOUSTON we might have a BIG problem!!! This is what the USDA announcement would sound like, through their expert, Karen Braun, an exceptional scout and analyst who now confirms exactly what we estimated as early as December 2021, when dust storms reaching 160 km/h, unfolded at temperatures of 24 degrees Celsius. They kneaded and dried the southern part of the North American Central Plains.
These photos are testimonials of December 2021 in the US:
We resume all the factors that determine the market, and which our analysis model takes into account at all times:
- Supply & Demand
- Weather
- Stocks exchange
- Reports
- Politics
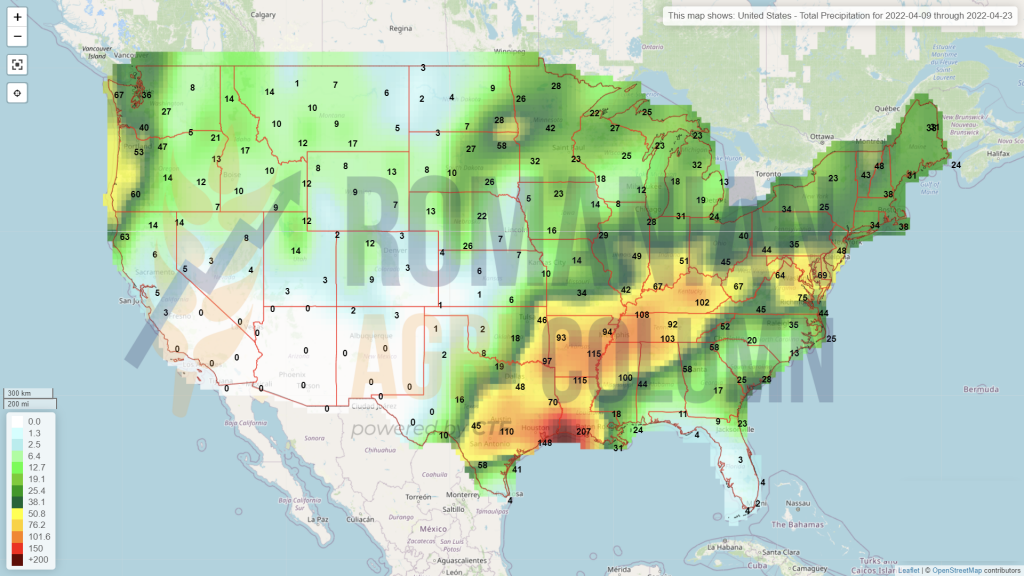
Thus, according to the USDA (Karen Braun), the winter wheat crop in the US has come out of rest in a miserable state, after a historically dry winter in the key production states, almost guaranteeing that the crop will not be among the best of the country.
The timing is not great, because the tensions in the wheat market are high. Global wheat prices hit record highs last month after war broke out among top exporters in Russia and Ukraine, and this came as a result of an already tight supply situation. The United States is also one of the world’s leading suppliers of wheat.
The U.S. Department of Agriculture said 30% of U.S. winter wheat was in good or excellent condition on April 3, well below the 40% and 53% trade expectations of last year (and remember last year when they discounted the crop from 54 million to 45 million tons).
Crop health was seldom so poor in early April. Only 27% of winter wheat in 1996 was good or excellent in the first 10 days of the month, and 2018 recorded 31% in the same period. Final yields were poor in 2018, but terrible in 1996.
In fact, winter wheat production in the US has never been above the long-term trend, when far less than 45% of the harvest is good or excellent in early April. With 1996, bad crops, such as 1989, 2002 and 2014, were also in poor shape at this time. The records date back to 1986.
This year’s crop, which is expected to be harvested in June and July, was healthy last fall as crops were sown in very dry soils in the plains and western United States. The winter rainfall was among the weakest ever in those areas, almost ensuring that the wheat will appear in a very weak form in the spring.
Not all crops end up being disastrous when health assessments are low at this time. About 36% of winter wheat in 2011 and 2013 was good or excellent in early April, and adequate, but not good, rainfall in April helped yields fall by only a few percentage points from the trend.
Rainfall is the most critical in April, after the crop comes out of winter rest. However, the US government’s outlook for April suggests that the Southern Plains area may remain drier than normal. This is a typical side effect of La Nina, which occurs when the surface waters of the equatorial Pacific Ocean are colder than normal. Conditions of La Nina are expected to persist in the summer in the US, as in other years when winter wheat conditions were low and crops were very disappointing, including in 1989, 1996 and 2018. In fact, almost all crops with poor health in early April were associated with La Nina or near La Nina conditions.
The good thing is that American farmers seem to have planted the largest area of winter wheat in the last six years, as revealed last week in the USDA survey. However, if the US winter crop weakens, total wheat supplies will remain under pressure, as the spring crop is questionable at this time. American farmers are ready to plant the smallest area of spring wheat in five years and get one of the worst crops after a severe drought. Drought remains the reality in many areas with spring wheat.
Our primary estimate for US wheat production for the 2022-2023 season indicates a decrease of at least 7 million tons at this time. But things will change. Prolonged drought, as well as the heat of the weather, could push this decline to higher levels.
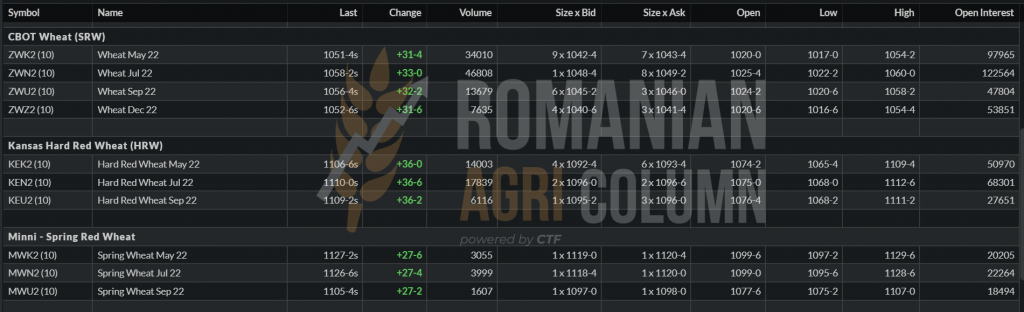
CBOT, in the light of WASDE and as an effect of this report on wheat crop, is increasing quotations again. The trading algorithms react promptly and so we have the following indications on the close of the night of April 8-9, 2022. The Kansas and Minneapolis stock exchanges also react identically.
But what should be noted is the POSITIVE crop inverse between MAY22 and SEP22. Basically, the new crop wheat in the USA is more expensive than the one listed in MAY22. This tells us a lot about the impact of the analysis report on the condition of American wheat at this time. The warning comes a long way from the harvest. The imminence of the volume decrease is recorded by algorithms and thus our confirmations are fulfilled. We’ve been raising the warning flag since December. Weather is the most capricious factor in the whole wheat equation.
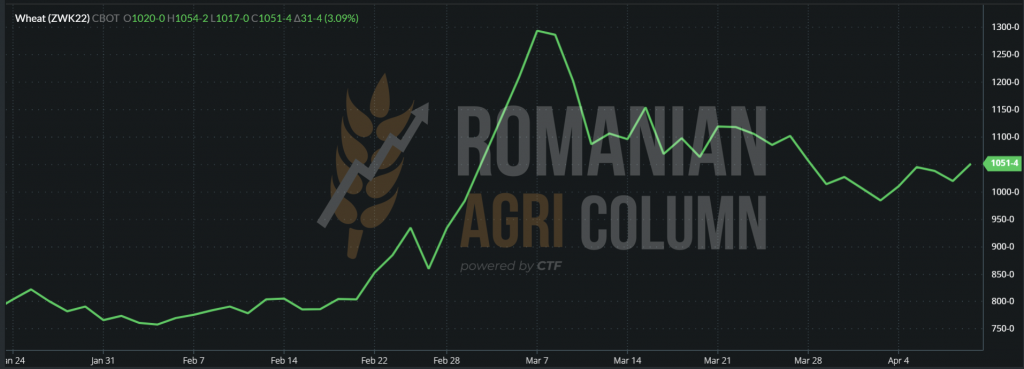
CBOT ZWK22 MAY22 – 1,051 c/bu (+ 31 c/bu +11.75 USD)
WHEAT TREND GRAPHIC – ZWK22 MAY22
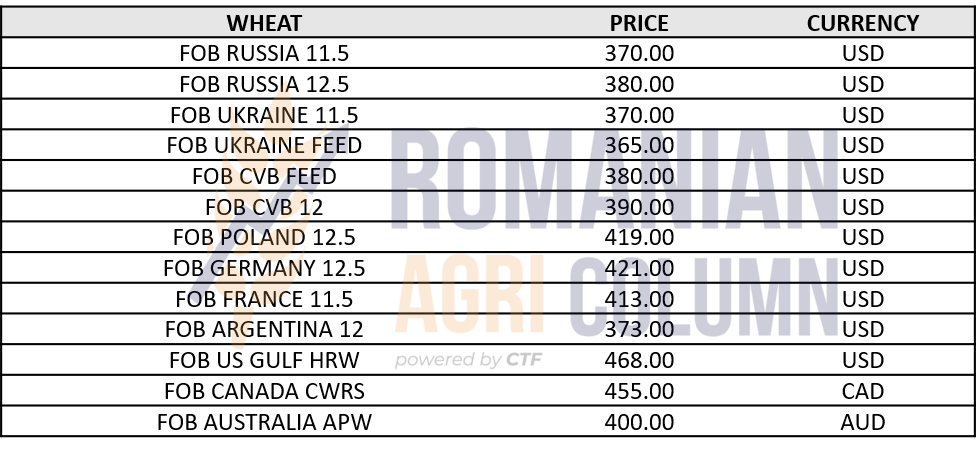
WHEAT PRICE INDICATIONS IN MAIN ORIGINS
ANALYSIS
- Ukrainian wheat crop is declining.
- European wheat crop is declining.
- The US wheat crop is declining.
- Demand from China is growing.
- Demand in the Middle East is rising.
- Demand in North Africa and Sub-Saharan Africa is growing.
- Input costs have risen and are showing no signs of stopping.
DOES ANYONE ELSE BELIEVE IN CHEAP WHEAT? WE DO NOT THINK SO.

LOCALLY
The price indications of the new barley crop are at the level of 280-285 EUR/MT in the CPT Constanța parity. Nothing changed in this regard.
REGIONALLY
We have the Ukrainian barley crop forecasts and we will display them comparatively between seasons, 2021-2022 and 2022-2023 respectively:

We notice how the area destined for barley decreases by 0.68 million hectares. Compared to its size in the marketing year 2021-2022, the decrease is quite significant, about 25%.
Productivity also decreases by 0.42 tons/hectare and this aspect, aggregated with the decrease of the surface, leads to a crop of only 6.12 million tons. The level of exports is also drastically reduced, by 2.65 million tons, from 5.65 million tons to 3 million tons.

LOCALLY
The local price of maize is at the level of 300 EUR/MT in the CPT Constanța parity. Only one exporter posts 310 EUR/MT, but for a short period of time. So far, Romania has exported over 3.7 million tons of corn without quantifying the quantities sold before the April 4, 2022 report.
At the level of the new crop, the prices are extremely timid at the moment. The working premises are still in the phase of number of hectares and normal production, which leads to a state of lightness of the price. Thus, the primary indications are at an extremely low level, of 255 EUR/MT, CPT Constanța, which does not arouse any interest in sales from farmers.
Farmers are in the midst of a campaign to sow spring crops and carry out technological work on autumn crops, and regional and global factors are not yet taken as firm benchmarks. In addition to the two landmarks, we also have the weather factor, which will play in full force this year in the corn field.
REGIONALLY
We have, as in the case of wheat, the estimates from Ukraine, the corn tank of the Black Sea basin, and they do not look good at all. We post and comment on them together.
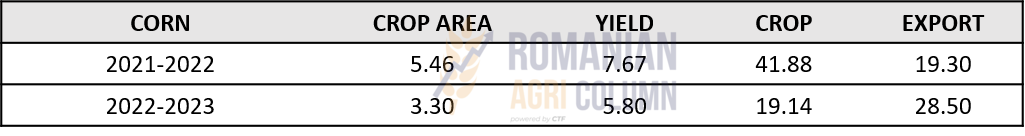
The area sown with corn in Ukraine in 2022-2023 will be reduced by 2.16 million hectares, compared to 2021-2022. Production per hectare will decrease by 1.87 tons due to shortages caused by fertilizers, from 7.67 tons/ha to 5.8 tons/ha. This results in a harvest volume of only 19.14 million tons, compared to the superb figures from 2021-2022 of 42 million tons. The export level is currently set at 28.5 million tons, compared to 33 million tons in the 2021-2022 season. We ask ourselves the natural question – why do we have a higher crop level than production? Simple, because they come from the non-exported stocks last season.
However, these are preliminary estimates made in the scenario in which Ukraine will have access to Black Sea ports. But this is not guaranteed if the war continues. Crossing measures through Poland and Romania are not effective. We remind you that 1,150 corn wagons are currently blocked at the border with Poland.
And if we estimate a maximum level of 1 million tons that can leave the railway per month from Ukraine, we estimate a maximum of 12 million tons of export in these conditions. It can’t even be by truck. Martial law does not allow men to leave Ukrainian territory. And so trucks cannot cross the border with Ukrainian drivers. Not to mention the costs, which are really huge, of about 240 EUR/MT to the port of Constanța.
And if we add up only the wheat and corn export estimate, it results in a figure of 16.3 million tons of wheat and 28.5 million tons of corn = 44.8 million tons of goods. This without barley and sunflower oil. This level of export can only be performed through port terminals and not otherwise. 3.73 million tons per month is not something that can be achieved through railways. It means 74,600 wagons of European size, i.e., 50 tons capacity. And the numbers seem downright impossible.
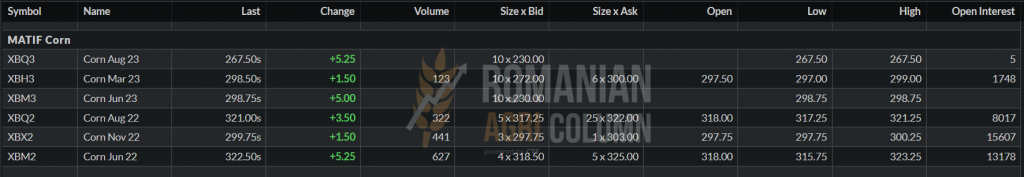
EURONEXT posts increases, following the WASDE report. The corn for JUN22 increases by 5.25 EUR, but the one from NOV22 remains shy for now, at 299.75 EUR.
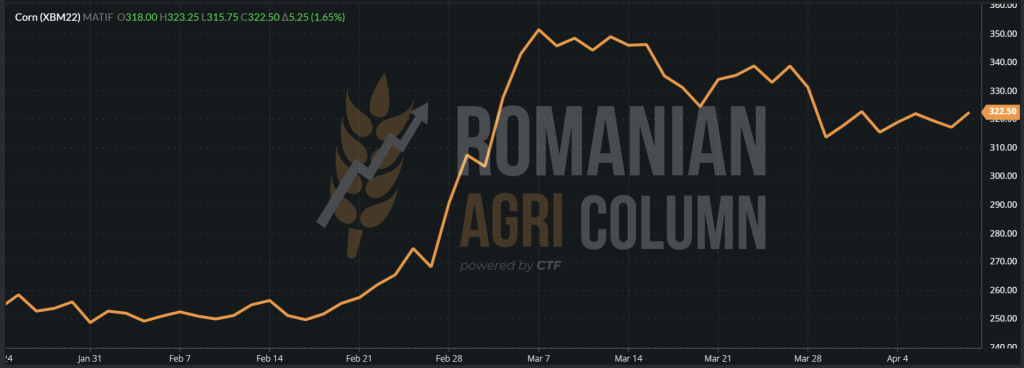
EURONEXT XBM22 JUN22 – 322.5 EUR at the close of 8 April 2022
CORN TREND GRAPHIC – XBM22 JUN22
GLOBALLY
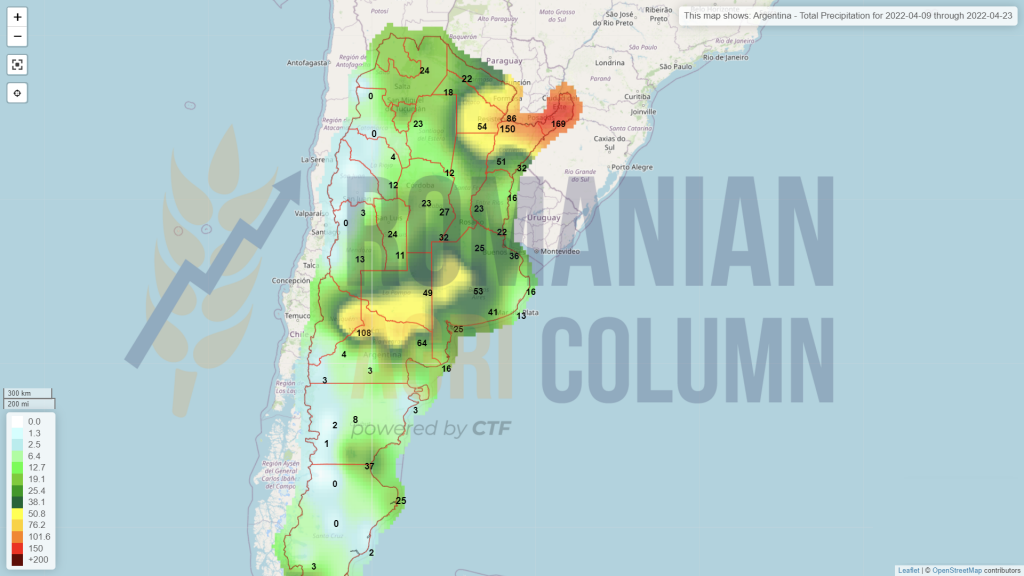
Argentina is left at the same level of crop initially forecast at 53 million tons. Reserves on the Argentine crops are still in place. Harvesting has reached a level of 17% of the total area and continues at a steady pace.
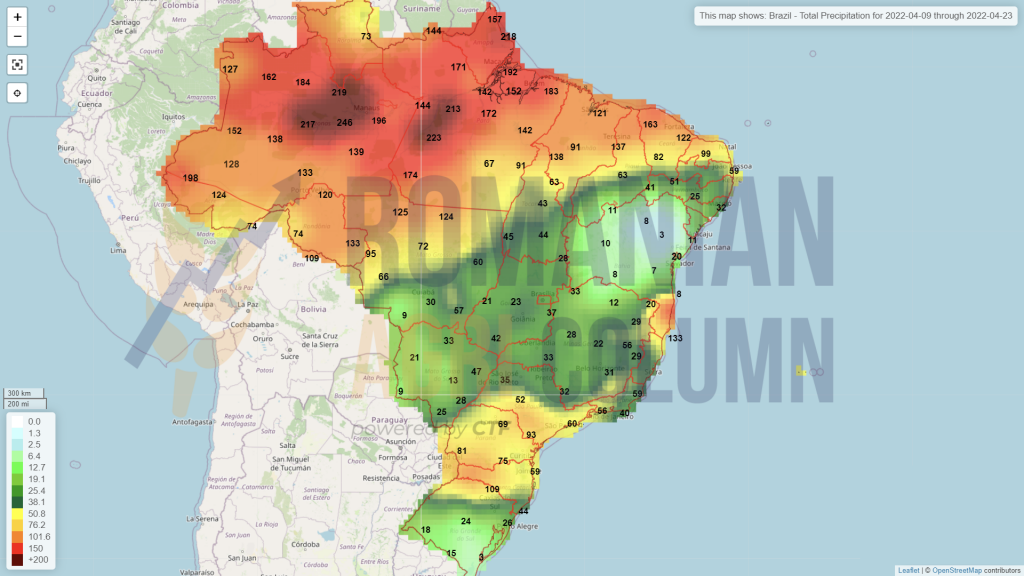
Brazil receives an upgrade to the second corn harvest of 2 million tons. And so, Safrinha is seen at 88.54 million tons, compared to 86.15 million tons a month ago. Subsequently, the export forecast increases to 37 million tons, compared to 35 million tons last month.
The United States continues to sell corn, and last week maintained its pace, according to estimates. American farmers have started sowing corn and are currently at a level of 2%.
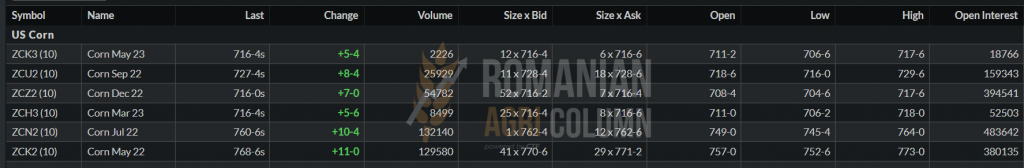
CBOT, in the context of WASDE, indicates slight increases in maize. The context of WASDE is analyzed in the special report sent yesterday.
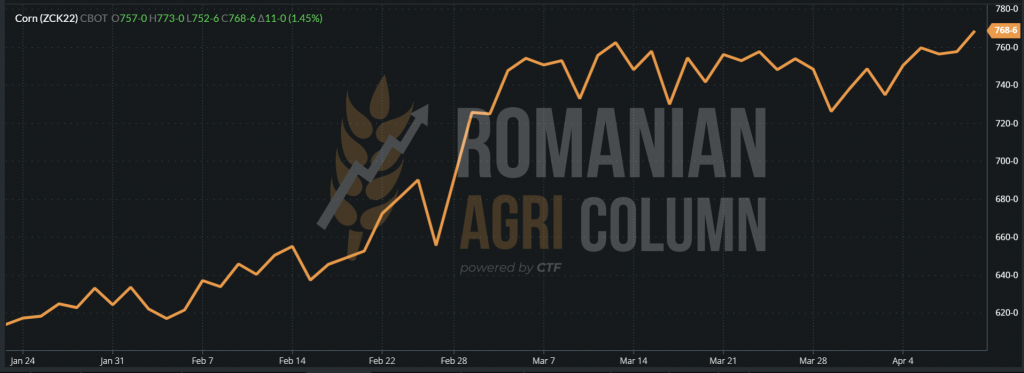
CBOT ZCK22 MAY22 – 768 c/bu (+11 c/bu = +4.33 USD)
CBOT CORN TREND GRAPHIC – ZCK22 MAY22
CORN INDICATIONS IN MAIN ORIGINS

FAO REPORT – MAIN AND SECONDARY CEREALS – April 8, 2022
The FAO cereal price index averaged 170.1 points in March, up 24.9 points (17.1%) from February, the highest level since 1990. This month’s rise reflected an increase in world prices for wheat and cereals, largely due to conflicts: disruptions in exports from Ukraine and, to a lesser extent, from the Russian Federation.
The expected loss of exports from the Black Sea region has exacerbated the already low global availability of wheat. With concerns about crop conditions in the United States adding support, world wheat prices rose sharply in March by 19.7%. After rising by 20.4% in March, international cereal prices hit a record high, with corn and barley prices hitting their highest levels since 1990.
Exports of maize from Ukraine, a major exporter, fell significantly amid high energy costs, which supported a 19.1% month-on-month increase in world corn prices. Strength in maize markets has influenced other coarse grains and added additional pressure on already tight barley markets, pushing barley prices up 27.1% from February.
ANALYSIS
- The balance of power in the Black Sea basin is weakening in relation to South America and the USA.
- The interest is moving to the two Americas, North and South.
- Ukraine cannot generate goods for export due to the war.
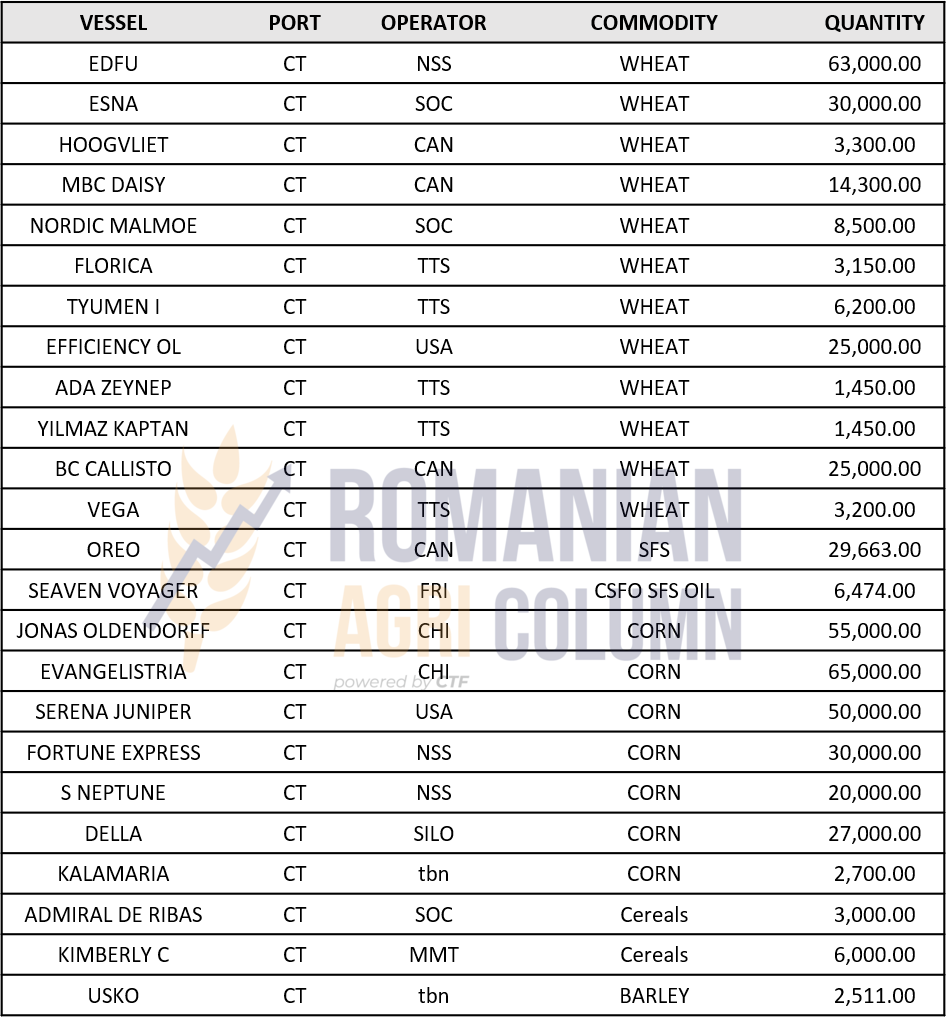
- Constanța posts EURONEXT minus 20 EUR/MT and this indicates the abundance and congestion in the port. Otherwise, the CVB indication is 327 EUR/MT and, if we extract the fobbing costs and the exporter’s margin, we have a minimum of 312-315 EUR/MT CPT.

LOCALLY
The price of the new rapeseed crop reached the average level of AUG22 minus 5 EUR for the goods delivered to DAP Processors, respectively AUG22 for the goods delivered to the Port of Constanța. This level indicates the need for supply, as well as the awareness that rapeseed is cash-commodity and will sell very quickly at harvest. The need for supply indicates once again how tight the crop is and what the demand for rapeseed is globally.
REGIONALLY
French and German farmers have not yet been able to assess or quantify any damage to the rapeseed crop resulting from the freezing rain affecting the crops in the two countries. French farmers are more reserved and more optimistic for the time being, but German farmers have noticed a lot of areas with bent stems due to the weight of the ice. According to our sources, there are still no insurmountable problems at the moment, and the forecast is maintained as before, i.e., 18-19 million tons.
In Ukraine, on the other hand, things are somewhat unbalanced and we record the 2022-2023 vs. 2021-2022 that we insert here and then comment together.
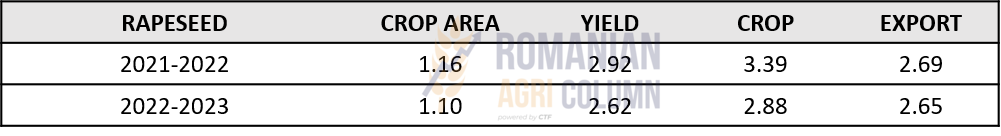
We have a somewhat stable area compared to 2021-2022 due to the fact that rape was sown in the fall of 2021, when there was no dawn of the Russian invasion. The negative difference is only 50,000 hectares in total, 1.1 million ha in 2022-2023, compared to 1.16 million ha in 2021-2022.
Productivity, on the other hand, is declining due to somewhat restricted access to spring maintenance work, largely in war-torn areas. So we have a difference in production of 0.3 tons/ha.
Total production decreases by 0.5 million tons, from 3.39 million in 2021-2022 to 2.88 million tons forecast in 2022-2023. The forecasted export level is 2.65 million tons. Taken together, the level could find its way to export via railways, due to very high demand at European level.
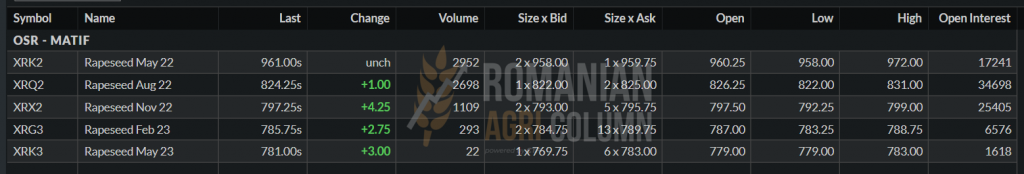
EURONEXT is being influenced by several factors these days. But let’s look at the quotes and the related chart and then comment. RAPESEED – EURONEXT – XRQ22 AUG22 – 824.25 EUR (+1 EUR)
EURONEXT RAPESEED TREND GRAPHIC – XRQ22 MAY22
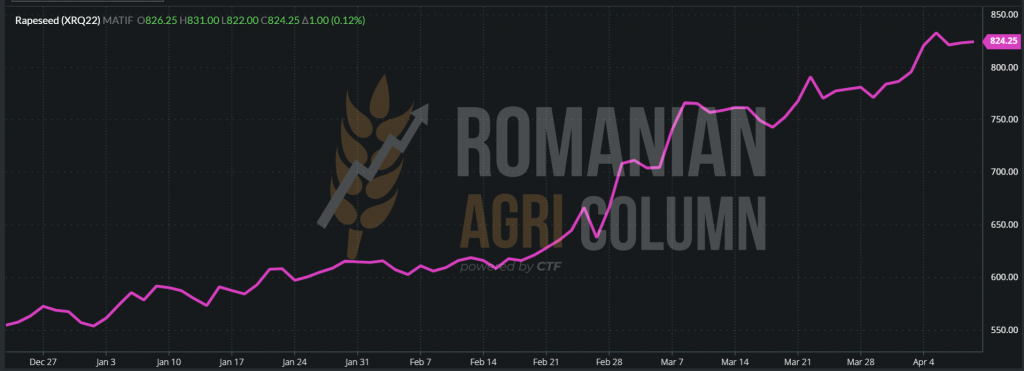
What has practically happened in the last week? The first scene was an aggregation of two factors, rising fossil energy and freezing rain in Europe, which led to steep growth. This was followed by an agreement between the countries that make up the International Energy Agency on supplementing the crude oil market to calm demand.
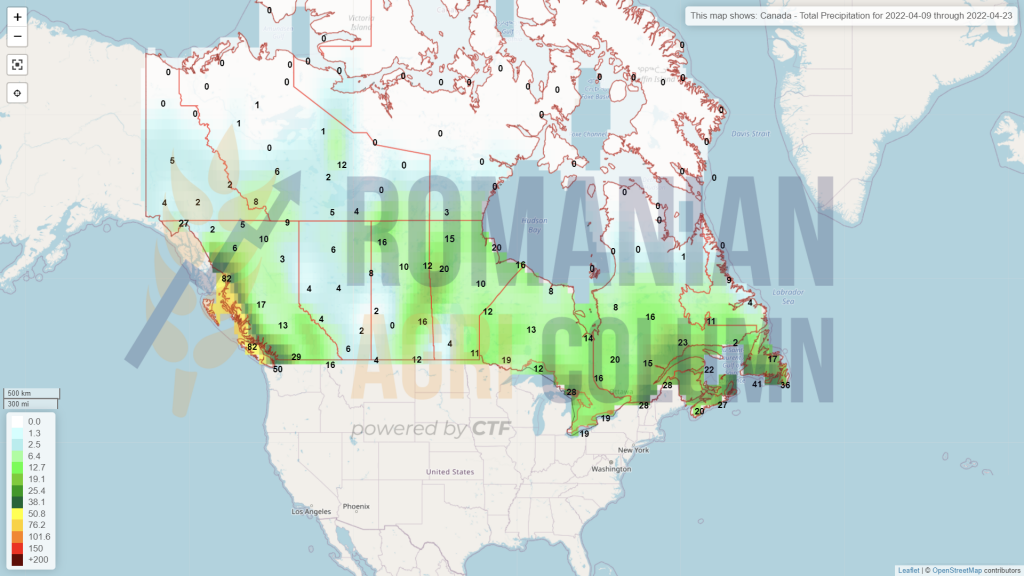
But across the ocean, things are not quite calm. Canada has announced a 35% increase in total oil production compared to last year. However, these figures do not tell us anything, taking into account the disaster created by the drought on last year’s rapeseed crop. Most likely, and with caution, they will return to their pre-summer levels.
Assuming a return to average yields, it is estimated that rapeseed exports will almost double in 2022/23, driven by strong global demand for oilseeds and a rebuilding of stocks. The recovery of rapeseed yields depends on the vast growing areas of Saskatchewan and Alberta, which receive more spring rains and the decrease in current drought conditions.
The global demand for veg-oils is increasing and demand in North America will receive a major boost over the next two years due to renewable diesel production in the US and Canada.
U.S. renewable diesel processing capacity is about 1 billion gallons a year in 2021, and the U.S. Energy Information Agency expects a rapid increase, based on facilities under construction and announced, to five billion gallons per year until 2024.
Canadian renewable diesel capacity, based on public announcements, could exceed three billion gallons (0.8 billion US gallons) per year by 2027, says Chris Vervaet, executive director of the Canadian Association of Oilseed Processors (COPA).
A Canadian ad is from Federated Co-operative Limited (FCL), which is building a renewable diesel processing unit near Regina. FCL will mix biodiesel with diesel for Co-op fuel pumps. In related news, FCL announced in January 2022 a joint venture with AGT Food and Ingredients Inc. to build a $ 360 million canola processing plant near the renewable diesel plant. The plant will supply about half of the canola oil needed for the diesel plant, with the rest coming from other canola processing units. FCL will have several vendors to choose from. Its joint association is the third new canola processing unit announced for the Regina area and the fourth for Saskatchewan in the last 12 months.
The rapid increase in renewable diesel production capacity is the major factor behind these construction announcements. “Global demand for oil and grits is growing,” says Vervaet, “but the catalyst for such an increase in investment is the demand for biofuels.”
Renewable diesel could lead to a fourfold increase in the use of Canadian canola in US and Canadian biofuels. The current use of rapeseed in the production of biofuels in North America is about 1.8 million tons. By 2030, they could be 6.5 million tons. For reference, total Canadian canola production was around 20 million tons per year between 2016 and 2020. Drought and heat reduced production to just 12.6 million.
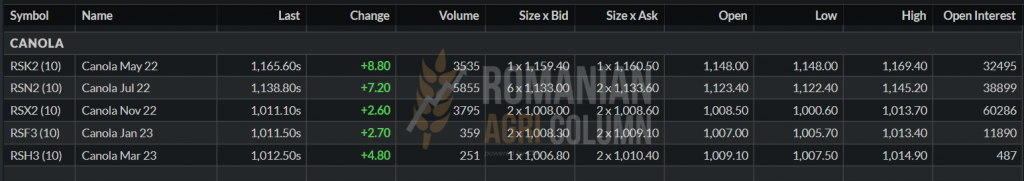
So the indications for canola (Canadian rapeseed) are already rising and exceed 1,000 CAD/MT at RSX22 NOV22
ANALYSIS
- The story of rapeseed is just beginning. Weather and Energy will dictate the price, but the line is clear for growth in the next period.
- Everything depends on the weather and the fossil energy, which today is kept somewhat under control. The lock-down in Shanghai, where 17 million people are actually blocked, also contributes to this. However, the Chinese media is not developing the subject enough.
- Canada will severely limit exports due to increased inward processing capacity and we believe this will impact the price in terms of supporting it.

LOCALLY
In Romania, the indications of sunflower seeds are calmed down, in the sense of lowering their level. We are recording quotations of 800 USD/MT DAP Processors these days. However, the port of Constanța still pays the level of 820-830 USD/MT, with a bonus of 25 USD/MT for HIGH OLEIC seeds.
The price of new sunflower seeds crop, on the other hand, tends to increase. We see quotations of 750 USD/MT offered in the market to farmers by the vast majority of processors and exporters. It is a high start, we could say, compared to last year, when the starting level was set at 485 USD/MT. The difference of 265 USD/MT at the start of the campaign is the cost of the war, converted into the lack of Ukrainian crop and crude oil, by default.
REGIONALLY
6PORTS crude oil prices, in turn, show an obvious decrease of 205 USD/MT, the closing level of Friday night being set at 1,945 USD/MT.
We go to the regional level and estimate by comparison, according to the information received, the Ukrainian crop of sunflower seeds (2021-2022 vs. 2022-2023).

We have a much lower area forecast compared to last season: 4.4 million ha compared to 6.75 million ha in the 2021-2022 season. This decrease of 2.35 million hectares lies precisely in the fact that the areas where this crop predominates are in or near the theater of war.
Productivity per hectare does not decrease much (only 80 kilograms), but the total production is dramatically diminished as a ratio between area and production per hectare. It is now set at 10.47 million tons, from 16.6 million last year, i.e., a decrease of 6.14 million tons.
In terms of crude oil exports, it is forecast to increase this season. Ukraine has been stopped and dispossessed by Russia in terms of exports of sunflower oil to the level of 3.60 million tons, out of an estimated 7 million tons. In the following season, the export level is set at 6.5 million tons, bringing in the export flow and the quantity not exported this season. It is based, of course, on an end to the conflict and a return to the Black Sea ports that are now under Russian occupation or under Russian naval fire.
GLOBALLY
Argentina will soon complete the harvest of sunflower seeds and, according to the information we have, the final crop level will be around 3.3 million tons, so nothing spectacular.
American farmers are planting more sunflower because Ukraine’s lack of flow is tempting globally. American farmers will sow about 20% more sunflower than last year. However, we note the following facts about the United States:
- The average area of the last 5 years cultivated with sunflower: 567,000 hectares.
- Average production of the last 5 years: 1,074,000 tons
- Average yield: 1.89 tons/ha
- 20% more represents about 110,000 ha, and as production, an increase of 208,000 tons.
CSFO AND OILSEEDS INDICATIONS IN MAIN ORIGINS

ANALYSIS
- The price of raw material has moderated to the level of 800-820 USD/MT.
- 6PORTS crude oil prices are falling.
- We actually have a break. The processors are stocked and the Easter holidays have to pass in order to see a possible spike for the last stage, namely June.
- The new crop has a very good start, of 750 USD/MT. Compared to a production of at least 2 tons per hectare, it generates profit. At 3 tons/ha, at least $ 1,000 remains on the farm.

Argentine soybean production could also fall below 42 million tons due to the drought and frost it was subjected to. However, as we saw in the WASDE special report, the current forecast remains at 43.5 million tons, unchanged from last month. The local analysis houses have already carried out cuttings in the Argentine crop and are keeping an eye on the frosty nights that have followed one another since the end of March 2022.
Brazil is degraded by 2 million tons, from 127 million tons to 125 million tons. This was known to everyone. It only needed the WASDE certification.
Global stocks decreased by 1.18 million tons, from 89.96 to 88.79 million tons.
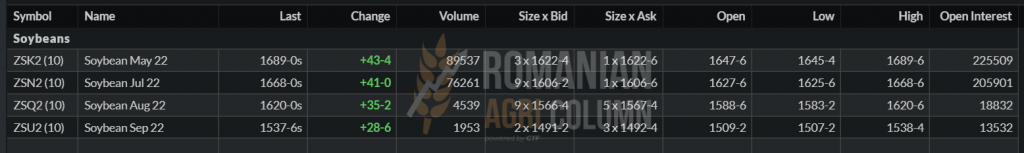
CBOT reacts and we record increases of 15.8 USD/MT.
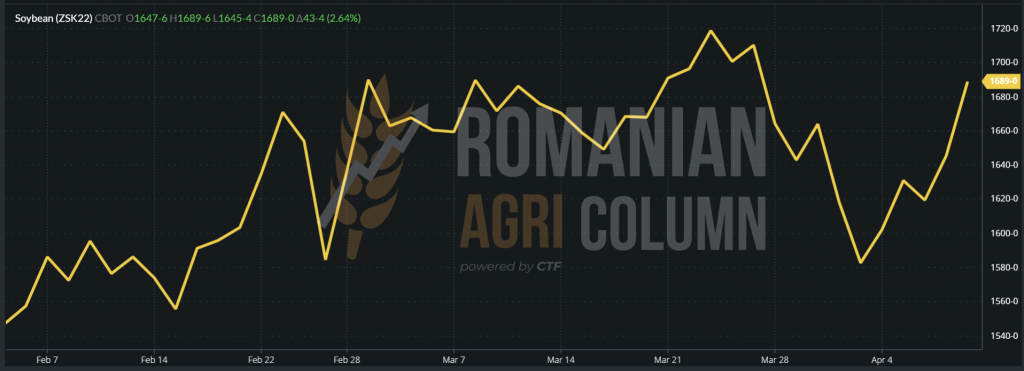
CBOT ZSK22 MAY22 – 1,689 c/bu (+43 c/bu = +15.8 USD)
SOYBEAN TREND GRAPHIC – ZSK22 MAY22
FAO REPORT – OILS AND VEGETABLE OILS (April 8, 2022)
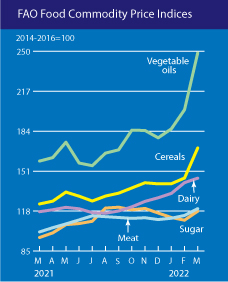
The FAO index of vegetable oil prices averaged 248.6 points in March, up 46.9 points (23.2%) from February and breaking a new record.
The sharp rise in the index was driven by rising prices for sunflower, palm, soybean and rapeseed oil. International quotations of sunflower oil rose sharply in March, fueled by declining export supplies amid the ongoing conflict in the Black Sea region.
Meanwhile, prices for palm, soybean and rapeseed oil have risen significantly, supported by rising global import demand due to disruptions in the supply of sunflower oil.
Moreover, while global palm oil values received additional support due to persistent supply constraints in major producing countries, soybean oil prices were supported by concerns about low export availability in South America. Remarkably, the volatile and higher values of crude oil also supported the international prices of vegetable oil.

WHEAT 185,000 TONS | CORN 260,000 TONS

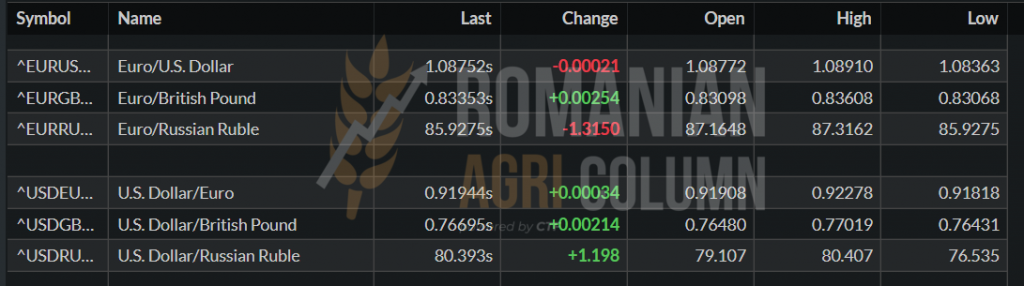
EUR/USD 1: 1.087 USD/RUB 1: 80.39

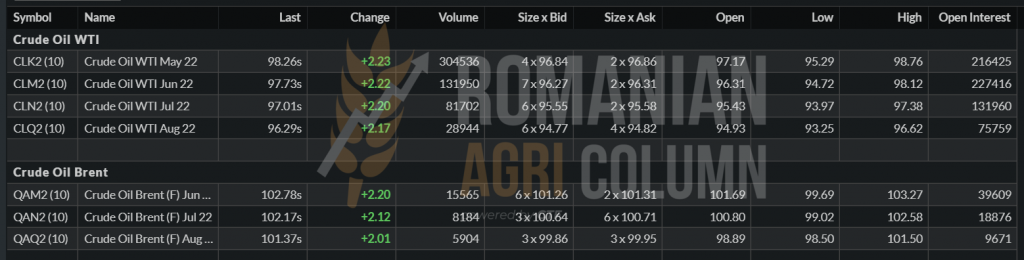
WTI 98.26 USD | BRENT 102.78 USD

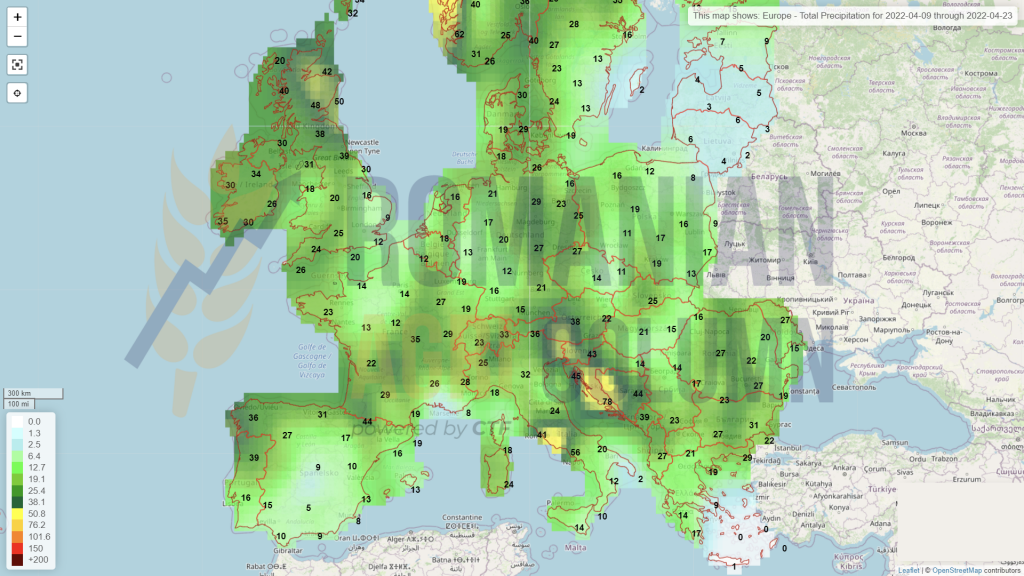
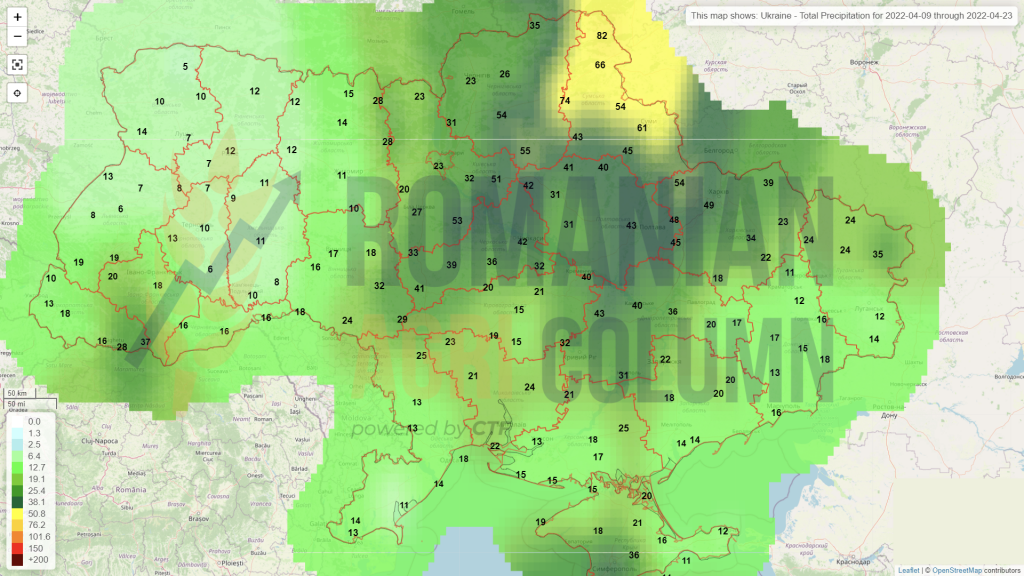
9-23 April 2022
Romania
Europe
Ukraine
Canada
USA
Brazil
Argentina
China
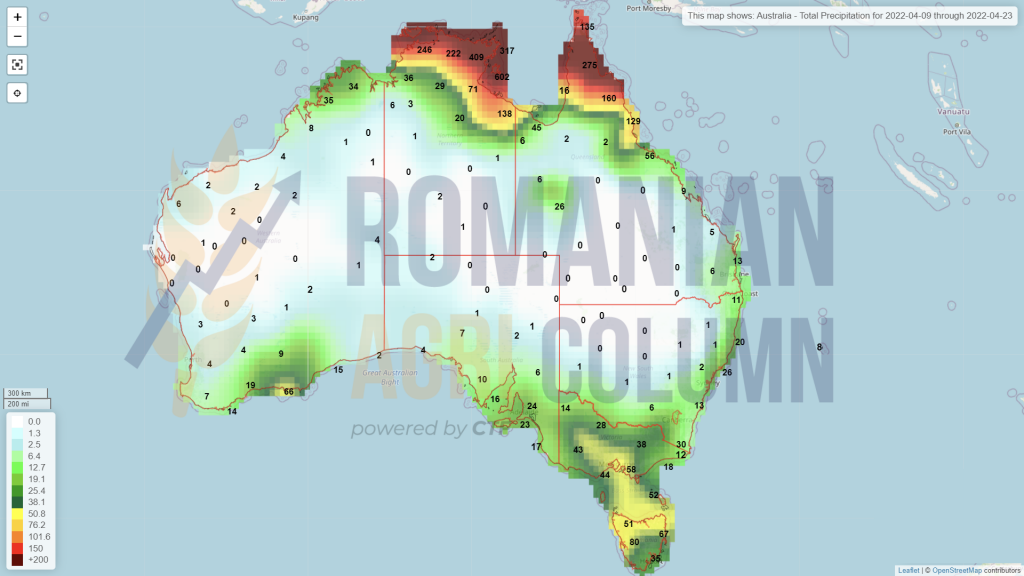
Australia