This week’s market report provides information on:

LOCAL STATUS
The indications in the port of Constanța are at the level of 300-305 EUR/MT in CPT parity. The price of feed wheat is 25 EUR/MT lower than the price of milling wheat. In the country, at the level of processing, the price indications are aligned with the Port of Constanța, with processors offering values of 295 EUR/MT. The Super Premium quality, i.e. protein level over 15% and gluten 37 is rewarded with an extra 90 EUR/MT in CPT Constanța parity.
CAUSES AND EFFECTS
So we have a final decision on the extension of the Istanbul Agreement. As we’ve been stating for some time, this will create price pressure from market fundamentals. And today we find ourselves in the scenario foreseen for a long time, namely the drop in the price of wheat, a fact certified by the purchase instructions offered by the Port of Constanța.
Russian wheat will be extremely competitive and this can already be seen in the declines in indications FOB Russia. In the coming period, we will have no other option than to accept the reality, that is, the stock market game at the end of November and the recalibration on the indication of March 2023.
The only exception to the rule is the Premium quality. An extra quality can generate a commensurate premium. We recorded a transaction for a large batch of wheat which, converted to FOB Constanța parity, generated a price level of 400 EUR/MT, bound for Italy, for Italian pastry artisans.
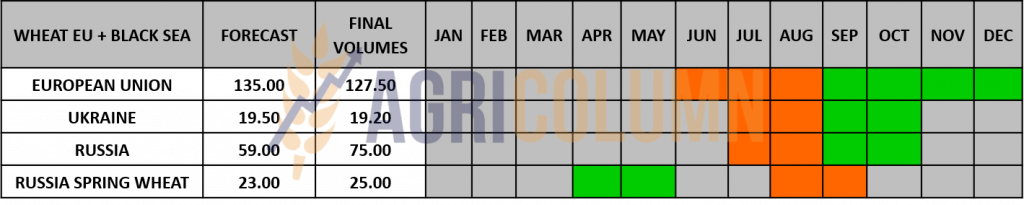
REGIONAL STATUS
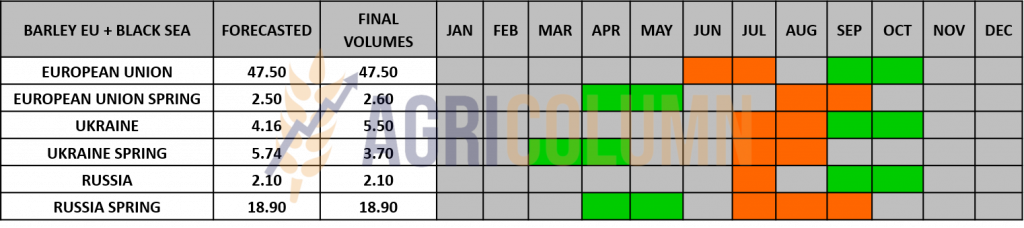
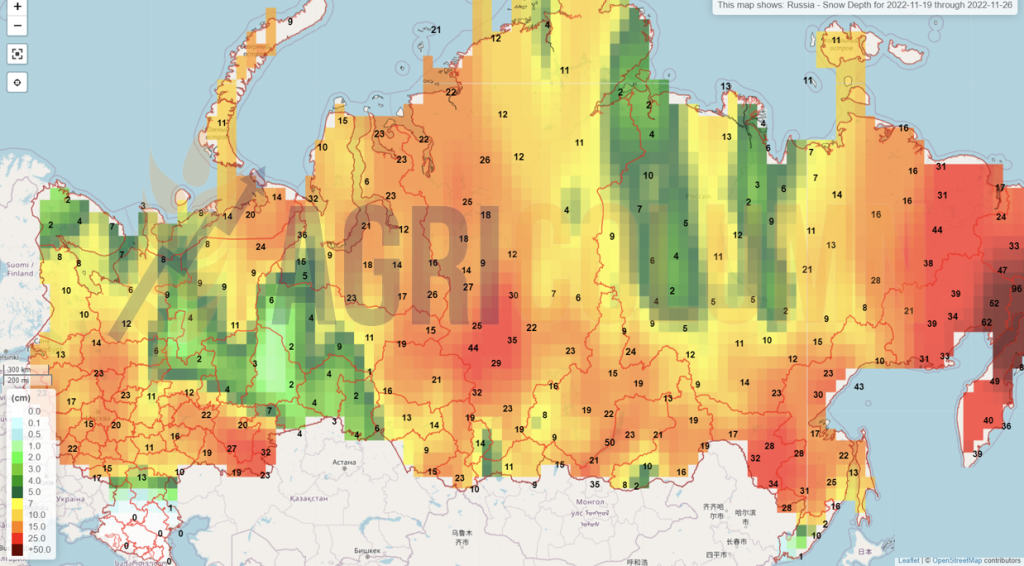
RUSSIA exports. At seasonal level, they have already accumulated about 16.50 million tons. Their march continues towards the attempt to export 47.5 million tons. But if we review the figures from past seasons, we will be able to identify, for sure, where the moose are cut, namely in the February-March area. If this happens, we will see a very large new stock that will remain unsold in Russia and will be carried over to the 2023-2024 season.
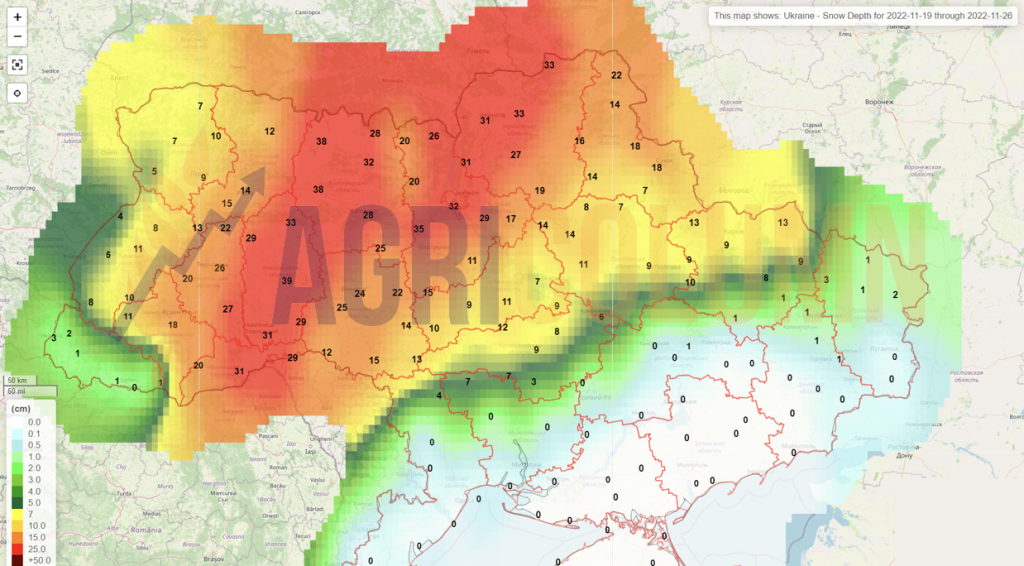
UKRAINE shows signs of stopping seeding. The main reason for the closing of the sowing window is the snowfall in the Ukrainian territory. Apparently, Ukraine will not exceed the figure of 3.8 million hectares sown with wheat this fall. The prime seeding areas are under Russian occupation and the potential is effectively diminished.
THE ISTANBUL AGREEMENT was extended, as we expected. Russia didn’t have many options. What they got was the facilitation of payments through the US so they could generate capital by selling wheat and unblocking certain frozen stocks in the European Union. A limited number of banks in the UK have been instructed to process fertilizer transactions heading for deprived areas in Africa in this way. A batch of 20,000 tons went to Malawi. There is a potential in the negotiation for Mykolaiev, but it was conditional on the release of Ukrainian prisoners (soldiers), which the Kremlin did not agree to, so even the liquid ammonia did not find its way out of Russia. The working formula had been found. An American company was taking over the cargo at the entrance of the pipelines from Russia to Ukraine.
Therefore, the Istanbul Agreement remained identical, exactly in its original form. There are 120 days in which the goods can be exported. Although it is a well-deserved success for the negotiators from the UN and Turkey, we also must put a factor of uncertainty on the table. Russia is the uncertain factor in this whole equation. Russia can move and change the rules of the game whenever it wants, with absolutely no respect for rules and agreements. Russia, which in the last 270 days has trampled every written and customary norm of the last 75 years.

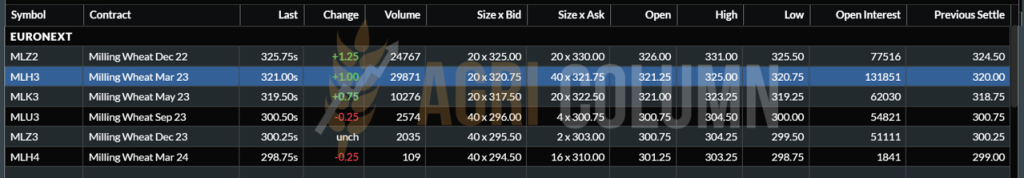
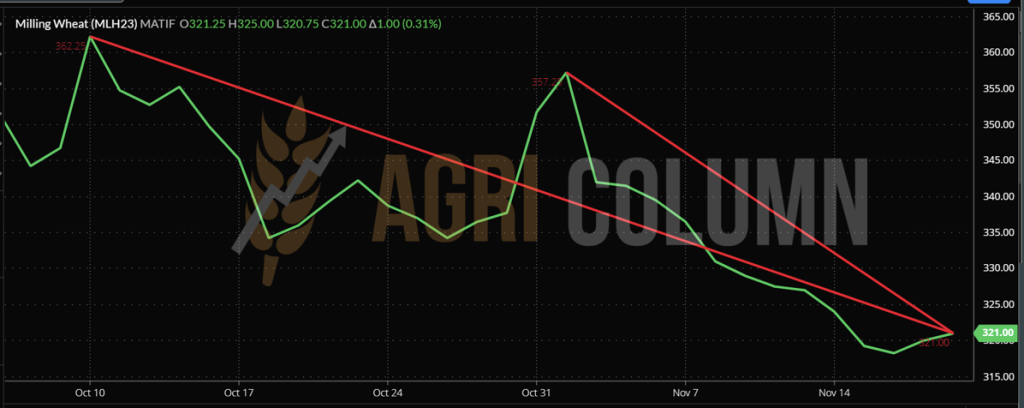
EURONEXT MLH23 MAR23 –321 EUR (+1 EUR)
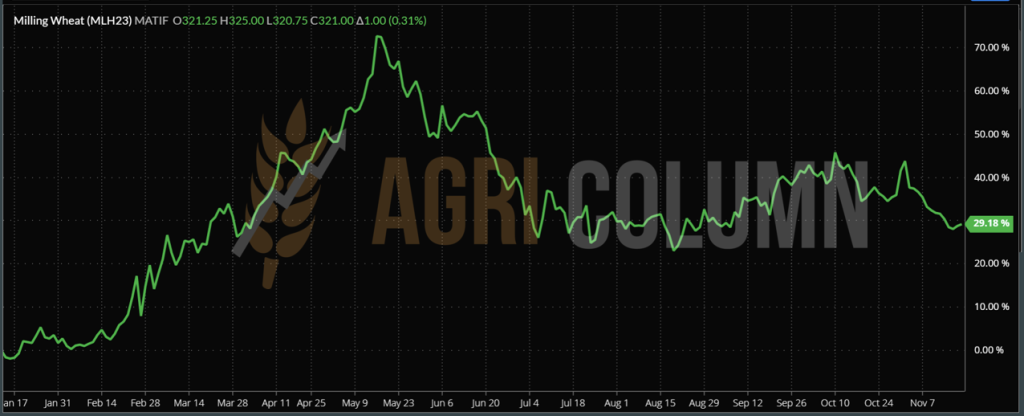
EURONEXT WHEAT TREND CHART – MLH23 MAR23
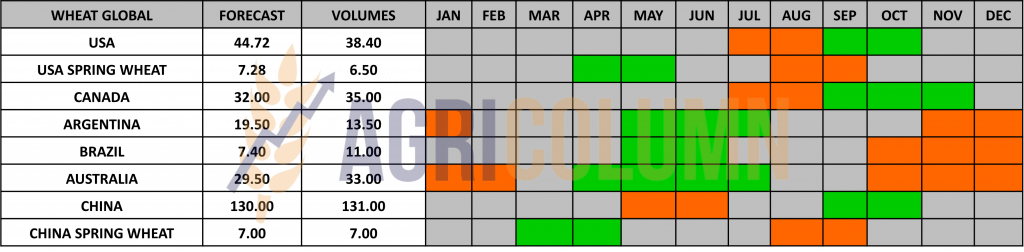
GLOBAL STATUS
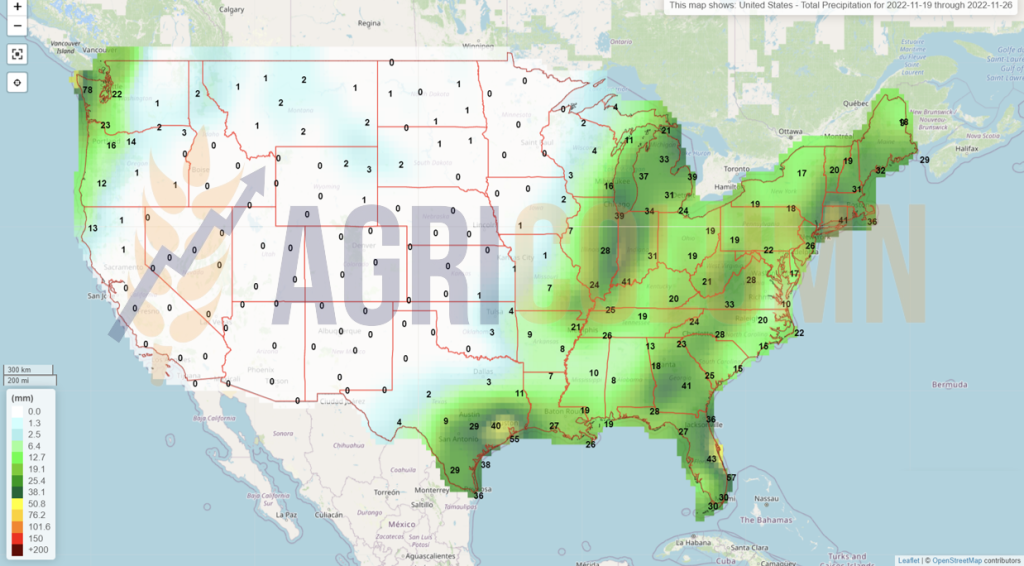
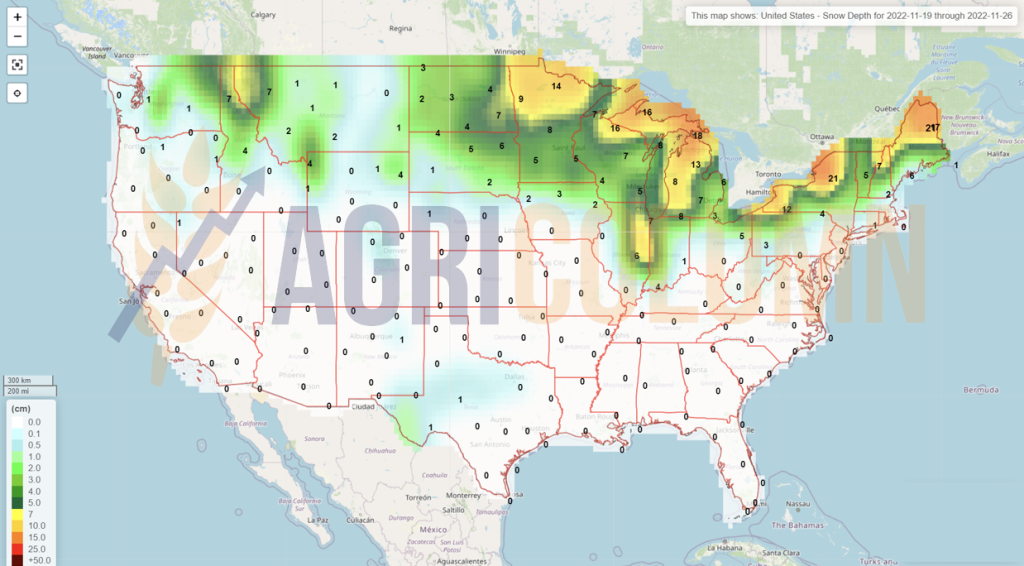
The USA does not see major changes. 77% of American wheat is in dryland areas. So we have an increase in the degree of uncertainty around US wheat. But we must all know that a heavy snowfall will restore the vigor of American wheat.
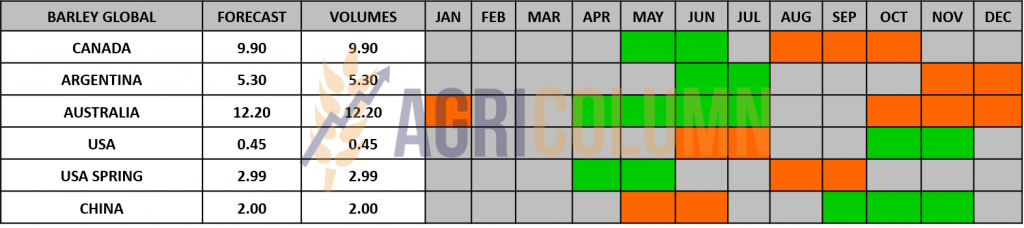
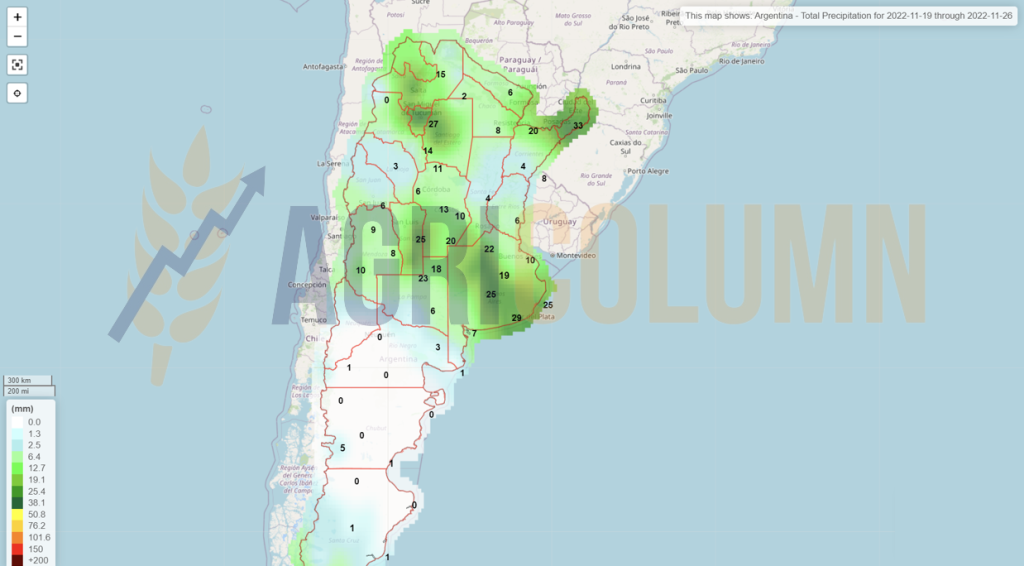
ARGENTINA does not bring anything new this week either. Wheat is in the same desolate condition due to drought.
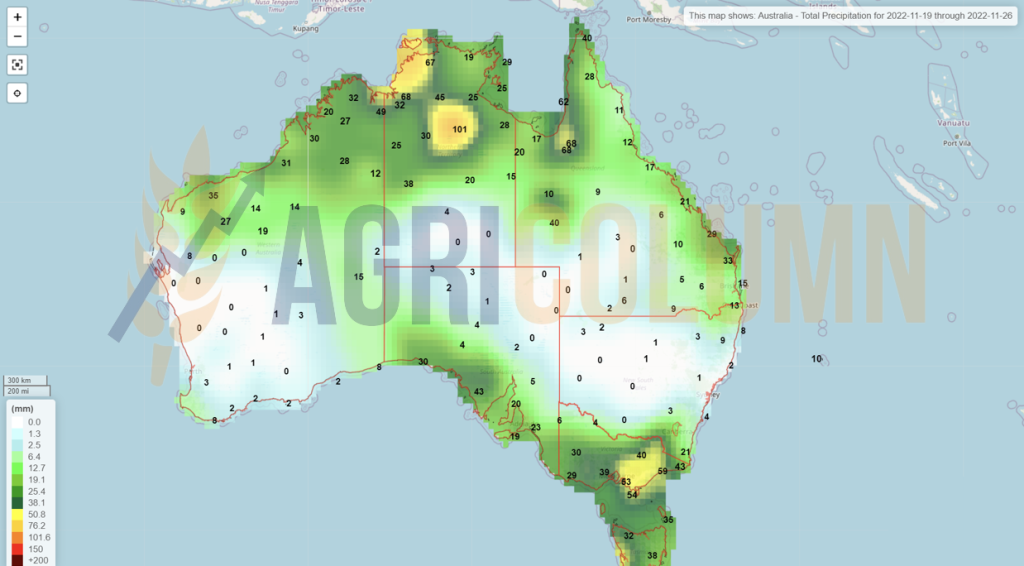
AUSTRALIA goes into harvest. Western Australia is in full blast already and many analysts see the deterioration of the quality of Australian wheat. But the volume will compensate. It is extremely simple. At an export level of 25m tons reflected in an output of 36m tons, they will surely find optimum quality or accept a price degradation to feed demand. And thus, destinations will be able to cover domestic needs.
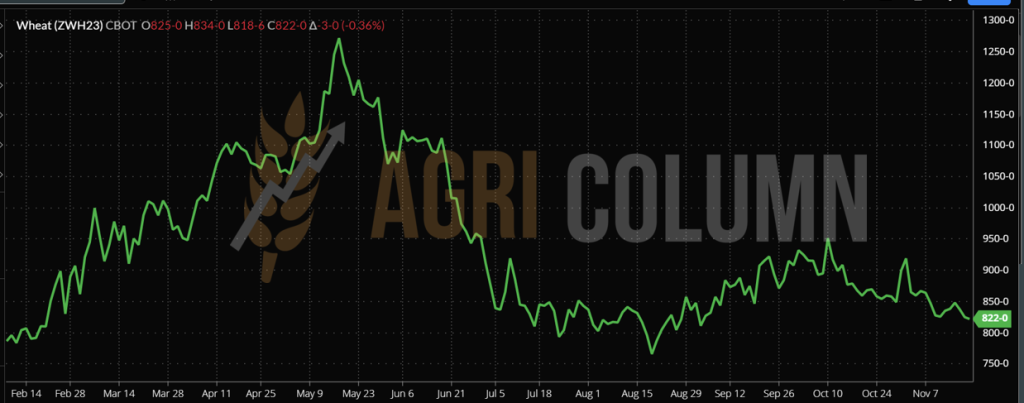
CBOT WHEAT ZWH23 MAR23 – 822 c/bu (-3 c/bu)
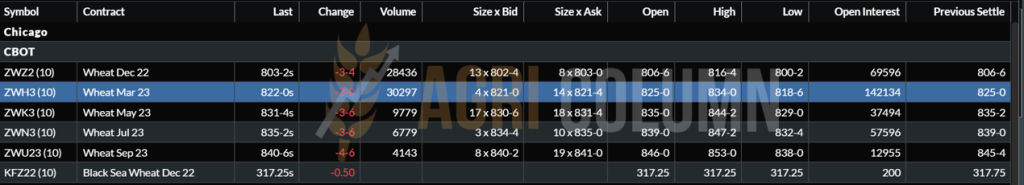
CBOT WHEAT TREND CHART – ZWH23 MAR23
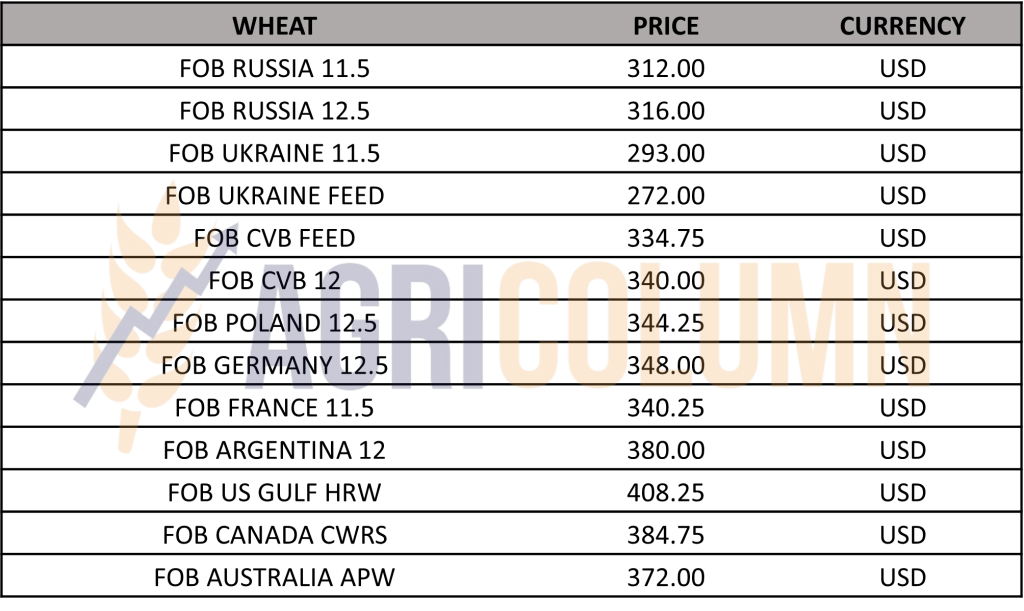
WHEAT PRICE INDICATIONS IN MAIN ORIGINS
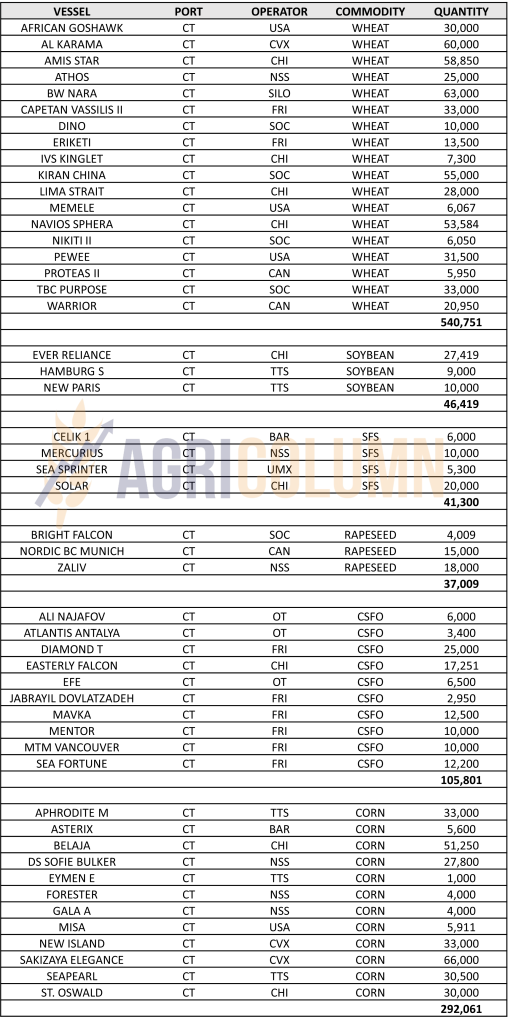
TENDERS AND TRANSACTIONS
GASC EGYPT bought in two direct purchases 280,000 and 300,000 tons of wheat of Russian origin, at a price level of 362.5 USD/MT and 362 USD/MT, respectively. A last purchase of 60,000 tons was reported at the close of 18 November 2022, originating in Russia and priced at 361.5 USD/MT. All quantities are purchased at C&F parity, payable in 180 days.
SAGO SAUDI ARABIA purchased a volume of more than one million tons, more precisely 1,095,000 tons of wheat, at an average price level of 382.56 USD/MT in CIF (COST + INSURANCE + FREIGHT) parity, that is the cost of goods, of transport and insurance, for the seller’s account. Ports of arrival will be Jedahh, Yanbu, Damman and Jizan.
IRAQ. Iraq’s state grain importer has purchased 150,000 tons of milling wheat from Canada, Lithuania and Australia. The cheapest contracted volume was wheat of Australian origin at 480 USD/MT CFR. Offers were also made from Canada at 489.8 USD/MT CFR and from Lithuania at 499 USD/MT CFR. Iraq’s state grain buyer also refused to consider Russian-origin wheat in the tender, despite lower prices. However, only one purchase was made from Russia in direct talks earlier this year. Iraq’s last wheat purchase was reported on November 3, when it reserved 150,000 tons of durum wheat from Canada and Lithuania.
MIT JORDAN canceled a wheat tender of 120,000 tons, although it had the required number of participants: CHS, Cargill, Viterra, Ameropa and Buildcom.
TCP PAKISTAN goes out for wheat again, with a tender for 500,000 tons, closing on 28 November 2022.
CAUSES AND EFFECTS
The Istanbul agreement has been extended and in this state, things are starting to relax. Demand is starting to be very liquid and present. In all this context, we have the closing of positions or their roll-over at MAR23 in CBOT and EURONEXT. There we see daily swings unrelated to physical market fundamentals. We will therefore report from this edition of the report directly to MAR23, leaving behind DEC22.
We’re at the point where we’re starting to measure some metrics of the old crop versus the upcoming crop, and we see the old crop as good enough, with enough stocks, even though half of it is in China. In the present equations we see wheat still without growth potential. The carry cost is not included in any trading sequence.
What will bring substantial changes in terms of the 2022/23 season will be the headlines, the flashes that will generate price spikes. And these will come only from the Black Sea basin. Any tension in Ukraine coming from the Russian aggressor will generate changes in the price of wheat.
EXAMPLE OF RUSSIA-GENERATED SPIKES AND 2022/23 WHEAT DOWNTREND

LOCAL STATUS
The price indications of feed barley in the CPT Constanța parity are at the level of 265-270 EUR/MT.
MIT JORDAN cancels a new tender for the purchase of barley, not even wanting to open the envelopes with the price offers.
ODC TUNISIA purchased 75,000 tons in a tender concluded on November 18, 2022.
BARLEY PRICE INDICATIONS IN MAIN ORIGINS

GLOBAL STATUS

LOCAL STATUS
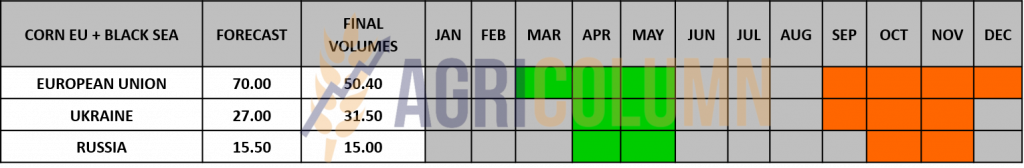
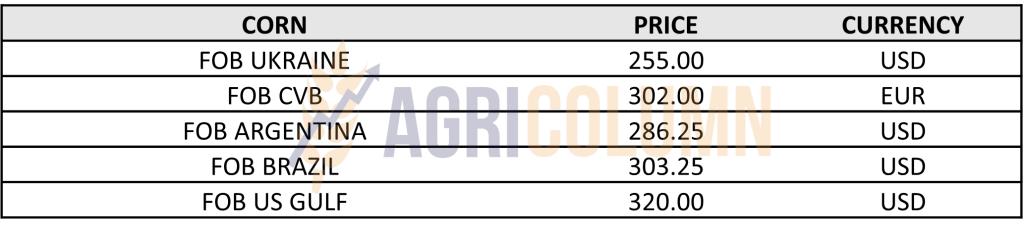
Indications of corn in the port of Constanța are also decreasing this week. They are around 270 EUR/MT in CPT parity.
REGIONAL STATUS
Regionally, we have no substantive changes. Other than Russia harvesting corn extremely slowly, there are no changes. The extension of the Istanbul Agreement is the main driver of the drop in corn prices. It’s a time of price relaxation, but let’s not forget that the price path or corn price life cycle is only in the first trimester.
Price spikes will occur from two ultimate factors: Weather and Regional Conflict.
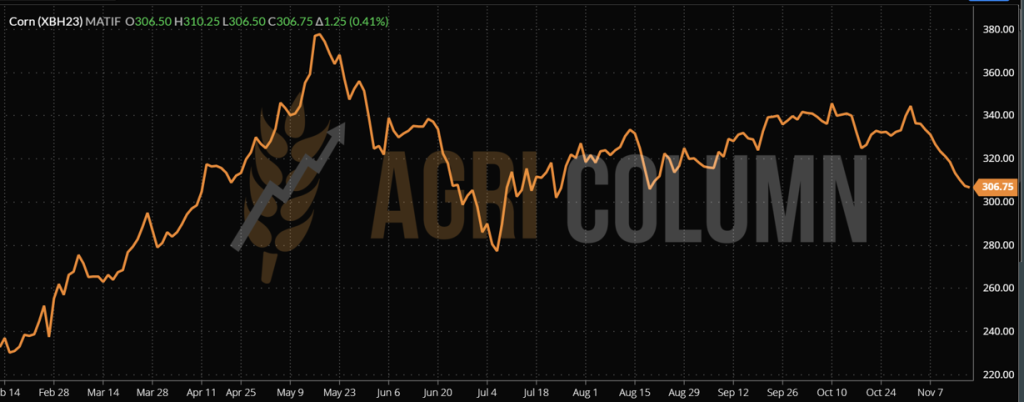
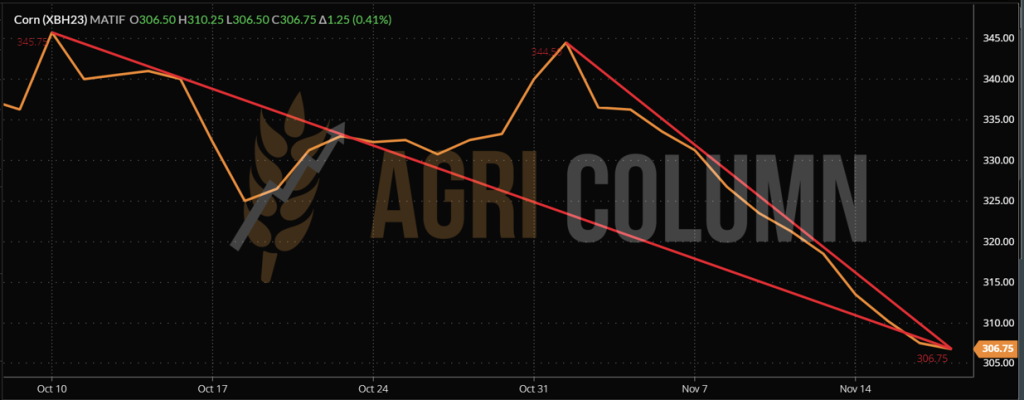
EURONEXT CORN – XBH23 MAR23 –306.75 EUR
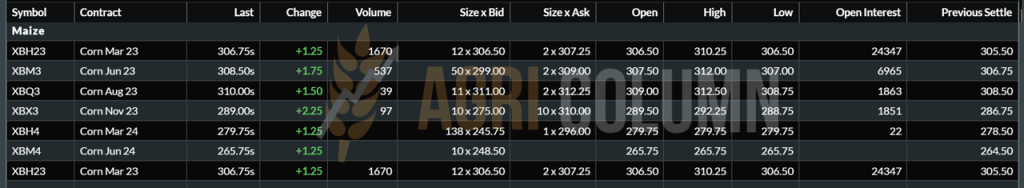
EURONEXT CORN TREND CHART – XBH23 MAR23
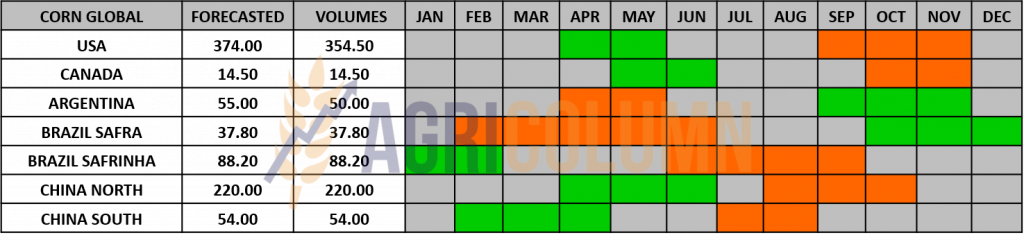
GLOBAL STATUS
ARGENTINA. Same status as last week, slow progress in the seeding process.
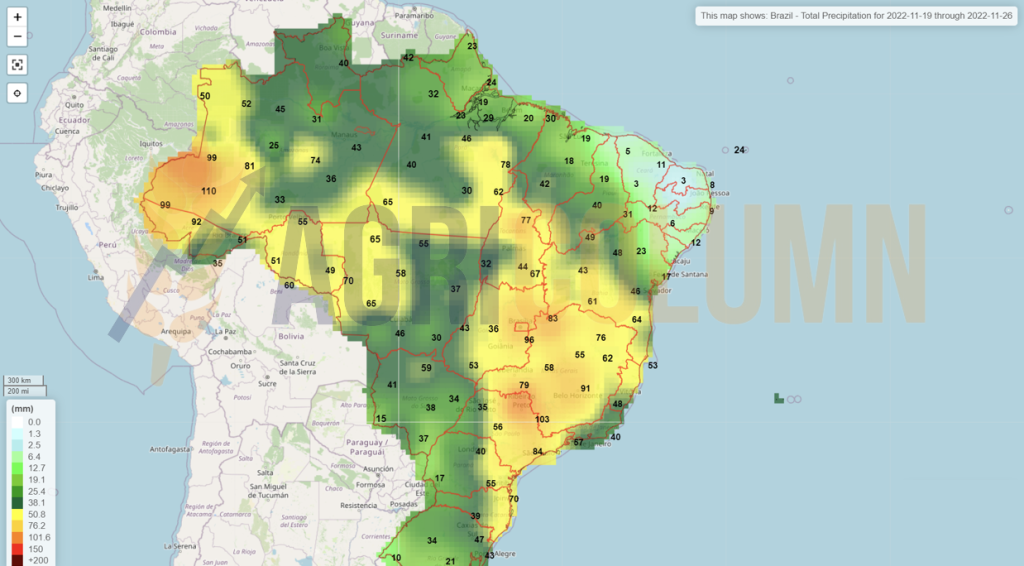
BRAZIL advances. However, the sowing process is much slower than last season, due to excessive moisture in some areas. Some analysts, however, point to the drought in Rio Grande do Sul, but this area is only responsible for 3-4% of the aggregate Brazilian crop.
USA we can declare it over as far as the harvesting process is concerned.
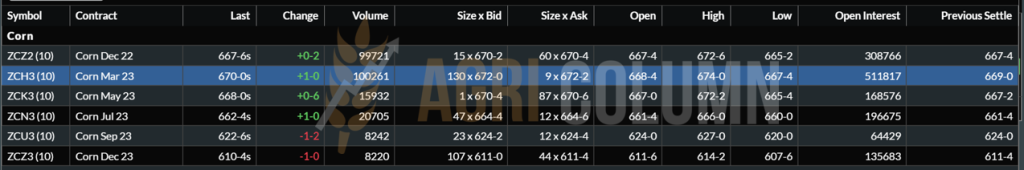
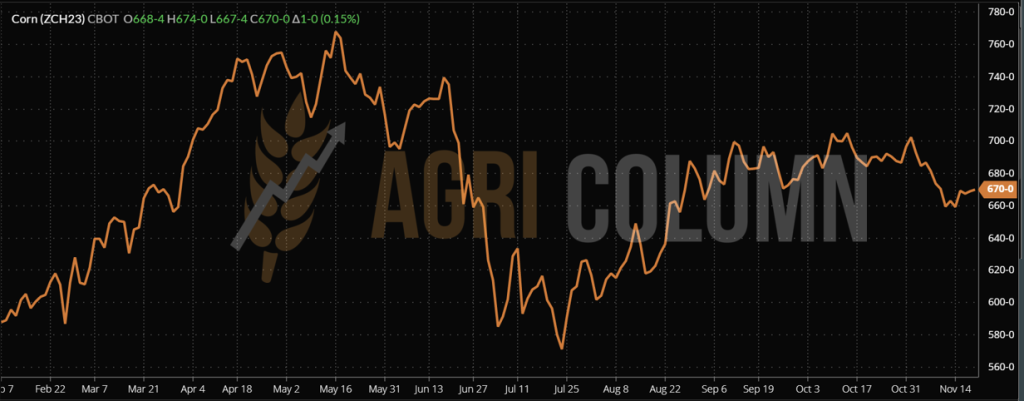
CBOT CORN ZCH23 MAR23 – 670 c/bu
CBOT CORN TREND CHART – ZCH23 MAR23
CORN PRICE INDICATIONS IN MAIN ORIGINS
CAUSES AND EFFECTS
The extension of the Istanbul Agreement generated the same sense of relief turned bearish in physical market fundamentals. Even if Ukraine harvests slowly, the goods are there and will supply the demand from the European Union.
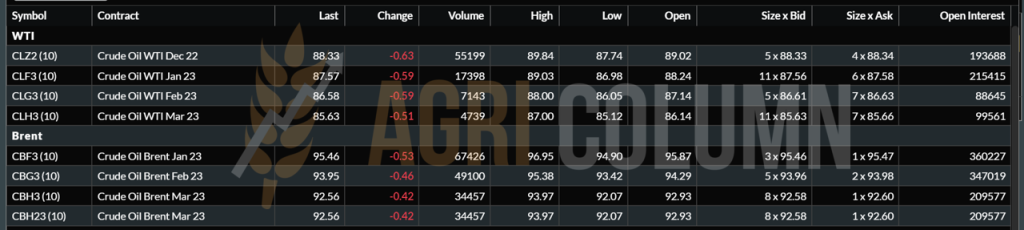
The use of corn in ethanol will be able to be reduced. Demand will decrease amid a reduction in global oil consumption. We are approaching the end of the year and shipping traffic is starting to decrease. This is also seen in shipping quotes.
Apart from this, the population of the globe works remotely and therefore the availability for travel is reduced. But feed consumption is getting a boost from Asia, especially China, which is developing ambitious vertical pig farming projects. So one constant remains, namely the demand for feed and processing in Asia and the European Union.
EXPRESSION OF SPIKES GENERATED BY HEADLINES AND THE WAR IN UKRAINE:

LOCAL STATUS
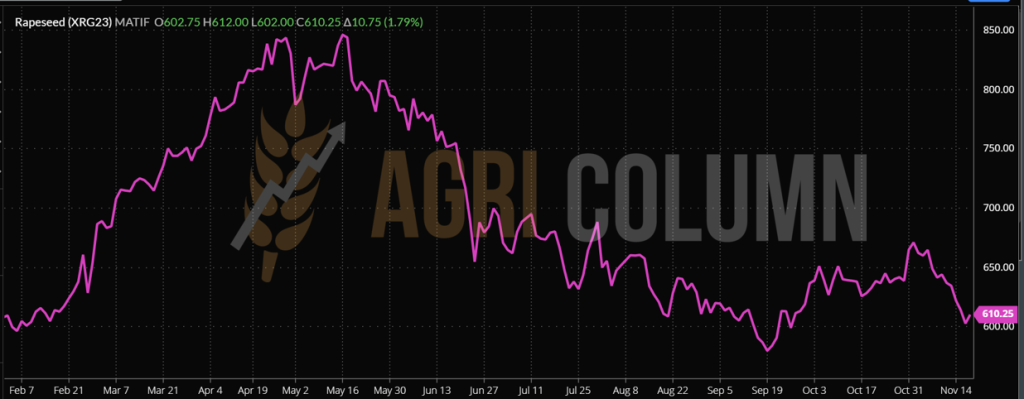
Rapeseed indications appear in the same mold as in the last period, i.e. FEB23 minus 20-25 EUR/MT for the goods delivered in CPT Constanța parity and with FEB23 minus 15-20 EUR/MT for the goods delivered to the processing units.
CAUSES AND EFFECTS
In the coming period, rapeseed will only generate successive ups and downs generated by the correlation with fossil energy and the need for short-term coverage. But, as we anticipated, the demand is covered, and the drop in quotes is a direct consequence of this. Nothing will disturb this pattern until after the holidays. And we are already nearing the end of November 2022.
We regret to say that it makes no sense to believe in an explosion in the price of rapeseed. No factors are working for this option currently.
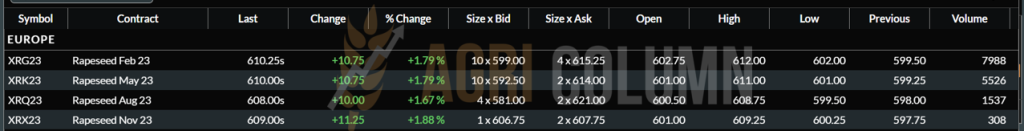
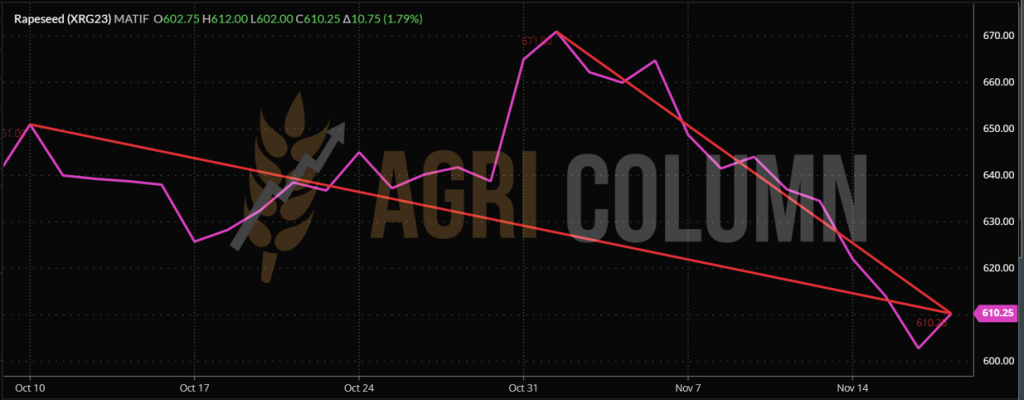
EURONEXT RAPESEED – XRG23 FEB23 – 610.25 EUR
EURONEXT RAPESEED TREND CHART – XRG23 FEB23
GLOBAL STATUS
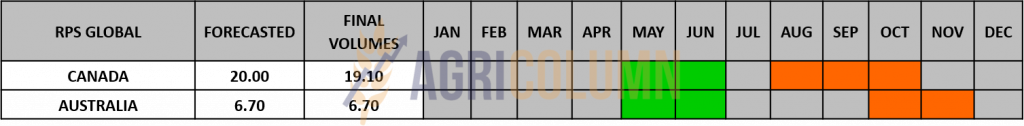
CANADA. Out of season.
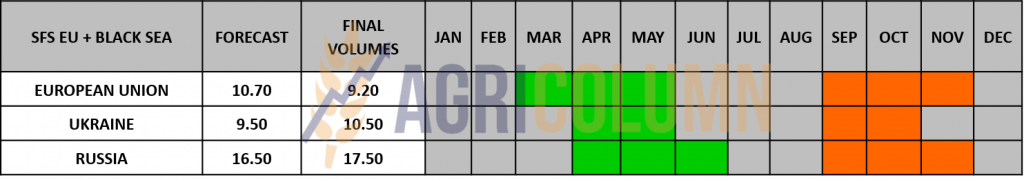
AUSTRALIA will begin shipping from the promised 6.7 million tons crop.
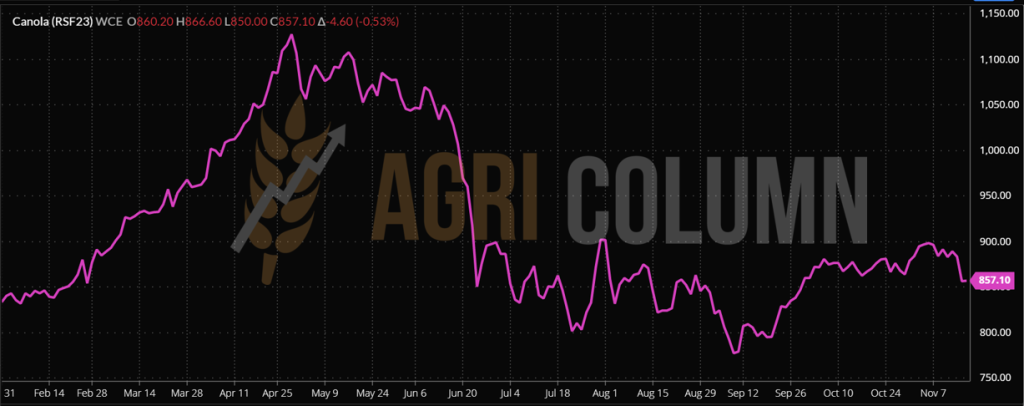
ICE CANOLA RSF23 JAN23 –857 CAD
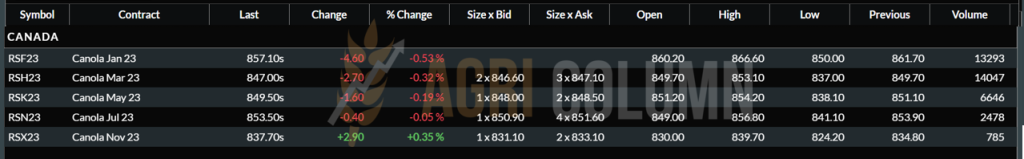
ICE CANOLA TREND GRAPH – RSF23 JAN23
COMPARATIVE GRAPH. PETROL-RAPESEED-CANOLA CORRELATION
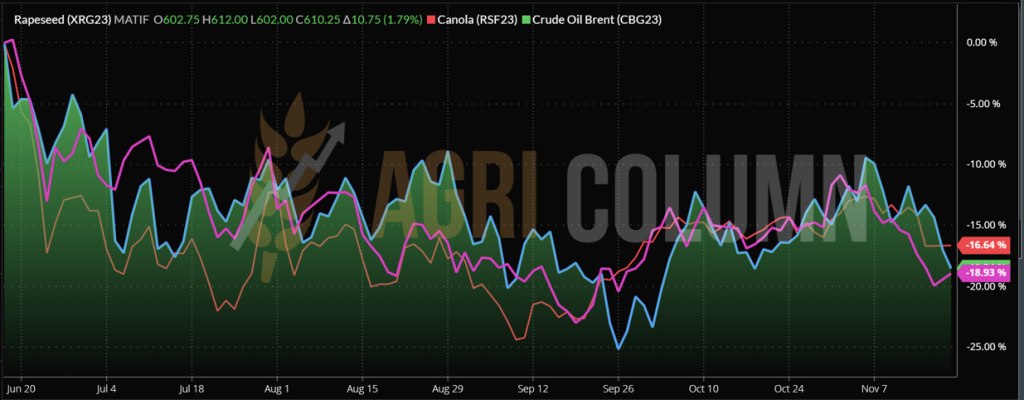
MINUS 60 EUROS XRG23. These are the losses collected by canola amid commodity liquidity and Australian potential, associated with the extension of the Istanbul Agreement.
CAUSES AND EFFECTS
Rapeseed does not generate growth potential in the next period. It is touched, in turn, by the de-tensioning effect of the Black Sea basin.
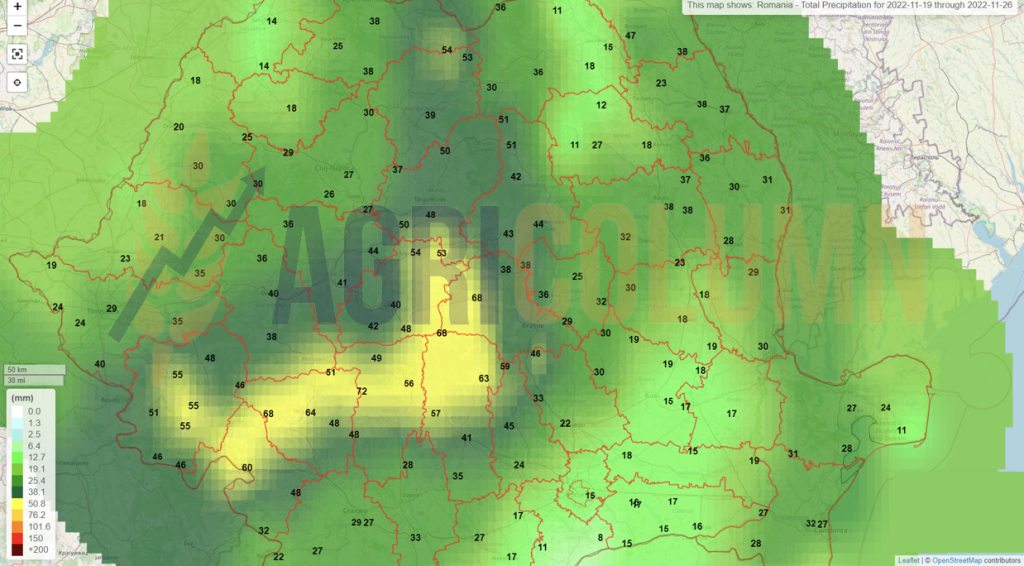
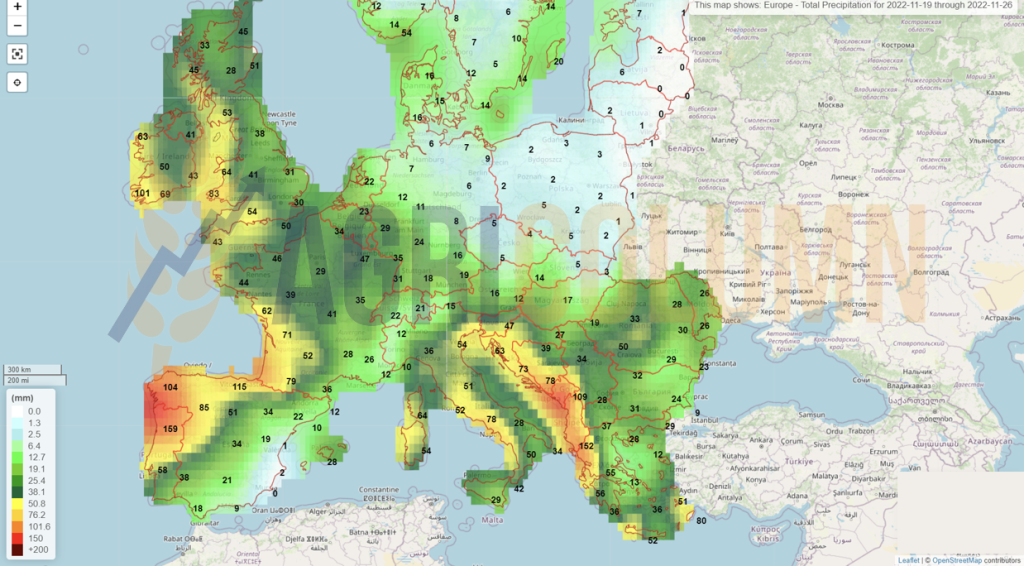
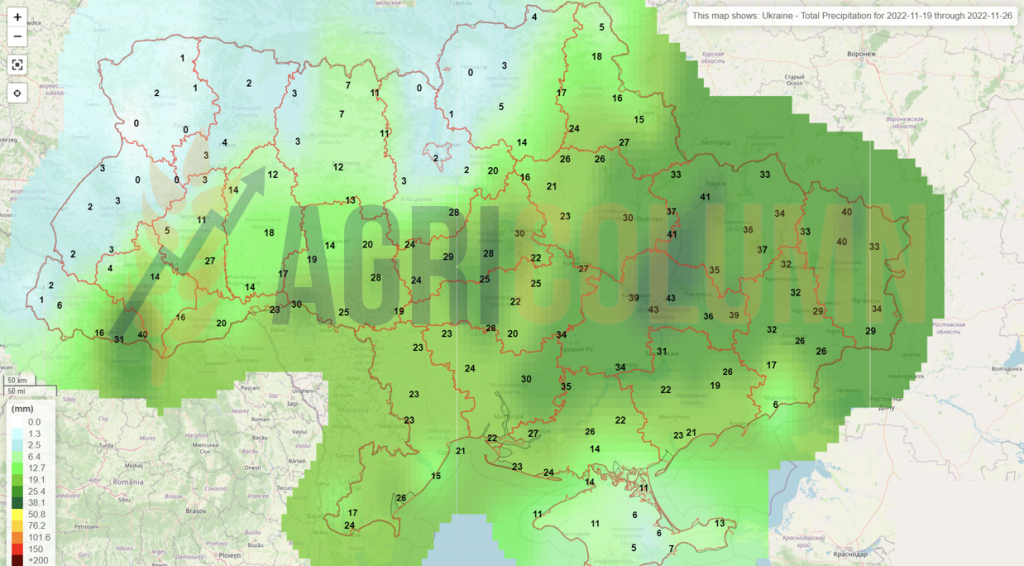
Things are also relaxing weather-wise. Precipitation exists in the EU, it has also arrived in Romania, in Ukraine it is raining, so there is no implicit reason at this moment for a potential shortage next season. India also points to an increase in the area sown with rapeseed, a sign that this crop is highly valued.
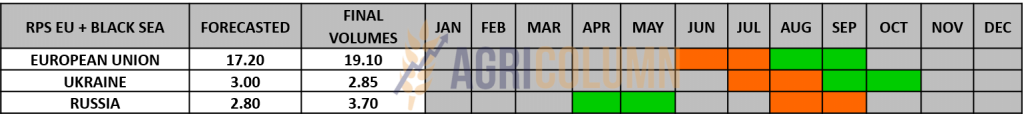
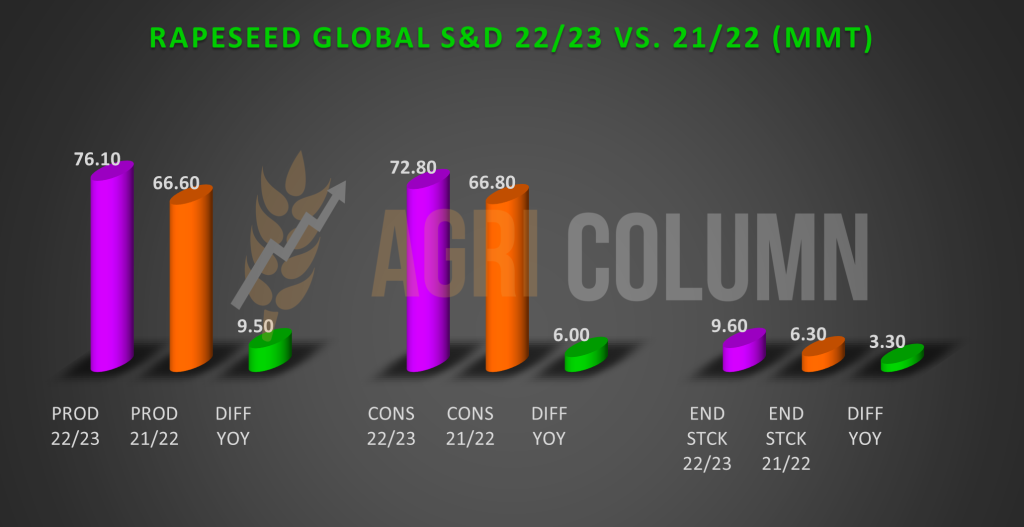
What we still need to understand about rapeseed are the fundamentals of the physical market, which very clearly indicate a higher production compared to last season by 9.5 million tons. We also see higher consumption, indeed, but only by 6 million tons and consequently a higher ending stock level by 3.3 million tons. We have inserted the table for comparison, as well as the subsequent graph.


LOCAL STATUS
The primary indications for sunflower seeds are 570 USD/MT at the level of the Constanța port and about 5-10 USD/MT lower at the level of the processing units.
Bulgarian processors indicate a level of 580 USD/MT in DAP parity, and the cargo originating in Ukraine places it at 570 USD/MT.
CAUSES AND EFFECTS
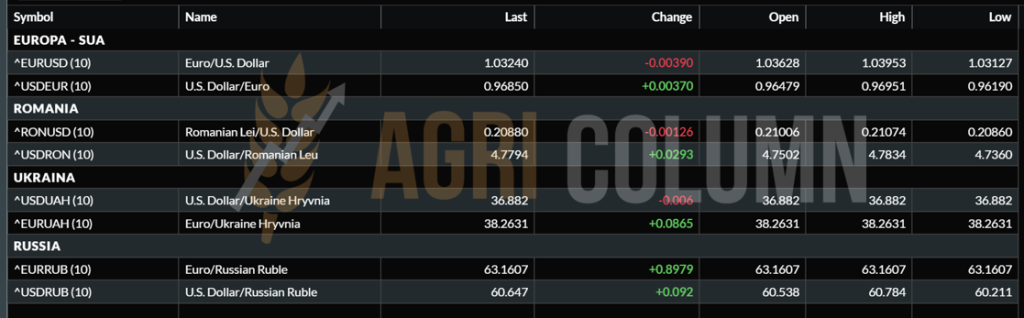
The RELAXATION brought by the extension of the Istanbul agreement is also induced to sunflower seeds. The fact that Ukraine will still be able to export crude oil (CSFO) has led to a 10 USD/MT drop in price. Last but not least, the penalty also occurs through the USD/RON exchange rate. The momentum of the US dollar also stops somewhat in relation to the national currency, so that farmers receive much less per ton of goods.
REGIONAL STATUS
UKRAINE will end the harvest at the level of 10 million tons, by no means the value of 10.5 million tons that they estimated some time ago.
RUSSIA drops, exactly as we predicted, to the level of 16.35 million tons.
The EUROPEAN UNION finds itself in the same status as last week.
GLOBAL STATUS
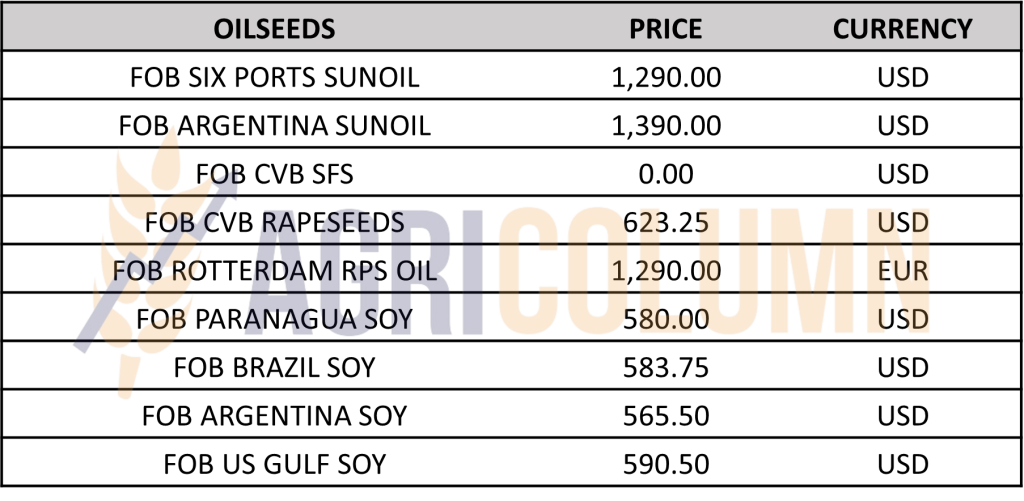
PRICE INDICATIONS FOR OILSEEDS AND CSFO IN MAIN ORIGINS
CAUSES AND EFFECTS
The price level decreases, given the extension of the Agreement and the security generated on this fund. SIX PORTS CSFO indications also decrease subsequently. Relaxation is in order, but not for long. Data on the crop of the 2022/23 season vs. the previous season indicate obvious imbalances. Naturally, we won’t see the 1,000 USD/MT commodity prices again, as they were only generated by the strangulation of Ukrainian oil.
But now, in addition to the details of the 2022/23 season, we also have the destruction of Ukraine’s energy infrastructure by 40%, which will lead to reduced processing capacity. At the same time, Ukrainian and Russian farmers do not want to sell the goods cheaply.
On top of the above, the law that is still under debate in Ukraine could also cause turbulence. This is a law that will require a deposit of 15% of the value of the goods in Ukrainian banks until the accounts are credited with the value of the exported goods, which would reduce the export flow on all goods and leave it to those who have sufficient working capital to afford this level of collateral.
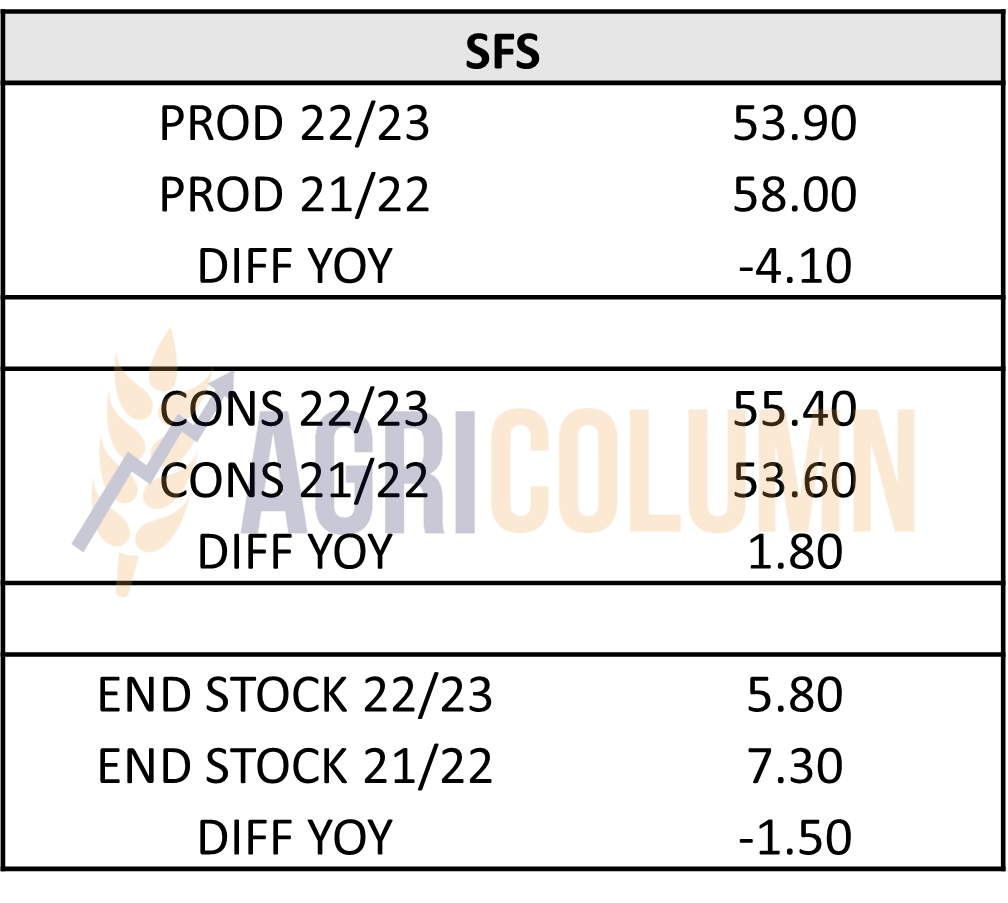
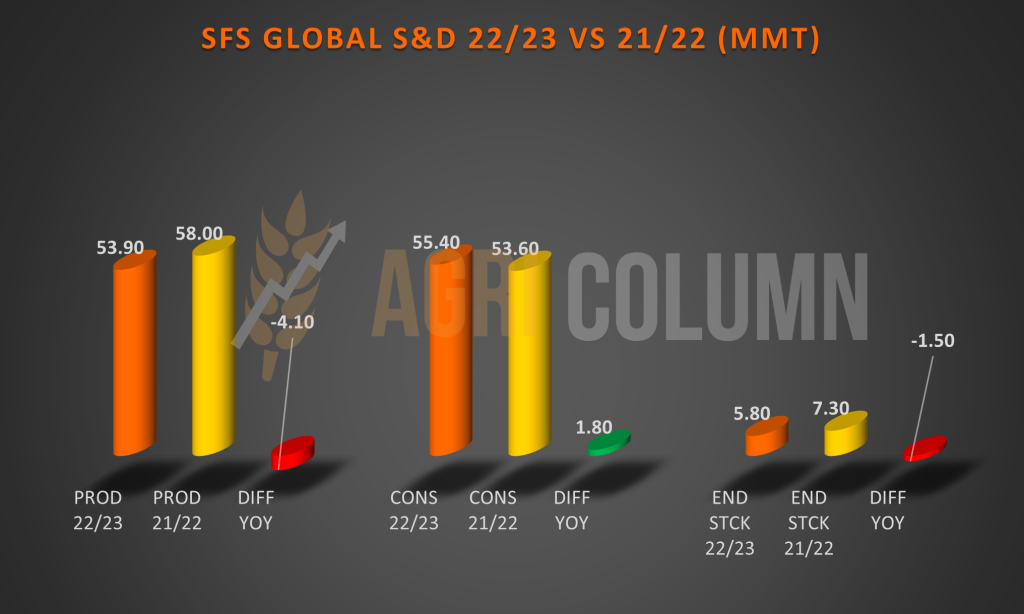
So here is how the 2022/23 season looks globally compared to the previous one, which, let’s not forget, was a very attractive one in terms of volumes. We’ve been talking for a while about the pairing between 2020-21 and 2022-23, and here the numbers bear it out. We have an imbalance compared to the previous season, 2021-2022. We therefore have a production level down by 4.1 million tons compared to last season, consumption up by 1.8 million tons and a negative ending stock level by 1.5 million tons.

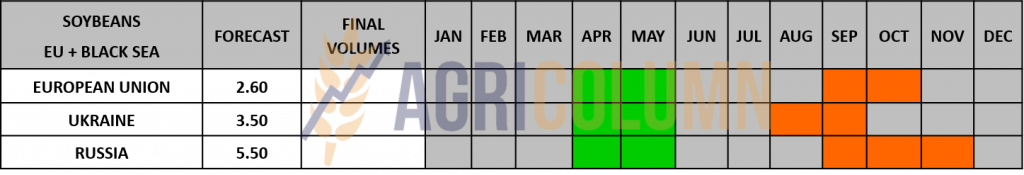
LOCAL STATUS
In Romania, the price indications for soybeans are at the level of 560 USD/MT DAP processing units for non-GMO soybeans. Between 1 July and 13 November 2022, approximately 115,000 tons of soybeans were imported.
REGIONAL STATUS
Weekly soybean imports by EU countries reached 83,000 tons, due to reduced supplies from the US and Brazil, the EU’s main soybean suppliers, according to European Commission data. Total EU soybean imports from 1 July 2022 increased to almost 4 million tons, which is still 13% lower than last year. The main soybean buyers were Italy and Portugal, with quotas of 26,000 tons and 20,000 tons respectively.
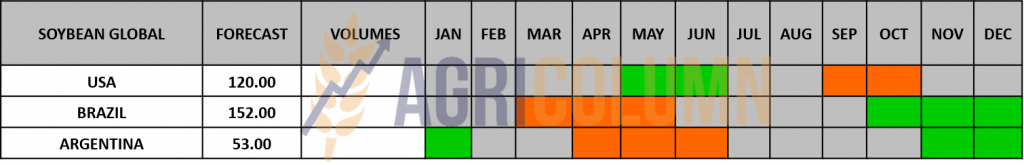
GLOBAL STATUS
USA. The U.S. soybean harvest advanced, and the USDA said 96 percent of the soybean crop was harvested, up from 91 percent a year ago.
US net soybean export sales rose strongly in the week to November 10 and topped market expectations at 3 million tons. China remained the main destination for soybean sales, receiving 1.5 million tons, and other relevant destinations were Mexico (455,500 tons), unknown destinations (397,600 tons), Germany (138,900 tons) and South Korea (108,800 mt).
BRAZIL. Soybean planting in Brazil advanced to 69%, last week’s sunny weather favored the advance of planting in southern areas, where excess moisture had caused delays in planting and plant development. On the other hand, in the west-central part, the lack of rainfall and heat last week prevented the completion of work and the germination of the last seeded areas, leaving the producers anxiously waiting for the confirmation of the forecast volumes.
Brazil’s 2022/23 soybean crop is expected to reach an all-time high of 154.5 million tons, about 21.3% above last year’s 125.8 million tons and 2% above previous estimates in July, of 151.5 tons, according to Safras & Mercado.
Brazil’s soybean exports are expected to reach 78 million tons in 2022, 9.3 percent less than last year’s 86.6 million tons, according to information provided by the country’s grain exporters association.
ARGENTINA. With the support of recent beneficial rains, Argentine soybean plantings are underway and have reached 12%, according to Bolsa De Cereales. Soybean sales by Argentine farmers reached 72.2% of the crop’s 2021/22 crop, slightly behind the 74.2% sold at the same time last year.
Argentina’s soybean complex is paralyzed as strong rumors of the government’s reintroduction of the “soy dollar” prompt market players to wait and see before a possible announcement.
The program, which ended at the end of September, resulted in an exceptional volume of soybean sales, with 13 million tons of soybeans being recorded. However, this also led to a drop in activity after the program ended, as much of the sales were originally planned to take place in October and November. About 16 million tons of soybeans remain to be sold from the 2021/22 crop including contracts pending for price setting (committed quantity but no set price).
CHINA. China, the world’s largest producer and consumer of soybean meal, is considering allowing large-scale imports of Brazilian soybean meal amid continued domestic shortages, but many market participants doubt processors will import even if it is approved.
Soybean processed volumes in China rebounded slightly from the previous week by 10,000 tons to reach 1.53 million tons, up 0.66 percent, according to data from the National Cereals and Oil Information Center (CNGOIC).
Soybean stocks fell 5.71 percent from last week to 2.97 million tons on Nov. 15 as processing volume outpaced soybean shipments, reducing supply. Soybean volumes arriving in China were lower than expected, but following rising water levels along the Mississippi River recently, arrivals are expected to accelerate. However, due to increased production at processing plants, it will take some time for soybean stocks to build up.
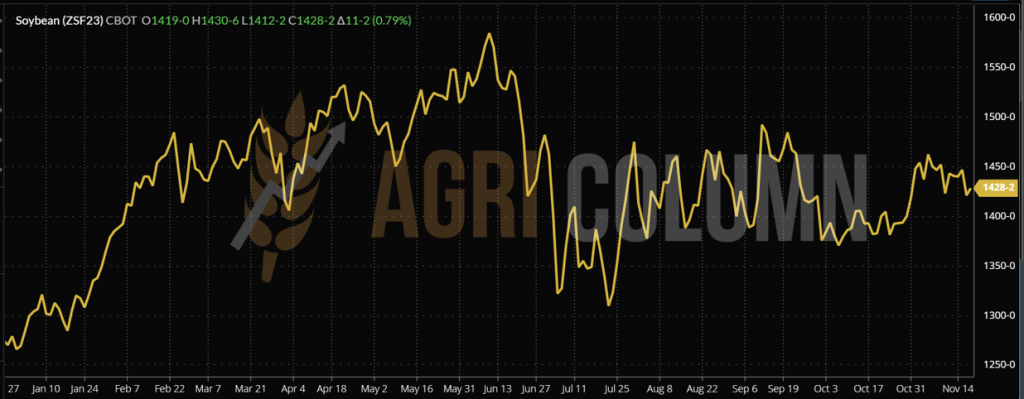
CBOT SOYBEAN ZSF23 JAN23 – 1,428 c/bu
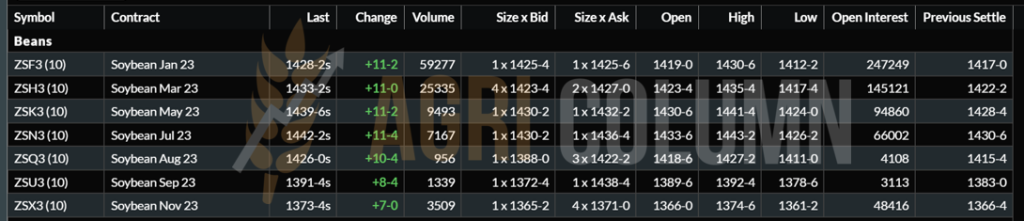
CBOT SOYBEAN TREND CHART – ZSF23 JAN23


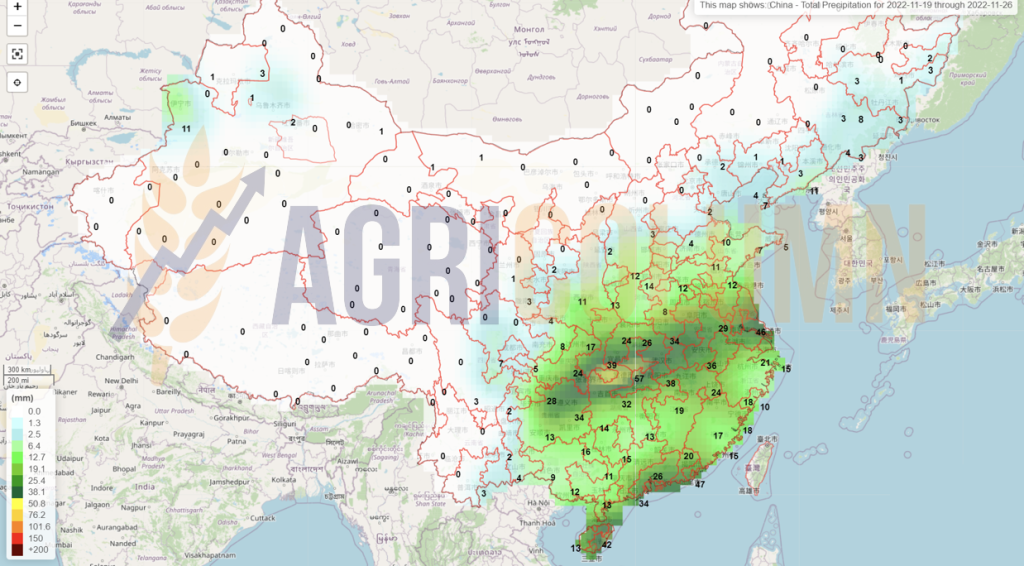
19-26 November 2022
Romania
Europe
Ukraine (rains)
Ukraine (snow)
Russia (snow)
USA (rains)
USA (snow)
Brazil
Argentina
China
Australia