This week’s market report provides information on:

LOCAL STATUS
The exporters’ indications for wheat in the CPT Constanța parity are anchored around the values of 335-337 EUR/MT. The discount for feed wheat is still at the level of 25 EUR/MT. Domestically, purchase price levels remain unchanged at 320-325 EUR/MT.
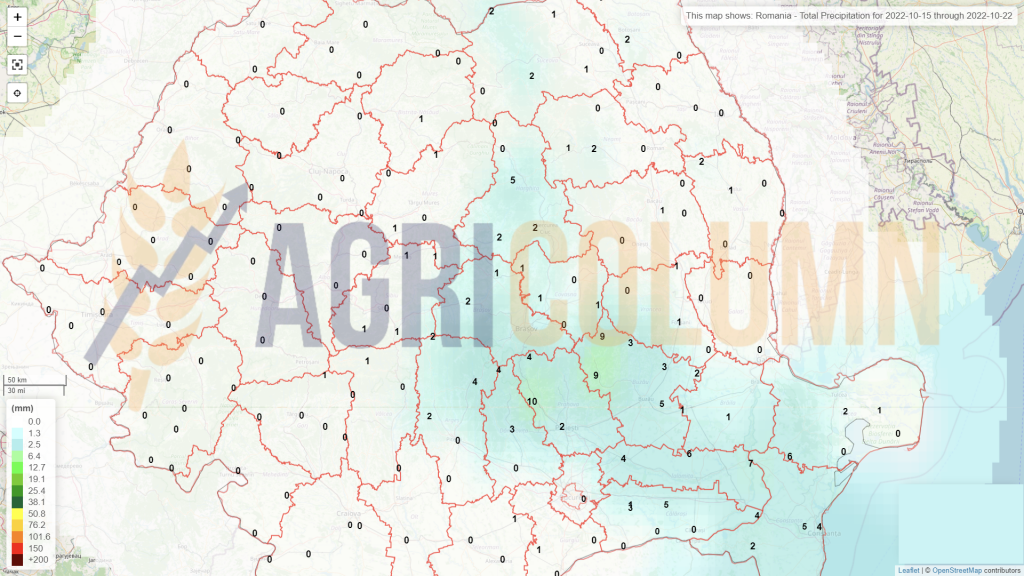
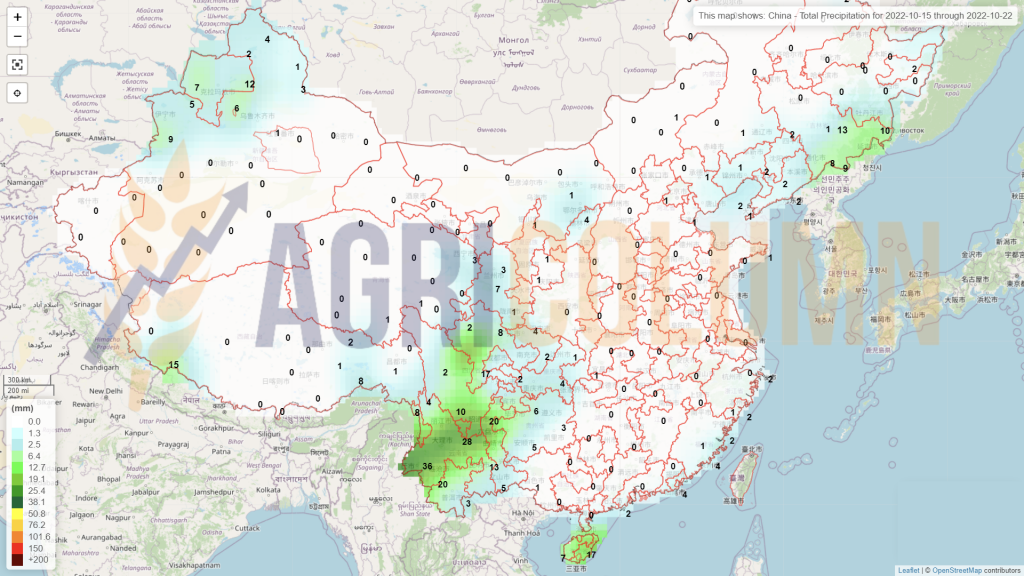
We are in the sowing window and it is a favorable moment for Romanian farmers. They are speeding up the process, since we are on October 17, 2022 and there is not much time left, especially since the night temperatures are starting to drop around 7 degrees, which does not help the germination of plants. The soil water reserve is not optimal, precipitation is not on the horizon until the end of October, but if it comes at the beginning of November, it could be an excellent start for Romanian wheat.
CAUSES AND EFFECTS
In Romanian farms there is extremely much unsold wheat and this is a cause for the future effects. Practically, a lot of inputs are due towards the end of October, and some of the goods have to be sold.
The problem is that physical market fundamentals, as they are identified today, do not show any upside potential for the price of wheat. Only the impulses generated by the Russian attacks and political statements move the market a little, but these headlines generate movements in the virtual market only. The effects in the physical market are much more limited. There is simply too much wheat in the market.
REGIONAL STATUS
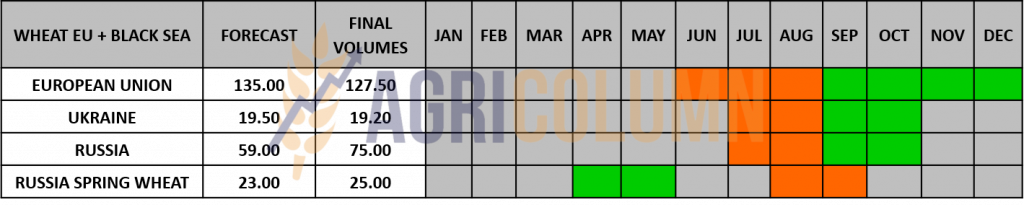
UKRAINE predicts a much lower level of winter wheat seeding. Normally, Ukraine had a norm of 6.5 million hectares, but the information claims that they will finish close to 4 million hectares, more precisely 3.9 million hectares. What is unclear in this whole landscape is what areas are in the Russian occupation zone as well as in the conflict zone.
Surface alteration would mean production of 22 million tons in 2023, which is in line with the 20.5 million tons accumulated in 2022. But we will soon have more precise data as the seeding window closes at the beginning of the month November.
RUSSIA. On October 10, 2022, official Russian data indicated a level of 102 million tons of harvested wheat (bunker weight), i.e. cargo received at silos.
Wheat (bunker weight) = 101.9 million tons (last year at this time – 74.5 million). The yield for the current year increased from 2.8 tons/ha to 3.6 tons/ha.
In total, as of October 10, 2022, according to the Ministry of Agriculture of the Russian Federation, the sowing of winter crops was carried out on 9.56 million hectares, compared to 10.76 million hectares on the same date last year. This clearly tells us that wheat area will clearly decrease due to reduced profitability.
The EUROPEAN UNION is raised by the WASDE report with 2.7 million tons of wheat being distributed between Germany and Poland. Otherwise, in the Union, autumn sowing continues, with farmers also here in the operational work window.

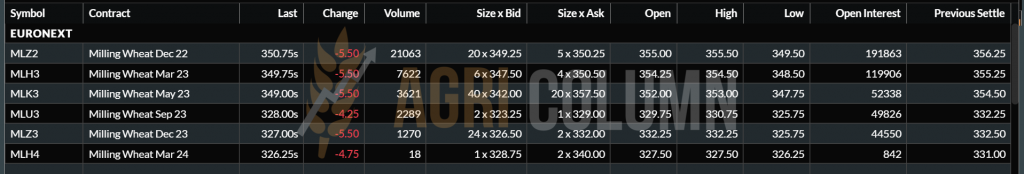
EURONEXT MLZ22 DEC22 –350.75 EUR (-5.5 EUR)
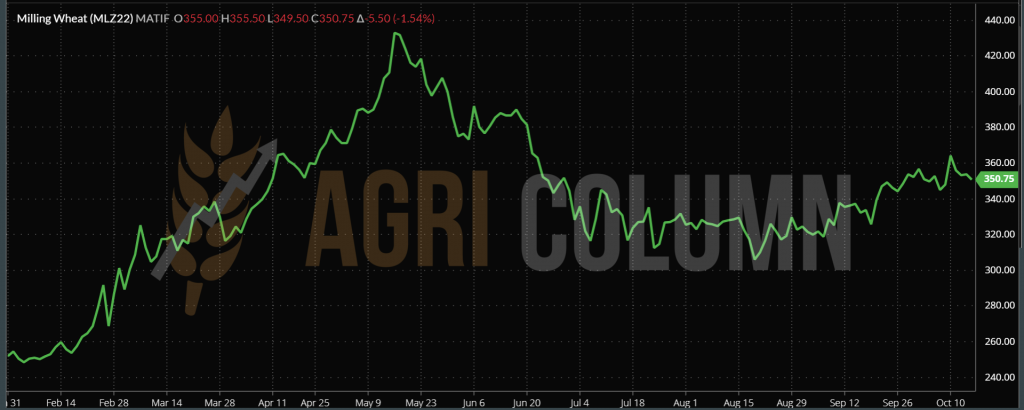
EURONEXT WHEAT TREND CHART – MLZ22 DEC22
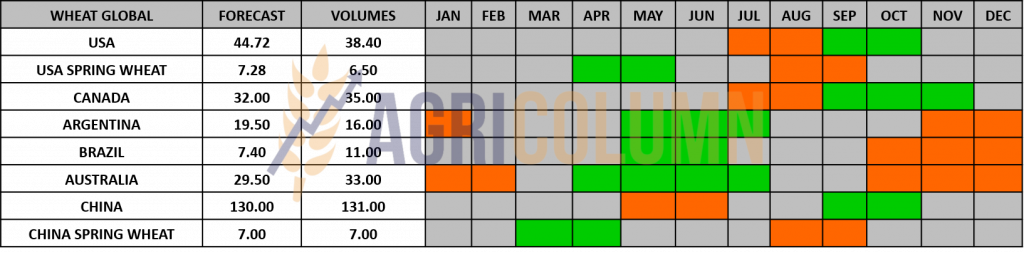
GLOBAL STATUS
The US have no changes either following the WASDE report. They therefore remain at the level of 44.9 million tons.
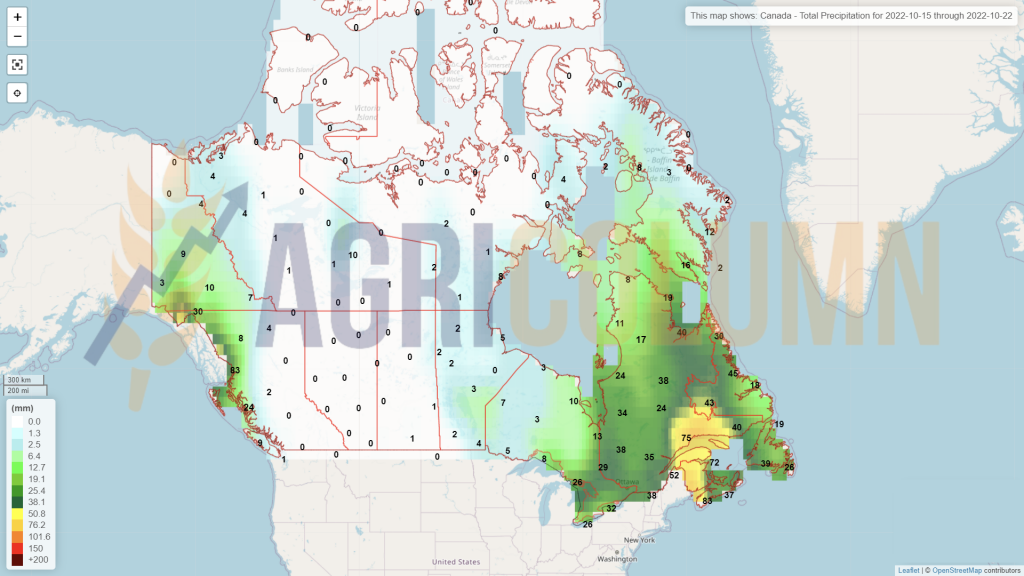
CANADA ends harvest at a level of 35 million tons, according to the forecast. Very small areas across Alberta and Manitoba remain harvestable, a maximum of 1% of the area. Saskatchewan has about 7% of its wheat fields left to harvest, so we can say that Canada is also closing its wheat harvest.
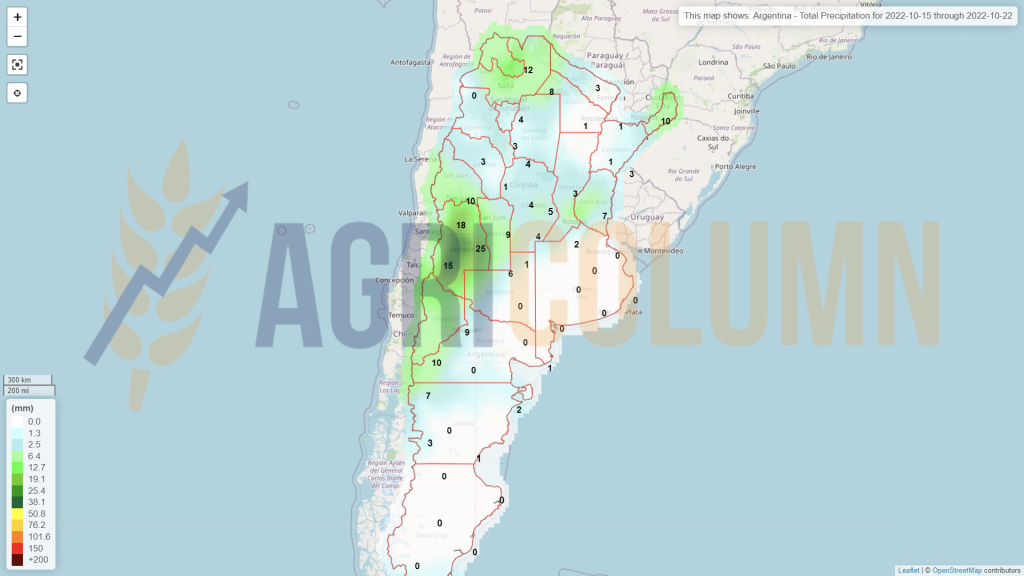
ARGENTINA presents an update of the crop forecast and the indication is not a very happy one. A further reduction of 0.5 million tons brings the forecast to 16 million tons. But still, the drought is present and the prospects for further reductions are predictable.
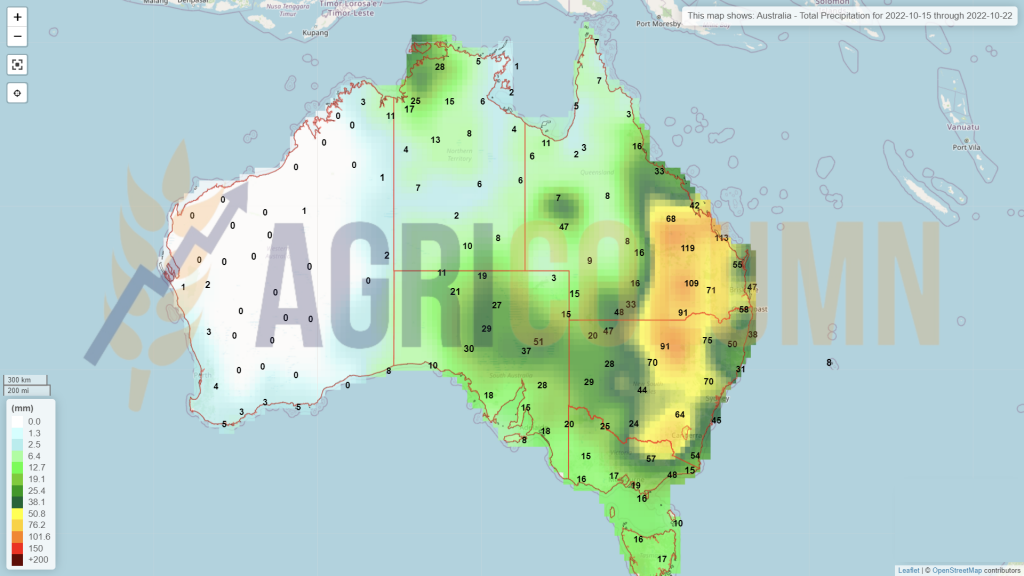
AUSTRALIA is nearing harvest time. The forecast of 33 million tons remains valid, but doubts about quality exist and will turn into certainties. Precipitation continues across the Australian continent.
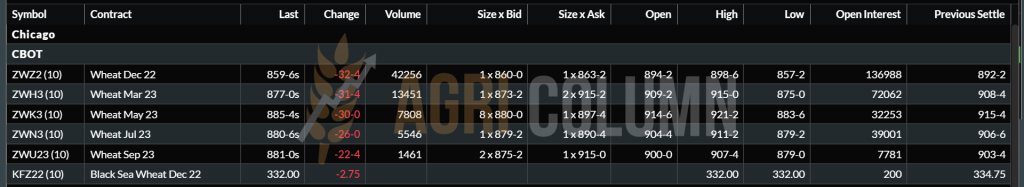
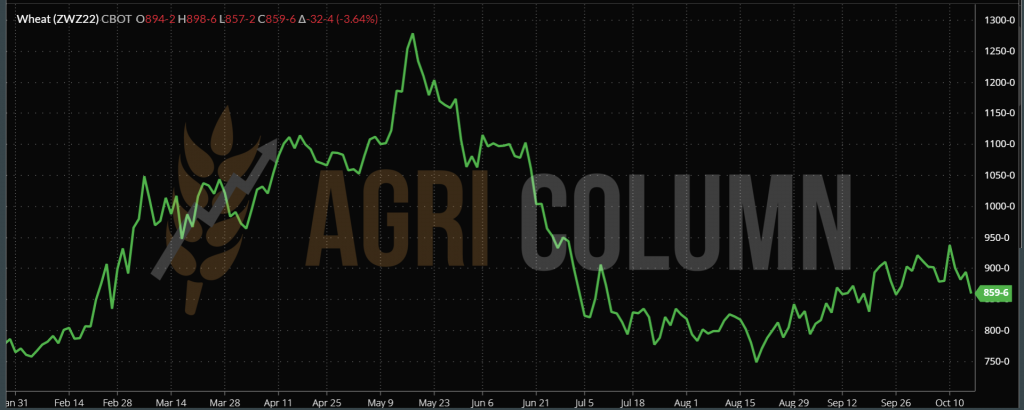
CBOT ZXZ22 DEC22 – 859 c/bu (-32 c/bu = -11.75 USD)
TREND CHART – ZWZ22 DEC22
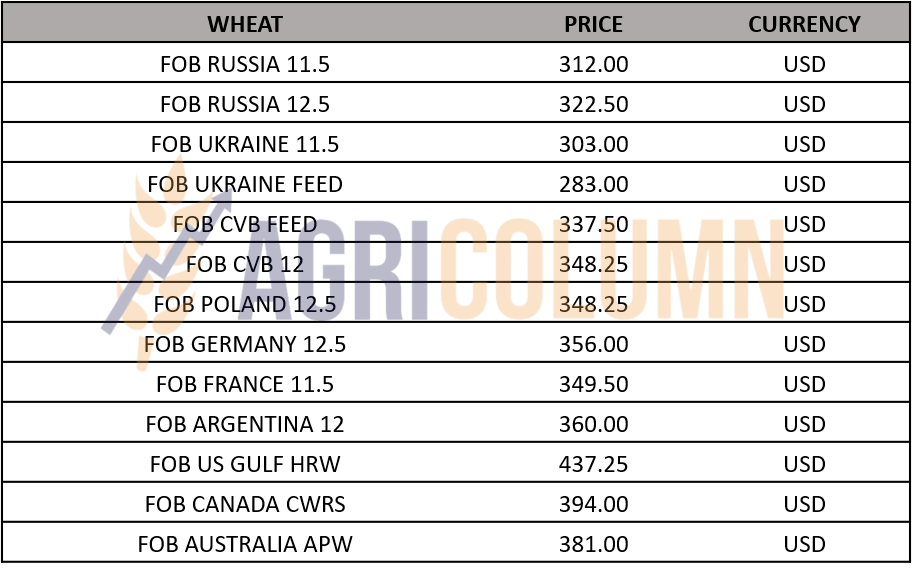
WHEAT PRICE INDICATIONS IN MAIN ORIGINS
CAUSES AND EFFECTS
These days we are witnessing a market dominated only by headlines, that is, a market marked only by impulses generated by the Russian savage bombings in Ukraine, which brought accelerated growth in the stock markets, especially on the CBOT. A savage attack on 16 Ukrainian cities in which numerous civilian targets were targeted has induced the potential for growth in trading algorithms.
After the second and third day in a row, things started to go back to normal. It was logical, because Russia could not sustain this rain of fire on Ukraine continuously. Quotations began to fall and funds began to liquidate positions by performing profit taking.
In the evening of October 13, however, Russia comes out again with statements in which they nuance the fact that they will no longer provide support for the continuation of the Green Corridor for goods from Ukraine if they are not allowed to export fertilizers.
And so we come to the forecast generated by us some time ago, namely the fact that Russia was not given what was promised by the Istanbul agreement, where it had only Mr. Erdogan and the UN through Mr. Guterres as a partner, not at all the European Union.
FROM EVERYTHING WE HAVE AS A GROUP OF DATA AND INFORMATION, WE EXTRACT THE FOLLOWING:
- The United Nations has been engaged for weeks in intensive closed-door negotiations aimed at allowing Russia to transport large quantities of ammonia gas, a key ingredient in nitrate-based fertilizers, across the battle line through Ukrainian territory to Black Sea.
- From there, it will be shipped to ports around the world as part of a multibillion-dollar deal expected to improve agricultural yields and alleviate world hunger. Guterres and his team are actively working to facilitate the export of Russian grains and fertilizers, the UN Secretary-General’s spokesperson wrote.
- The UN believes that the ammonia pact is the key to avoiding a global food crisis. The UN tried to overcome Ukrainian objections to dealing directly with Moscow by brokering a two-party deal: Russian company Uralchem would transport its ammonia gas to the Ukrainian border, where it would be bought by an American trading company, Trammo.
- Russia is effectively suffocated at this point. Wheat, gas and oil are their keys to prosperity. Gas is no longer delivered to the European Union; recent moves have decoupled deliveries via North Stream 1. North Stream 2 remains.
- Russian gas is also used for fertilizers which, however, do not leave the territory of the Russian Federation. Moreover, stocks in European Union countries are frozen. Thus, Russian fertilizer production is put on hold.
- Oil will also stop being delivered due to sanctions from November 1, 2022. Another major problem. Any attempt to ship via turntables will be heavily discounted. So profit will thin out majorly. The cost of extraction and logistics of Russian oil is 44 USD/barrel.
- Wheat is extremely large in volume. Destinations are in hand-to-mouth mode, as they feel extremely well that the price will have to drop further. The Russian Federation sells in barter in Syria, sells in Afghanistan (with what will the Taliban pay?), sells to any destination (Algeria). 50 million tons export program means 25% of the annual global trade value. More than that, official Russian sources say that there will no longer be a maximum level of export in the period February-June 2023. It is a way of admitting that for how much wheat they have, they still lack a maximum level of export.
CONCLUSION
Russia is pushed through the labyrinth. And little by little it will reach a moment when its struggles will no longer be lucid, but chaotic. When incomes are thinned, wheat, gas, oil, fertilizers, Russia’s movements will be uncontrolled.
Mr. Putin has shifted from the sarcastic and dictatorial tone to a speech in which he says he wants to export energy and food. The boomerang of blackmail with food has already turned against him and he sees with his own eyes that the world is trying and will do without Russia.
But it must be done very tactfully. Russia must be allowed out of the maze. Under certain conditions, of course. Otherwise, a stalked beast will become uncontrollable and the damage will be immeasurable.
After all the events we see, the path through the labyrinth is already marked, and attempts to get out (with the loss of life in Ukraine) are effectively blocked. And the route will have an end that we want completed as soon as possible (we estimate at least 5-6 months). This trail started in 2014 and we don’t forget it.
Eventually the wheat will have to come out. The tax will be reduced further and the plateau on which the wheat stands today will lower further. Time will prove that the fundamentals of the physical market prevail, and they are clearly established by the numbers. The EU has a crop deficit, Ukraine has a crop deficit, Argentina has a crop deficit, the US has a crop deficit.
But the balance comes from Russia, with a gigantic crop surplus. 100 million tons covers the deficit in the EU + USA + ARG. Then Canada enters the table with a surplus of 3-4 million tons and we await Australia, which will generate much more than the 33 million tons forecast today (even if the quality will not be entirely milling wheat, it will be wheat and that is sufficient).

LOCAL STATUS
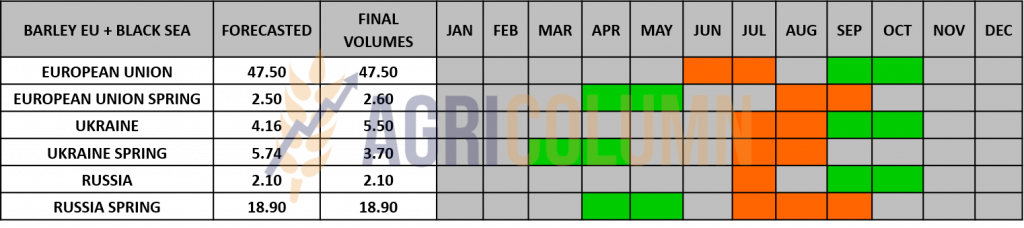
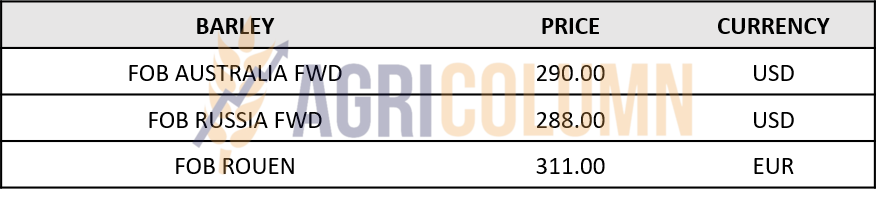
Barley transactions in the port of Constanța have the price parameter set around 290-295 EUR/MT. It is a good time to trade, the support provided by wheat in the formula “milling wheat minus 40 EUR/MT” is working again.
Autumn sowing totals around 0.32 million hectares in Romania. As with wheat, water, which we hope will come from November, will be the ultimate survival factor before the winter of 2023.
REGIONAL STATUS
TMO TURKEY initiated a tender for the purchase of 495,000 tons of barley. Partial results indicate the purchase of 245,000 tons.
RUSSIA indicates a barley crop of 23.9 million tons, 5.7 million tons more than last year.
BARLEY PRICE INDICATIONS IN MAIN ORIGINS

LOCAL STATUS
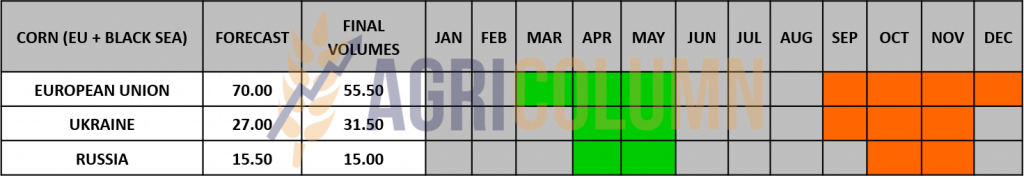
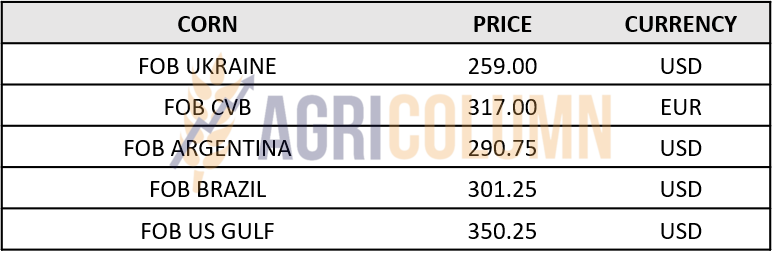
Corn indications in the port of Constanța oscillate between a base of 305 EUR/MT up to 310 EUR/MT. Indications in the country are 270-273 EUR/MT.
Harvesting continues and we believe that around the 10th of November it will end with the result we know, which is a maximum of 8.2 million tons. The Ministry of Agriculture will partially compensate the losses caused by the drought with a sum of 300 EUR/hectare.
CAUSES AND EFFECTS
Regionally, we are at the confluence of two factors: the European Union and the Ukraine + Russia area. If we look synthetically at corn, Ukraine is the zone of influence of corn. Why do we say this? To prevent any attempt at national thinking.
If we don’t have corn, it doesn’t mean that there is no corn in this world. At this time, the shortage of corn in Europe will be partly compensated by Ukraine and its replacement by feed wheat.
We are on a price plateau caused by the delay in harvesting in Ukraine caused by rainfall. But the rains have stopped, and deliveries are resuming. Constanța port is currently blocked by goods and this means liquidity.
With the clarification of the continuation of the green corridor and 95% believe that it will continue, corn will generate a very high volume of transactions. And the price will not stay there, but will go down. The market does not indicate carry over on the following indications. So all the premises for a return to 285-290 EUR/MT are there, even if the corn price life cycle has only just begun. This is something else entirely.
REGIONAL STATUS
UKRAINE has started harvesting corn and the benchmark value of 31.5 million tons remains uncertain at this time.
RUSSIA remains as last week at the level of 15 million tons.
The EUROPEAN UNION is also in the harvesting process, and the level of 55.5 million tons remains firm at this moment.
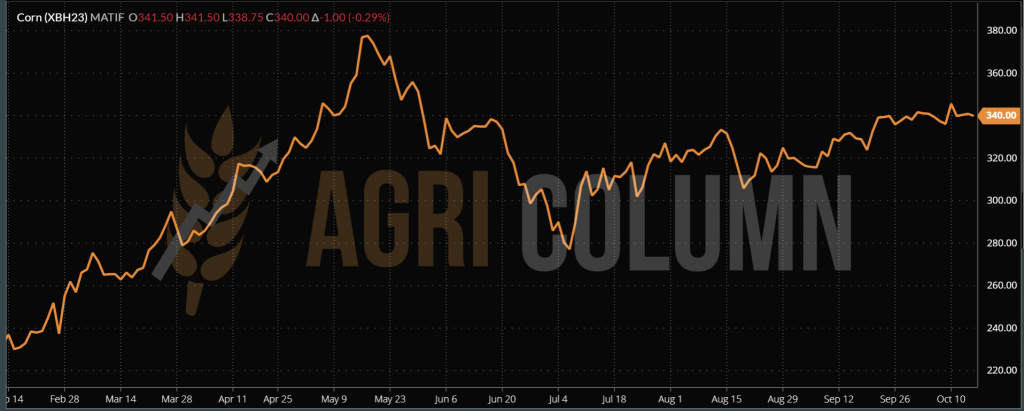
EURONEXT XBH23 MAR23 – 340 EUR (-1 EUR)
EURONEXT CORN TREND CHART – XBH23 MAR23
GLOBAL STATUS
US production is down following the USDA report, but not dramatically. We see a production difference of only 1.25 mil. tons, ie 352.95 mil. tons forecast in October, compared to 354.2 mil. tons WASDE September 2022 forecast.
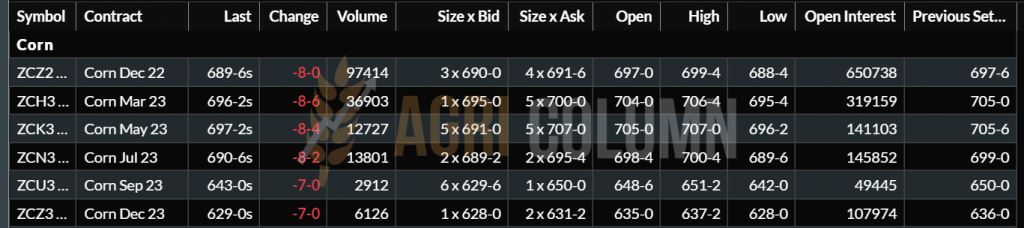
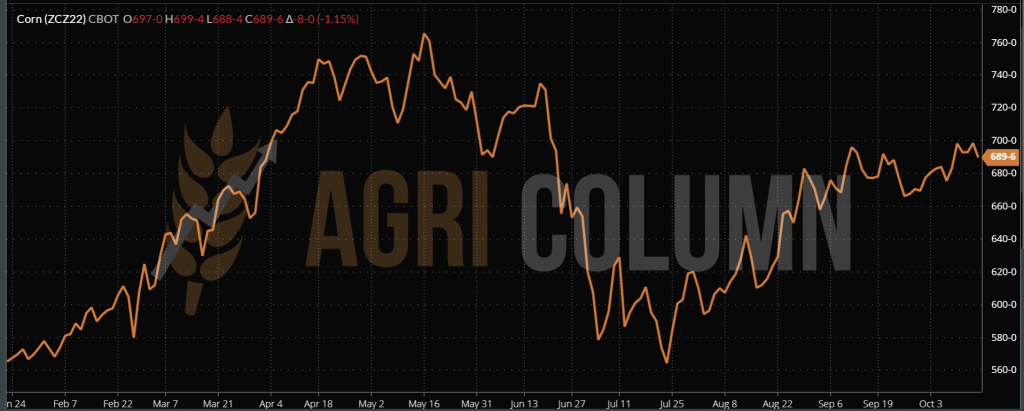
CBOT CORN – ZCZ22 DEC22 – 689 c/bu (-8 c/bu = -3.15 USD)
CBOT CORN TREND CHART – ZCZ22 DEC22
CORN PRICE INDICATIONS IN MAIN ORIGINS
CAUSES AND EFFECTS
WASDE dryly indicated to us a mass of information: global production decreased by 3.84 million tons, starting from a level of 1,172.58 million tons in September, to the figure of 1,168.74 million tons following the current report. The main areas affected by the decreases are France, Romania, Hungary and Bulgaria in the European Union area, as well as a marginal decrease in the USA. At the same time, we also have a decrease in global consumption by 5.63 million tons. Starting from 1,180.18 million tons last month, we now have a forecast consumption level of 1,174.55 million tons.
But we must take into account the following parameters:
- American corn has logistical and let’s say social problems. The Mississippi River does not have enough water, and about 2,000 barges are blocked. About 2 million tons. We remind you that NOLA (New Orleans Louisiana) is the gateway for about 70% of American corn. The social problem is currently returning to the USA. A large portion of the unions, which had originally agreed to discuss and agree to an amicable settlement with the US government, are reneging on the original deal and announcing that they will go on strike on November 19, 2022. This would effectively paralyze North American logistics, considering and the lack of water on the Mississippi.
- Ukraine is fast approaching the expiration of the initial 120 days of the green corridor, and the signals from Russia are not very friendly. But according to the Russian style, these signals are only blackmail tools in the negotiation with the UN to facilitate the export of fertilizers.
- Ukraine has started harvesting. The goods are still wet and drying costs will impact the price of the goods. But we believe that Ukrainian farmers will prefer natural drying in the field to preserve future income.
- China is buying from Ukraine and it is a signal to Russia that it does not want to be disturbed.
CONCLUSIONS
The price of corn will remain stable for a while. The aggregation of the factors expressed above will generate enough volatility through possible developments so that the current level can be perceived as a minimum.
Across the Atlantic, social and logistical issues are keeping the corn price floor cemented, and in Europe, low production levels associated with delays and tensions in Ukraine are adding more ground to corn prices.
For a period of 7-10 days, the price of corn remains at the level of 305-310 EUR/MT CPT Constanța.

LOCAL STATUS
Rapeseed price indications enter a new phase of tuning with the EURONEXT XRG23 FEB23 indication. And so the price indication becomes FEB23 -25 EUR. Identically, processors in Romania are showing the same FEB23 -15 EUR indication at the processing units because we are already past mid-October and the funds are being rolled over to FEB23 or liquidating the positions.
Also locally, we are seeing the beginning of problems in the rapeseed crop caused by the lack of rainfall. We have patchy emergence and trouble spots this month. The northern area of Constanța County is currently quite affected and it is not excluded that many hectares in this region will be turned over and sown with wheat.
CAUSES AND EFFECTS
Rapeseed remains attached to the price of fossil energy and continues to remain at the current level. Calculations indicate that it will correlate with this parameter for a while. So, apart from the demand for the supply of processing units, nothing can disturb the price plateau in which it is at the moment.
Romanian processors and exporters no longer have either the appetite or the courage to approach rapeseed from Ukraine, due to the level of contamination of the goods with genetically modified (GMO) batches. Port tests take a long time and the wait becomes prolonged when downloading because of this.
REGIONAL STATUS
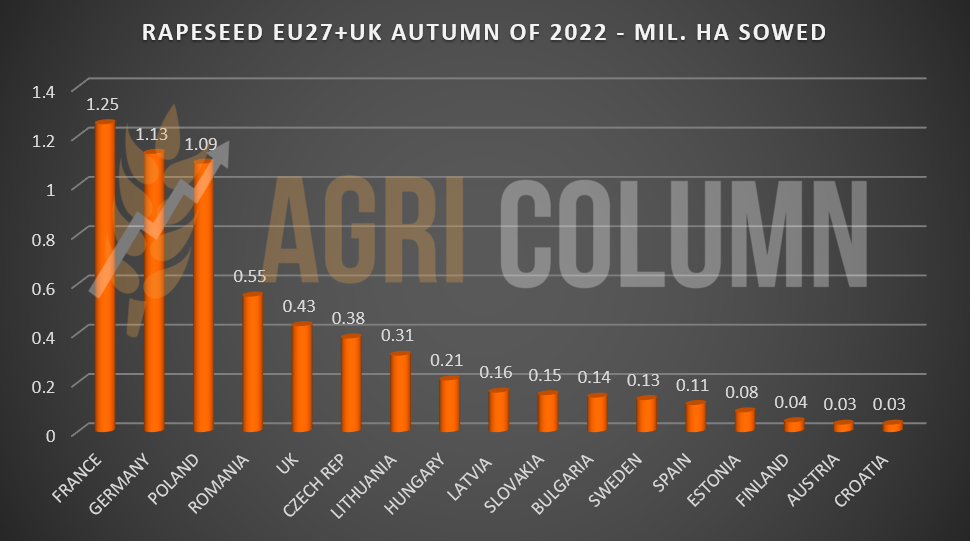
2023 – Sowing European Union + Great Britain
Regarding the sowing of rapeseed at the level of the European Union, we can say that it can be considered closed. We insert a comparative table to highlight the increase in area at the level of the European Union.
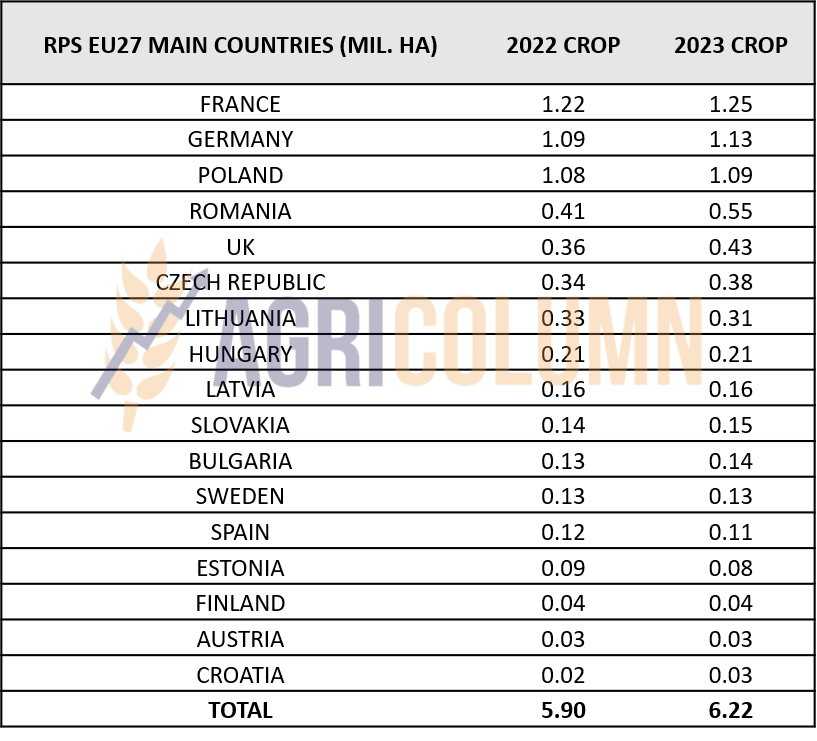
We also insert the related chart for an overview. We must mention that we stopped with the indication of EU countries at a minimum of 0.3 million ha sown.
Romania occupies the 4th position, but let’s see the evolution over the next period.
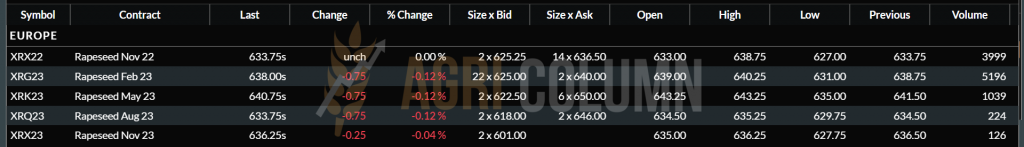
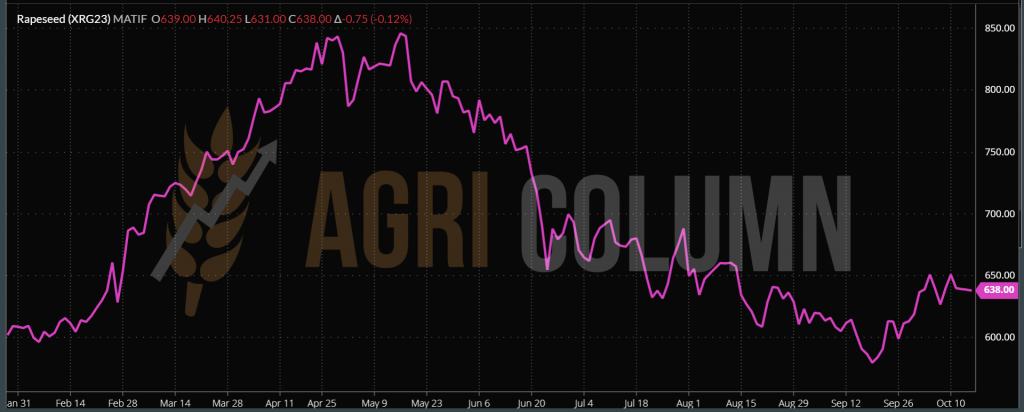
EURONEXT RAPESEED – XRG23 FEB23 – 638 EUR (-0.75 EUR)
EURONEXT RAPESEED TREND CHART – XRG23 FEB23
GLOBAL STATUS
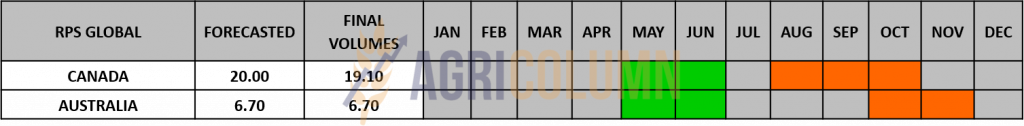
AUSTRALIA is on the march for the 6.7 million tons of canola it will soon harvest.
CANADA is close to the harvest finish line and we may see another small crop upgrade, but it is not certain.
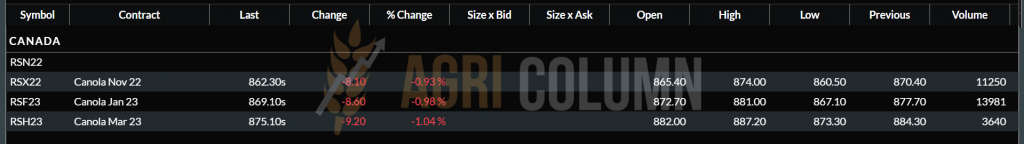
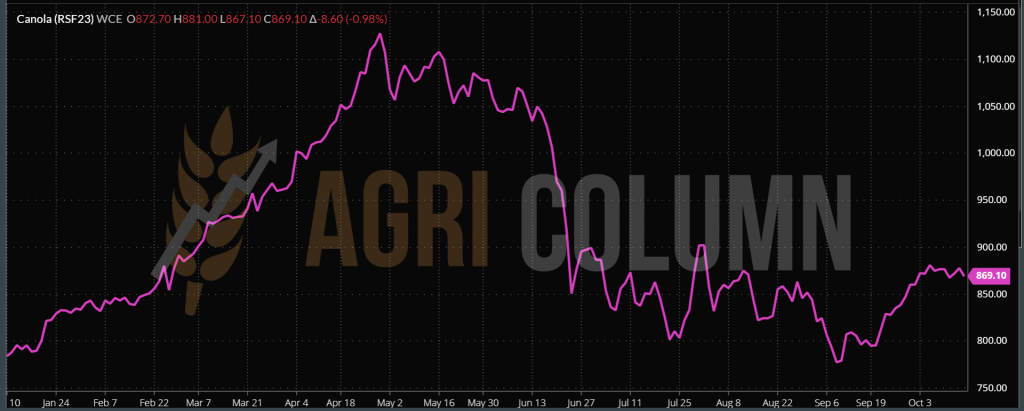
ICE CANOLA RSF23 JAN23 – 869 CAD (-8.6 CAD)
CANOLA TREND CHART – RSF23 JAN23
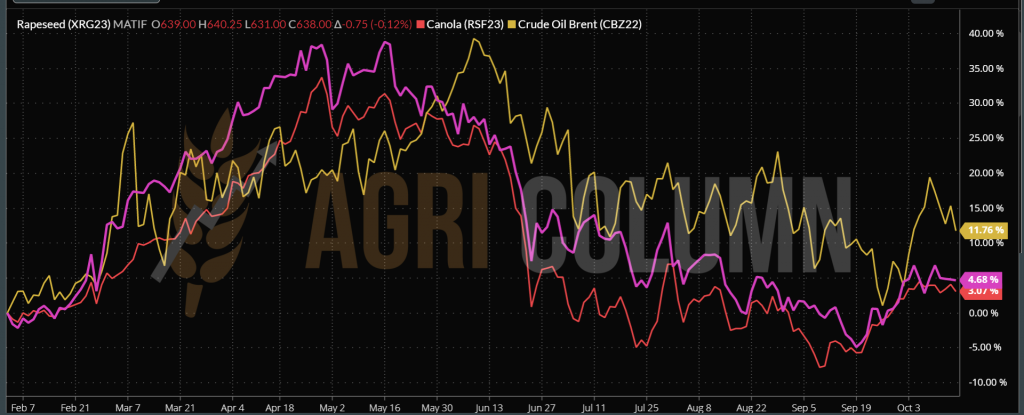
COMPARATIVE CHART: RAPESEED (XRG23 FEB23) VS. CANOLA (RSF23 JAN23) VS PETROL (BRENT CBZ22)
CAUSES AND EFFECTS
The 2022 harvest is coming to an end, and there are no more unknowns in terms of volume. The last origin will soon go into harvest, but there is no cause for concern.
In the next period we will see a stabilization of the rapeseed price. Processors will supply and exporters will in turn generate their volumes to fulfill contracts. Turbulence could come from oil prices alone. Any positive or negative variation will trigger a price upgrade or downgrade in the EURONEXT indication.
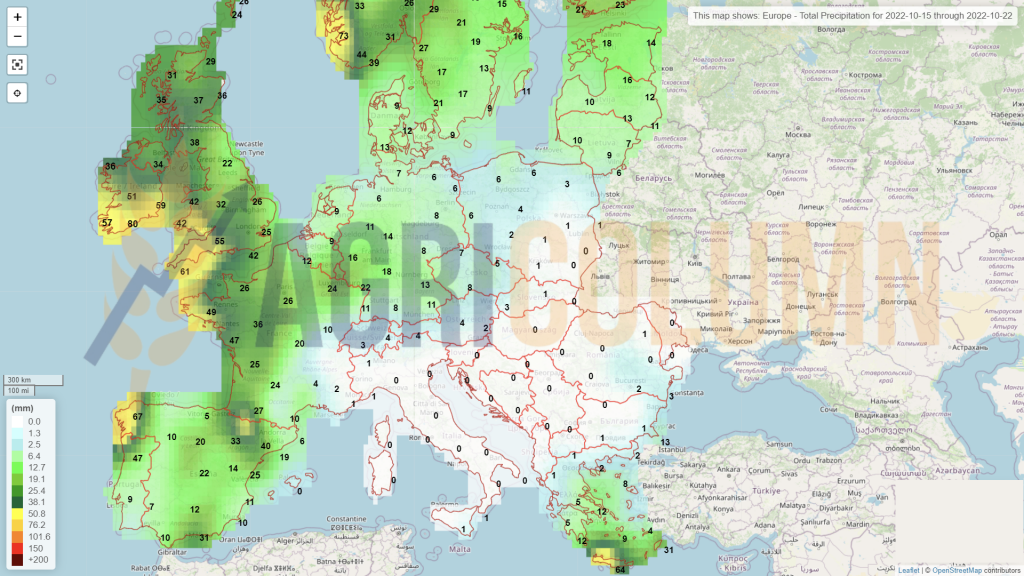
One parameter we need to keep a close eye on at the moment is the state of crop vegetation across Europe and the Black Sea basin as rainfall will be lacking in the last half of October and so we could see concerns for the new crop manifested in Euronext.
After the first half of December we will again see a consistent demand for rapeseed. A 3-month cycle, i.e. a stripe, is completed, and the raw material must be generated for JFM, i.e. January-February-March 2023.

LOCAL STATUS
The trend is changing somewhat and we notice the much more aggressive positioning of the processors towards the export or intra-community market. Thus, they generate guidance of 550-555 USD/MT for the commodity delivered to the processing units. The bonus for HIGH OLEIC seed is still very close to the 90 USD/MT level.
Exporters face an acute lack of space in the port of Constanța, so they have reduced the quotations for sunflower seeds. Their guidance is around 540-545 USD/MT. Only two exporters generate a price level of 565-575 USD/MT CPT Constanța.
REGIONAL STATUS
UKRAINE is harvesting sunflower seeds in full swing after the rains stopped, but the first signs are showing contradictions. In the domestic market, prices fall due to volumes offered for sale. At the same time, processor associations breed speculation. They see a little better towards the time horizon and realize that their goods will leave the country for the European Union and Turkey.
CAUSES AND EFFECTS
A rumor is gaining momentum in the market that shortly the Government of Ukraine will organize a meeting with the participation of Ukrainian agricultural producers, exporters, processors and representatives of relevant ministries to comprehensively study the issue of sunflower seed export restrictions.
What impact will such an action have? We have to remember that even under current conditions there is an export tax on sunflower seeds set at 8%. If they restrict exports, they will give in, first of all, to the farmers in the domestic market, who will have to sell at reduced prices, because they will no longer have options, and the processors will offer as much as they want for the goods.
However, in the intra-community market, the price of seeds could increase and this is already visible from the quotations of the Romanian processors. They estimate very well that Ukrainian goods are no longer coming and are positioning themselves much more aggressively. It is an auspicious moment, because the second indicator is somewhat pulled to the right, namely the export market, which is now dealing with the export of corn and no longer has storage space.
If just the rumor has lifted the market by 15-20 USD/MT, we wonder what will happen if this turns out to be real? Simply, the market will increase by at least 20 USD/MT because this expectation of the processors did not bear fruit. The idea that cheap goods would come from Ukraine was penalized by the intentions of Ukrainian processors. And Turkey with that crude oil import tax did not solve anything at all, it only restricted its own access, its natural desire being to buy seeds, not oil at all.
But there is also a referee. And that arbiter is the European Union, which sees its oilseed coverage under threat. The Union had a disastrous crop and was relying on the Ukrainians to supply oil to the intra-Community market and to keep processing plants running. And this is not to the liking of the Union in any way. We may see questions and certainly recommendations: “we helped you, what are you doing now?”
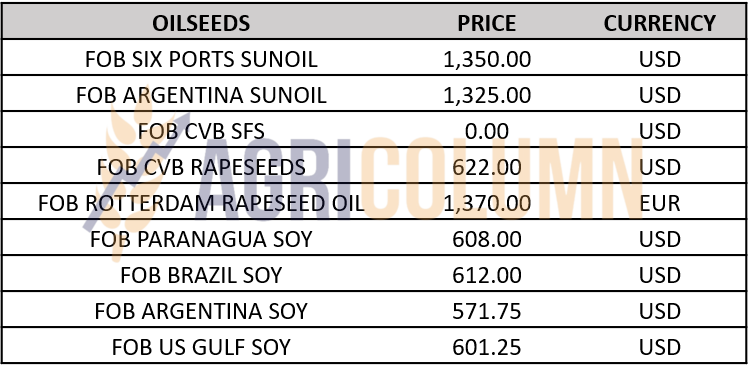
PRICE INDICATIONS FOR OILSEEDS AND CSFO IN MAIN ORIGINS

LOCAL STATUS
Price indications provided by local processors are at the level of 570 USD/MT. Between July 1 and October 9, 2022, approximately 52,000 tons of soybeans were imported.
GLOBAL STATUS
USA. The harvested area of soybean crops is 44%, double from last week. USDA confirms sale of 590,000 tons of soybeans for delivery in 2022/23: 392,000 tons to China and 198,000 tons to unknown destinations.
WASDE generates soybean production increasing by 1.22 million tons, starting from a level of 389.77 million tons in September and reaching a value of 390.99 million tons in October. Soybean production is revised down in the US, due to a lower yield per hectare, but is offset by Brazil’s forecast, which is indicated at 152 million tons.
CHINA has tendered 500,000 tons of soybeans from its state reserves.
The volume of processed soybeans fell to 1.52 million tons in the past week, according to data from the National Grains and Oil Information Center (CNGOIC). The decrease is generated by the fact that they celebrated National Day for a week – Golden Week.
ARGENTINA. Farmers in Argentina are struggling to sow 2022/23 soybeans due to drought. Soybean sales fell 79% in early October after the dollar-soybean program ended.
BRAZIL. Brazilian farmers sowed about 11% of the area, as the weather disrupted their activity in some areas. In Mato Grosso, soybean planting reached 18.6%, down slightly from last year.
The Conab estimate for 2022/23 exports is 96 million tons. As for the increase in cultivated area, if realized, it will mark the 16th consecutive year of increase in areas.
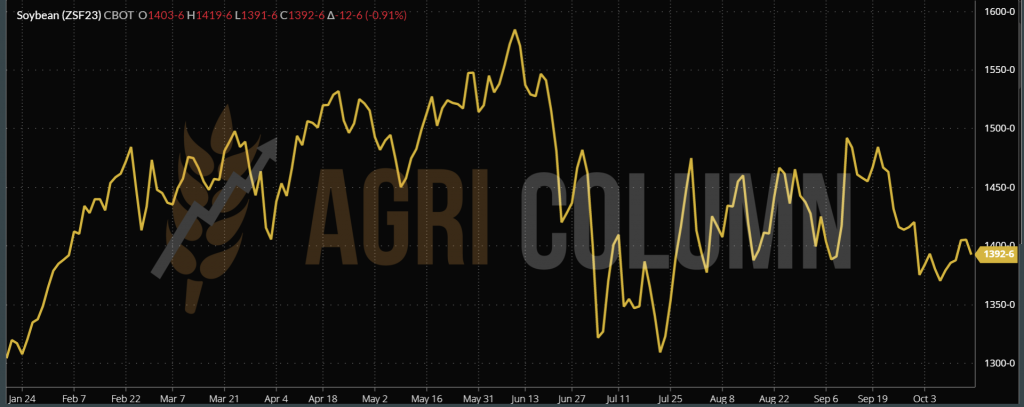
CBOT SOYBEAN – ZSF23 JAN23
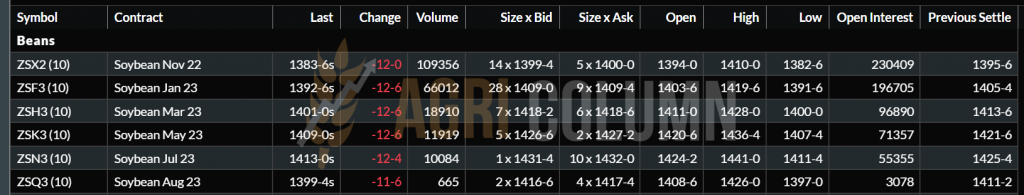
CBOT SOYBEAN TREND CHART – ZSF23 JAN23


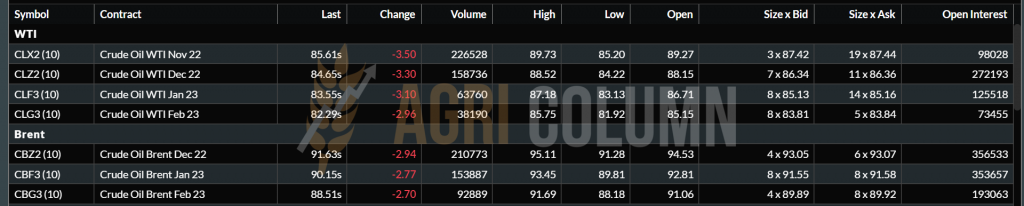
WTI CLZ22 DEC22 – 84.65 USD | BRENT CBZ22 DEC22 – 91.63 USD

15-22 October 2022
Romania
Europe
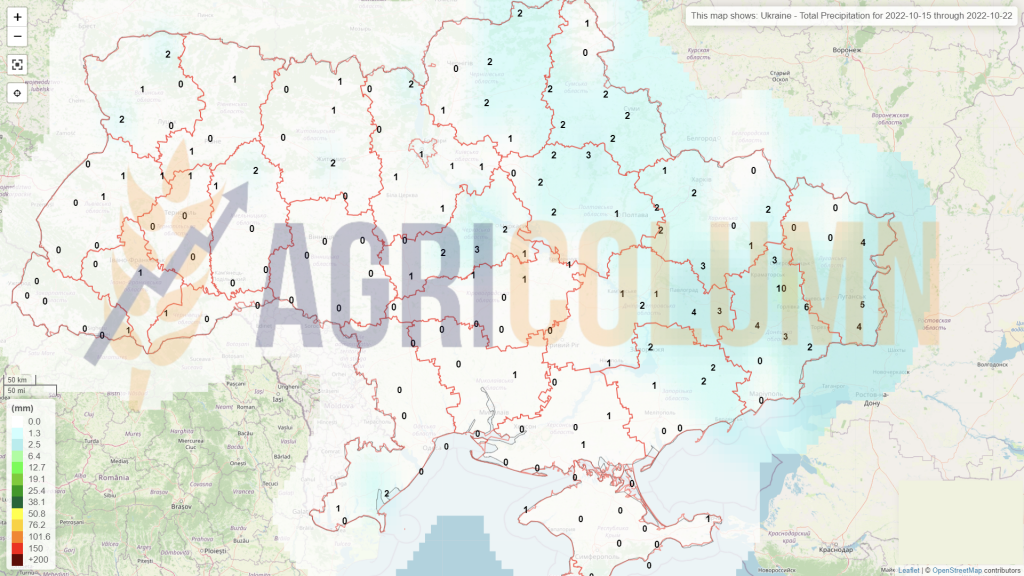
Ukraine
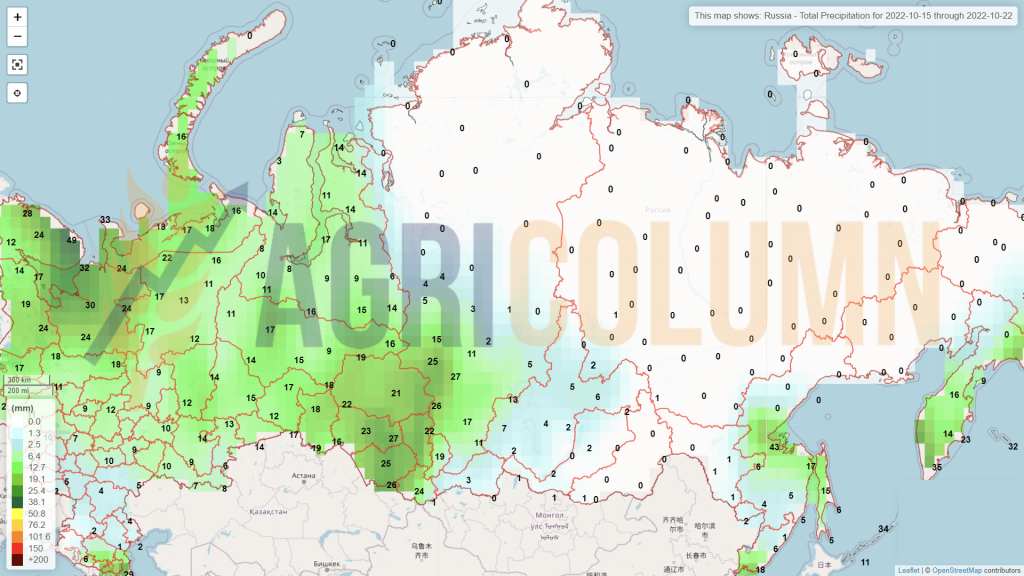
Russia
Canada
USA
Brazil
Argentina
China
Australia