This week’s market report provides information on:
FAO REPORT 2 SEPTEMBER 2022

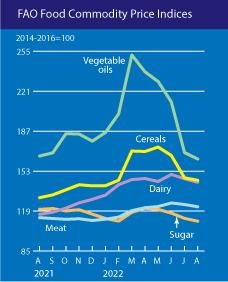
The FAO Food Price Index* (FFPI) averaged 138.0 points in August 2022, down 2.7 points (1.9%) from July, marking the fifth consecutive monthly decline. Despite the latest decline, the index remained 10.1 points (7.9%) above its value a year ago. All five FFPI sub-indices fell moderately in August, with monthly percentage declines ranging from 1.4% for grains to 3.3% for vegetable oils.
The FAO Cereal Price Index averaged 145.2 points in August, down 2.0 points (1.4%) from July but still 14.8 points (11.4%) above its from August 2021. In August, international wheat prices fell 5.1%, marking the third consecutive monthly decline. World corn prices firmed slightly, up 1.5%, largely influenced by lower production prospects in the European Union and the United States due to hot and dry conditions, while the resumption of exports from Ukraine prevented prices from rising further.
The FAO vegetable oil price index averaged 163.3 points in August, down 5.5 points (3.3%) month-on-month, pushing the index value slightly below the previous year’s level. The continued decline in the index was driven by lower global prices for palm, sunflower and canola oils, which more than offset higher soybean oil quotes.

LOCAL STATUS
Indications of wheat in the port of Constanța are aligned with the interest of the buyers, i.e. at a low level. We note a maximum level of 310 EUR/MT for milling wheat, with the already established discount of 20 EUR/MT for feed wheat. One can clearly see the lack of interest in the fact that the demand shown by the directions is missing.
In the local market, processors have gone into qualitative selection mode. Their interest is there, but it is clearly based on quality segregation, so that price offers align with the quality of the wheat offered for purchase. And we note a level of 325-327 EUR/MT for a quality granted with a minimum of 77 kg/hl (test weight) and a protein index of at least 12%. The rest of the conditions we know very well flow from these two defining parameters.
The bottleneck created by retention has eased, and the processing market knows sufficient supply. Romanian processors will also benefit from a financial grant granted by the Romanian state to support the purchase, storage and processing of raw materials.
However, this grant has some very well-defined conditions and we will explain them briefly. Apart from the simple access conditions, this grant has a limit of 500,000 EUR/processing unit, which is equivalent (as stipulated in the draft emergency ordinance) to 14,280 tons of wheat.
The calculation shows us a level of 35 EUR/MT allocated for the set quantity. But this money will not be reflected in the income of the farmers because the processor has the freedom to use this money for purchase, storage and processing. In other words, the amounts can cover variable and fixed expenses from processing units. The mode of control and allocation is simple. In addition to a processing report from the previous year, the presence of freight invoices from August 15, 2022 is required.
The total amount allocated by this emergency ordinance for the raw material wheat is 124,000,000 EUR, which indicates a number of 248 processing units, taking into account the ceiling of 500,000 EUR set out above. Our observations are of an operational nature, as certainly supply is no longer a problem at the moment, namely:
- The figure of 248 units indicates that this cap will not be reached.
- The simplicity of the grant could stimulate the inventiveness of some commercial companies.
We think some additional regulation would help the process and we list:
- The need to present production reports for the last 3 years.
- The need to present evidence of sales and marketing for the last 3 years.
- Cross-checking with raw material sellers to determine if it is a manufacturer or just a trader, not to block a possible interposed trader in the supply chain, but to prevent possible innovative evasion attempts.
Romania has exported a little over 1 million tons of wheat to date, and we specify that it is about export, not about intra-community trade. The figures we have indicate a maximum of 2 million tons to be reached by the end of September, out of an allocated figure of 5 million tons, which is in line with the level of the Romanian crop. In other words, these parameters do not endanger food safety at the national level, nor do they create discomfort. These days, external buyers are on the waiting list.
CAUSES AND EFFECTS
The reluctance that we have been talking about for some time is the cause of the negative effects that we see happening nationally among farmers today. Successive selling misses, despite our indications of market direction, have led to today’s landscape of subdued demand and price down to the levels we defined from May to today.
And we already have a consistent difference of 100 EUR/MT. If we were to relate this difference only to the 5 million tons, export + internal consumption to cover, we have a deficit of capital that could be received in farms of 500,000,000 EUR. There are amounts that would have partially covered the cost of fertilizers for the fall and maybe spring season.
Once again, the Romanian agribusiness market shows us a lack of maturity and leaning towards technicality. The lack of sales technique and distrust of lead capture constructs associated with the customary sales system perpetuated for years led here. The drought has also been a factor in the retention and reluctance to sell at the right times, completely ignoring the global balance sheet that we expose each time.
But we still have the certainty that the Romanian agribusiness market will mature through the arrival of new generations, of tradable insurance instruments accessible from now on to Romanian farmers and which we already offer. Critical mass will grow year by year and with the help of technology. Within 3-5 years, with much hope and certainty we would say that Romanian Agribusiness will pivot and become Predictable.
In conclusion, the price of wheat and the possible increase in the coming months will not be able to cover the operational costs of storage, energy costs and financing costs of stocks. Apart from this, the farm’s cash-flow is locked into a commodity that, according to global supply and demand, is not in short supply. Only a destabilizing factor coming from Russia could move and unbalance the current state, such as the closing of the Green Corridor or an ill-considered action by the Kremlin like resorting to tactical nuclear weapons.
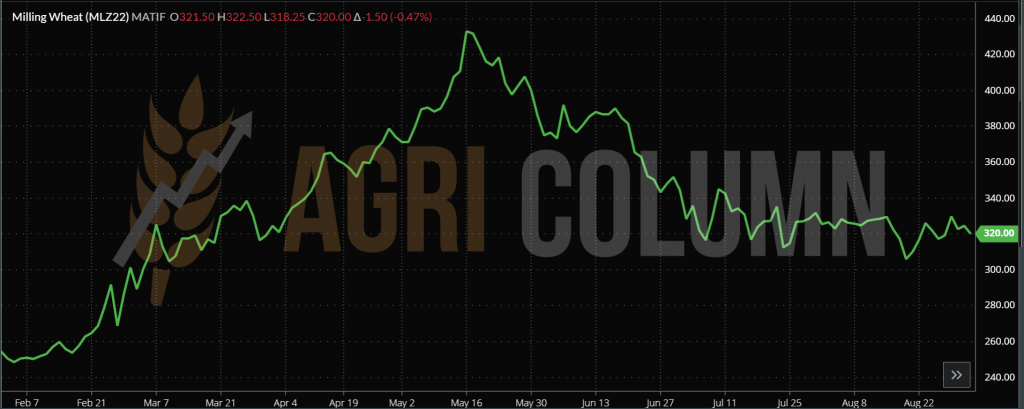
EURONEXT MLZ22 DEC22 – 320.5 EUR (-1 EUR)
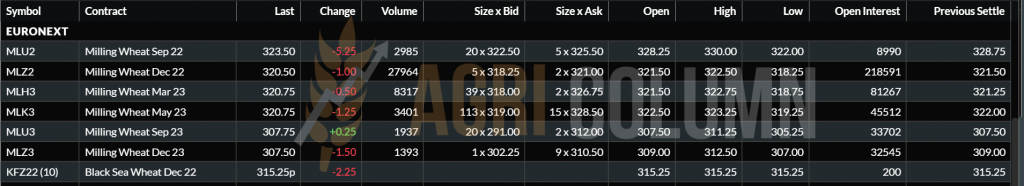
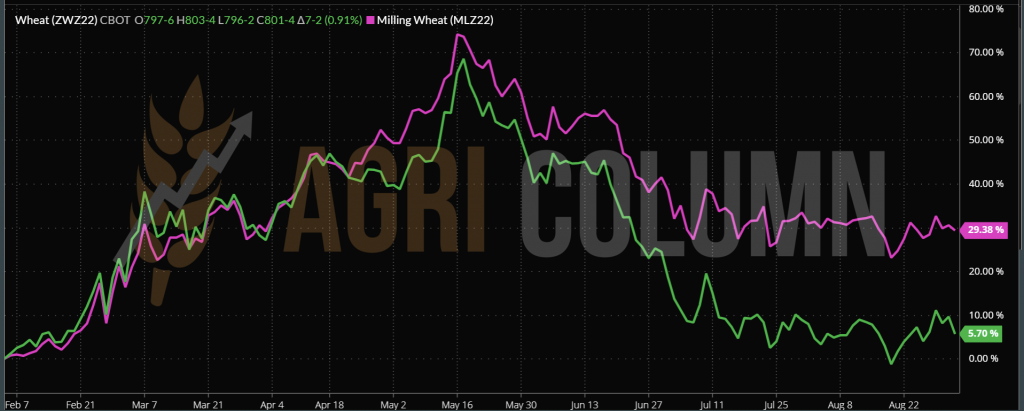
WHEAT TREND CHART – MLZ22 DEC22
REGIONAL STATUS
RUSSIA is creating its own wheat path, and this is no longer a secret. What the trading firms and market analysts fail to understand, however, is the Russian axes, which work tirelessly continuously, thinking, analyzing and innovating new ways and subterfuges to channel Russian goods and agricultural raw materials to their destinations.
On August 22, 2022, through its underground dissemination channels, Russia sent subtle warnings that they would massively bomb Ukraine on August 24, 2022, their National Day, aiming at infrastructure and major cities. Ukrainian and North American news sources took these threats seriously and disseminated the information in the public space.
Instantly, the North American and European trading algorithms of the Chicago Board of Trade and Euronext, reacted to the headline and increased the price level of the main traded commodities. Thus, the trading companies prepared through their own channels to offer wheat in Egypt at the high price level, according to the exchanges, omitting the physical market and its fundamentals. The fear that this humanitarian corridor could be cut off and, implicitly, the blocking of Ukrainian goods deliveries generated this behavior.
In this way, European wheat quickly became uncompetitive with Russian wheat. On August 23, 2022, Russia sold 240,000 tons of wheat at a price of 368 USD/MT, delivered at C&F Egypt parity, without a tender, therefore directly to the Egyptian state (represented by GASC). Deducting freight costs, we arrive at a level of 310 USD/MT, in FOB Russia parity, i.e. loaded on board, at origin. 6 cargoes of 40,000 tons were sold with the delivery period September 1, 2022 – November 10, 2022.
On August 24, 2022, nothing special happened so at 17:30, the stock markets fell as much as they had risen. Russia scored once again. And why do we say this? The Russian wheat crop is gigantic. Excluding Crimea, it is quoted at 94-95 million tons, compared to a 5-year average of 78 million tons. Plain and simple, Russia needs to sell a lot of wheat, an enormous amount of wheat, by any means, through any channels. They scored very well with this Maskirovka in front of the Europeans, aggregating with another sale to Bangladesh of 500,000 tons.
But right now, Russia is flooded with wheat that needs to be sold. Their problem is that most destination buyers have covered their stocks until winter and are only buying sporadically, now knowing that the goods are there and Russia will have to sell.
Their famous export tax on wheat is melting away by the day. They went from charging in USD to expressing the tax in rubles because the ruble strengthened against the USD and so Russian wheat converted to rubles from USD (wheat trades in USD) makes the Russian farmer get less rubles per wheat than before the invasion (75RUB:1USD). The export tax is only causing them problems, this week it will drop again by 13 USD/MT to 67 USD/MT.
Russian exports in August stopped at the level of 3 million tons, with three main customers namely: Turkey 1.34 million tons, Iran 1.26 million tons and Egypt 0.96 million tons. For the three customers, shipments are underway, but compared to the proposed target of 5 million tons, we have only achieved a degree of 60%.
On the evening of September 1, 2022, through a direct sale, Russia sold another 120,000 tons of wheat to Egypt at the price of 340 USD/MT, with payment in 180 days and delivery November 10-30, 2022.
UKRAINE. Despite the green corridor, exports are not going so well. Some of the pressure has been released, but things don’t stop there. Russia is bombing and again we noted Mikolayev as a preferred target, while Ukraine was promoting this port as a potential port to join the three already allocated for export.
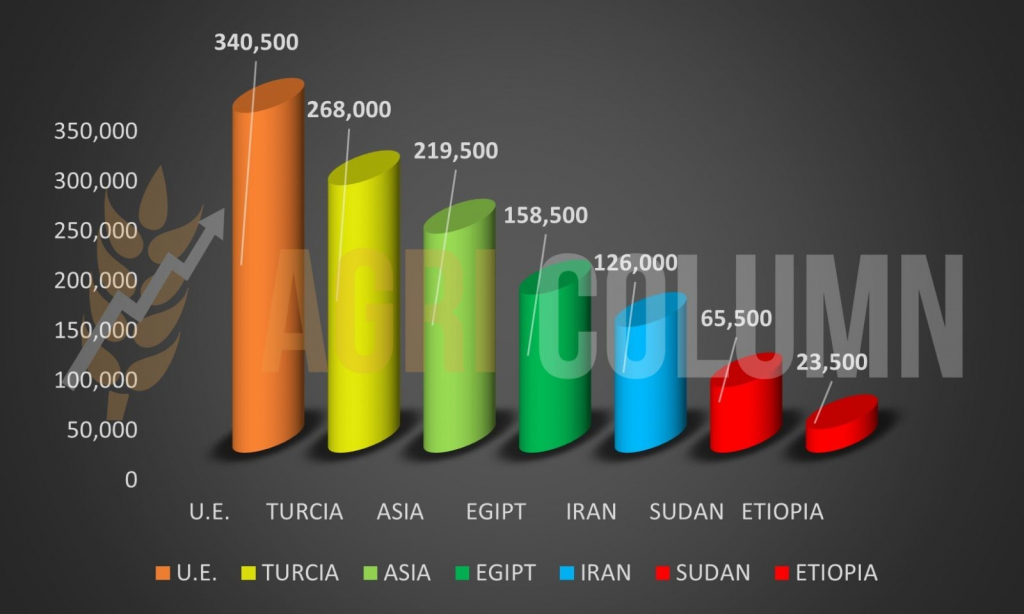
What we still notice, however, is the destination of Ukrainian goods, which, according to UN Secretary General Antonio Guterres, should have been poor African states. But it is not so, and Ukraine has no fault and no say because it received a breath of oxygen. We insert here a graph of the destinations of Ukrainian goods in the first 30 days since the green corridor was opened. We will note only two poor African countries, Ethiopia with 23,000 tons and Sudan with 63,500 tons. The rest of the big beneficiaries are Turkey (brokered by Mr. Erdogan) and the EU (high processing need in a Europe grinded by drought and sweltering heat).
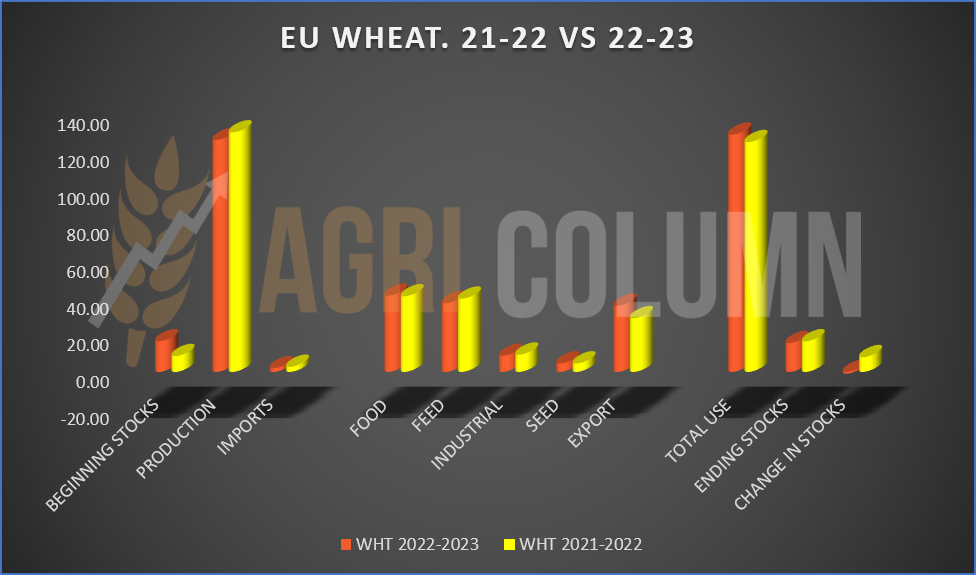
The EUROPEAN UNION keeps its production status unchanged, but we have figures that indicate a wheat balance, but also a potential imbalance in the level of the ending stocks of this 2022-2023 season. We invite you to consult the table and graph comparing the 2021-2022 and 2022-2023 seasons.

TENDERS
EGYPT made a direct purchase of 240,000 tons of Russian wheat at 368 USD/MT C&F through GASC. 6 freighters of 40,000 tons each will be shipped by GTCS.
EGYPT made another direct purchase through GASC of 120,000 tons at a price level of 340 USD/MT C&F, with payment in 180 days and delivery 10-30 November 2022.
MIT JORDAN bought 60,000 tons of wheat from CHS for 2H Jan 2023 shipment at 376.5 USD/MT CFR Aqaba, 9 USD/MT below what MIT booked 2 weeks ago for the second half of February.
OAIC ALGERIA concluded a purchase of wheat of Russian origin. Information so far points to a quantity of 120,000 tons sold at 364 USD/MT C&F.
GLOBAL STATUS
CANADA is headed for a bumper wheat crop. Approximately 35 million tons will be harvested this season, and no obvious problems are in sight. It must be said that it is Canada’s largest wheat crop in the last 10 years, more precisely from 2012 to today. The exponents of this generous production are the regions of Alberta with 32%, Saskatchewan with 45% and Manitoba with 15%.
US remains in the same coordinates as before, with spring wheat at a promising stage of vegetation, at which harvest has begun.
ARGENTINA is in the growing season after sowing, but the status is not gratifying. Only 17% is good to very good, compared to 31% last year and an average of 29% over the past 3 years. To observe the evolution.
CBOT ZWZ22 DEC22 – 809 c/bu (+15 c/bu = 5.5 USD)
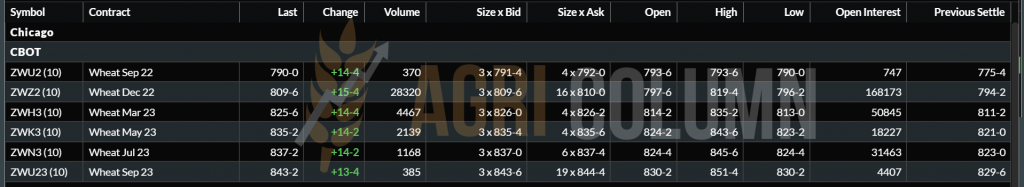
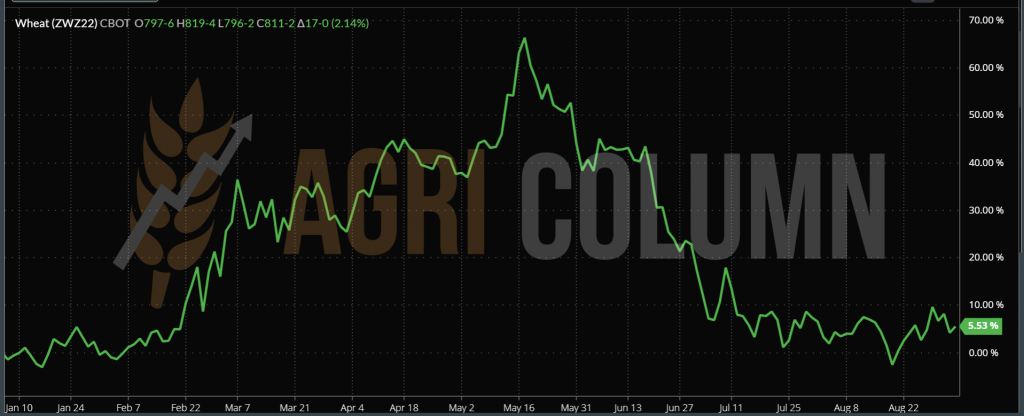
CHART – ZWZ22 DEC22
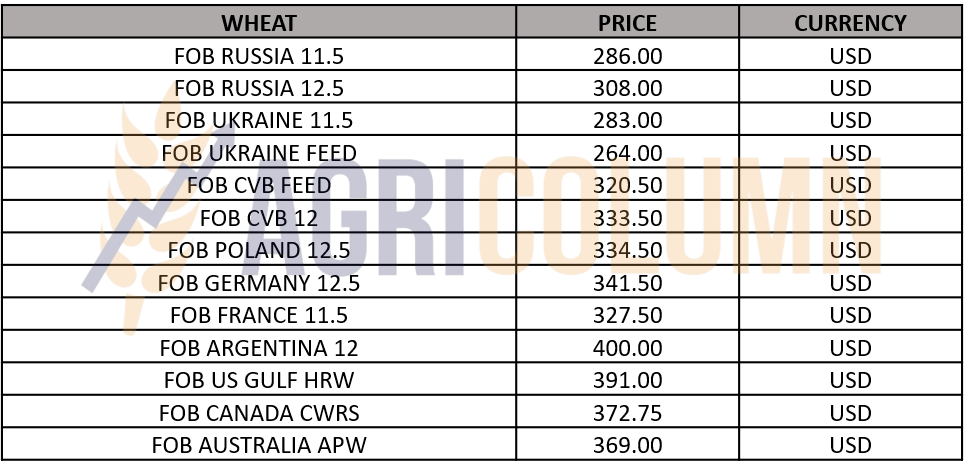
WHEAT PRICE INDICATIONS IN MAIN ORIGINS
CAUSES AND EFFECTS
We will treat wheat at this point from the perspective of crops that ensure balance at the global level, and the competition is generated by the gigantic Russian crop. Clearly, whoever was aggressive in the first tenders of the season when high volumes were sold at high prices was the winner.
For more clarity, we will insert graphics that will highlight the path of the wheat. Today, as a perspective, we do not see that wheat will exceed the value of 300 EUR/MT in the CPT Constanța parity.
Please see the comparison chart extracted. The magenta color is related to Euronext DEC22. The green color is related to CBOT DEC22. We have the first drop to plateau from May to June 15, 2022, then it goes down in stages following the FED announcement from June to July 15, 2022. It stays level until July 27, 2022, when the FED announcement comes, and then starts to come down again. And here we have counterbalances from fundamentals that support it at the level: the weaker EU crop that maintains the level until August 12, 2022, when the USDA announces the Russian harvest volume. The following sawtooths are generated by the trading algorithms that follow the news from Ukraine. How the Russians were bombing, how the price was going up, how they announced that they would bomb on August 24, again the algorithms reacted. Identical to the Mikolayev bombing on August 29. After which we have decrease. Another element that indicates the imminence of a new descent is the silence in the port. Multinationals are running at 308-310 EUR/MT. The commodity is being asked at 335 EUR/MT FOB for wheat with 12.5% protein.
The lack of buyers generates a lack of special interest in wheat. Only sunflower and rapeseed are of interest.
Both buyers and sellers have understood the recession and it’s a waiting game. Russian wheat is at 310 USD/MT FOB and European wheat has a decoupled trajectory from the CBOT, even if the paths appear identical.
What can be previewed is the starting time of February 2022 and the identical path of wheat in EURONEXT and CBOT, after which EURONEXT decouples and rises, even though it followed the same trajectory as CBOT.
We estimate a reset of EURONEXT to the same level as the CBOT, so implicitly a future price decrease. The latest Russian wheat sale in Egypt indicates a level FOB Russia at 295 USD/MT, down 15 USD/MT from today. By default, this will be reflected in the Constanța quotes. If today we still have 308-310 EUR/MT, don’t be surprised if we see after September 21, 2022 a level of 290-295 USD/MT.
Why September 21, 2022? Because the FED will have the FOMC meeting for 2 days, on September 20-21, 2022, and the new interest rate increase will be released. Sources indicate 0.75% instead of 0.5%.
We have had the same forecasts for a very long time. Prices will drop steadily. Wheat is the most exposed. Since May we have been repeatedly warning that it will steadily decrease. Exactly as we predicted, it happened, but in stages, to get used to it. It stagnates and then descends again.
On July 23, the 120-day period for the green corridor began. We have already passed 1/3 of the period. The maximum risk is that it will be closed after 120 days. Then and only then could we see a rebound in wheat prices. But under the conditions we have listed over these months, we have no reason to believe this, due to the factors below:
- Large quantities bought by destinations (volumes over 600,000-800,000 tons in a single tender);
- Egypt, which has bought over 2.7 million tons so far, and until the holidays must buy a maximum of 1 million tons, on the condition that it buys Russian wheat directly;
- Bangladesh – 0.5 million tons of Russian wheat;
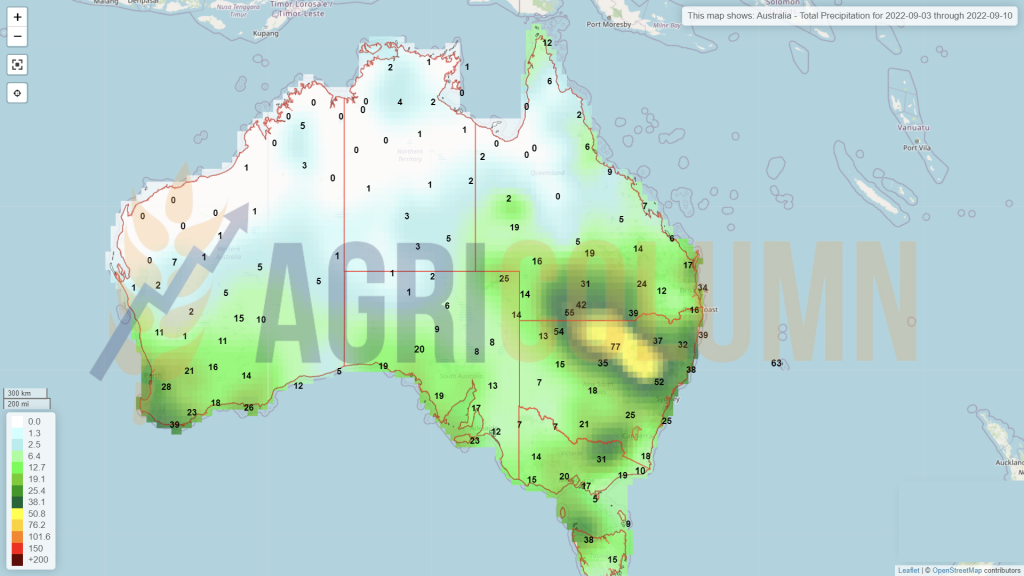
- Australia, which moves wheat to South Korea;
- Pakistan, which initially announced it would buy about 3 million tons of Russian wheat, then came back saying it was canceling the origin after it was made public that it supplied Ukraine with ammunition, but 3 million tons will still come from somewhere;
- Wheat is no longer sold these days in CVB (Constanța-Varna-Burgas);
- The Russian tax fell further to 55.87 USD/MT from 63 USD/MT last week and will take effect on September 7, 2022.

LOCAL STATUS
Barley indications are down again this week as well. We have indications of 270-275 EUR/MT in the CPT Constanța parity and this is another positive, we could say, because at the levels of sales made, the price will degrade, for sure.
Locally, barley is still in sufficient quantities. The same retention is present as in the case of wheat, but growth hopes will not be met. Storage and financing costs will be higher than a growth potential.
REGIONAL STATUS
Louis Dreyfus sold 60,000 tons of barley to MIT JORDAN for delivery in the second half of February at 323.5 USD/MT CFR Aqaba parity, 4.5 USD/MT less than MIT booked last week for delivery in the second half of January and the first half of February.
The other two bidders were Bunge (330 USD/MT) and Vittera (338 USD/MT). A new tender for barley will be held on Wednesday 7 September for the February and March 2023 shipping periods.
CAUSES AND EFFECTS
To be clear about the price of barley, this tender takes the price to a maximum of 250-253 EUR/MT CPT Constanța. And this lot is sold with delivery after mid-February. So the expectations are effectively groundless in the current context.
Barley is a market component and reacts identically to milling and feed wheat. If we evaluate the peak price level of 350 EUR/MT and the one that will potentially be 250 EUR/MT, we have the same difference of 100 EUR/MT.
BARLEY PRICE INDICATIONS IN MAIN ORIGINS


LOCAL STATUS
The indications of corn in the port of Constanța are at the level of 285-290 EUR/MT, down by 10-15 EUR/MT compared to the previous days. In fact, corn is matched with the price of wheat and is influenced by the level of American corn, as we said in previous issues. European corn is high in price compared to American corn, and despite drought and poor crops, the Ukrainian mainstay is enduring shortages from the European Union.
The Romanian corn crop has no update. We have the same level estimated at 8.2 million tons until we collect the maize from the plains. Otherwise, the drought took over and destroyed 40% of our corn crop.
CAUSES AND EFFECTS
Judging locally, we could generate retention ideas to sell at higher prices during the winter, but we have to understand that we are part of a global complex of factors, and in simple terms, I say that nobody cares that in Romania there was soil drought and extreme temperatures. It is a global complex in which the origins replace each other, and in the end, everything consists of Production-Consumption-Trade-Stocks, generated by Demand and Supply, in a dance of factors, Weather-Politics-Stock Markets-Protectionism.
We recommend not to be overwhelmed by emotions and leave the pragmatic zone. Corn will run its course and the price life cycle has begun. The route is conditioned by the above factors, and from our analysis, global corn volumes are able to meet the complex demand. Wheat has moved down the price level and corn will generate the same route. A retention will only increase the financial cost per hectare by aggregating the costs of storage and financing of the stocks.
Let’s bring up the FEDERAL RESERVE again, which will generate a new increase in the monetary policy interest, aggregated with REPO operations, by which they will extract money from the market. Yes, that money printed in the pandemic that is generating inflation today. Money will automatically become more expensive and limit the access of hedge funds to global stock markets. In this way, there will be more sellers on the exchange than speculative buyers, and the indications will decrease. By default, prices in the physical market will also fall. This artificiality of price was created only for the purpose of bringing positive margin to the printed money. Otherwise, the merchandise looks the same as it did two years ago. A ton of corn is a ton of corn and nothing more.
But the date of September 12, 2022 will generate the feeling of an increase in the price of corn. Then the USDA will certify some of the decline in the North American crop volume, aggregated with the decline in the European crop, which will push the price of corn for a while, this will be an adjuvant for wheat as well.
REGIONAL STATUS
UKRAINE is somewhat contrary. The NDVI of the corn crop is at a very good level, but local Ukrainian sources claim that it will not exceed 25 million tons, contradicting the USDA, which generates 30 million tons. Soil moisture is good but declining due to dry weather in the west and east. It remains under observation.
The EUROPEAN UNION is also officially degraded to the level of 59.3 million tons. But other analysis houses indicate 53.4 million tons. We remain at the level of 55.5 million tons, as we have stated for some time now. French corn is fast approaching our estimate of 10.5 million tons. Our analysis was very accurate and we see how France already admits these numbers, claiming that it is the worst crop of the 21st century. To be fair, the 21st century started from the year 2000, that is 22 years ago, and the degree of good towards very good corn crops drops to 45%.
For analysis and graphical visualization, we insert a comparison between the 2021-2022 and 2022-2023 seasons (provided that we use the figure of 59.3 million tons as a benchmark for European production).
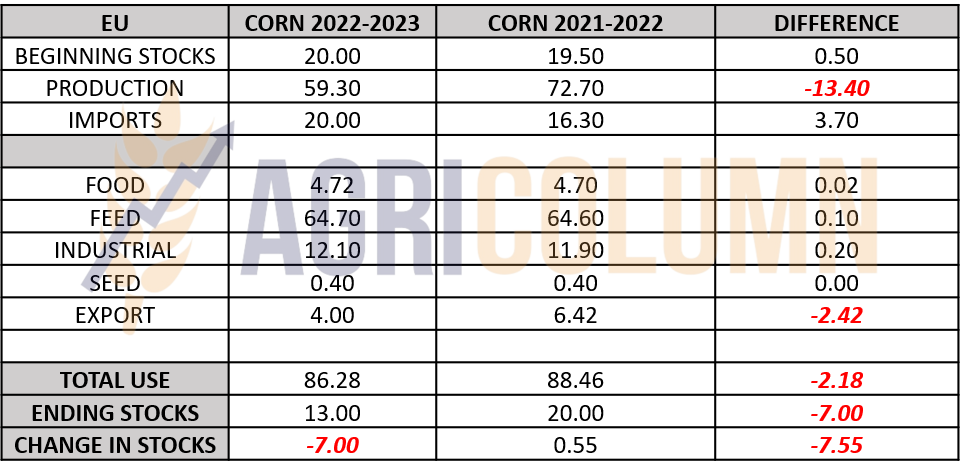
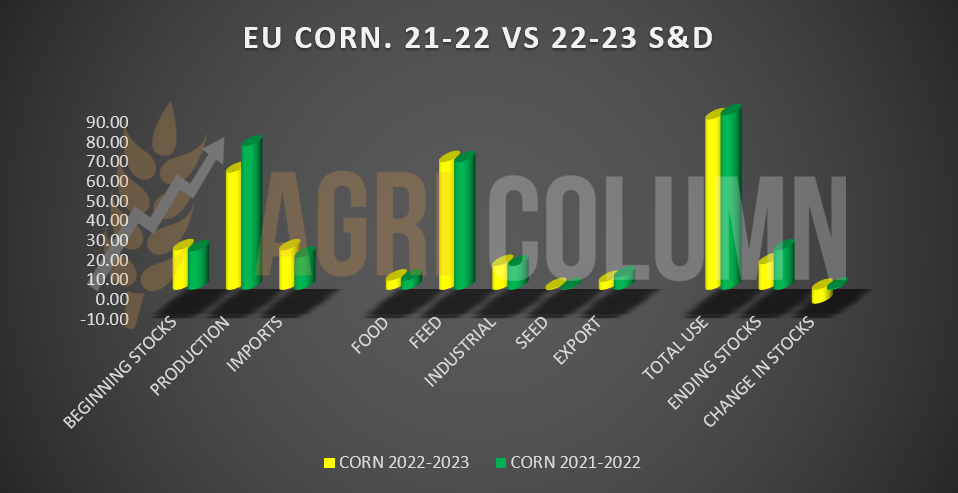
The numbers speak for themselves and we see a higher level of imports by 3.7 million tons, against the backdrop of a drop in production (according to the European Commission) of 13.4 million tons compared to last season. And now what we were saying in the past issues is getting certified – there will be substitution with feed wheat, while industrial use, export and stocks will be penalized.
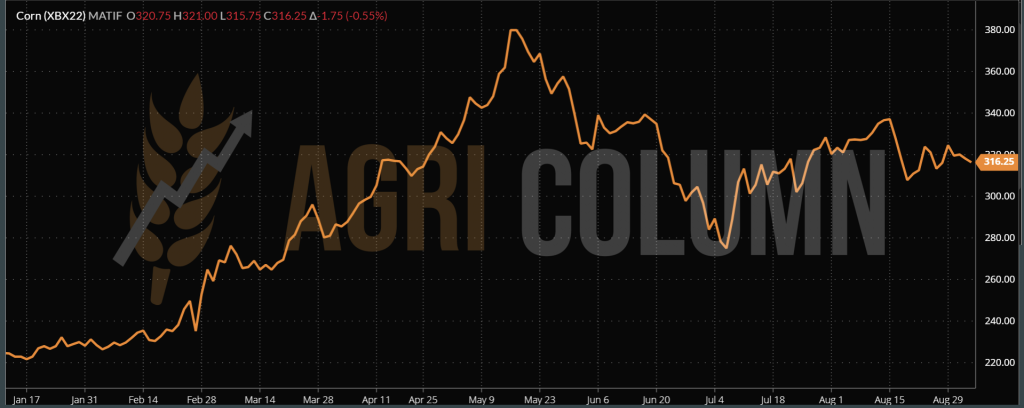
EURONEXT CORN XBX22 NOV22 –316.25 EUR (-1.75 EUR)
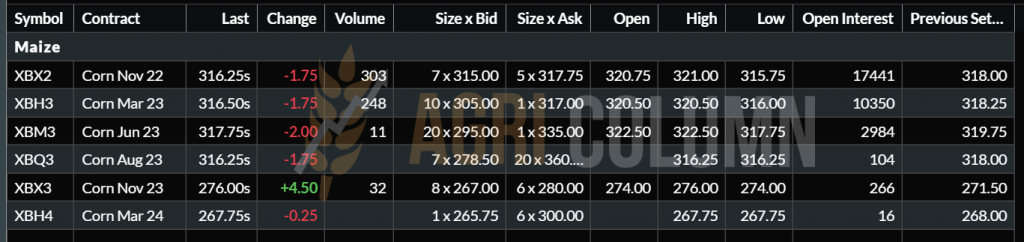
EURONEXT CORN TREND CHART – XBX22 NOV22
GLOBAL STATUS
US it is divided into two in terms of the mode of vegetative development. If the Midwest states are still experiencing the same issues and we list here:
- SOUTHERN NEBRASKA – DRY | NDVI LOW MAIZE
- KANSAS – DRY | LOW MAIZE NDVI (except NE area, where NDVI is good)
- SOUTH DAKOTA – DRY | NDVI GOOD MAIZE (except the south and west area where NDVI is low)
- NORTH DAKOTA – DRY | NDVI MAIZE GOOD in the southern area and VERY GOOD in the northern area
- OKLAHOMA – DRY in the northern area and IMPROVEMENTS in the southern area| NDVI LOW MAIZE
The other states that make up the North American Corn Belt do not indicate obvious problems, but even a healthy NDVI:
- IOWA – DRY | NDVI GOOD CORN
- ILLINOIS – DRY | NDVI GOOD CORN
- MISSOURI – DRY | NDVI CORN GOOD AND VERY GOOD
- ARKANSAS – DRY in northeast area only | NDVI CORN GOOD AND VERY GOOD
We are also waiting for the USDA verdict, which will arrive promptly on September 12, 2022. But until then, we see an overall North American crop rating down 1% from last week, from 55% good to very good to 54%.
ARGENTINA is out of season. They will start sowing after mid-September.
BRAZIL has little left and finishes the Safrinha harvest. The same coordinates of 116 million tons of aggregate production, Safra and Safrinha. They will then go out of season and start sowing Safra in early October.
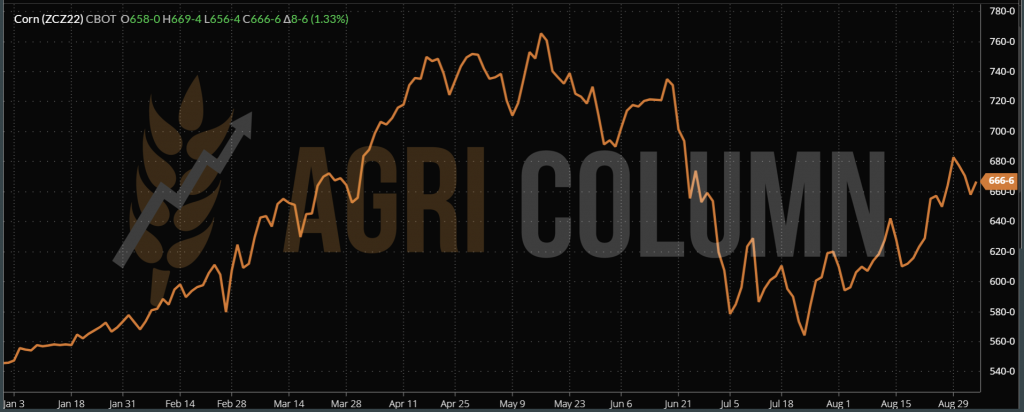
CBOT CORN – ZCZ22 DEC22 – 666 c/bu (+8 c/bu = +3.15 USD)
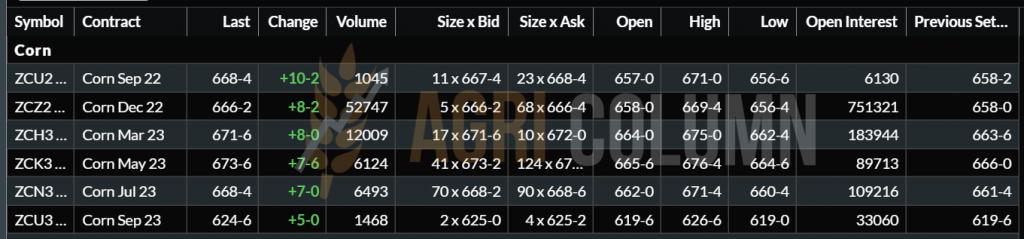
CBOT CORN TREND CHART – ZCZ22 DEC22
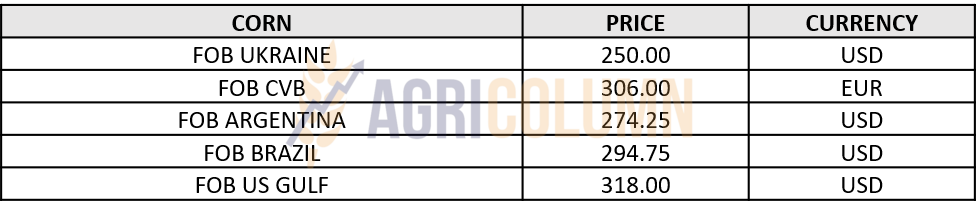
CORN INDICATIONS IN MAIN ORIGINS
CAUSES AND EFFECTS
- Corn has started the life cycle path and we are seeing it align with other global supply and demand indicators from a price point of view.
- Ukrainian goods make up for the shortage in the Union. This is obvious in the graph showing the destinations of volumes exported through the green corridor.
- About 100,000 tons of corn from the green corridor arrived in Romania, where, of course, they were FAS transferred on large ships for other destinations. But the details are somewhat strange. Cargo from the Green Corridor must first go to Istanbul for inspection. Let’s think that the logistics Odessa-Istanbul-Constanța has a minimum cost of 42-44 USD/MT and from Istanbul it returns to Constanta to be transferred to other larger ships. Our calculations lead to a level of 17-20 USD profit per ton per cargo for this flow leaving and going back and forth on the Black Sea between the three locations mentioned above.
- From the data above, we again see that the European Union will compensate with feed wheat for the loss of volume in corn, and we even see an increase in the feed sector, thanks to Ukrainian goods and North American potential.
- The FED will penalize the raw material prices on September 21, 2022.
The conclusions are extremely well defined. Hedge funds are buying corn on the North American stock market, technically preparing for September 12, 2022. It will certainly be a spike, a bull run of several days, as the North American decline will be super-fueled by the European decline, which will not be compensated by Ukraine. We will therefore have a price boost that will feed the physical market, a fuel that should not be missed because then comes September 21, 2022, when the FED will moderate inflation. Another important moment will certainly be September 30, 2022, when the NASS will generate the US-wide stocks report. And there we may find additional fuel for wheat and corn. But there is still time to get there and we have no certainty at this point. It is effectively an unknown that we denote by X in the equation at this point.
In the next chapter we must keep in mind the crop inverse, that is, the difference between NOV22 and NOV23, which today is negative by 40 EUR in Euronext.
But let’s not forget North American and Ukrainian crop promises, to which we add future South American potential, granted with the Chinese lockdown that penalizes human and feed consumption will keep corn under control in terms of price level.

LOCAL STATUS
The price indications that are generated today for rapeseed have, as usual, their roots in Euronext. Thus, the proposals are directly linked to NOV22 with a negative premium of 15 or 20 EUR/MT. As NOV22 indicates 612.75 EUR, we can say that 600 EUR/MT is tangible for sellers right now in the export market.
And the processors express the same level. The potential gain from export is generated by the logistical difference between the processing unit and the port of Constanța, which these days is a substantial one. But here the sellers have to wait for the delivery of the goods. The processing units are busy processing sunflower seeds and thus the purchase proposals are directly related to the delivery period, which must be after October 1, 2022.
CAUSES AND EFFECTS
Rapeseed is a profitable item for farmers and a cash commodity, also a fact that normally facilitates its transfer through sale immediately after harvest. This year’s factors, however, have drastically penalized the retention and implicitly the speculative tendency to sell late by lowering the Euronext indications from historical levels to the equivalent of sunflower seeds.
Rapeseed will still have an increase in interest, but not as high expressed in price as last season. The swing in global volumes offset, if we may say so, the spring rally. That rally was determined only by the lack of physical liquidity generated by Canada and the disappearance from the market for the moment of about 7 million tons, the aggregate productions of Ukraine and Russia. We forecast more sustained demand from October 2022, aggregated with the other global factors called fossil energy and the VEGOIL complex.
REGIONAL STATUS
The EUROPEAN UNION is out of season. It remains with the volume of 18.4-18.8 million tons.
UKRAINE is also out of season and will generate only for export a volume of 2.8 million tons, which is visible in the flows transiting Romania and Poland.
RUSSIA, with its 3.9 million tons, proposes a ban on the export of rapeseed until February 1, 2023. This generated a slight increase in Euronext indications by 15-20 EUR.
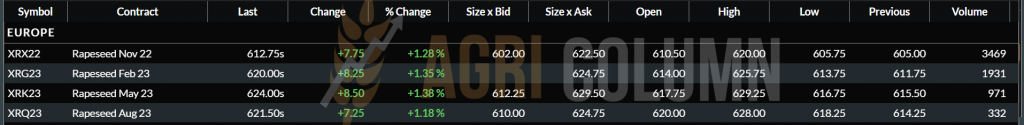
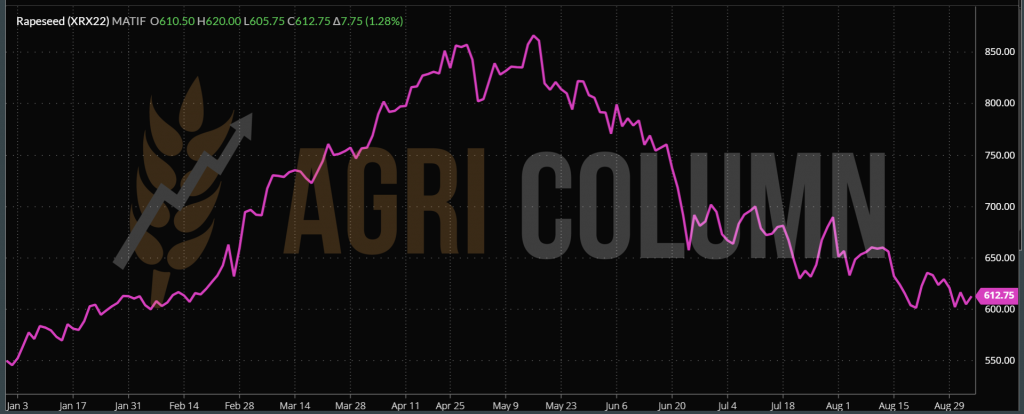
EURONEXT XRX22 NOV22 – 612.75 EUR (+7.75 EUR)
EURONEXT RAPESEED TREND CHART – XRX22 NOV22
GLOBAL STATUS
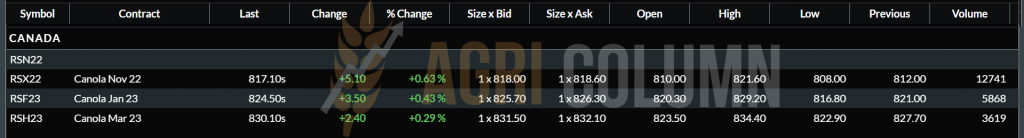
CANADA will generate a volume that practically makes up for last year’s disaster caused by drought and 18.4-18.6 million tons is practically assured. The exponent is given by Saskatchewan with 53% share of this volume, Alberta with 30% and Manitoba with 16% are the other two regions that strengthen the Canadian canola volume. Harvesting has already started and will end in October.
AUSTRALIA will start harvesting in October but also over 6 million tons is seen as volume. New South Wales with 34%, Western Australia with 31% and Victoria with 20% will be the pillars of Australian productions.
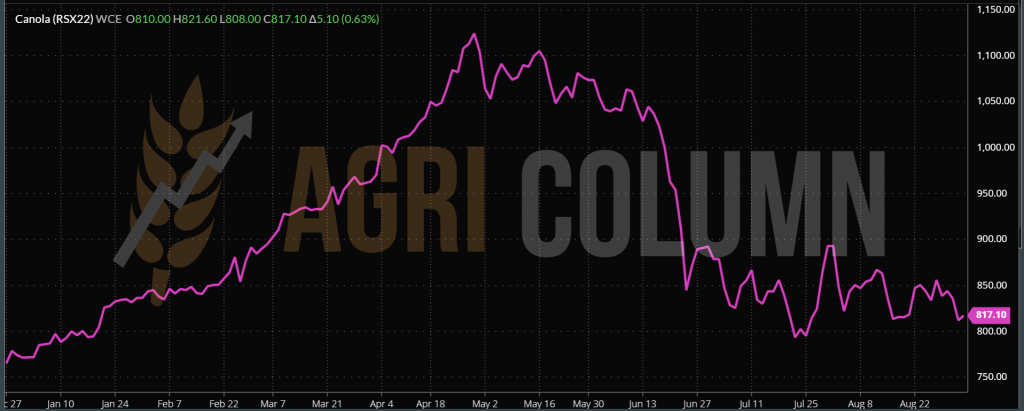
ICE CANOLA RSX22 NOV22 – 817 CAD (+5.1 CAD)
CANOLA TREND CHART – RSX22 NOV22
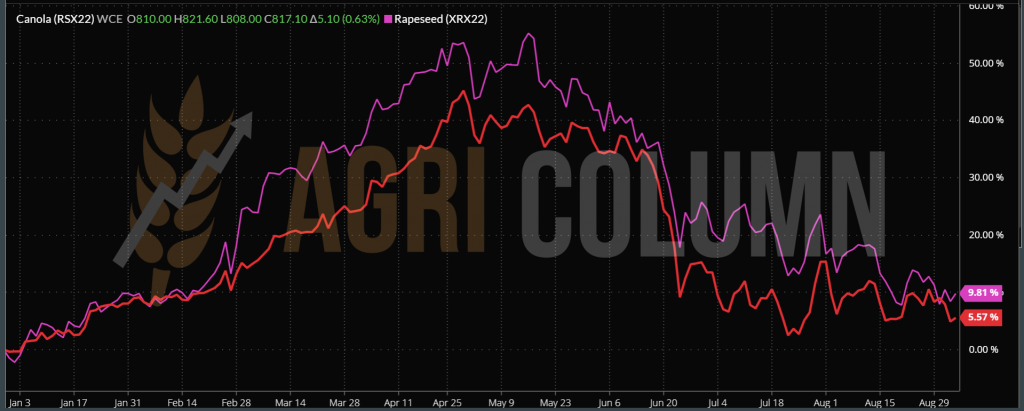
COMPARATIVE CHART. EURONEXT XRX22 VS. ICE CANOLA RSX22
CAUSES AND EFFECTS
- Rapeseed remains an extremely profitable crop and its potential will not degrade in the years to come.
- Uncertainty is currently a problem. The drought that has irreversibly affected the European Union’s spring crops is keeping the soil dry, creating a lack of predictability at the moment for European canola.
- What surfaces will be able to be sown? How will it emerge, how will it evolve? There are still unanswered questions.
- The silent blinking witness to these uncertainties is Euronext, which indicates a positive yield inverse ie NOV22 vs. NOV23, which has an extra 10 EUR.
- It was also worth certifying the positivity of the FEB23 and MAY23 sequences indicating higher levels compared to NOV22. This suggests demand and uncertainty about the ultimate volume potential. FEB23 – 620 EUR, MAY23 – 624 EUR.

LOCAL STATUS
Indications for sunflower seeds have experienced an obvious setback in recent days. Thus, we see a level of 590-600 USD/MT in CPT Constanța parity. In the processor plan, we find a level of 585-590 USD/MT in DAP parity.
Next, the bonus level for HIGH OLEIC sunflower seeds remains around the 60 USD/MT area. Our estimates were correct as we have reached the bonus level we estimated a few months ago when 25-30 USD/MT was on offer.
Harvesting has reached around 40% of the surface, but due to the rains these days, it is certainly interrupted. It will be resumed this week and we estimate that at the latest September 10-15, 2022 it will be concluded.
Romanian farmers started to sell throughout harvesting. At this point, there is no longer a problem with the supply of processing units. We therefore have a much lower retention rate, and this is beneficial for farmers. The cash flow will be restored and it will be possible to cover the due dates of the invoices to the input distribution companies.
Whoever sold or sells these days is doing very well. The pullback we are seeing in the market is coming from several directions. And we mean this drop in price. First of all, the Ukrainian flow that has crossed and will continue to cross Romania is one that we must accept unconditionally.
The European Union needs crude oil, and Romania and Bulgaria must generate it from the raw material of Ukrainian origin, unconditionally, we could say, because Ukraine does not have a predictability of export through the green corridor, and the flow of raw material on the land route that crosses Romania and Bulgaria is a safe one. Processing is carried out locally, the crude oil will be shipped to the EU via Constanța. The whole process is thus predictable.
Why does it affect the flow of raw materials from Ukraine? Because of the much lower price compared to the Romanian raw material. Indeed, the Ukrainian commodity reaches levels of 565-575 USD/MT in the Romanian processing units, which alters the Romanian origin. The mix of prices related to the supply of Ukrainian and Romanian flows will generate a lower average price, the so-called COGS (cost of goods). From here we have two positive directions:
- The yield of the processing units will be much better and the price of the final product on the shelf in the hypermarket will not increase, which is a beneficial thing for the population of Romania.
- The availability of edible oil will not be reduced for the entire season until the next harvest, taking into account the dramatic reduction in the Romanian volume level.
In the negative directions, we also have two mentions:
- Romanian farmers’ incomes are diminished due to the unfair competitive market of Ukrainian goods. Ukrainian goods cross without any tariff and sanitary-veterinary barriers. This is indeed a problem of unfair competition for farmers in Romania.
- Romanian farmers’ costs are much higher. Ukraine has lower costs due to not belonging to the EU, while Romania has other levels of costs in the establishment of sunflower crops.
Contributing to this imbalance is the unfortunate situation in which Ukrainian farmers find themselves, who have no choice but to sell heavily discounted goods. The pressure comes from the uncertainty of the next day and the lack of liquidity at the farm level, which puts the establishment of autumn crops at risk. Many Ukrainian farmers will not be able to establish autumn crops, and this will reverberate over the 2023-2024 season.
Romanian farmers have no alternative. Effectively, no means of safeguarding interests is set in motion. No one wants anything extra, but only a protection tool against discounted flows, especially in a dramatic year like 2022, a year that greatly reduced Romanian crops. Perhaps an instrument to subsidize interests for the costs of setting up sunflower and corn crops, operated by control mechanisms, could somehow balance the interests of Romanian farms.
The control mechanisms should establish an average and minimum level of costs for the establishment based on technological data sheets, and any interest subsidies should also be conditional on the destination of the goods, with the quantity of the goods as the unit of measure, by no means the number of hectares. In short, if the goods are shipped to Romanian processing units or will be sold to a premium buyer, they will be able to benefit from the possible interest subsidy program.
REGIONAL STATUS
HUNGARY, through its processing units, indicates a level of 620-630 EUR/MT with a HIGH OLEIC bonus level of 100 EUR/MT.
BULGARIA, for its part, lifted its foot from the acceleration of prices. Processors are offering 610-615 USD/MT, down from last week when they were indicating 630 USD/MT, and Varna is indicating 645 USD/MT.
UKRAINE has started harvesting sunflower seeds and they will generate a maximum of 9.5 million. tons, with an unprocessed remainder from last season of a maximum of 4 million tons. Local processing will have raw material, but will be highly dependent on the green corridor. Many aspects depend on its extension in time. What we see in the print media that they want to build a pipeline to transport crude oil is a utopian project, for now.
Distance and oil density are problems today. Crude oil is not a fluid product that flows easily like water, for example. Its density creates technical problems in pipeline transport. In addition, extremely powerful pumping facilities will be required, and uncertainty is another parameter. A single syncopation generated by a Russian bombardment would create significant operational and logistical problems.
RUSSIA indicates a gigantic crop of sunflower seeds, of about 17 million tons. We would add that in this figure there is a lot of goods that will actually be stolen from Ukraine. The Russian practice is no longer a secret, just as it is no longer a secret that they stole traditional Ukrainian destinations such as India. This destination has a demand of about 2 million tons annually, and Ukraine has been supplying it until now. But Russia brutally took the place of Ukraine, developing “special” relations with India. We remind about the transformation of India into the turning plate for the distribution of Russian wheat and oil. The fact that Russia has reduced the export tax on crude oil indicates the intentions clearly.
But Russia has some problems that it will not be able to overcome, namely:
- It doesn’t have the sunflower seed processing infrastructure developed like Ukraine, so it couldn’t process you at the level of Ukraine. To clarify, the foreign capital and know-how of multinationals was pumped into Ukraine, which caused the local processing industry to be developed.
- It does not have an operationally developed port network for the export of crude oil. They have no specific infrastructure for such a thing in their ports. And we list briefly, Taman, Kavkaz, Tuapse, Rostov-on-Don and last but not least, Novorossysk.
CAUSES AND EFFECTS
- European harvest volume is dramatically reduced. It will be compensated by processing Ukrainian goods in Romania and Bulgaria and shipping crude oil to the European Union.
- Ukraine has no better option than the combination of land-shipped feedstock and crude oil volumes shipped via Odessa and the Chornomorsk satellite.
- Russia will certainly get bogged down in the large volume of cargo that needs to be processed.
- Russia will certainly be stuck in shipping these peak crude oil volumes in January 2023, when the weather will not be a generous partner to Russian ports.
Thus, from the above, we conclude the following:
- The price of sunflower seeds is tempered today by Ukrainian goods. Their availability by land alters the local prices in Romania, but also in Bulgaria.
- Russia will have to put crude into the export market starting at the end of January, and Turkey will wait quietly until then. They will have no other option than to sell the raw material, not having the capacity to process and operate the port.
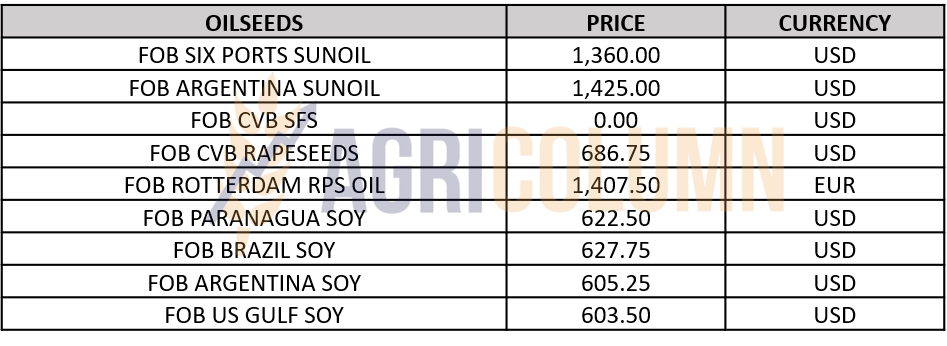
- Global demand for sunflower oil is low at the moment. Offered prices were altered to 1,360 USD/MT in 6PORTS, which represents a decline of 85 USD/MT.
- Cargoes that manage to get through the Green Corridor are slapped by Turkey at a discount of 75 USD/MT, and we mean crude oil.
- Soybean oil is falling in demand due to the lockdown in China. 40 million people are in lockdown, and consumption and implicitly demand is decreasing.
- Palm oil is also down on high volume and the effect of easing export duties from Indonesia.
- In the coming period, we do not believe that we will have returns to levels of 620-630 USD/MT. It is an aggregate harvest pressure with goods from Ukraine that are available and discounted.
- Later Russia will also arrive, which will suffer the same failure as in the case of wheat. Large volume of cargo that cannot be processed and shipped.
Could we see high price levels for sunflower seeds again? If we look at the VEGOIL complex, we cannot say yes. Brazil and Argentina will generate record productions of bean soybeans, and in the complex this is a serious brake on the price of sunflower seeds.
Palm oil and its availability are also not a source of hope. According to the FAO chart at the beginning of the report, vegetable oil is falling sharply compared to grain prices.
And if we compare today the price of sunflower seeds with that of rapeseed, we see that they are too close to each other. Someone has to go up (rapeseed price) but no 30-45 day growth prospects are seen or someone has to go down (sunflower seed price). And according to our analysis, sunflower seeds are the target, at least for now.
CSFO AND OILSEEDS INDICATIONS IN MAIN ORIGINS

LOCAL STATUS
Price indications from local soybean processors are around 600 USD/MT, to which we add the amount of coupled support.
GLOBAL STATUS
USA. The condition of soybean crops is maintained at 57% good to very good. There is no damage to the forecasted volumes, about 123.5 million tons.
BRAZIL and ARGENTINA. Sowing for the 2022/23 cycle begins. West-central and south-central Brazil, along with parts of Argentina, will begin the new sowing season with prevailing moisture deficits and concerns about another La Niña -influenced spring.
World Weather Inc. sees September rainfall in Argentina, Uruguay and Paraguay mostly near normal, along with that in far southern Brazil. This should result in a relatively normal seeding in South America.
October is shaping up to be a potentially troubled month. Persistent La Niña is expected to inhibit precipitation in eastern Argentina and southern and central Brazil. Many areas could see below-normal precipitation, which could delay soybean planting and, in particular, leave some crops less ready for possible development if November’s precipitation is not significant.
Brazil’s 2022/23 soybean crop is forecast to reach 152 million tons.
TRANSACTED VOLUMES
CHINA. China’s soybean processing volumes rose last week for the second week in a row due to higher demand for soybean meal from the feed industry, according to data from the National Grains and Oil Information Center (CNGOIC).
China’s soybean processing level rose by 250,000 tons week-on-week to 1.98 million tons, up 240,000 tons from the previous month, virtually unchanged from a year ago.
BRAZIL. Brazilian soybean exports reached about 6.2 million tons in August. Since the beginning of the year (January-August), exports have fallen by 8% compared to last year due to the smaller crop.
ARGENTINA. Argentina’s grain producers have so far sold 51.6% of the 2021/22 soybean crop, the country’s Agriculture Ministry said on Tuesday, following the 62% sales rate reported at the same time last season.
Argentina’s soybean production in the 2021/22 cycle was 44 million tons, down from 46 million tons in the previous cycle, according to government data, with the country the world’s top exporter of meal derived from the oilseed. Sales have slowed as Argentina grapples with an inflation crisis, prompting farmers to push for a devaluation of the peso to improve the dollar value of their grain.
USA. This week, the USDA confirms the sale of 827,000 tons of US soybeans for delivery to unknown destinations in 2022/2023.
US agricultural exports for fiscal 2023 are forecast at 193.5 billion USD, down from a record forecast of 196 billion USD for 2022, according to the quarterly “Outlook for US Agricultural Trade” report published in August by USDA. Soybean exports are forecast to rise 2.2 billion USD to a record 35.2 billion USD amid higher prices, strong domestic processing and increased competition from Brazil.
CHICAGO BOARD OF TRADE
- S. soybean futures rose on Friday amid an increase in short positions, led by gains in crude oil and other commodities, as fears of aggressive interest rate hikes by the Federal Reserve eased.
- Supply concerns are pushing soybean oil prices in Argentina above those in Brazil.
- Malaysian crude palm oil (CPO) futures fell further on Friday on weak demand overall.
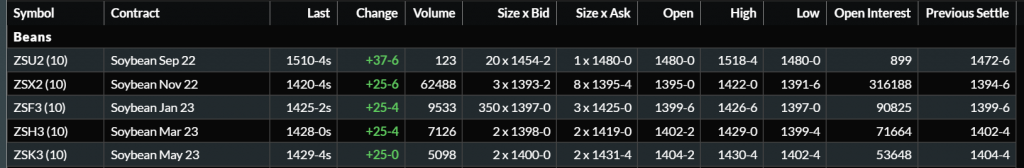
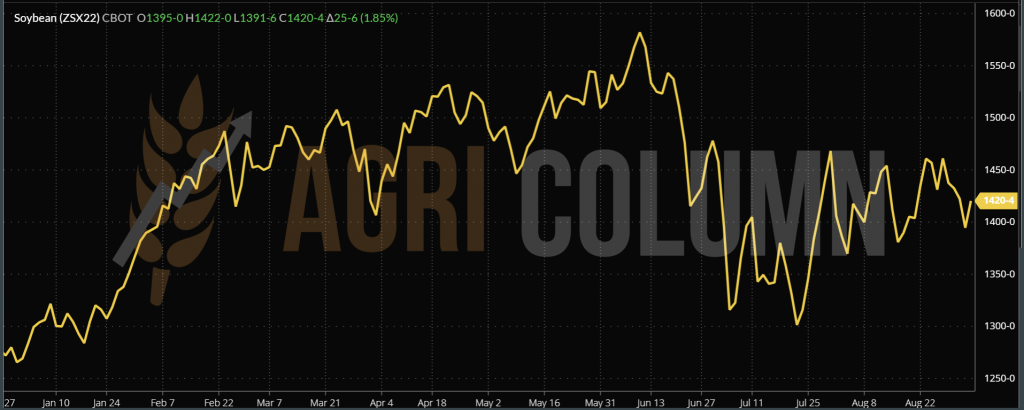
CBOT ZSX22 NOV22 – 1,420 c/bu (+25 c/bu = +9.2 USD)
CBOT SOY TREND CHART – ZSX22 NOV22


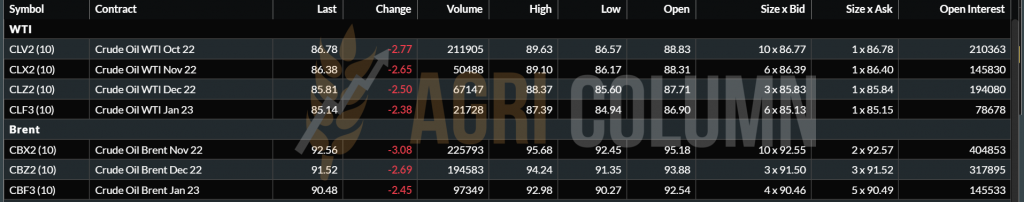
WTI CLV22 OCT22 86.78 USD (-2.77 USD) | BRENT CBX22 NOV22 92.56 USD (-3.08 USD)

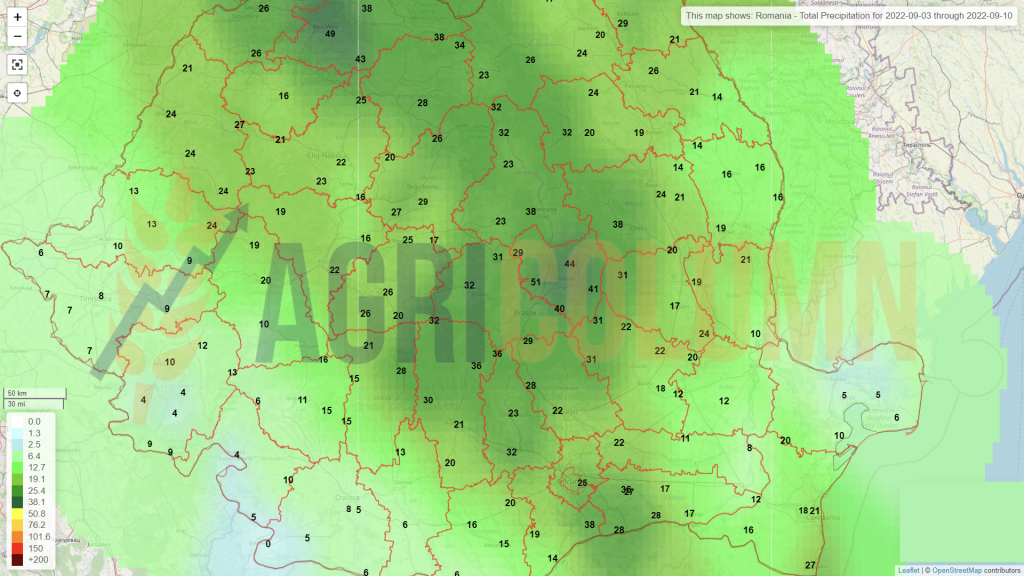
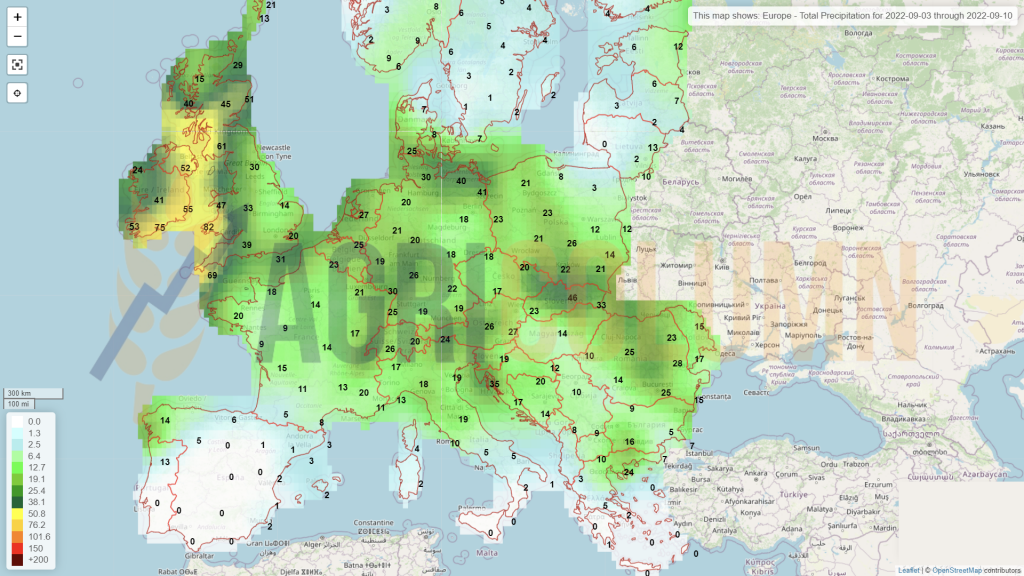
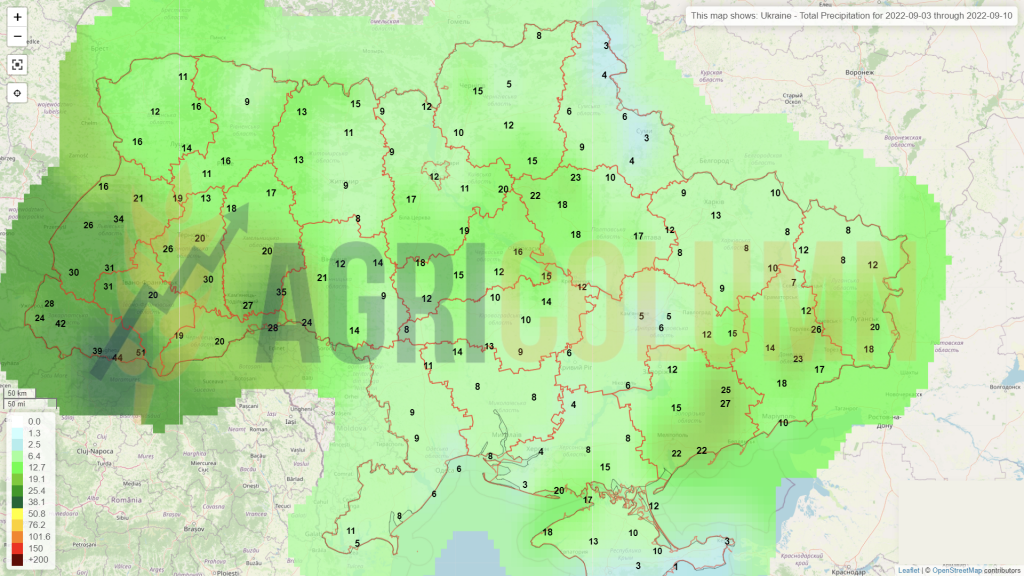
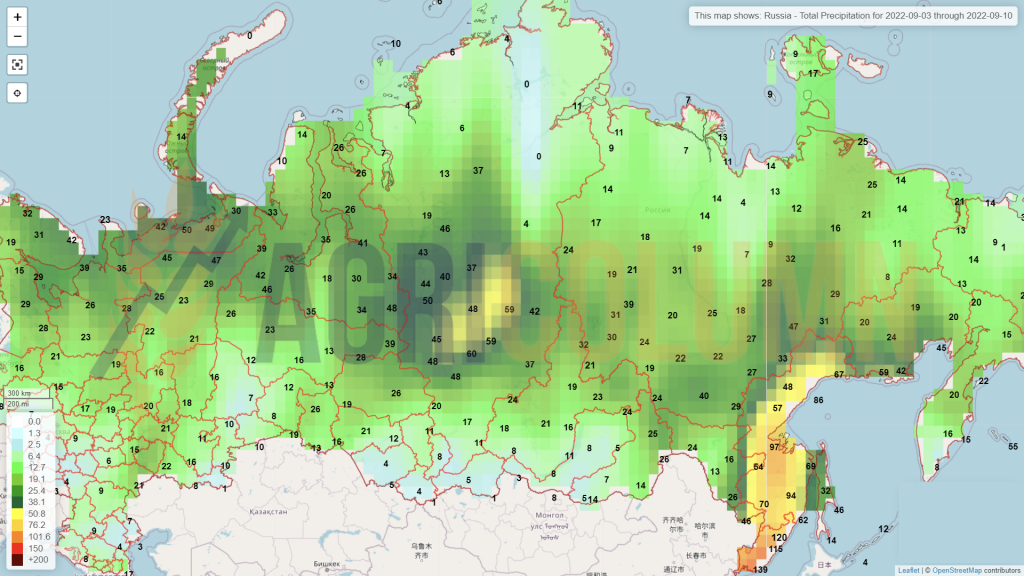
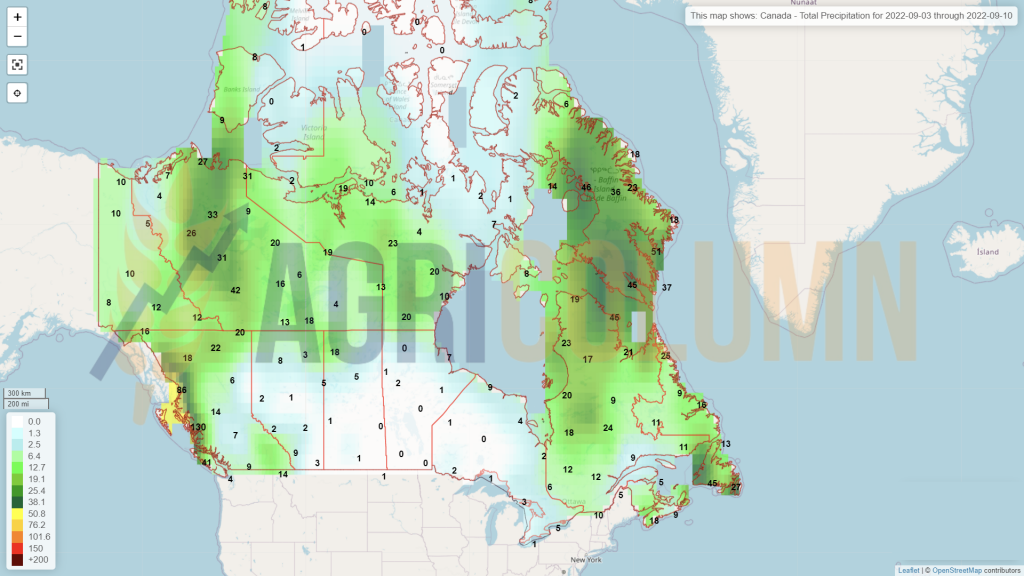
September 3-10, 2022
Romania
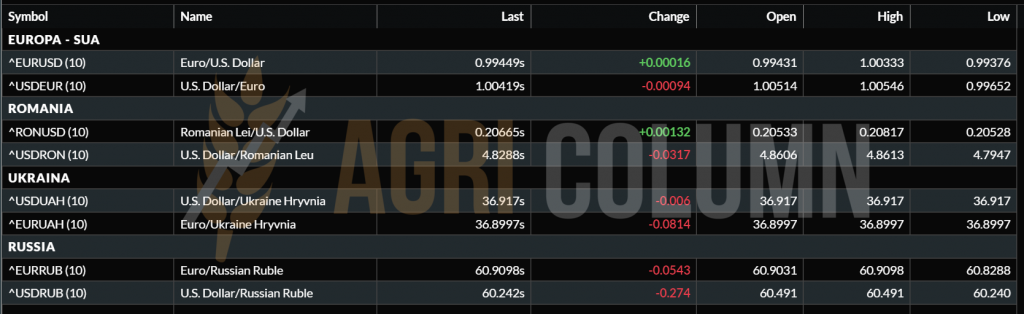
Europe
Ukraine
Russia
Canada
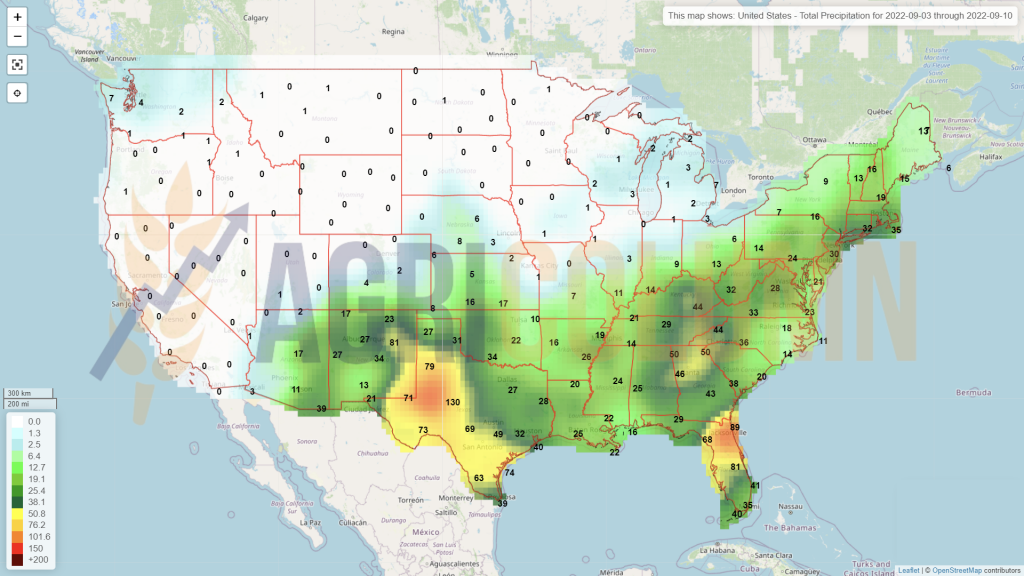
USA
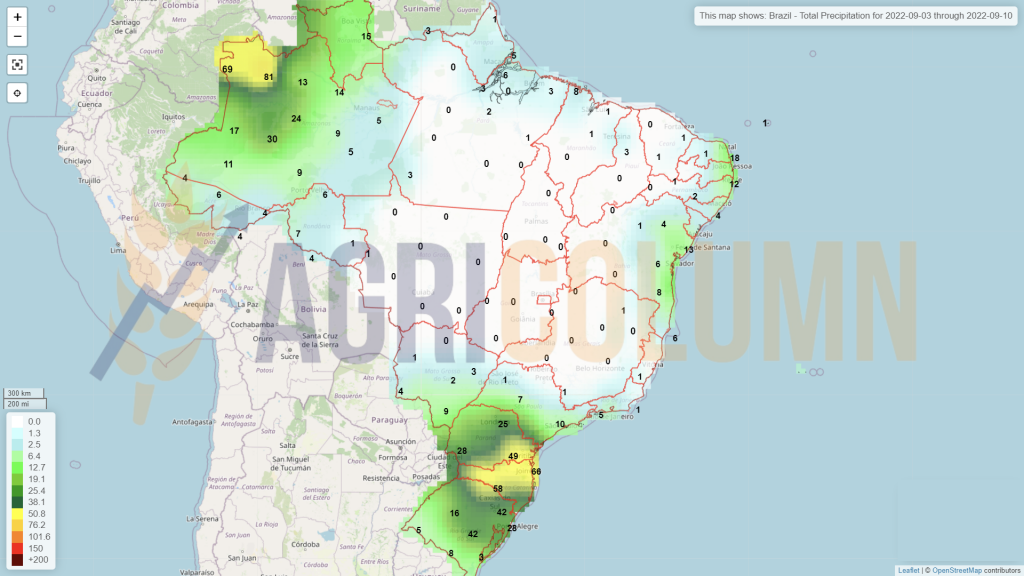
Brazil
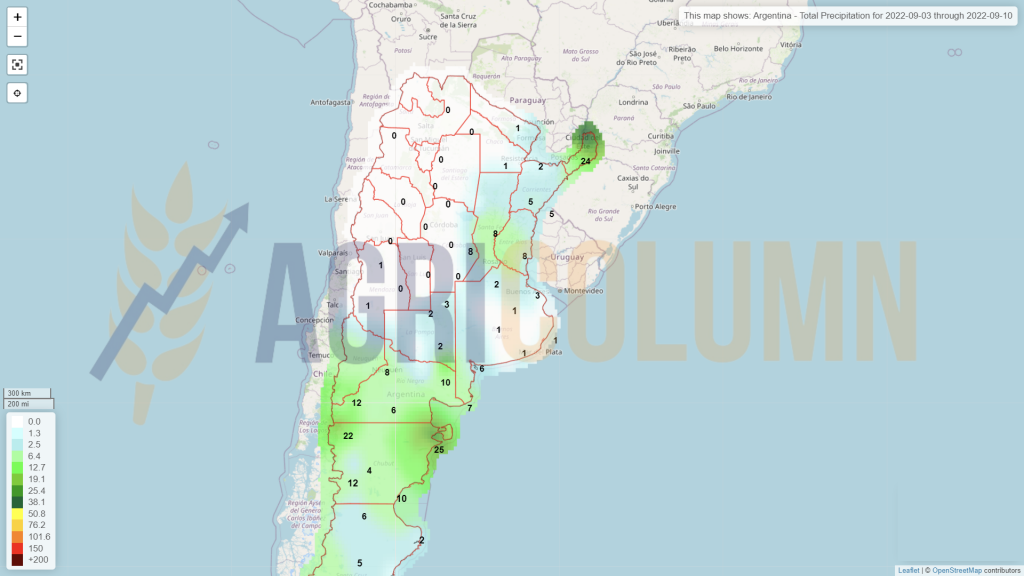
Argentina
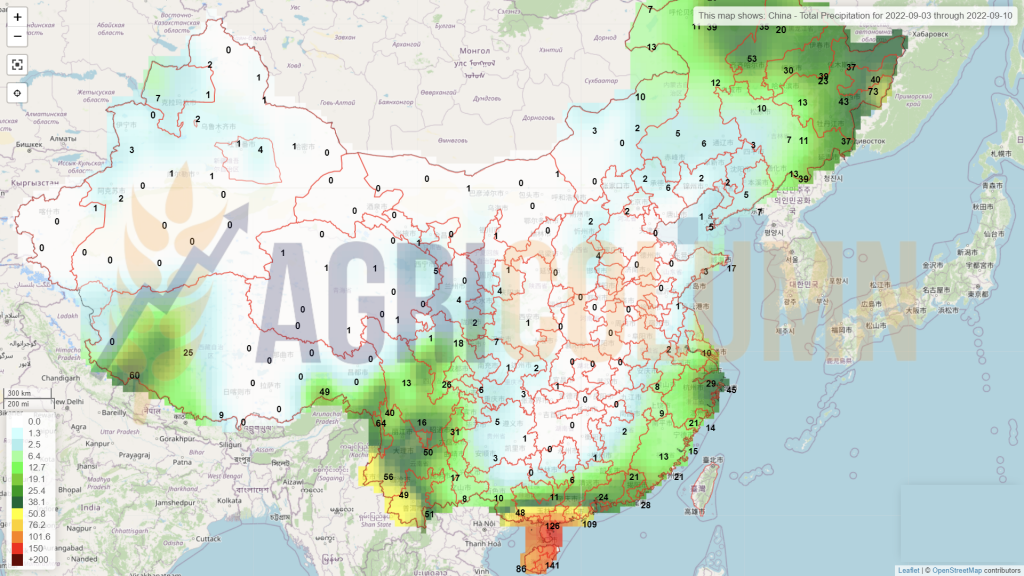
China
Australia