This week’s market report provides information on:

LOCAL STATUS
Indications are melting each day as we approach the expiration of the SEP22 indication. It is a natural thing and a normalization of the wheat market. Thus, the port of Constanta offers the price of 315 EUR/MT of wheat, with a discount of 20 EUR/MT for the feed quality.
The local market, i.e. the processing industry, is much more competitive. Large processors offer prices of 330-336 EUR/MT. This price aggregated with the logistical difference between the location of the processor and the port of Constanța means that, in fact, the price offered is much higher in favor of the processors.
But the current context still indicates a high degree of wheat retention practiced by farmers. The selling stages I’ve been listing have led to exiting the optimal selling windows, and now the wheat is in storage. Farmers’ hopes are linked to a potential increase towards the winter of 2023. But the maturities are approaching and we are talking here about the debts to the input distribution companies, first of all.
CAUSES AND EFFECTS
Why did we end up here? There are many aggregate factors, which we will try to list, for a good understanding of this route:
- The transit of the raw material from Ukraine, which generated a lack of logistics and double logistics costs for Romanian farmers.
- Decreased access to the port of Constanța due to the Ukrainian flows that have operationally seized the operating lines of each export terminal.
- Price pressure generated by Ukrainian goods, which made Romanian goods not preferred by traditional buyers.
- Part of the Ukrainian goods, without a certain traceability and under duty-free conditions, fueled the Romanian processing for a while, which lowered the prices, on the background of the discounts offered and being preferred by the processing industry that had no appetite to purchase the autochthonous goods.
- The lack of an analytical system at the national level that disseminates correct and coherent information about market conditions, factors and trends in the short, medium and long term has left farmers without correct and coherent information that could have helped to estimate the optimal time to sell the goods.
- Missing windows of opportunity due to the above factors and exiting the prime selling period of the raw material.
The factors listed above led to a disruption of the Romanian agribusiness market. In summary, the aggregation of harvest pressure with logistics costs and Ukrainian price pressure generated this bottleneck. In effect, the market was free, we might say. Yes, but Romania was not represented by means of protecting its own interests, despite our constant appeals. And the results are now being seen through this gridlock we are facing.
But we have, apart from the pressures on the price from the logistics and because of the Ukrainian discount, also a cause that is already repetitive from year to year. We are talking about effective sales management. Once again, the price was the marker, and the fact that it was rising did not provide enough support in making the decision to sell. Volatility was the current motivation, and although things were beginning to clear up, farm sales management was not performing well, unwilling to secure even a partial profit.
The current hope that it will grow further was the main motivating factor in not making the decision at its time. I only advocated that 2 tons per hectare be sold, nothing more. Romania does not have a crop like in 2021, but also not like in 2020. Costs have increased, and the drought has left deep traces in the wheat crop, just like in the rest of the European Union.
But the natural question that prompts reflection is the following: which destination cares that we had a drought? No one, I guarantee you. The market is formed by supply and demand, nothing else. The logic of things says that destinations or buyers (as we like to call them) will always gravitate towards cheap merchandise. And this is aggregated with today’s geopolitical effects, which indicate a balance between Production, Consumption and Stocks globally.
We conclude and say the following: in the next period, wheat has no growth trend. The change of positions, the liquidation and the transition to DEC22 in Euronext are carried out, and we will all rally to this parameter. Whether or not to sell is up to everyone, but it should be done in stages. Lots must be secured to aggregate in the income account today’s potential that the domestic market offers. And let’s not forget that the FEDERAL RESERVE has promised another interest rate hike in September, which could lead us straight to 260-265 EUR/MT, the November 2021 level.
REGIONAL STATUS
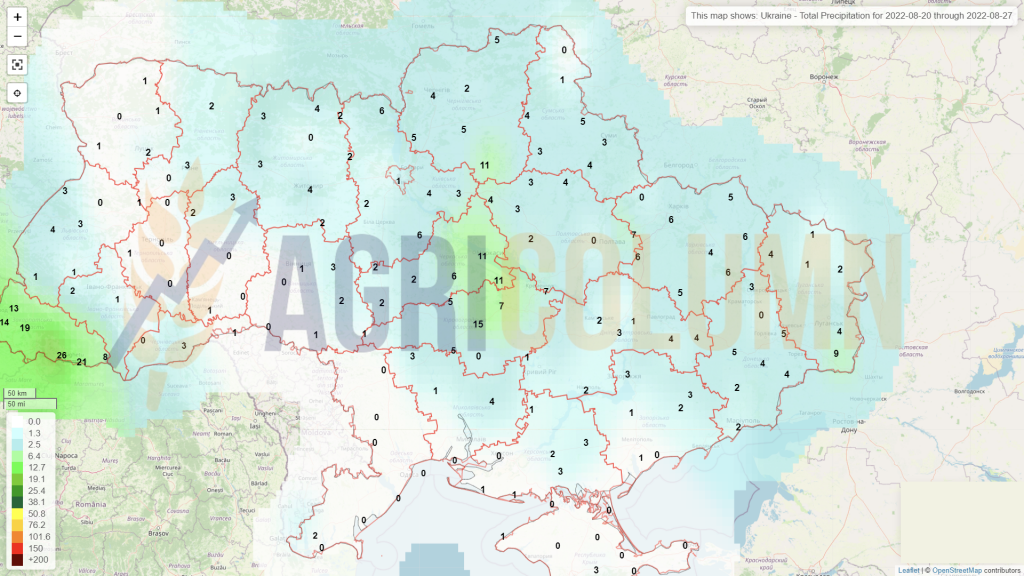
UKRAINE has harvested 91% of its wheat and has an indication of 17.4 million tons at the moment. Certainly, they will approach the figure of 19 million tons, to which we will add last season’s stocks in the amount of at least 4-5 million tons.
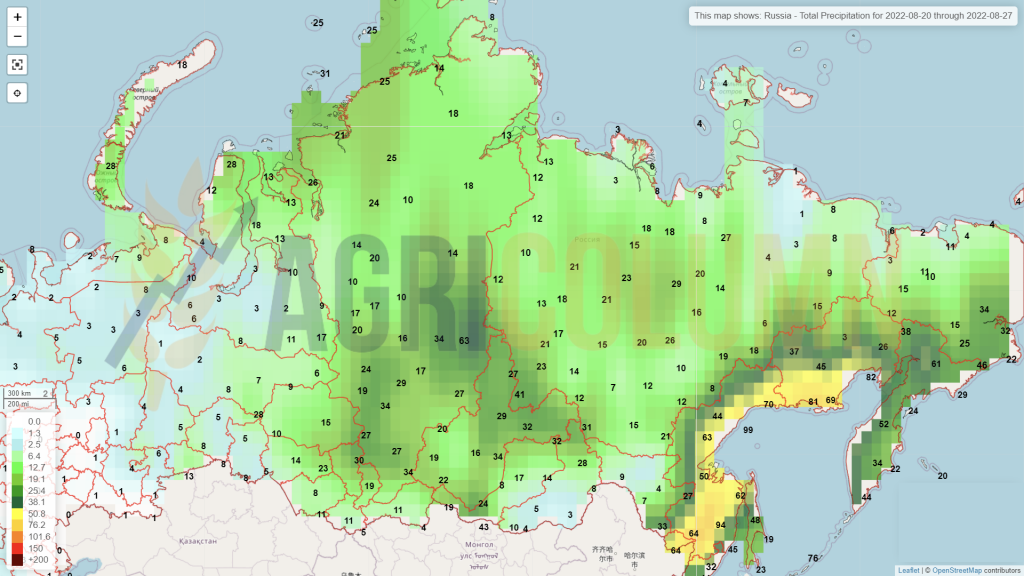
RUSSIA, through local analyses, is estimated at 94 million tons, which represents a crop they have never had before. A large part of this volume, however, is of low quality, feed we could say, due to the rains that washed away the quality and caused in some areas sprouting in the field. But even with a share of 60-65% milling wheat in the total, it is a very large crop, and the mixes can be made without any problem.
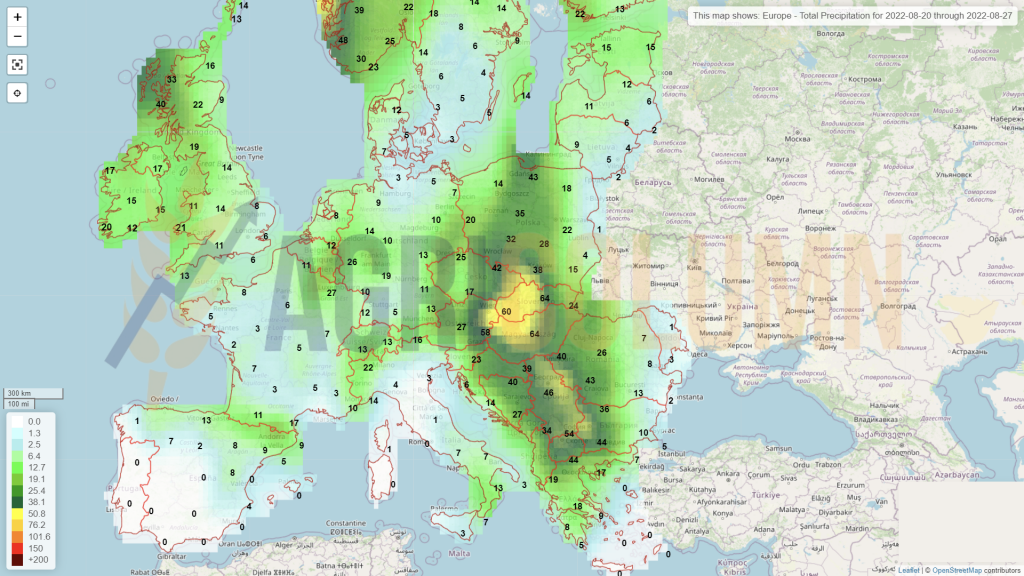
The EUROPEAN UNION does not register volume changes at this time.
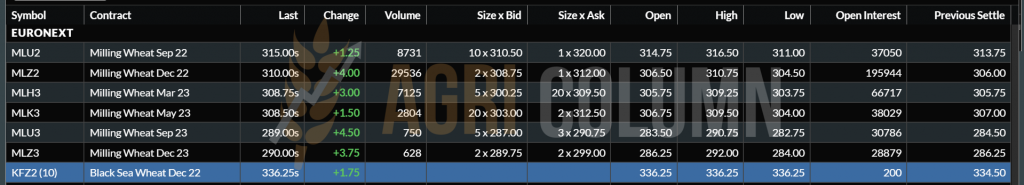
In the Euronext indications, we also insert BSW (BLACK SEA WHEAT by Platts), to have a coherent picture of the goods in the Black Sea basin. This quotation reflects FOB parity generally. You can find it marked at the bottom of the inserted table, with the indication KFZ2.
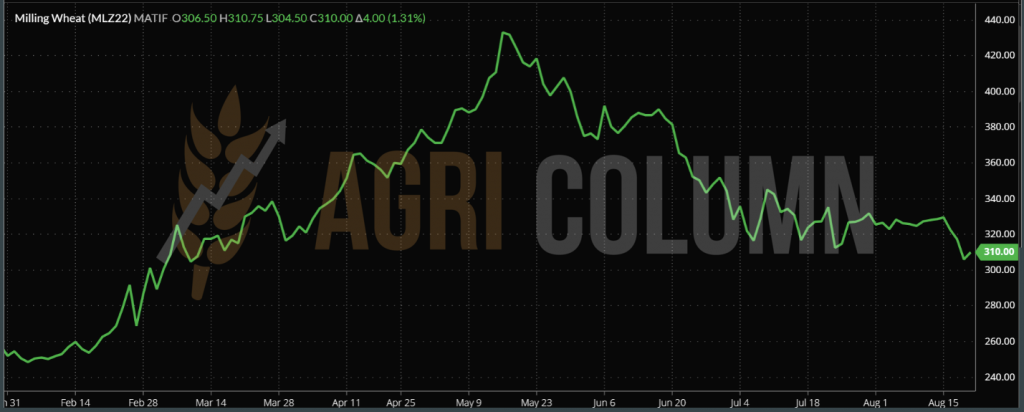
EURONEXT MLZ22 DEC22 –310 EUR (+4 EUR) | BSW KFZ22 DEC22 – 336.25 USD (+1.75 USD)
EURONEXT WHEAT TREND CHART – MLZ22 DEC22
GLOBAL STATUS
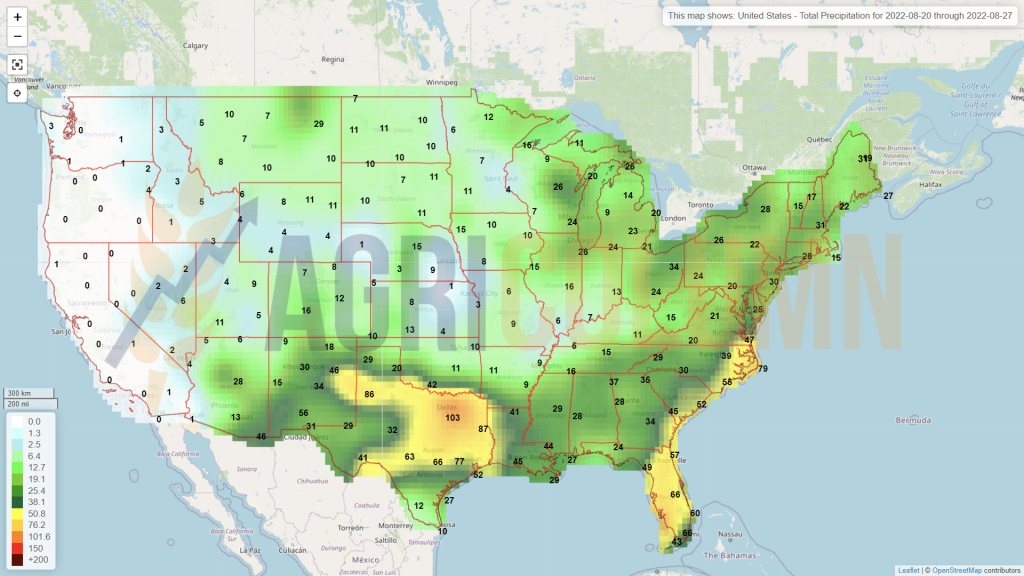
US winter wheat is over 90% harvested and US spring wheat continues to benefit from good growing conditions, rainfall and moderate temperatures.
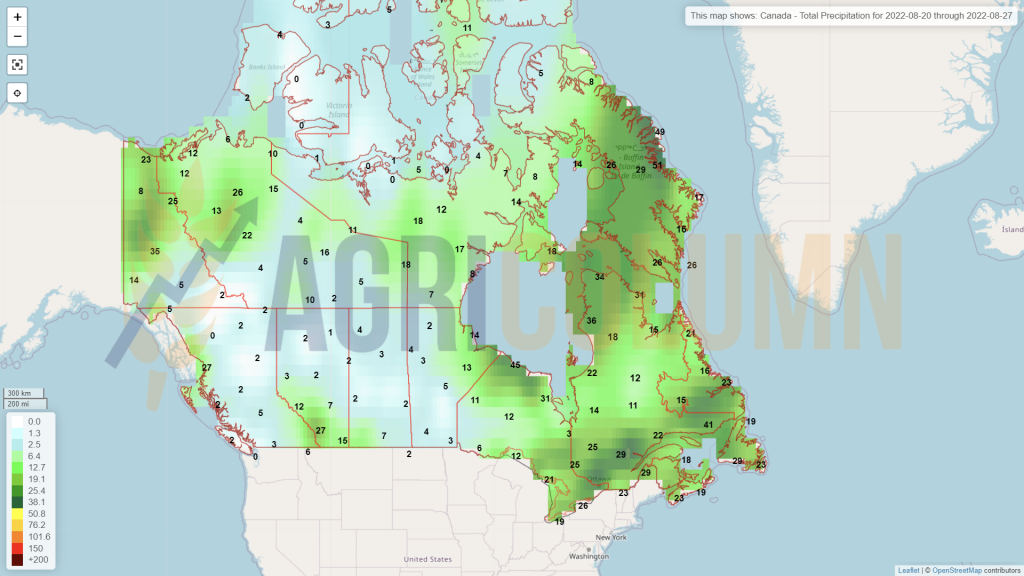
CANADA maintains the same crop forecast. Signs of heat are on the horizon, which could stress Canadian wheat. It remains under observation.
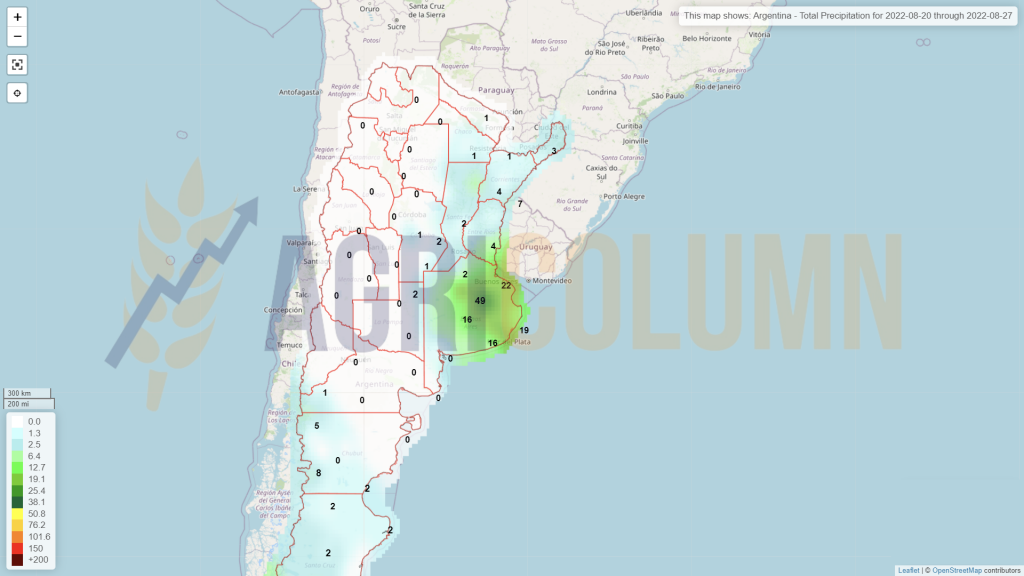
ARGENTINA. The comparison of the vegetation indices shows a clear improvement of the NDVI values in the province of Buenos Aires, the heart of wheat and especially barley production. However, the vegetation indices in the provinces of Cordoba and Santa Fe remain very disappointing.
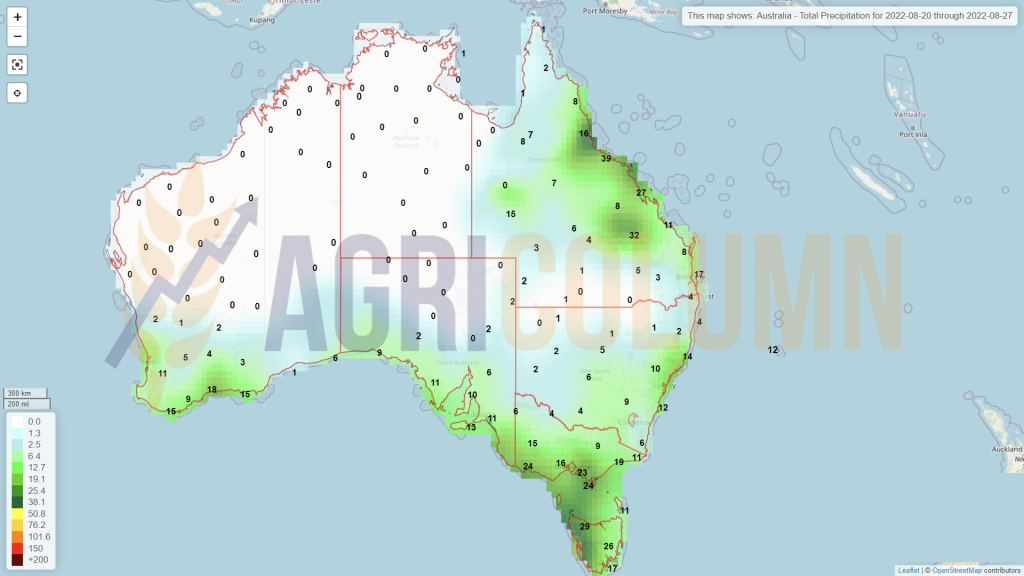
AUSTRALIA. Vegetation indices in northern New South Wales and southern Queensland were still very low on 1 August, but a few days later on 9 August they were much closer to average. This dynamic is very encouraging for the future.
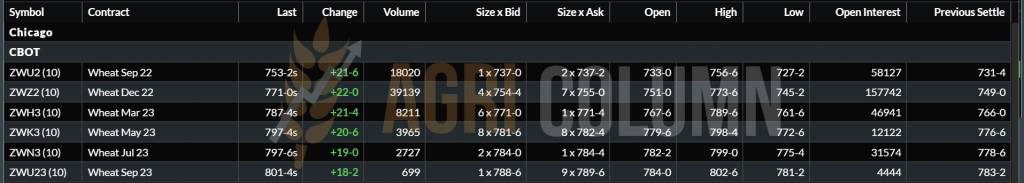
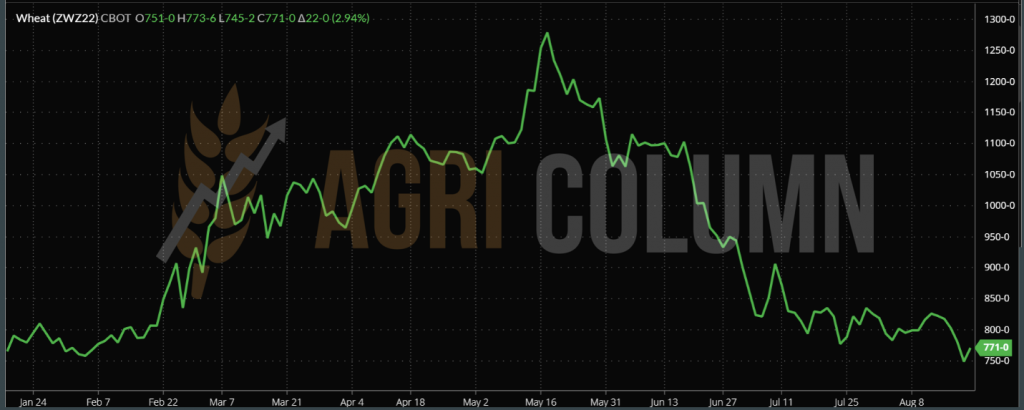
CBOT ZWZ22 DEC22 – 771 c/bu (+22 c/bu = +8 USD)
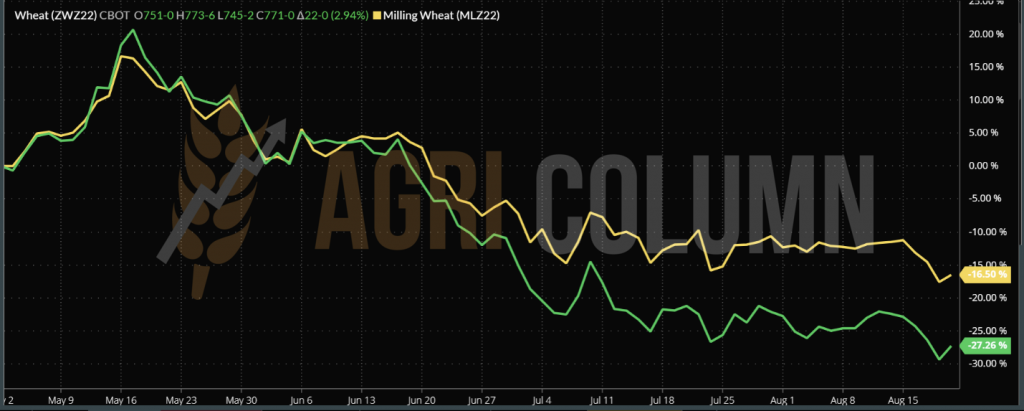
CBOT WHEAT TREND CHART – ZWZ22 DEC22
COMPARATIVE EURONEXT VS. CBOT DEC22
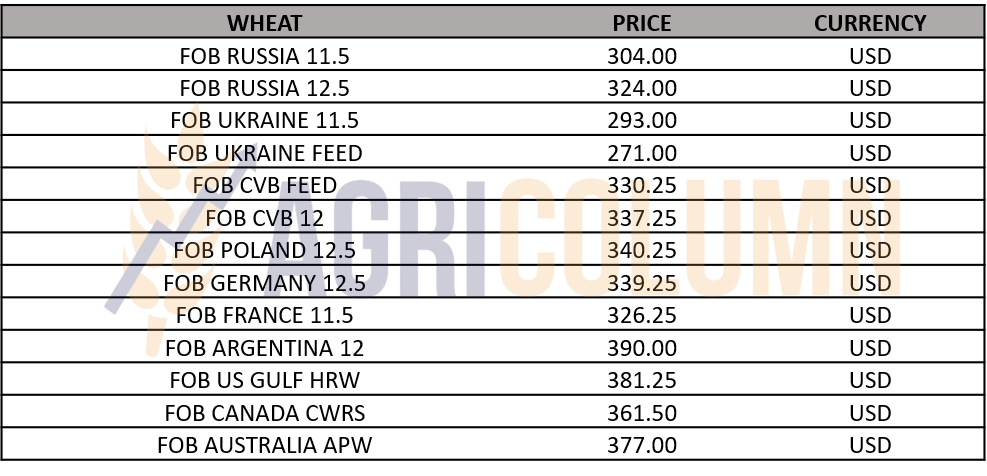
WHEAT PRICE INDICATIONS IN MAIN ORIGINS
CAUSES AND EFFECTS
We have inserted a DEC22 comparative chart between the two exchanges, CBOT (green line) and EURONEXT (yellow line). A decoupling is clearly seen at the level of June 2022, and then, separately, each has the same path in terms of ascent and descent. The assumption we make from exploring this chart is that EURONEXT must agree with the CBOT in the coming period. We have an indication of 771 c/bu of wheat in the CBOT, which is equivalent to 283 USD. EURONEXT indicates 310 EUR, which, converted to USD, leads to an equivalence. A logistic ratio is certainly in favor of European wheat, but not necessarily 27 USD.
In the next period we will face a drop in the price of wheat for extremely simple reasons, which we list below:
- Russia has a gigantic crop and is failing to meet its proposed export targets. Russian ambitions collided with their military actions. Their hope that by carrying out the naval blockade in Ukraine they will generate an immeasurable increase in the price of wheat has hit exactly themselves, that is, the unprecedented size of the crop with which they actually have nothing to do. I also said in previous issues that they are prisoners of their decisions.
- While the European Union sold as much as it could and covered demand in very high volumes even in Egypt, Russia sat and vegetated. Now the main destinations are covered. Volume tenders that have been closed for some time provide the necessary stocks to the purchasing countries.
- What else can Russia do? To turn to the export duty mechanism and give it room to maneuver to generate demand. But this solution is also harmful and dangerous. Again, they will cut their profits and lower the market, the same market that has grown artificially fueled by them through the geo-political behavior that we subsume this famous export tax to. Through it they wanted to emphasize that they dictate the wheat market. Now it is turning against them. As a summary, in the market without high volume buyers, they have to lower the fee in order to sell. They really have nothing to do with those volumes of wheat.
- The ” stock piling” behavior generated by Russia’s unpredictability in terms of actions on the territory of Ukraine generated coverage, and now calmness is the main behavior in destinations. After the silence, they will enter the “hand to mouth” behavior, which will generate sales, but in small volumes and with very large discounts from the sellers.
- Buyers are absent and if we look at the indications these days, we see that Southeast Asia has a price marker of 345 USD/MT for the commodity delivered in September 2022. It is the factor that drives our analysis for the last 6-8 weeks.
- Ukraine gathers courage and starts to move volumes, thus dissipating further pressure on the price.
- North American regions generate projections that give peace of mind in the global balance of wheat production.
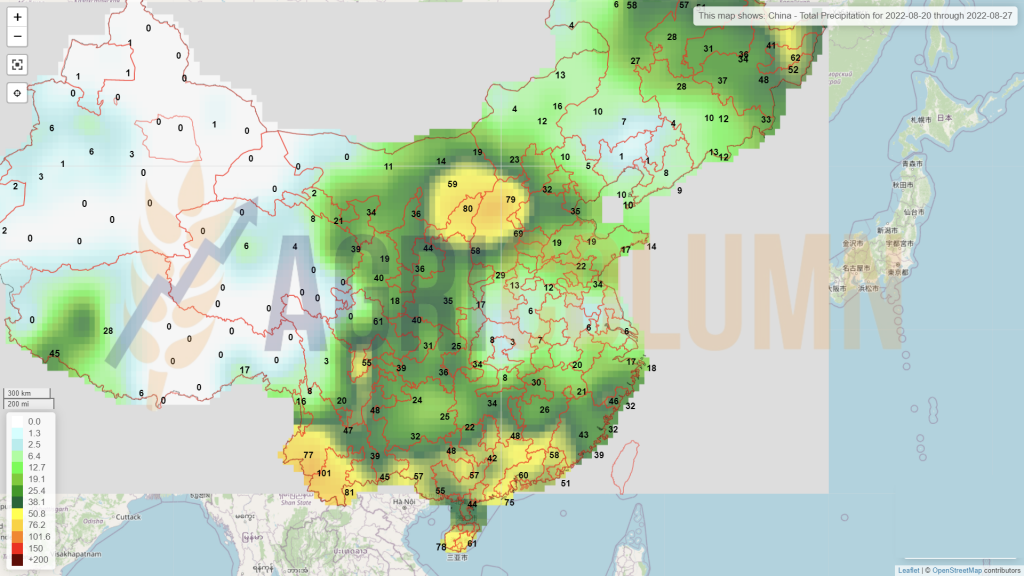
- China is up by 3 million tons, which lowers their import potential. At the same time, the fear of US-China tensions will clearly thin the supply and, implicitly, the price will fall further, if an energy-hungry state generates less demand. Let’s not forget that China’s real estate market is literally collapsing, and the US won’t get involved unless China intervenes in Taiwan. Otherwise, the US will not fall into Thucydides’ trap, but will let it literally implode economically.

LOCAL STATUS
Not much can be said about barley, except that it has followed a downward trajectory in terms of price. Thus, at the beginning of the week, we saw it at the level of 290 EUR/MT CPT Constanța, after which it gradually reached the level of 280 EUR/MT on Friday.
Stocks of barley exist in the country, but farmers proceed the same as in the case of wheat. In barley, the peaks were around 345-350 EUR/MT, and today the difference is minus 70 EUR/MT. Values of 350 EUR/MT will not return, for sure. We may see another level of 300-305 EUR/MT, but not so soon.
REGIONAL STATUS
MIT Jordan does not complete a tender for the purchase of barley this week either. Their purchase intention is at the level of 337-338 USD/MT in CFR Aqaba parity, and the most competitive offers were generated by Australian barley at the level of 346 USD/MT.
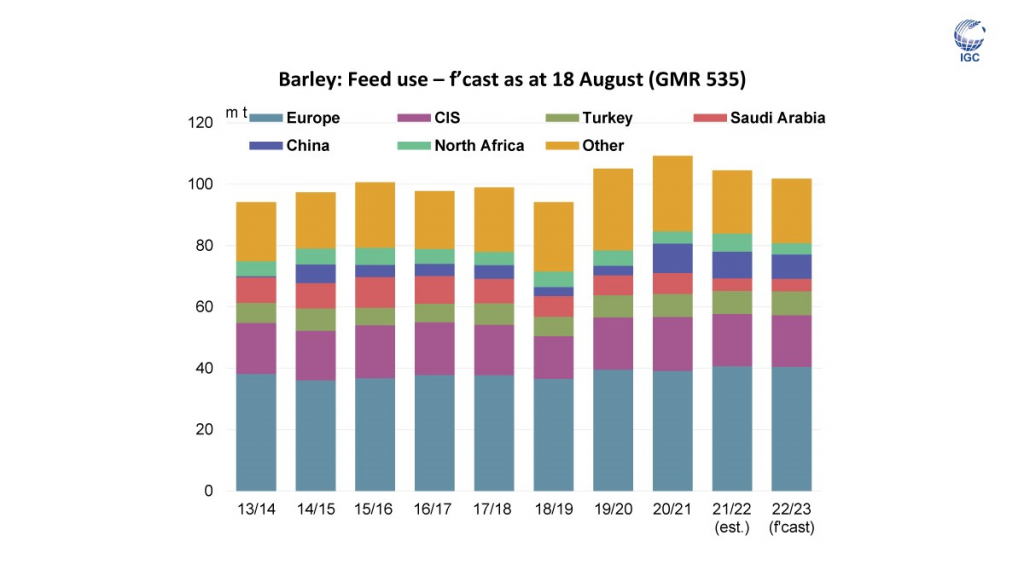
According to the IGC, under the conditions of the 2022-2023 season, barley was decreasing in feed consumption. We are inserting this graph (source: IGC) so that you can see the forecasted levels this season.

LOCAL STATUS
The indications of the port of Constanța are also reduced in the case of Romanian corn. Thus, we have a level of 285-287 EUR/MT for new crop corn, origin Romania.
Inland, indications for purchase are 266-268 EUR/MT and these are the prices that domestic traders pay farmers for the purchase of maize.
The Romanian corn crop has not experienced any improvement. The rains that have fallen will only create a better seedbed for fall sowing.
Ukrainian corn continues to transit through Romania, on the way to the port of Constanța, but a good part remains in the yard of the Romanian livestock industry. Chicken and pig farms are buying discounted Ukrainian corn at prices of up to 240 EUR/MT DAP.
Corn harvesting has started in the southern areas of Romania and we can only talk about the first test cuts. Nothing far-reaching. But the results are extremely disappointing.
CAUSES AND EFFECTS
The main cause of the imbalance of the income and loss account in Romanian farms is the very low harvest volume. The set-up costs will not be covered and we will see two effects:
- Retention of goods, in the case of those who have the possibility of storage, in the hope of higher prices in the future. But whatever price could hypothetically exist, it still does not cover the establishment costs.
- Increasing financing costs in two directions: one to companies that sell inputs, and the other to financing bodies. In both cases, they are nothing but cost accumulations. The due dates will be rolled through the “revolving” procedure, that is, they will move to the next season and will add future financial costs. And financing will generate a commensurate cost too, as interest rates are quite high, somewhere around 14-15%.
The technical and economic question that every farmer should ask himself is this: is it worth it to accumulate financing costs and interest on the inputs rolled into the next season? Because cumulatively it could be 7-8 EUR/MT/month. And with the way the market is today, I don’t see that they can be recovered through a higher price, for 4-5 months of storage accumulates 35 EUR/MT costs, apart from those that most do not account for (costs of storage, energy, etc.). And who is to guarantee that the price of corn will generate a level that covers interest, storage costs and an eventual higher profit? We believe that the winter price of corn will not generate a level of cost and interest coverage set forth above.
REGIONAL STATUS
UKRAINE remains unchanged, with the level of 30 million tons.
RUSSIA remains unchanged at 15.5 million tons
The EUROPEAN UNION oscillates between the reality of 55 million tons and the 60 million tons postulated by the USDA.
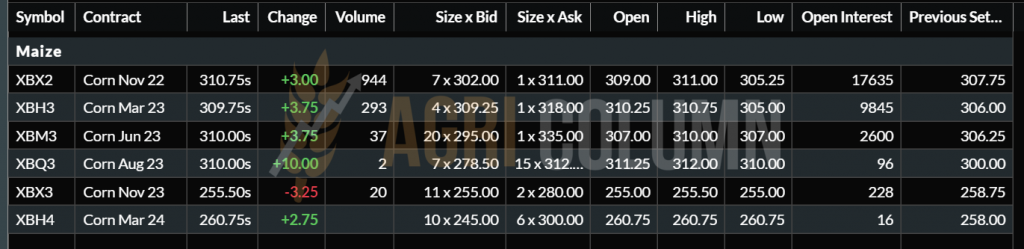
EURONEXT XBX22 NOV22 –310.75 EUR (+3 EUR)
EURONEXT CORN TREND CHART – XBX22 NOV22

GLOBAL STATUS
USA. Over the past 10 days, the central and eastern Corn Belt has seen 10 to 100 percent above average rainfall, while the west has remained drier. In the coming days, the entire Corn Belt will be exposed to a drought trend. Although there are some decreases in values in places, vegetation indices have remained largely stable in the Corn Belt.
Potential degradation could occur in the next two weeks, especially in Nebraska, Kansas and Oklahoma, more precisely west of the Mississippi. The rest of the Corn Belt states do not raise obvious signs of concern, and we are talking about Mississippi, Arkansas, Alabama, Missouri, Tennessee, Illinois, Kentucky, Indiana and Iowa. Precipitation will cross the mentioned states these days and will also have average temperatures, a fact that could favor the development of corn crops. But we repeat, we may still see some degradation at the production level.
In South America, no changes in harvest volumes are expected.
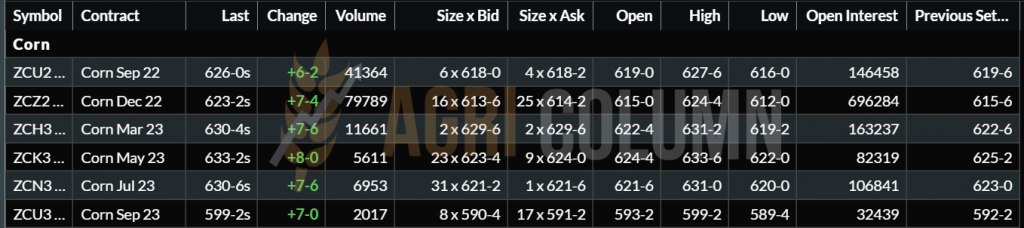
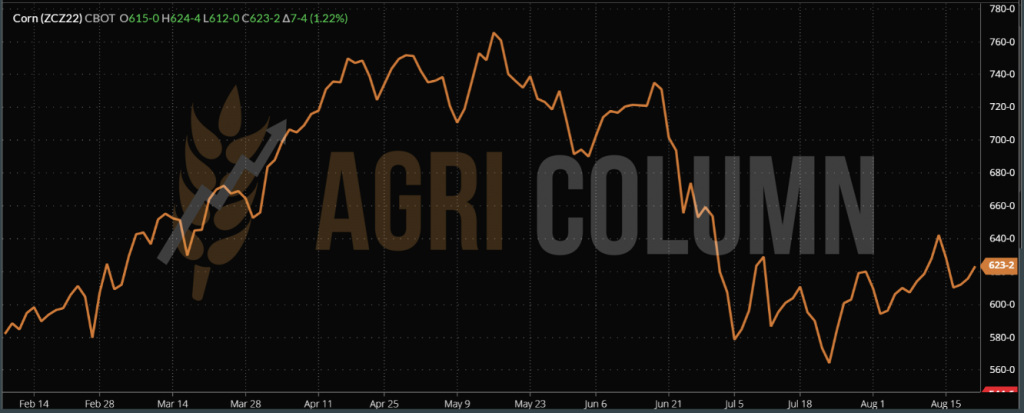
CBOT ZCZ22 DEC22 – 623 c/bu (+7 c/bu = +2.75 USD)
CBOT CORN TREND CHART – ZCZ22 DEC22
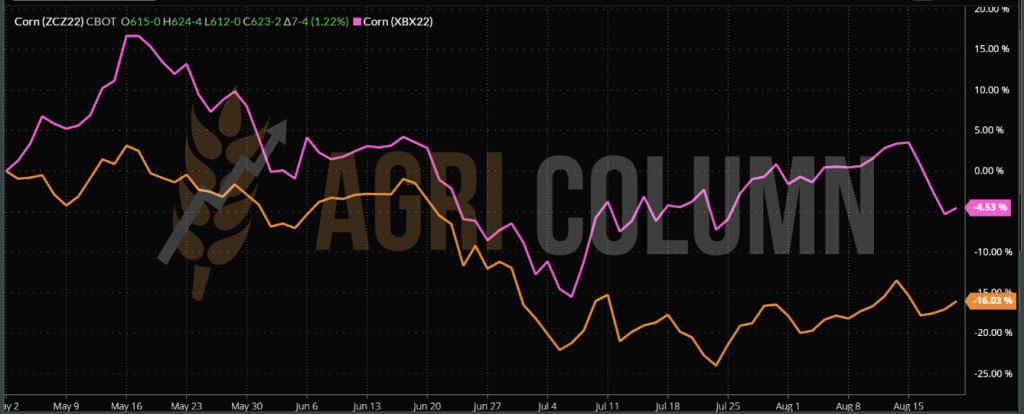
COMPARATIVE GRAPH CORN CBOT VS. EURONEXT
CORN INDICATIONS IN MAIN ORIGINS

CAUSES AND EFFECTS
We have included, as with wheat, a comparative chart of corn between CBOT and EURONEXT. The decoupling of European corn occurred at the end of June, and today we have a European corn pulled up by the small size of the crop.
If we compare the price of CBOT with the price of EURONEXT, we have the following benchmarks: 245 USD CBOT vs. 310.75 EUR EURONEXT. For reasons of almost equivalent parity today (1 EUR = 1.003 USD), we will consider EUR=USD. And we see a difference of 75-76 USD in favor of European corn. The logistics difference for the same destination, Northeast Asia, is 23 USD. If we subtract it, we are left with 50 USD in favor of European corn.
What we want to emphasize is the fact that the price of European corn is much too high compared to that of American corn, on the stock market, of course. And we have to take into account several factors that could correct the price level of European corn:
- The shortage in the EU can be compensated from two sources: Ukraine and the USA
- The lack of volume from the EU may translate into a lower level of imports and a conversion to feed wheat. With a discount of 20 EUR/MT, feed wheat becomes attractive compared to maize.
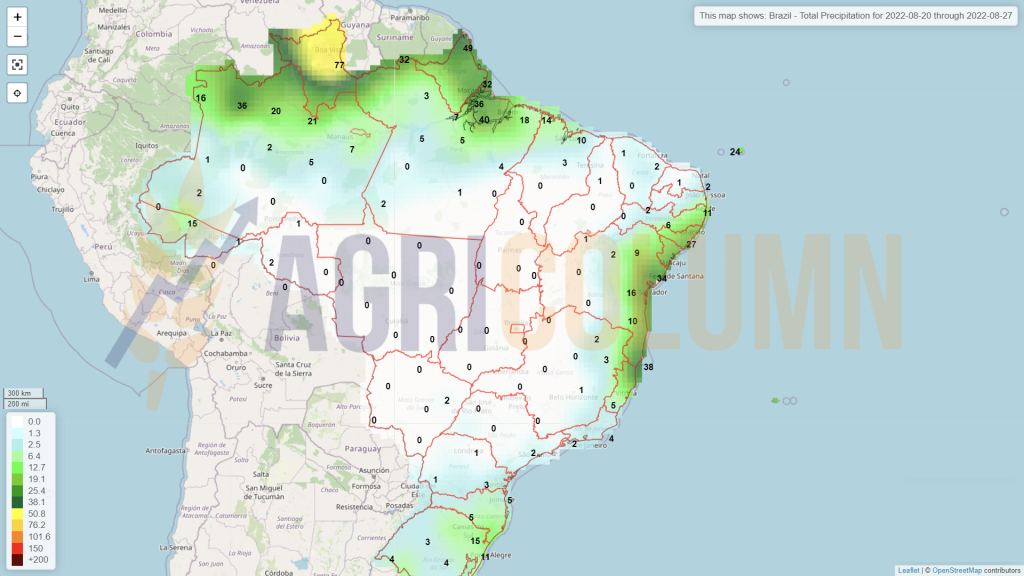
- BRAZIL is selling very high volumes to China and other destinations this time, thanks to a very good Safrinha crop. The future forecast raises the Brazilian harvest volume to 126 million tons, representing an increase of 10 million tons.
- The USA will start harvesting in September and the logistics to the Iberian Peninsula will generate sales at a much lower price level.
- If US-China tensions escalate, we will see a reduction in China’s interest in American goods and a shift to the origin of Ukraine.
Our analysis indicates a possible correction of European corn, but not necessarily large. Corn remains supported, as long as there will be uncertainty on the volumes of the commodity that are still in the field. As a whole, the US is selling more expensively than Brazil, which is still in harvest season. Europe has no cargo and will soon go into harvest, but we will have a very low volume harvest this year. But Ukraine has a debt to the EU and will certainly make up the shortfall.

LOCAL STATUS
The indications of the port of Constanța are summarized in the indication NOV22 minus 10 EUR/MT. Processors are still interested, but want to buy with storage included until at least November 2022. Their indications are in the same regime as the exporters, but they also include storage in the price.
However, we see consignments of Ukrainian goods that find a corridor and are traded in Romania at unbalanced levels. Thus, we observe a discount compared to the Euronext indication of 70-80 EUR/MT applied by Buyers of Ukrainian goods.
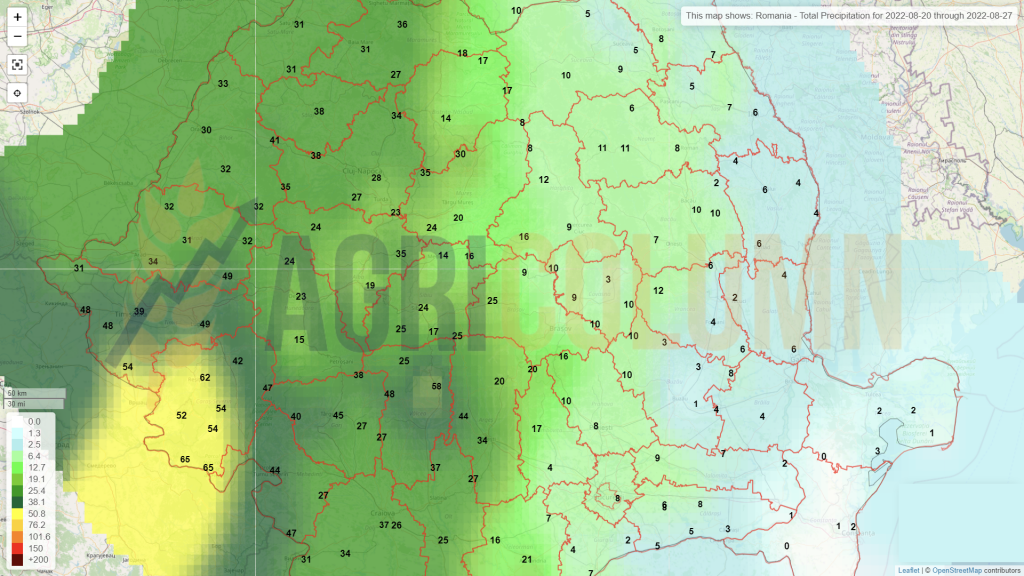
The sowing season has started in Romania and we are already noticing the sprouting of rapeseed in Călărași county. The water that the fields have benefited from lately has helped the seeds to germinate. It is a good sign for rapeseed crop in Romania.
CAUSES AND EFFECTS
The price drop was caused by a combination of factors. The composition of this mix consists of the effect of a very good crop in Europe, a low level of soybeans in the CBOT, a stagnation in the price of palm oil and finally the correlation with fossil energy, which remains in the area of 92-95 USD/barrel in Brent.
Many lots have been kept by farmers and now they see a great potential for growth disappearing further and further into the horizon. The illusion of a hypothetical 900 EUR/MT has inspired many to hold significant volumes of rapeseed, completely forgetting the factors that led to these levels.
The first factor was that of commodity liquidity, in light of the disastrous crop allocated to Canada last season. The second factor was the proximity war, which generated a potential loss of Ukrainian and Russian volumes, in the Ukrainian scene due to the invasion, and in the Russian scene due to sanctions.
The effect of rapeseed storage has now turned against the farmers and traders who stored the rapeseed. It is an effect with deep reverberations, right down to the balance sheets of these entities. A difference of 150-200 EUR/MT applied to the number of stored tons means an extremely serious impact.
Rapeseed will generate demand again in October 2022. However, the price levels will be adjusted with the following factors: soybean, palm oil and petroleum. All three will generate levels aggregated or separately. But one thing is certain. The demand will exist and will be fueled in the future by the potential of sowing, sprouting and development at the level of the European Union, this autumn.
At the moment, rapeseed trading is at the same level as it was before the start of the Russian invasion of Ukraine, so it has a fair correspondence, if we take into account the two factors described above.
REGIONAL STATUS
RUSSIA still indicates a crop level of 3.9 million tons, with the same plus of 1 million tons. And we remind you that on August 31, 2022, Russia will withdraw the export restriction it has today on rapeseed.
UKRAINE overcomes the barrier of 3 million tons of rapeseed and increases the crop from 2.8 to 3.1 million tons. In the Odessa region, autumn work has begun, which includes the sowing of rapeseed.
THE EUROPEAN UNION again indicates production above 18.4 million tons, after initially returning to 17.9, from 18.4 million tons. Now the production is raised to a new level, more precisely 18.8 million tons. It is a level that negatively impacts rapeseed quotes in the European stock market.
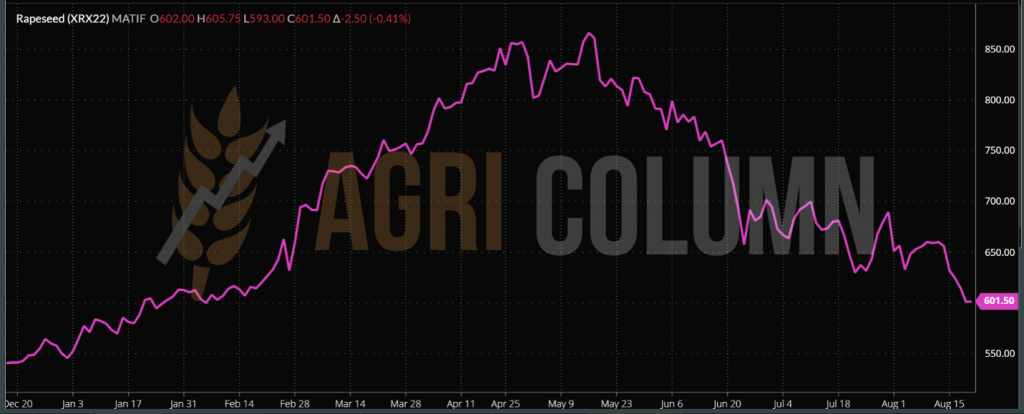
EURONEXT RPS XRX22 NOV22 –601.5 EUR (-2.5 EUR)
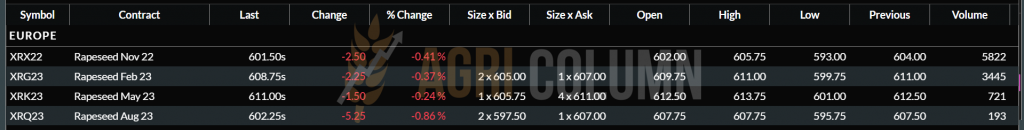
EURONEXT TREND CHART – XRX22 RPS22
GLOBAL STATUS
CANADA is fast approaching the canola harvest and the certainty of a 20 million ton crop is in place. Early September will see the first lots of canola harvested from the Canadian plains.
AUSTRALIA he still has to wait until the beginning of October to harvest and again has a boost of 0.3 million tons, from 5.5 million to 6.1 million tons.
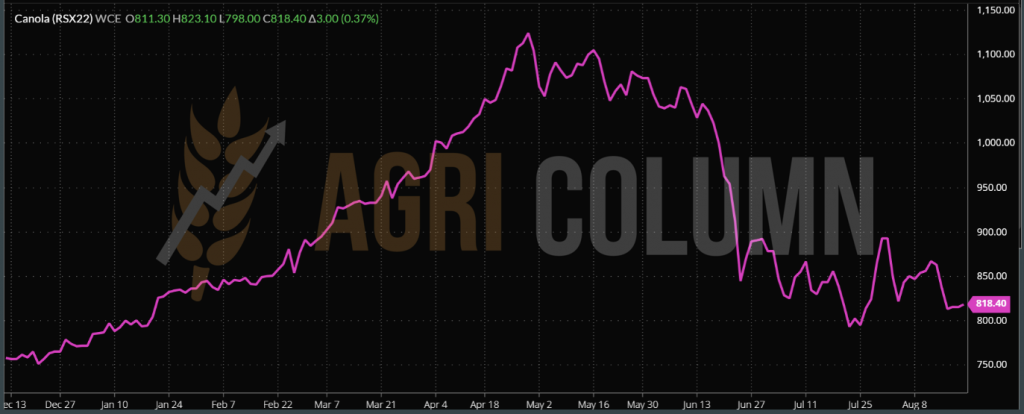
ICE CANOLA RSX22 NOV22 – 818.4 CAD (+3 CAD)
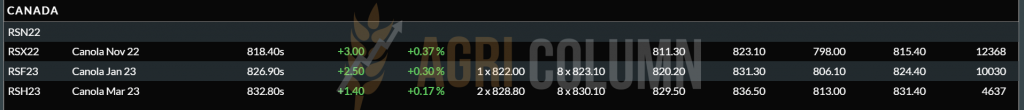
ICE CANOLA TREND GRAPH RSX22
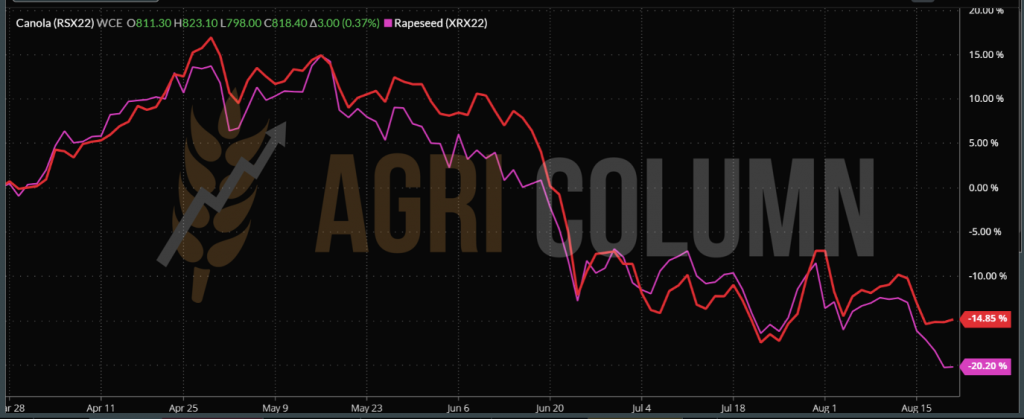
COMPARATIVE EURONEXT VS. ICE CANOLA – we will see a 2-3 EUR rebound on NOV22
CAUSES AND EFFECTS
- The soybean route will lead canola through the next period of time, at least until US crop volume stabilizes.
- Palm oil will also bring uncertainty. It is currently in a state of price stagnation.
- Oil will also generate instability, due to the war waged by Russia in Ukraine.
- A potential threat to demand could come from China. The real estate crisis and the decline in consumption are certain things.

LOCAL STATUS
Indications have gained consistency, according to our forward-looking analysis, and we see levels of 620 USD/MT in the CPT Constanța parity, while processors are positioning themselves at levels of 610 USD/MT.
Bulgarian processing generates levels of 645 USD/MT in the Varna region, and in the region near the Danube, values between 630-640 USD/MT.
On the Romanian market, harvesting is in full swing. And in the case of sunflower seeds, we are witnessing the formation of commodity retention. Farmers signal through this behavior some things they have experienced and we list them here:
- Price drop from 680 USD/MT to 510 USD/MT due to:
- Ukrainian quantities of goods that fed the Romanian market
- the premises of a rich crop in Romania, which, instead, turned into a real disaster due to the pedological drought.
- A drop of 170 USD/MT is not easy to digest, given that farmers had no certainty about the crop. And they did very well not to sign. But today’s price does not cover their establishment expenses, given the average of 1.7 tons/ha in Romania.
- A competition from Ukrainian goods that caused them to be neglected. But today, Ukraine is starting to locally process and export crude oil through Chornomorsk and Klapedia – Lithuania, so these flows could decrease drastically.
The processors in Romania suddenly found themselves in a landscape they did not want, namely the small crop and the retention of goods. Processing capacity cannot operate without raw material and the problems are quite acute.
However, we estimate that many farmers will sell as they have harvested and the quantities will come at a lower rate, but will generate raw material for processing. Not all farmers can keep sunflower seeds. It is primarily about the storage spaces that have wheat in them, maybe also rapeseed, barley. And, certainly, this phenomenon of releasing the raw materials susceptible to being the most perishable will occur.
The Ministry of Agriculture initiated a draft emergency ordinance with a state aid scheme for processing units in the milling and baking industry, as well as for the oilseed processing industry. In short, it is allocating 500,000 EUR to each processor, regardless of industry. This translates into a state aid of 35 EUR/MT for wheat and maize and 52 EUR/MT for oilseeds. The amounts allocated through this scheme are 14,280 tons for wheat and corn and 9,615 tons for oilseeds. Naturally, everything must be certified by documents by November.
As a first remark, we could say that large processors have no obvious benefit, unless they pay this level of aid per ton to a larger number of tons.
And the second remark we have is related to the potential for stimulating an inventive framework that could be born among small processors to be able to access this state aid.
Otherwise, we only see this as an aid given to processors, but we do not guarantee that farmers will benefit from higher prices, since this GEO draft put into public debate lacks clear market benchmarks and methods of reporting to a price namely, for transparency, specifically.
CSFO AND OILSEEDS INDICATIONS IN MAIN ORIGINS
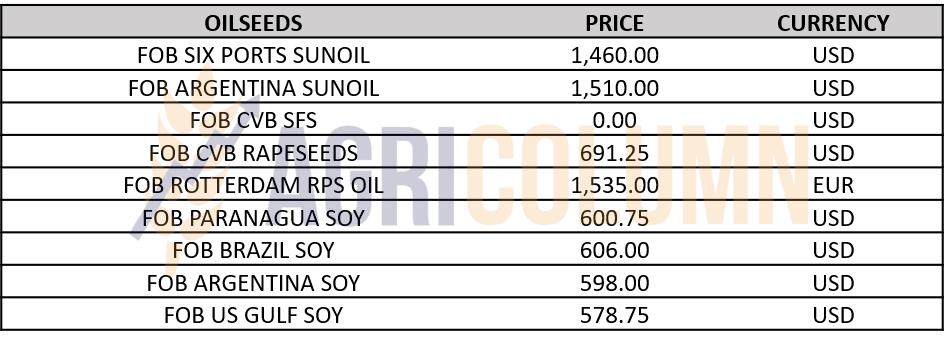
CAUSES AND EFFECTS
- The development of harvesting will generate commodity liquidity in the Romanian market.
- The European Union will not be able to rely on the 9.8 million tons it estimates today. We see, with indulgence, 9.2 million tons.
- If Ukraine will find its pace of processing and sale, the liquidity of the exported raw material will decrease to a maximum of 1-1.2 million tons. Even under these conditions, the transfer across the border to Romania and Bulgaria will not be easy.

LOCAL STATUS
Local soybean processing industry indications are at 580 USD/MT at processing unit DAP condition. As we well know, coupled support for soybean farmers is added to this level, granted only if the commodity is sold to local processors. In this case, the calculations indicate a potential of around 50-70 USD/MT in addition to the price received on the physical commodity. But this top-up is obtained after some documentation and certificates.
GLOBAL STATUS
US already sees the new soybean crop on the horizon, and the zig-zag of the CBOT stock exchange that we have observed in recent days expresses exactly this. It is the weather that has generated the steep drops associated with the climbs.
Of course, the imminent expiration of the SEP22 indication also caused this very large YO-YO behavior. Let’s not forget that the funds have other collateral financing costs and don’t forget this for a moment. By and large, the US crop is showing up under the right auspices.
Sales are not spectacular. Brazil is in the headlines at the moment
BRAZIL and ARGENTINA are out of season, but future volume forecasts point to a still gigantic crop in Brazil of 149 million tons.
But CHINA is about to cause trouble. Consumption was reduced due to the real estate crisis and the reduction of the population’s access to money. Effectively, the banks are no longer returning the population’s savings and many companies have not paid their employees in full since April 2022.
China has already reduced consumption and we see soybean imports falling to 91 million tons this season. And also the logistics cost to this destination has decreased. Declining imports and consumption are the main cause. If China falls economically, the whole world will suffer.
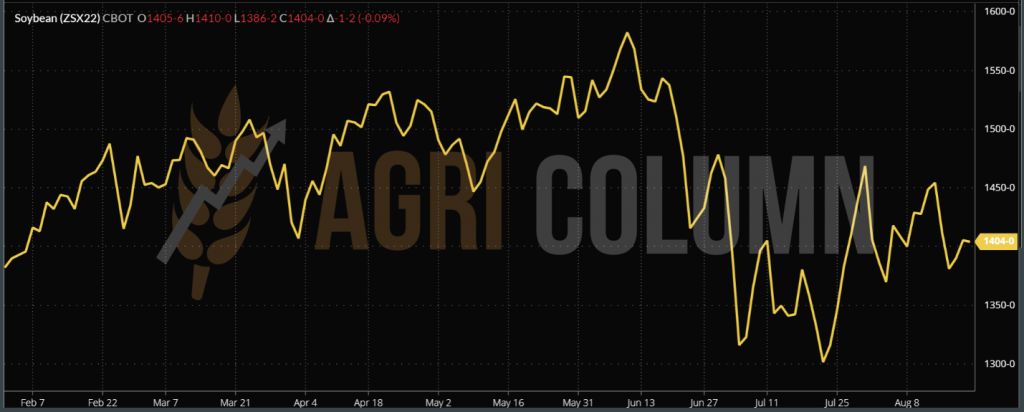
CBOT ZSX22 NOV22 – 1,404 c/bu
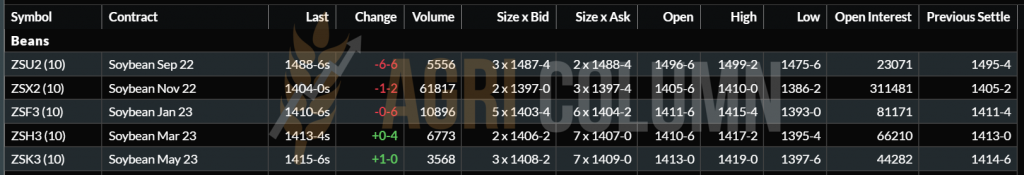
CBOT SOY TREND CHART – ZSX22 NOV22

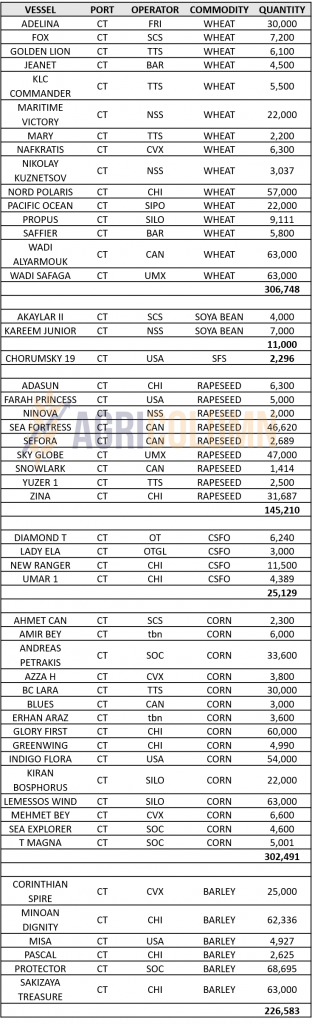
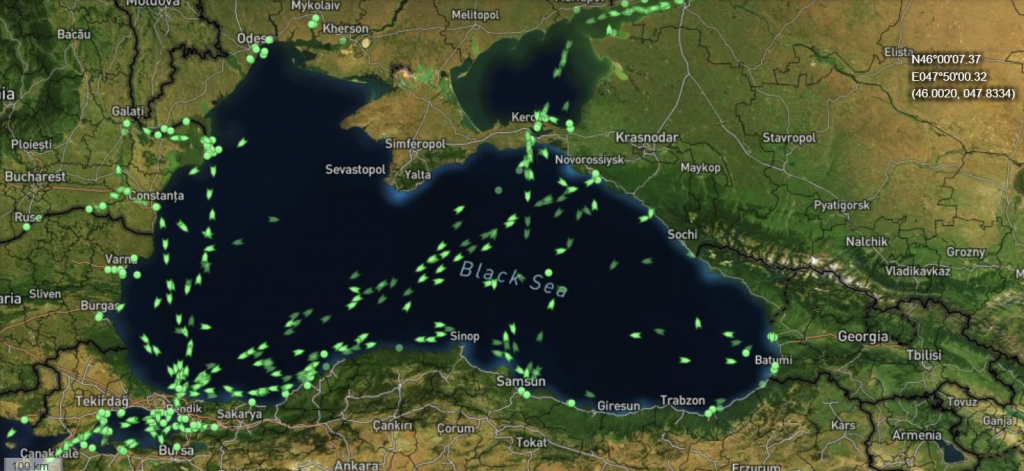
BLACK SEA TRAFFIC
According to Marine Traffic, very intense activity is observed in the Black Sea basin. We have a very large number of ships that leave the Bosphorus strait and have as their destination the port of Constanța.
And across, we see the almost uninterrupted line of Russian coasters and handys coming down from Rostov-on-Don, on one side. We see ships passing through the Kerchi Strait, as well as sustained activity from Novorossisk, which forms the almost uninterrupted flow through the Black Sea, bound for the Bosphorus and Turkey.
In the three Ukrainian ports designated for the Black Sea corridor there is a small number of ships, very few, we could say, but we note that many of these ships belong to Turkey.

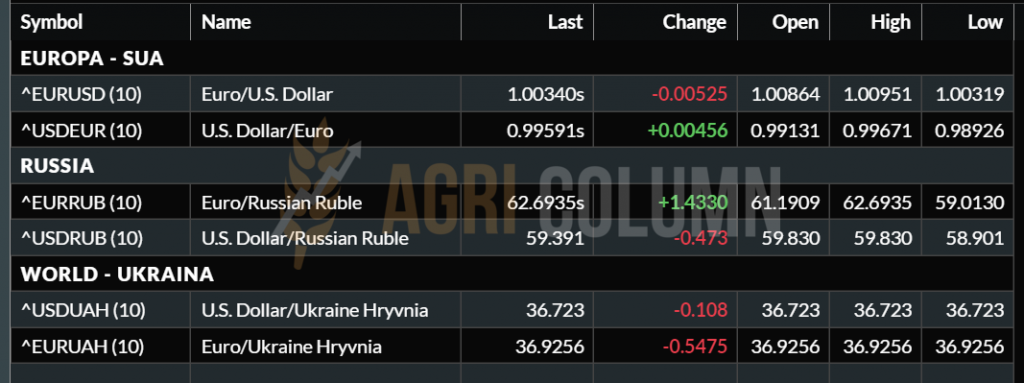
EURO/USD – 1:1.003 (Equal, we could say)

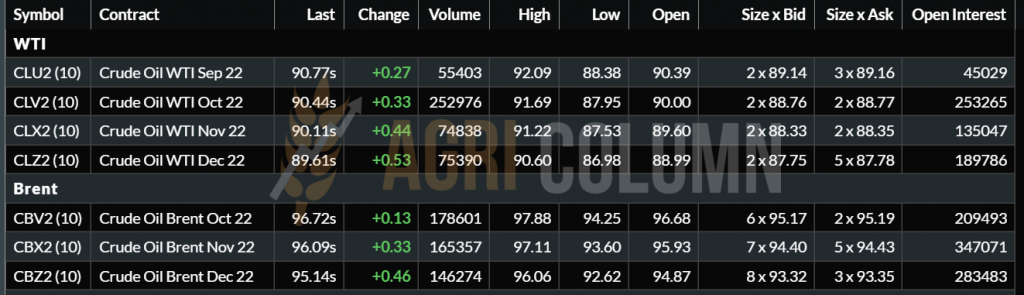
WTI 90.77 USD | BRENT 96.72 USD

20-27 August 2022
Romania
Europe
Ukraine
Russia
Canada
USA
Brazil
Argentina
China
Australia