This week’s market report provides information on:

LOCAL STATUS
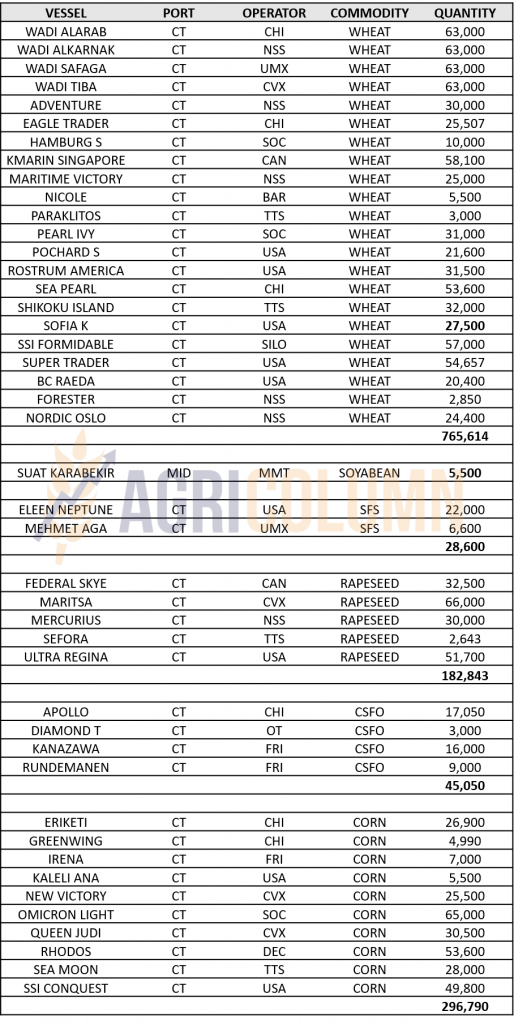
The indications of the port of Constanța for milling wheat rose to the price of 350-352 EUR/MT in CPT parity. Feed wheat indications remain unchanged, with a discount of 20 EUR/MT, i.e. 330-332 EUR/MT.
The local market is starting to be competitive and we are seeing price levels of 350-352 EUR/MT for goods delivered to processors. The millers’ associations face a retention practiced by the farmers. In other words, farmers, due to the degradation of the corn and sunflower crop, choose to keep the wheat so that they can generate higher levels of profit through a higher price in the coming months.
ANRS (National Agency of State Reserves) has launched a tender expiring on August 9, 2022, in an attempt to attract 45,000 tons of wheat. From the discussions with the farmers, it appears that the price they want can reach 400 EUR/MT. There is an extremely large difference, however, between desire and the physical market.
CAUSES AND EFFECTS
At the national level, the volume of harvested wheat is sufficient to cover consumption and generate a maximum volume of 4.5-5.2 million tons for export. We also have an unexported backlog from last season which, paired with this season’s volume for export, could generate a competitive value.
But today is not a time when farmers could be satisfied with the price level. We have a level difference today from a few months ago and it is not tempting, at least for now.
But let’s also remember the level values in the pre-war GASCs which generated levels of 346 USD/MT C&F with a posted freight cost of 25 USD/MT. Added to this are the brakes generated by the FED and the European Central Bank. Let’s remember 2012. The scenario is plausible to repeat itself, and this will be largely due to the effects of Federal Reserves, which thus counteract the effects of galloping inflation.
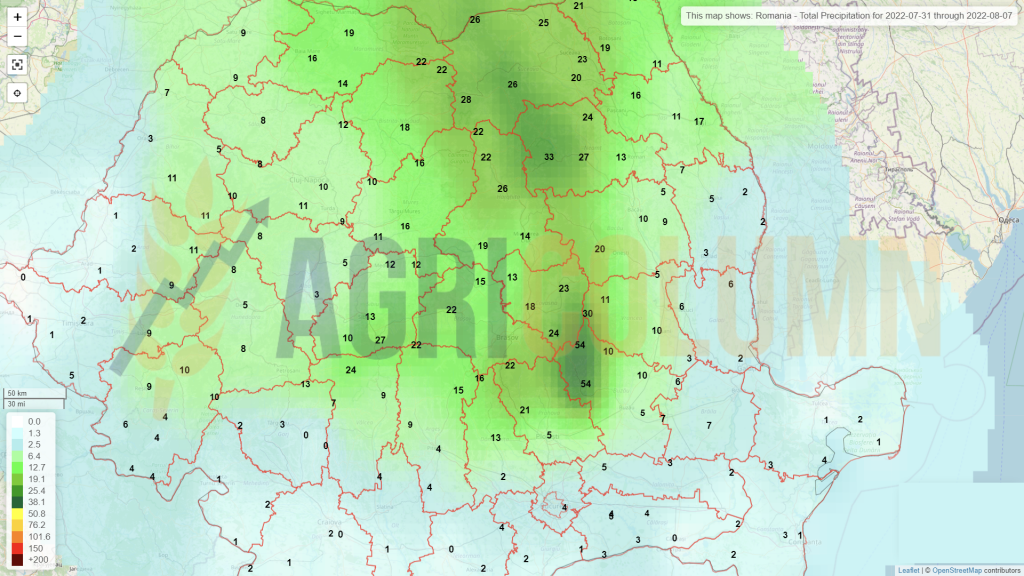
And we see new obstacles on the horizon. This autumn’s sowing season will be extended until after mid-November. Lack of rainfall will push wheat sowing late into the fall, with consequences for next year’s productivity, given the potential for uneven emergence or non-emergence if water does not arrive on time.
REGIONAL STATUS
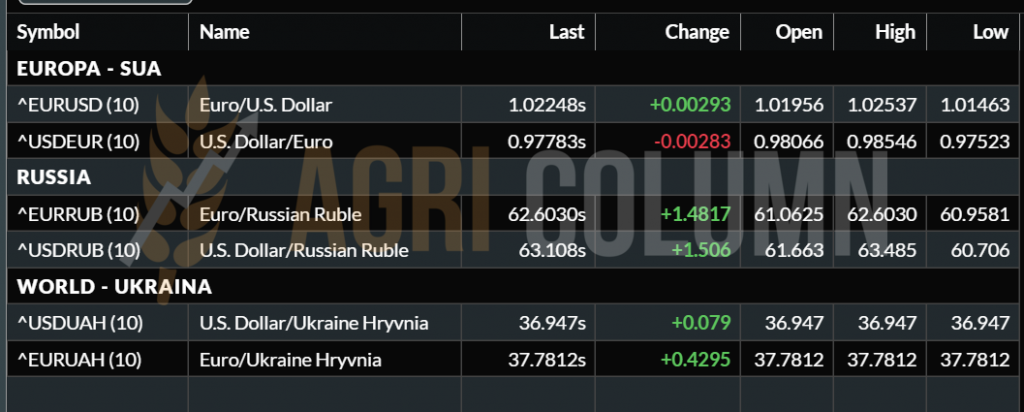
RUSSIA is starting to move in terms of exports and July puts them at around 3 million tons. August is a decisive month for Russian wheat. Their ambition to export 5 million tons is well known.
And we note the movement of goods led by Lavrov ‘s diplomacy, which is on tour precisely in the developing countries that are in great need of wheat: Egypt, Uganda, Ethiopia, Congo.
Russia, through Andrei Rudenko, Sergei Lavrov ‘s deputy, used an imperative tone and demanded that what was negotiated be implemented immediately. And here we are talking about the lifting of sanctions on Russian ships and the lifting of the restriction on the trade in fertilizers. It is a very clear signal of Russia’s impatience, indicating the internal pressure it is under. The Russian working front is pointing to a crop of 84 mil. tons according to RussGrainUnion (the association of Russian traders, i.e. multinationals), compared to SovEcon’s 92.6 mil. tons, a level that is overflowing with excitement at the moment.
We do not judge the figures indicated, nor their provenance, but only the fact that Russia must sell a lot of wheat. The start of the new season has already developed a volume of almost 3 million tons, but the pace must be increased a lot, considering the export levels it generates (42 million tons according to RussGrainUnion and 50 million tons according to SovEcon).
UKRAINE positions its loaded ships for convoy alignment. Between 10 and 17 ships are ready to be shipped. However, many signals point to delays that will occur throughout this process. First, demining operations will require time and a great deal of accuracy. No one wants to risk a stray mine becoming a destabilizing factor with financial repercussions.
Captive ships in port, for they are no longer crewed. And it makes sense. The crews were repatriated due to the risk of bombing and the associated costs of keeping them in position.
Also, the operating personnel in the ports of Odessa, Yuhznyi and Chornomorsk (Odessa’s satellite) no longer exist. The logic of things made these people retreat to their homes because of the constant danger and lack of activity.
Only one ship out of the three existing in Chornomorsk, (2 bulk carrier and a crude oil tanker) began to move into the harbor estuary, but that was about it. A convoy is not easily built, especially one that needs to be secured until it leaves Ukrainian territorial waters. Apart from demining, there is a positioning outside the harbor estuaries, and then a short march to the rendezvous point with the Russian-Turkish escort. However, we have a lot of Ukrainian marketing, which presents things in an imminent way, that is, in the sense that everything is ready and leaving. We’re only getting chatter from the Marine Traffic website, which indicates a tanker moving in the Chornomorsk estuary, but not going out at the moment.
There are many signals appearing on news feeds and we repeat them here to understand the importance of information today. Even though it is presented nicely packaged and neutral, its direction and notes are completely different. For example, we are told that India will receive a Ukrainian oil tanker. The first suspicions naturally go to that tanker in the Chornomorsk estuary. But at what price? Is the cargo stored in the tanker still good for human consumption considering the extremely long storage period between 24 February 2022 and say 1 August 2022?
We immediately link this information with another from Egypt, which claims that they will send an inspector to test the cargo on board the ships. This information practically invites us in two directions. The first is the one where we talk about the quality of the products on board the ships and it is directly related to the oil information. The second is an indication given to wheat traders at the level of the European Union and the Black Sea basin, by which they are warned to reduce the price of wheat, because they have the Ukrainian option.
As for domestic Ukrainian flows, we see a kind of brake, as everyone is waiting for the three ports to move in a positive direction. Thus, the levels at which they will sell their commodities will increase from what they are today, which is 100-110 USD/MT ex-Farm. The same is true for corn, barley, and sunflower seeds that can regain their added value through processing, if the export route is open. Let’s not forget that Chornomorsk specializes in crude oil exports, and the consequences will be nothing but positive.
But at this moment, we have no signals about the movement of any convoy of ships from Ukrainian ports. We will observe and analyze the phenomenon closely.
The EUROPEAN UNION sold an extremely large amount of wheat, especially of French origin, which has happened extremely rarely in recent years. This move to sell something they don’t have, and we are referring to the merchants operating in France, raises deep questions for us. Why are they in a hurry? Why were they in such a hurry, taking into account that at the European level, the wheat crop was thinned by 5 million tons for milling wheat?
EURONEXT is performing the same YO-YO movement that we anticipated and will last until after the WASDE report on August 12, 2022.
EURONEXT – MLU22 SEP22 –343 EUR (+1.75 EUR)
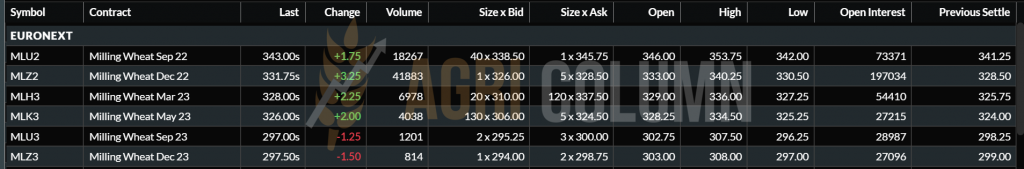
EURONEXT TREND CHART – MLU22 SEP22
GLOBAL STATUS
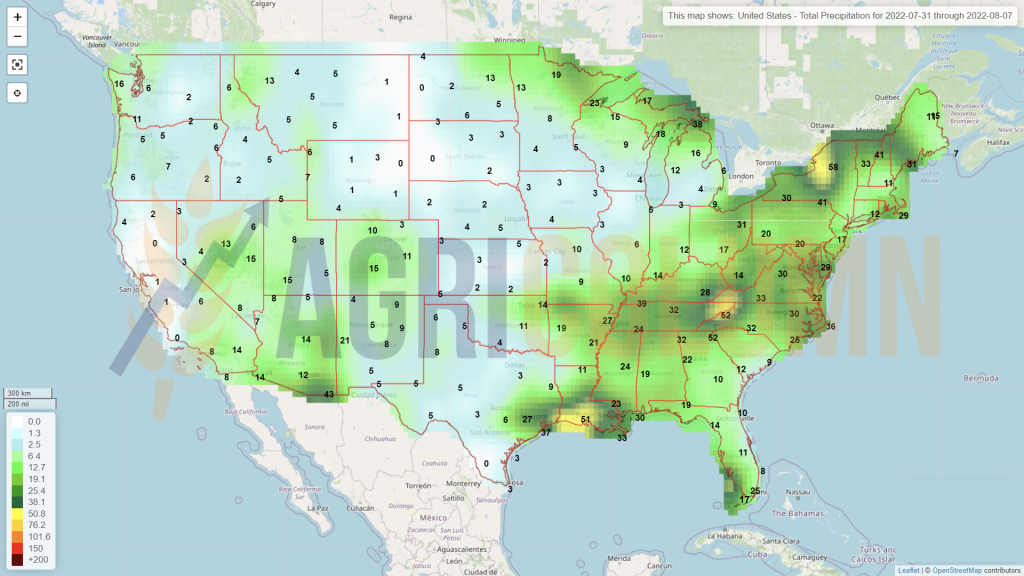
The USA indicates the same volume of 48 million tons of wheat. Falling precipitation helped spring wheat recover from lower winter wheat volume. But let’s not forget that August is coming, which is defining for American wheat and corn.
CANADA shows no change, showing the same figures of 34 million tons volume.
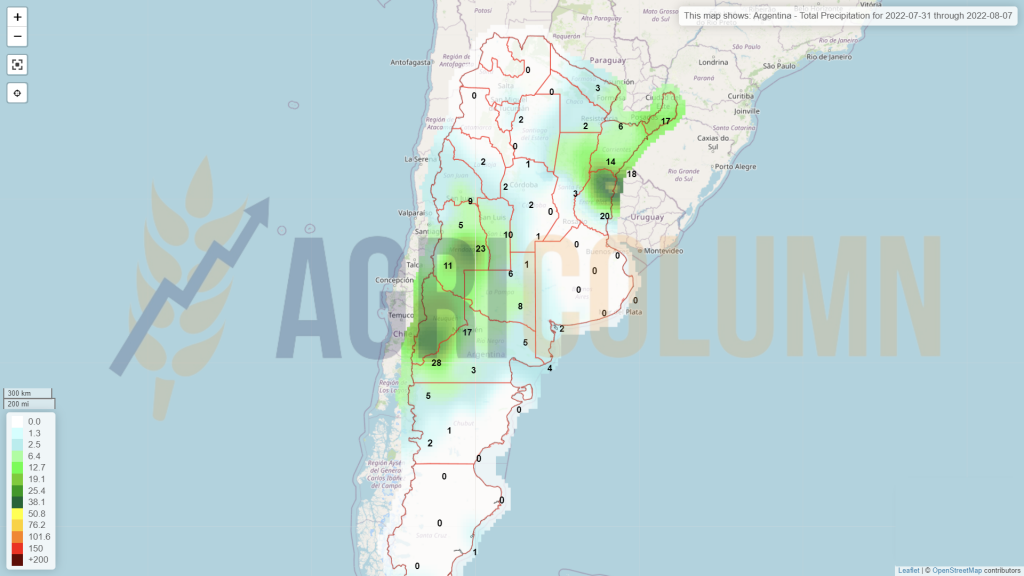
ARGENTINA does not indicate any improvement in the sowing process and we may account for a maximum of 6 million hectares planted with wheat in this country, starting from an initial estimate of 6.5 million ha and passing successively through 6.3 and 6.1 million hectares respectively.
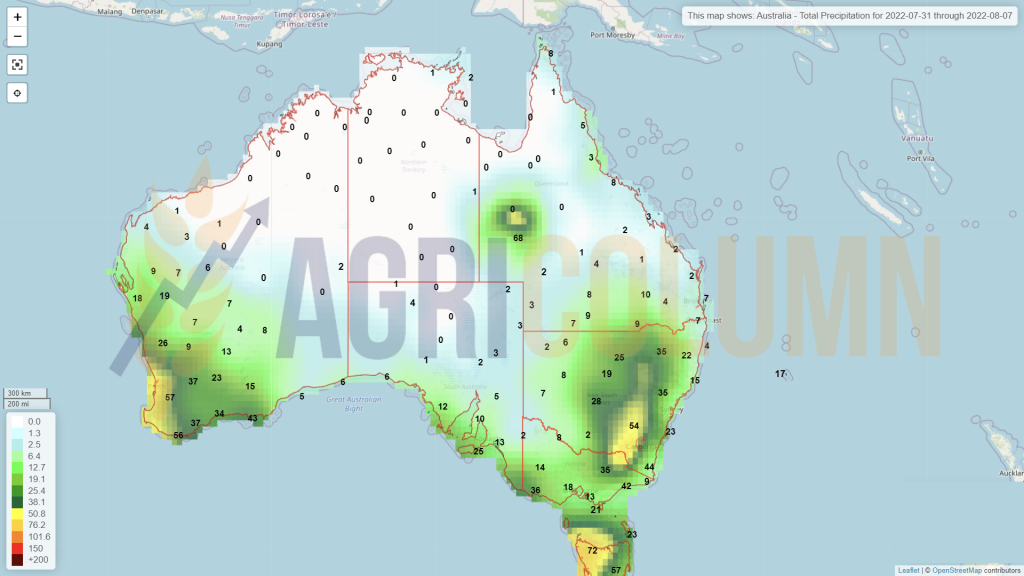
AUSTRALIA reduces the forecast to 31.6 million tons for this season. It is still an extremely good estimate compared to their multi-year average of 28-29 million tons, but not as good as last season’s volume of 35.5 million tons.
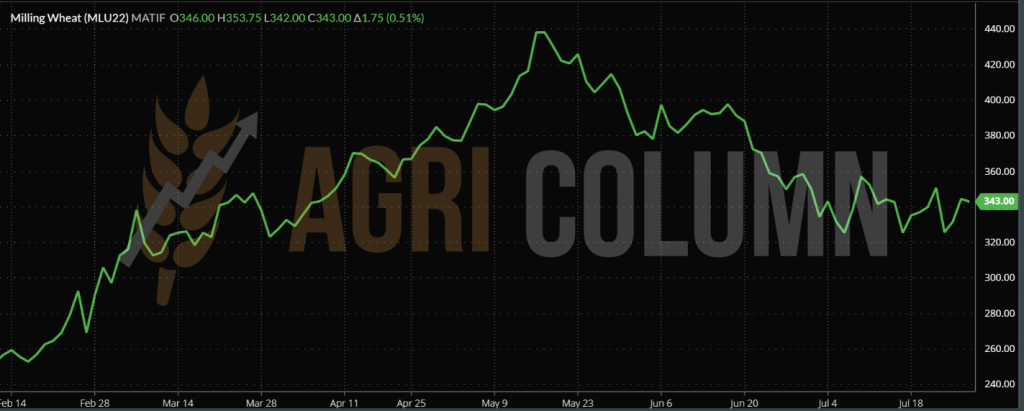
CBOT is playing the same YO-YO game as Euronext, swinging between waiting for FED effects and the WASDE report on August 12, 2022.
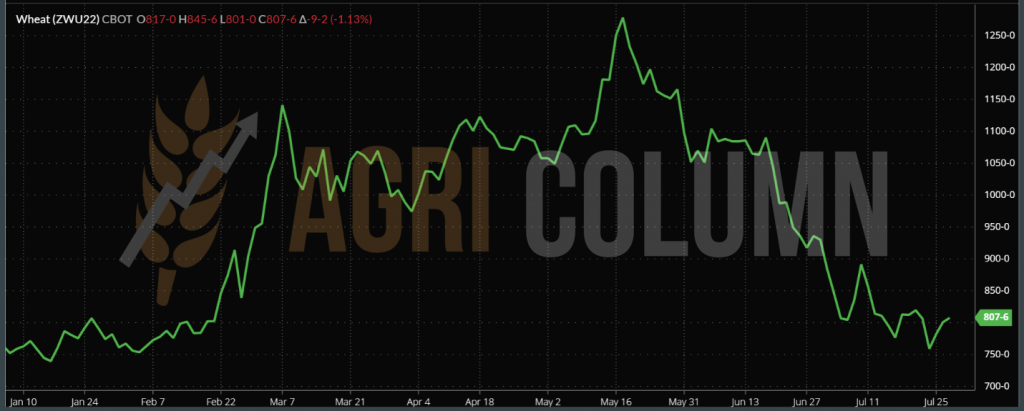
CBOT WHEAT ZWU22 SEP22 – 807 c/bu (-9 c/bu = -3.3 USD)
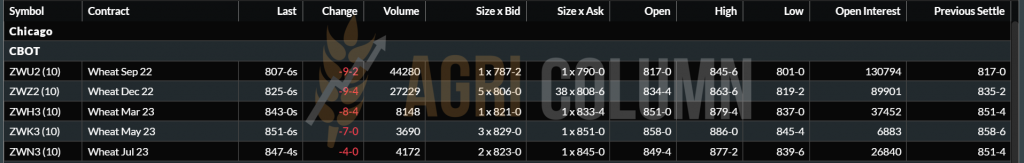
The CBOT sees trading at a lower level than it was at the start of the Russian invasion.
CBOT WHEAT TREND CHART – ZWU22 SEP22
TENDERS
MIT JORDANIA, wheat tender no. 50.2022.42 (second time). Cargill sold a batch of 60,000 tons of wheat at 405.75 USD/MT C&F Aqaba for delivery SH December 2022. Other bids were submitted by: Viterra (422.99 USD/MT), Ameropa (430.49 USD/MT), CHS (413 USD/MT).
GASC EGYPT has canceled 4 batches of 60,000 tons from Ukraine, which could not be shipped in the months of February-March 2022. It is not the least bit wrong, but only a write-off from the positions, because that cargo will no longer be able to be delivered. Inerco and Nibulon were sellers at 346-360 USD/MT CIF Egypt.
CAUSES AND EFFECTS
RUSSIA wants two things: to sell a lot and sell expensively. They are the parameters to which they refer. The fact that they signed an agreement with the UN means that they negotiated their way out of Azov by ship. Kavkaz, Novorossysik, Tuapse, Taman are the exponential ports of Russia and they want panamax for loading. We repeat that Russia had no restrictions on the export of grains, but only on their circulation, as well as on the SWIFT payment system. Russia’s wishes, however, will be hit by a counterweight generated by the very volume it displays, which will keep the price at a lower level. The Russian commodity is offered at 360 USD/MT FOB, which translated into EUR, indicates a level of 352 EUR/MT.
UKRAINE wants to sell the goods under the agreement which will last 120 days. But preparations take time and time runs out relentlessly. Everywhere comes an extra cost of insurance, a war premium that shipowners must pay if they engage their ships in the Black Sea. And this cost varies according to the value of the Ship. If before the conflict it was 0.025% of the value of the vessel, today we have an indication of 5%. In a simple calculation, generating a cost level of 100 million USD for a Panamax, we get 5 million USD divided by tonnage, i.e. 63,000 tons. And the final price per ton of the insurance premium is about 80 USD/MT. It is a huge cost, but it is the price for goods to be able to leave Ukraine by sea.
WASDE will generate the report on August 12 that will show us the harvest volumes in the Northern Hemisphere. It is one of the important reports that clearly shows us a direction of wheat price. But physical fundamentals may be deterred by the FED raising interest rates. I invite you to observe the indication SEP22 vs. SEP23 in Euronext and you will see a negative difference of 46 EUR.
In the following days, we will see the effects of the FED, if they materialize, better said. After the meetings and the increase on June 15, the effects were seen after three working days. And let’s not forget that the US went into recession. Usually, the effects cross the ocean in a few months, 4-6 months. In other words, it’s a knife-edge wait. Will farmers who don’t want to sell gain at today’s levels or will your market be marked by the FED and Russian volumes? The overwhelming feeling is that 70% of the scenario leads to price stagnation, if not downright degradation between August 15-September 15, 2022.
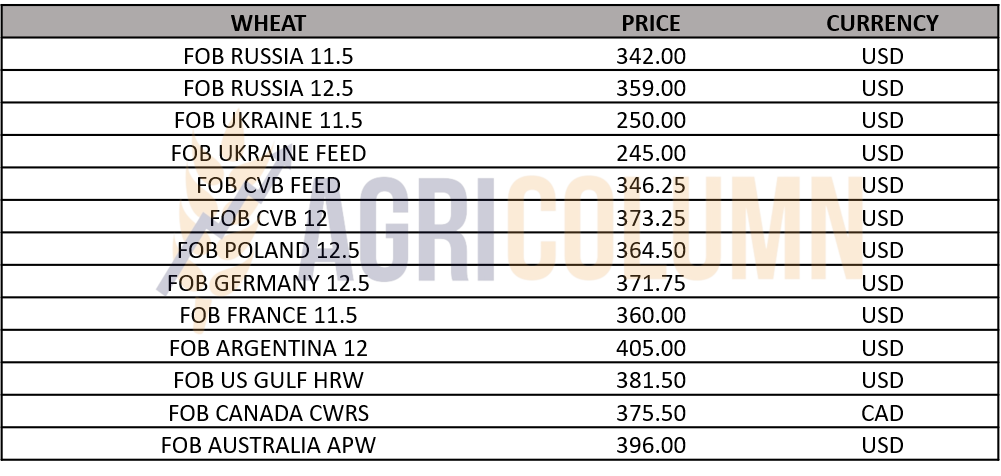
WHEAT PRICE INDICATIONS IN MAIN ORIGINS

LOCAL STATUS
The indications of the port of Constanța for feed barley are between 295-300 EUR/MT. However, very high transaction values are not seen in this context of ending the wheat harvest and waiting for the sunflower harvest. Farmers are on a well-deserved break after the first part of the harvest season.
REGIONAL GLOBAL
Here too, we do not record transactions that arouse interest, only attempts, so to speak, generated by the Jordanian state, but not finalized for the moment.
CAUSES AND EFFECTS
Barley is subject to a trading algorithm and it is being followed. The SEP22 Wheat Euronext indication is taken as the main parameter and discounted by 40 EUR to find out the feed barley price. In Constanta as in Rouen, the price is identical – 300 EUR/MT, so a minus of 43 EUR/MT compared to the SEP22 wheat indication. We will be closely monitoring feed wheat price developments and pricing in the near future.

LOCAL STATUS
The price indications generated by the port of Constanța still remain at the level of 300 EUR/MT. Although the stock market indications have increased, the prices offered do not exceed the level expressed above. It is, if you will, the effect of the Ukrainian cargo flow pressure on our area. Maize has the highest trading share among all goods of Ukrainian origin, and this aspect is highlighted by the price level at which maize remains.
At the local level, absolutely nothing can be done. The rains that came in the form of storms in the last 24 hours can no longer influence anything in terms of volume. We will generate 8.5 million tons of corn indulgently and this is in contradiction with the price offered for the new harvest in the port of Constanța. The Euronext NOV22 indication is today at the level of 328 EUR and matrixically we must have a ratio of NOV22 minus 10 EUR in Constanța. This does not happen and the difference we see from the working matrix is minus 28 EUR. And this in a year in which the drought generated the disappearance of 40% of the potential of Romanian corn.
Moreover, due to the drought, we will harvest extremely quickly and do not be surprised if on September 15, 2022 we will have the harvest completed. The volume being very small, it will be extracted very quickly from the plains.
CAUSES AND EFFECTS
The Ukrainian flow of goods is the main source of reasons that keep the price of Romanian corn very low. Ukrainian goods come at a discount, they are old stock bought at pre-conflict prices and thus, the pressure generates a price difference compared to the premises of a market regulated by the stock exchange.
Unfortunately, we do not see any control and reversal parameters on the horizon at the moment, other than the one that will generate very low production in the European Union as well. But this aspect will be counterbalanced by the Ukrainian cargo of the 2021 harvest and their 2022 harvest. This cargo has absolutely no tariff or phytosanitary barriers and can enter through any place in the Union, feeding the processors. Thus, this picture will generate the same price pressure and the losers will be only the European farmers, who have high set-up costs compared to the Ukrainian farmers, and everywhere comes the doubling of the logistics cost, which will make the price fall even more in the origin of the FCA Farm Romania.
REGIONAL STATUS
UKRAINE sees absolutely no problem at the moment. Their crop seems to generate a volume of 25 million tons, to which, if we add what they have not been able to ship since the beginning of the war, the export volume indication will be a very positive one. But there is still a long way to go. The export agreement through the three ports will last only 120 days, of which 10 days have already passed. Meanwhile, cross-border, land and rail exports have further decreased, as volumes are large and can only be achieved by sea, which may bring a better price level to Ukraine, but will maintain the regional price at lower rates.
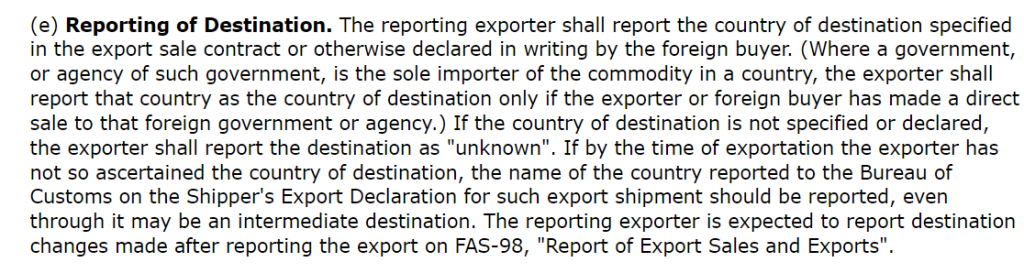
HUNGARY sees, just like Romania, how the corn crop melts. Out of a forecast of 7 million tons, 4 million tons seems like a happy case today. In the meantime, Hungary received the notice of infringement of Community law, as follows below. We do not wish to comment on this, but the fact that Hungary wants to monitor its ratio between export and domestic consumption indicates nothing more than a special attention to food safety at the national level, which is under the authority of the Hungarian state. Also in support of each state of the Union we insert the USDA link, which oversees exports and their destination before they are made: https://apps.fas.usda.gov/export-sales/fedregs.asp .
On July 15, the European Commission decided to open an infringement procedure against Hungary “INFRINGEMENT PROCEDURE (INFR (2022)2066)” regarding a scheme for prior notification of grain exports, introduced by the Hungarian authorities. The prior notification allows the authorities to anticipate the sale or purchase of the grain to be exported, before the export takes place. The Commission considers that the measure is incompatible with EU rules on the common organization of markets and common rules for exports. According to the Commission, the Hungarian measure cannot be justified by the pursuit at national level of special economic objectives to be achieved at Union level and, in any case, no action is currently required to pursue the security of grain supply within the EU. Hungary now has two months to respond to the Commission. In otherwise, the Commission may decide to send Hungary a reasoned opinion.
FRANCE receives an extremely low volume estimate for the corn crop. It will generate somewhere around 10.5 million tons, placing it in the same European context of severe drought.
The EUROPEAN UNION will eventually reach a maximum volume of 55 million tons, this in a happy case. Things can still deteriorate regionally. And we started from a level of 68 million tons as an initial estimate, if not 72 million tons.
EU imports were expected to be between 15-18 million tons for the 2022-2023 season, but now the main lifeline will come from Ukrainian cargo, which will be sold at a lower price to meet European processing demand. Another resource for the Iberian Peninsula, known as a processor in the meat industry, would be the US origin, which has a logistics cost of 22-23 USD/MT on the US Gulf – Iberia relationship.
EURONEXT narrows the gap between wheat and corn. 343 EUR SEP22 WHEAT –328 EUR NOV22 CORN. We have only 15 EUR difference, after 2 months ago, we had 40-45 EUR. Has the wheat decreased or the corn increased? Both factors have contributed to this state of affairs today. Will we end up in the 2020 scenario when corn was more expensive than wheat? Everything is possible.
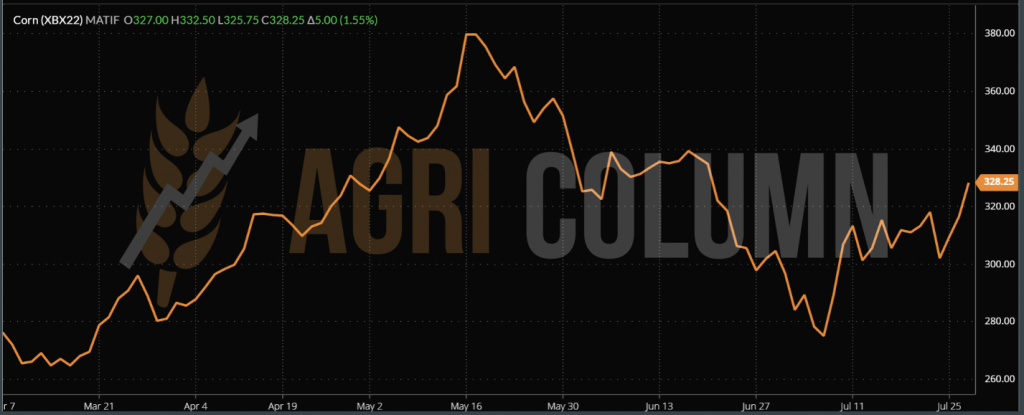
EURONEXT XBX22 NOV22 – 328.25 EUR (+5 EUR)
CORN TREND CHART – XBX22 NOV22
GLOBAL STATUS
The US still indicates, and we emphasize again, a positive harvest volume quoted at 373 million tons. With ups and downs in the Corn Belt, Americans are looking forward to a defining August for the problems it creates. Heat waves and lack of precipitation may have adverse effects on North American volume. On the trade side, the US continues its own policies. Volumes are within the range of initial estimates.
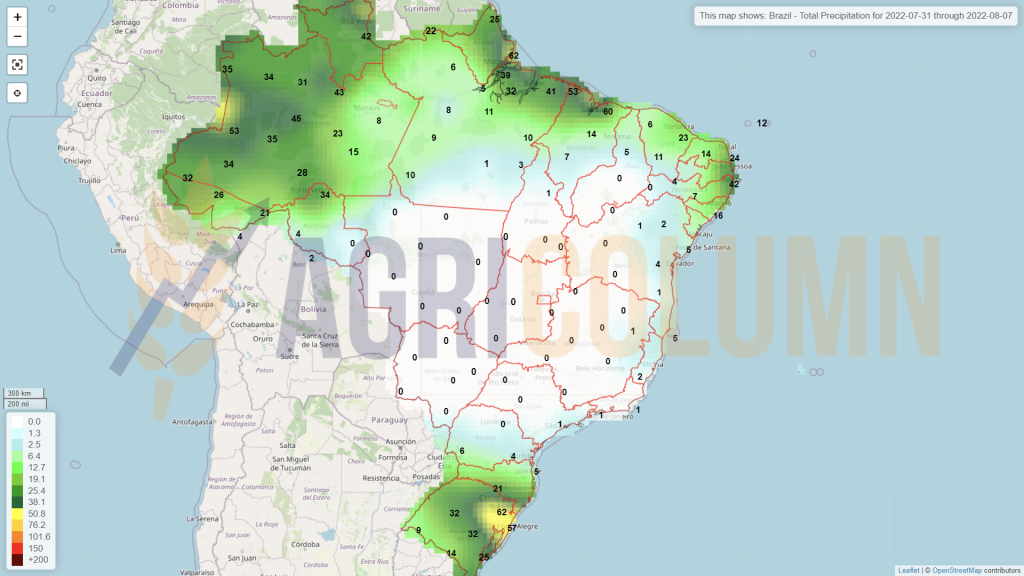
BRAZIL is generating very high corn sales in this final Safrinha harvest period. In the Parana region, however, they do not have particularly large productions as in Mato Grosso. Brazil therefore remains at the indicator of 118 million tons Safra + Safrinha aggregate production and the future crop estimate remains the same at 126 million tons for now.
ARGENTINA is off-season at the moment, so no volume changes, at least until WASDE August 2022.
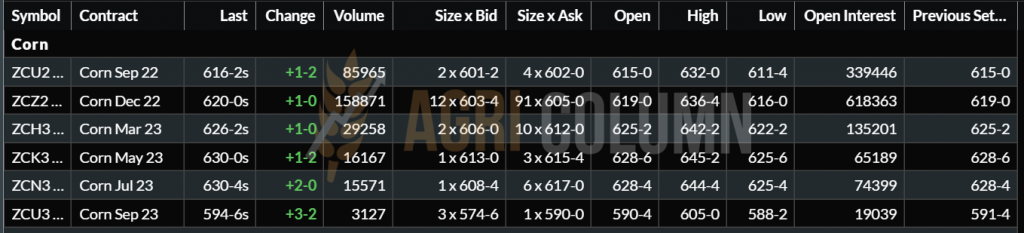
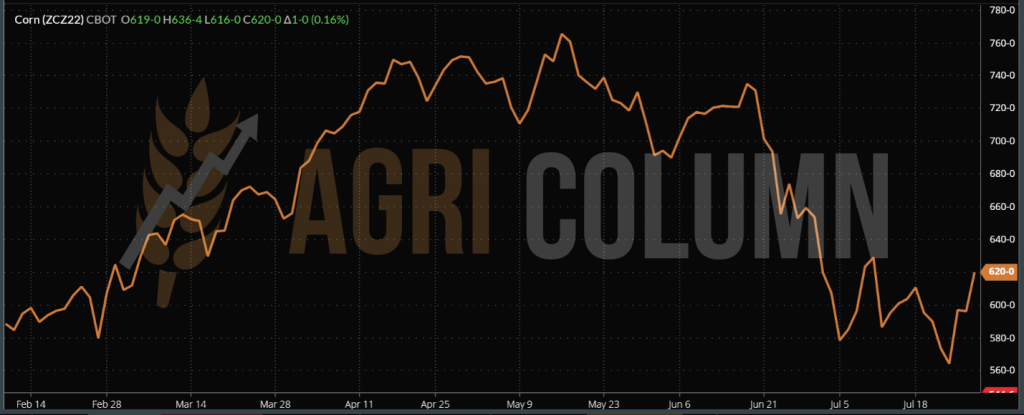
CBOT ZCZ22 DEC22 – 620 c/bu (+1 c/bu)
CBOT CORN TREND CHART – ZCZ22 DEC22
CAUSES AND EFFECTS
It is an extremely complicated season for all categories of goods. Maize is no exception and we effectively have an extremely complex mix between the 4 areas of origin:
- Ukraine is looking good in terms of volumes and will put pressure on European corn prices.
- The European Union has a big drought problem, which is naturally reflected in volumes, but hope remains in cheap goods from Ukraine.
- The US will go through August 2022, a month that will cause problems for the corn crop and implicitly the volumes.
- South America is still preparing to enter the scene. For now, the latter sells the crop of the current season. The moment of entry into the game is still far away.
However, one thing is clear and without doubt – the volumes of corn in the European Union are drastically penalized by the drought, and the Union’s needs will be doubled in this context. Where from? From the two actors, one from the east and the other from the west, across the ocean. Will we have a balance globally in terms of production versus consumption? A balance in terms of trade versus stocks? Of course not. Demand is high and production is not what it was in estimates a month ago. Trade will increase as drought-affected areas generate demand, and stocks may dwindle due to industrial, feed and human consumption.
Maize has multiple uses, and this wide range of uses generates stability in terms of global demand and price.
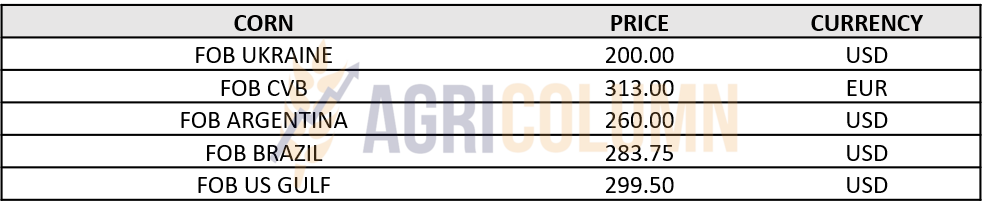
CORN INDICATIONS IN MAIN ORIGINS

LOCAL STATUS
The indications of the port of Constanța are getting the long-awaited consistency. Many European traders are short, meaning they sold what they didn’t have, and the support generated in the VEGOIL complex associated with an additional 5 USD in oil is sending shivers down the spines of exporters. NOV22 quotes receive a positive premium of 7-12 EUR/MT in the parity of CPT Constanța.
At the level of processors, prices remain at the same negative discount compared to the NOV22 indication, of around 20-30 EUR/MT, which is a clear sign of sufficient supply until the resumption of rapeseed processing.
Romanian farmers are holding rapeseed in warehouses, a fact generated by the forecasts of a very poor harvest volume for spring crops and the fact that the price of rapeseed has dropped a lot compared to the values of May, when quotations were positioned above the level of 820 EUR/MT, with a peak of 866 EUR/MT.
Moreover, the negative premium differences between the processors and the export market being very large, the farmers preferred to keep a large part of the canola. The phenomenon was also amplified by the blockage of the Constanța port, aggregated with the doubling of the logistics cost, which effectively cut off the price potential that could be obtained in the port.
REGIONAL STATUS
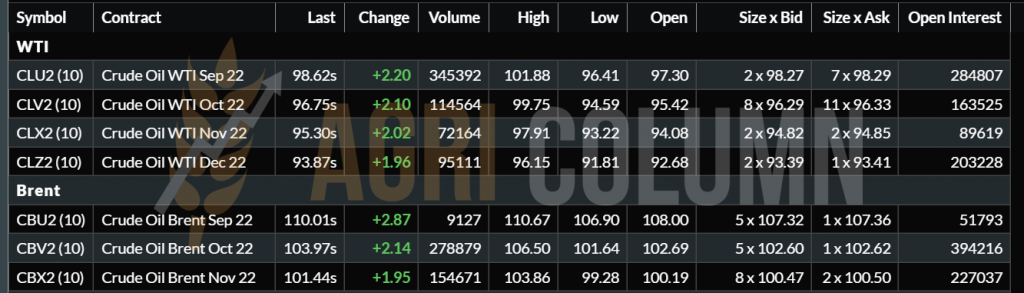
Rapeseed harvesting has also ended in the European Union, and the average volume generated is 17.8 million tons, almost in line with the estimates generated by us. The technical push on EURONEXT is generated by the support in the vegetable oil complex, associated with the technical increase in Brent oil.
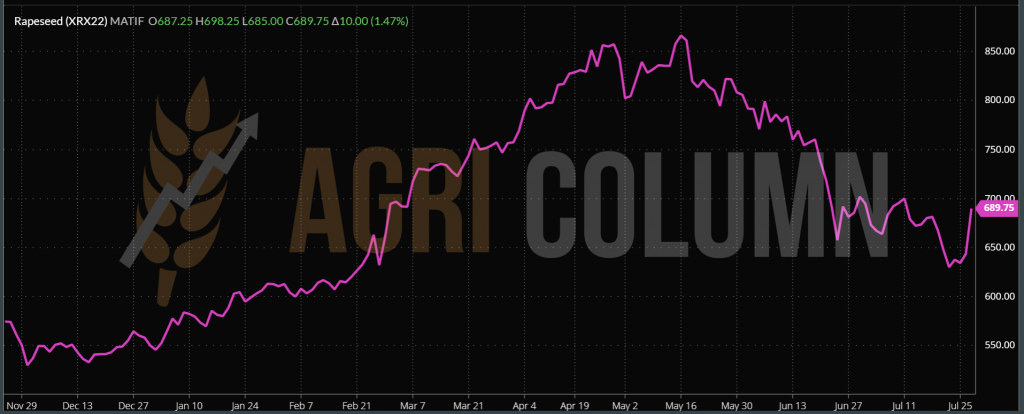
EURONEXT XRX22 NOV22 – 689.75 EUR (+10 EUR)
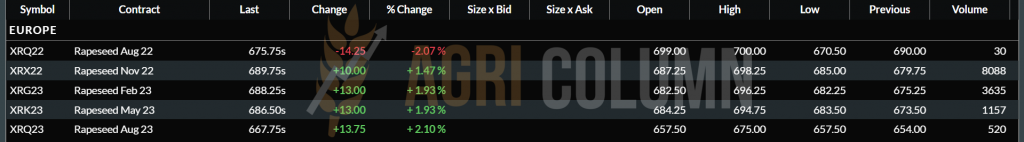
EURONEXT TREND CHART – RPS XRX22 NOV22
CANOLA CANADA
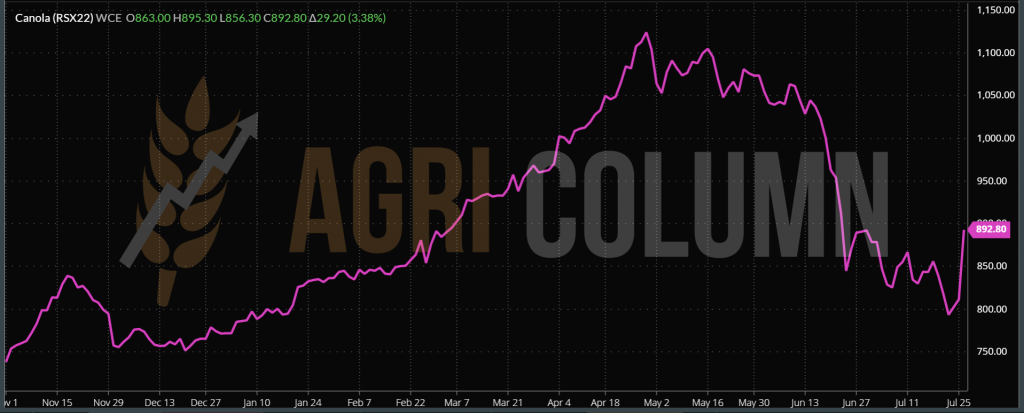
ICE CANOLA RSX22 NOV22 – 892.5 CAD (+29.2 CAD)
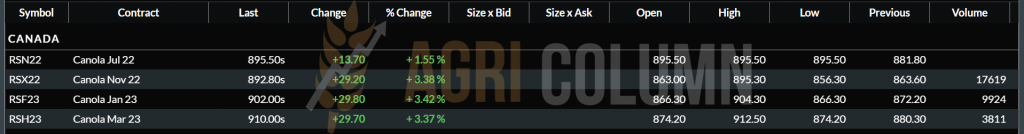
CANOLA TREND CHART RSX22 NOV22
COMPARATIVE CHART EURONEXT RAPESEED VS ICE CANOLA – HEAD TO HEAD
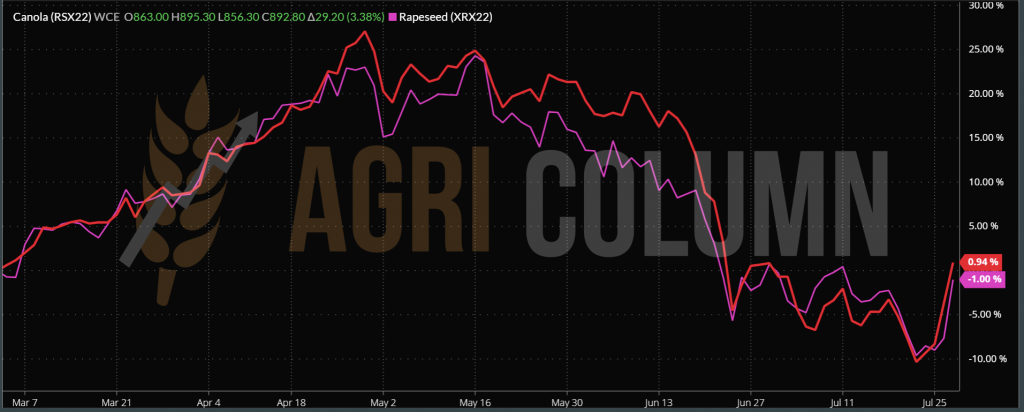
CAUSES AND EFFECTS
The boost received by rapeseed is supported by the VEGOIL complex. In the complex, soybeans contributed to the growth of canola. Doubts about the US MID WEST region regarding the soybean crop caused indications of the latter to rise, dragging along canola and palm oil, while palm oil found support, rising again to a level of over 4100 MYR on the Malaysian Stock Exchange.
Oil prices that gained in Brent around 5 USD/barrel due to Russian pressures on gas supply were also an additional growth factor, helping rapeseed in this growth context. It could be fireworks and that’s all, but let’s not forget that the level had dropped quite steeply and did not correlate with the market in profile.
Canola still has room for price development globally. We know that the months of October-November are a good support for the price of rapeseed.

LOCAL STATUS
As we well anticipated, the seed price is starting to rise and we are seeing the indications gaining more consistency. Today’s level is playing out on two fronts, that of processors in the domestic market (where the price is significantly lower, somewhere around 535-545 USD/MT) and that of exporters (which generates price values of 560-570 USD/MT in CPT Constanța parity).
However, Romanian farmers do not have very big intentions to sell. A much-reduced crop is on the horizon, which does not inspire anyone to make such decisions, primarily because of the working assumption that farmers cannot honor contract quantities and are 100% susceptible to contract penalties up to 40-45% of the value of the undelivered goods. And secondly, demand and supply will bring the price of goods back to other levels.
REGIONAL STATUS
Ukraine will be the first problem at the level of raw material, because if they manage to export crude oil by sea, the flow of raw material that flows through the Romanian border points will be interrupted. The added value of a raw materials is much greater than the desperation to sell anyway, however and at any price to ensure liquidity at the farm level.
The European Union will also be drastically penalized in terms of harvest volume. Today, the data is only exposed with great discretion, indicating a decrease of 700,000 tons. But it is only a corner of the curtain raised. Just as the drought wreaked havoc at the level of Romania, the same thing is happening at the level of the Union and we are also waiting for confirmation from the analysis houses.
Bulgaria is approaching the figure of 600 USD/MT. On Friday, July 29, 2022, the Varna indication stood at 590 USD/MT. Specifically, we believe that 600 USD/MT was already being paid.
CAUSES AND EFFECTS
- The disruption of the flow of raw material from Ukraine will create a lack of volume.
- The European Union will have to revise the volume forecast down due to the drought.
- Argentina will soon start sowing the sunflower crop and the persistent drought could seriously hamper the areas allocated.
- This year’s balance currently indicates a deficit of 5 million tons, from 59 million tons of global production to 54 million tons. But there is still time and space for further degradation, which we predict at another 2 million tons of raw material.
CSFO AND OILSEEDS INDICATIONS IN MAIN ORIGINS
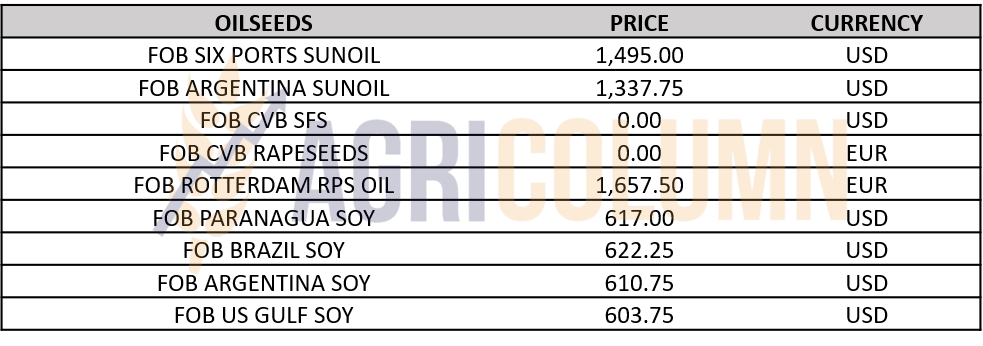

LOCAL STATUS
Romanian soybean production is also under question. Although much of it is irrigated, there are also quite a few unirrigated hectares that will certainly drag down local soybean production. For the moment, however, the price levels are roughly at the same values, the local market not really having time to adjust with the closing of the CBOT.
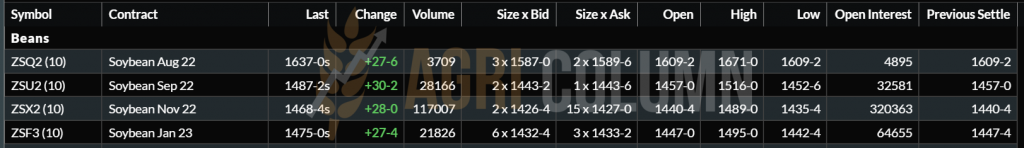
GLOBAL STATUS
The US is having trouble in the Midwest plains and so the negative sentiment is pushing CBOT soybean indications strongly higher. If on July 20 we were at the level of 1,300 c/bu, the closing of July 29 found us at a very high level of 1,468 c/bu, an increase of 168 c/bu or 61.7 USD.
CBOT SOYBEANS ZSX22 NOV22 – 1,468 c/bu (+28 c/bu)
CBOT SOYBEAN TREND CHART – ZSX22 NOV22
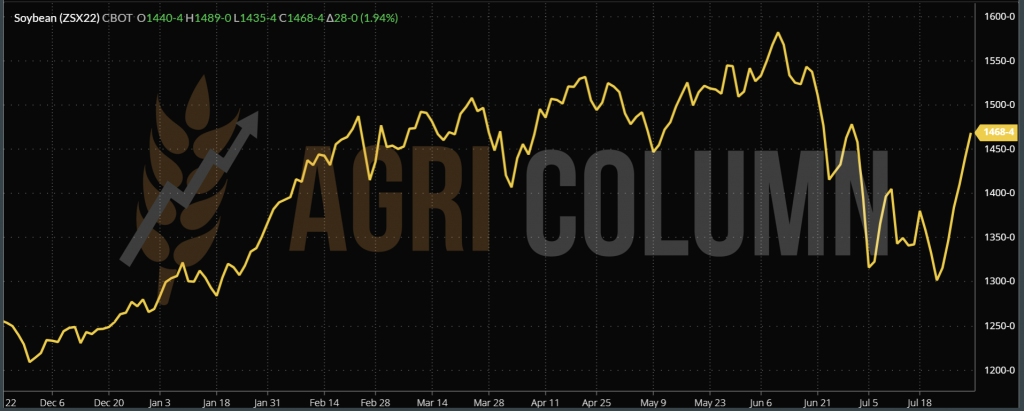
CAUSES AND EFFECTS
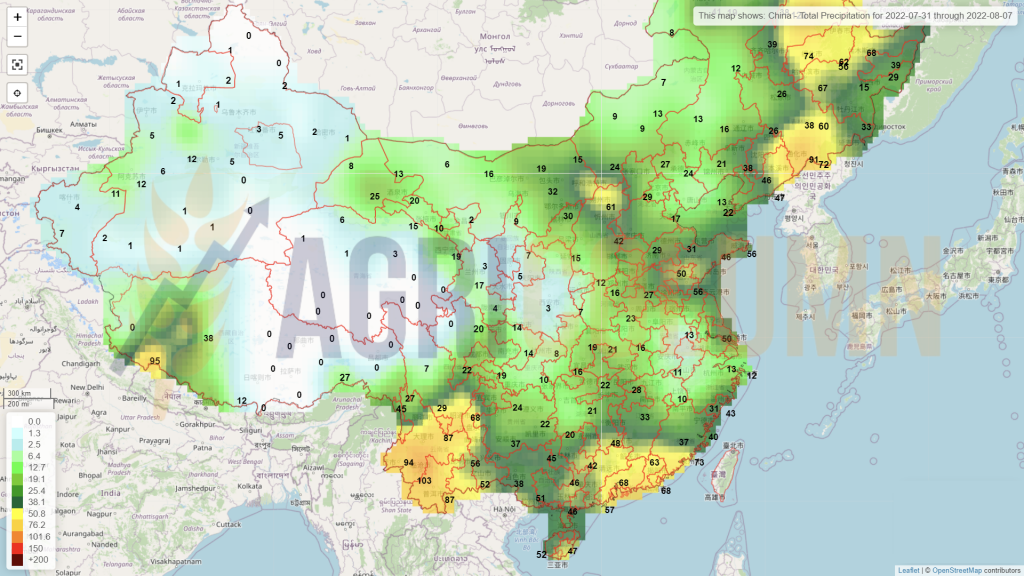
In the case of soybeans, the weather is the main manager that sets the price of this commodity. The weather will guide the course of soybeans, always having China as an adjacent factor, which generates the demand for this raw material. Time will decide the price trajectory based on the weather.


31 July – 7 August 2022
Romania
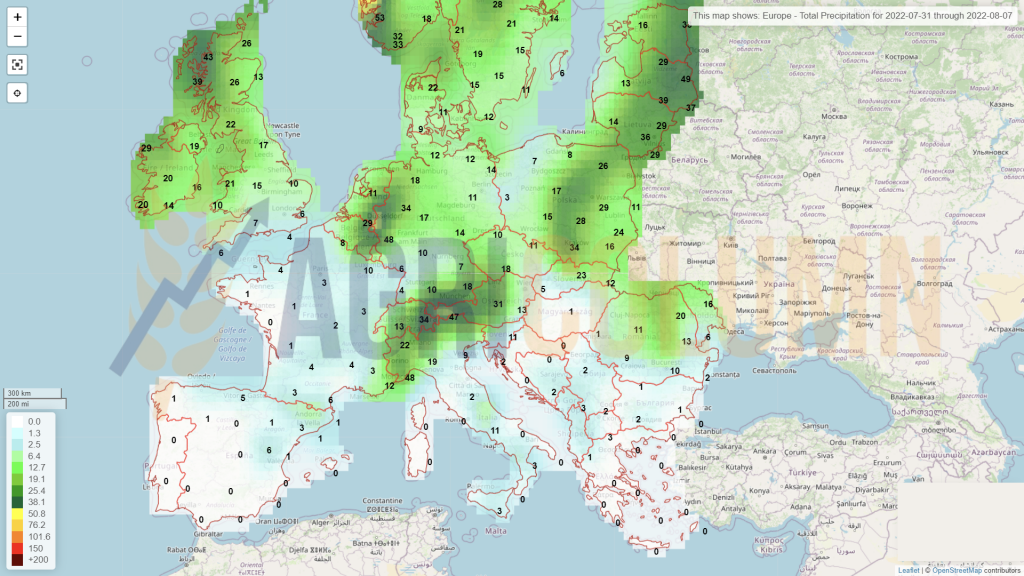
Europe
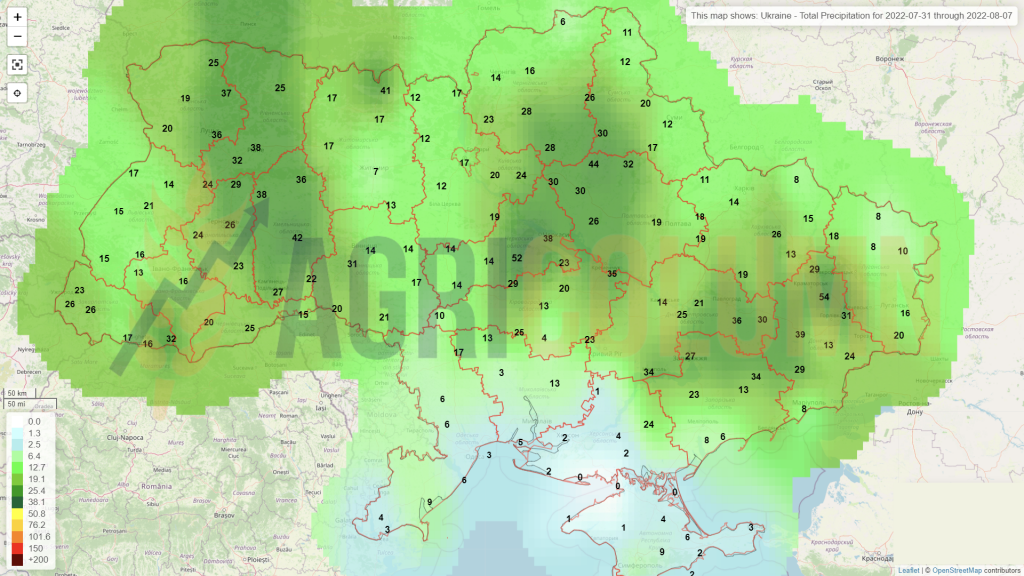
Ukraine
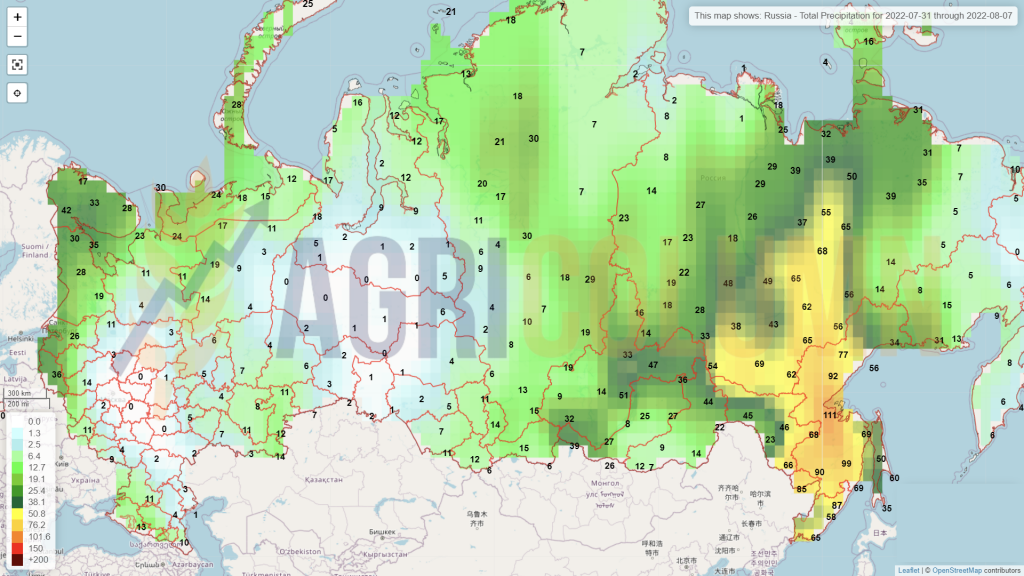
Russia
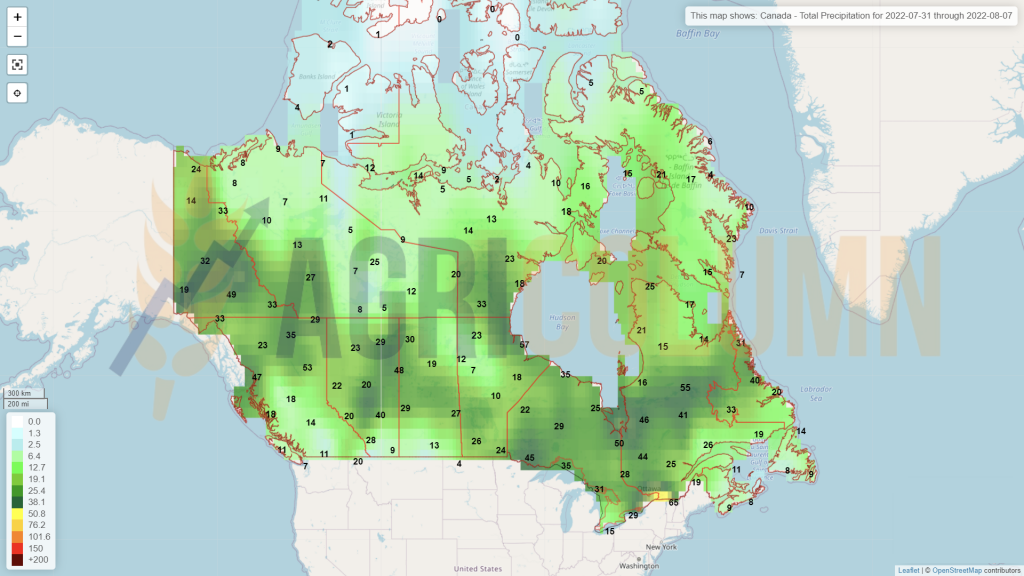
Canada
USA
Brazil
Argentina
China
Australia