Romanian Agri Trade Summit, one of the largest events addressed to International Agribusiness, will take place on February 22, 2023 in Bucharest.
The initiative aims to reconfirm Romania’s strategic role in global agribusiness and to bring together the most important players in the dynamic grain market – top Farmers, Traders, Processors and Distributors.

This week’s market report provides information on:
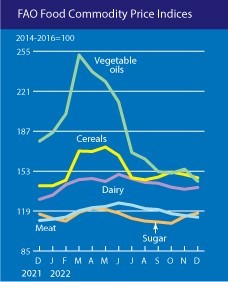
FAO CEREALS
The FAO Cereal Price Index averaged 147.3 points in December, down 2.9 points (1.9%) from November but still 6.8 points (4.8%) above its from December 2021. Wheat export prices fell in December as ongoing harvests in the southern hemisphere boosted supply and competition among exporters remained strong. World corn prices also fell month-on-month, mainly due to strong competition from Brazil, although drought concerns in Argentina provided some support. Influenced by the spillover from corn and wheat markets, world prices of sorghum and barley also fell. World maize and wheat prices hit new record highs in 2022, averaging 24.8 and 15.6% higher, respectively, than their 2021 averages.
FAO VEGETABLE OILS
The FAO vegetable oil price index averaged 144.4 points in December, down 10.3 points (6.7%) from November and hitting its lowest level since February 2021. The decline in the index in December was driven by lower international quotations for palm, soybean, rapeseed and sunflower oils. World palm oil prices fell nearly 5 percent after a short-lived recovery in the previous month, supported mainly by weak global import demand, despite lower output in major palm oil-producing countries due to excessive precipitation. Meanwhile, world soybean oil prices fell significantly, largely due to the positive outlook for seasonal production growth in South America. For rapeseed and sunflower oils, international prices fell due to ample global supplies and weak import demand, particularly from the European Union, respectively. For the full year 2022, the FAO vegetable oil price index averaged 187.8 points, up 22.9 points (13.9%) from 2021 and marking a new annual record.
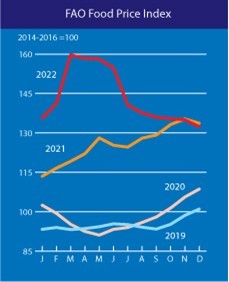
FAO FOOD
The FAO Food Price Index (FFPI) averaged 132.4 points in December 2022, down 2.6 points (1.9%) from November, marking the ninth consecutive monthly decline and standing at 1.3 points (1.0%) below its value a year ago. The decline in the index in December was driven by a steep decline in international vegetable oil prices, along with some declines in grain and meat prices, but partially offset by moderate increases in sugar and dairy prices. However, for the full year 2022, the FFPI averaged 143.7 points, up from 2021 by up to 18 points, or 14.3%.

LOCAL STATUS
The indications of the Port of Constanța hover around the values of 290-295 EUR/MT, with a discount of at least 20 EUR/MT for the feed quality. In the country, in FCA Farms parity, we do not register big differences. The logistic cost to the port of Constanta or to the processing units is discounted.
The new crop, i.e., 2023, has a price level displayed around 250 EUR/MT for milling quality. And here we have an amendment. We informed Farmers about the risk of price depreciation and generated solutions, one of them is price assurance through Hedging on Euronext. But apparently, the trust is not at the level that can generate added value in the income-expenditure balance of the farm. But we continue to generate the solutions. Farmers can choose. www.agricolumn.eu is the place where these solutions are available to Romanian Farmers.
CAUSES AND EFFECTS
What I argued before the Winter Holidays remains absolutely valid. The abundance at the European and regional level (Russia) does not in any way guarantee future price increases. The blockade created by Russia, through the large volumes they must sell and export, despite the logistical restrictions created by weather and insurance, have created a ceiling for Romanian Origin.
Ukraine also effectively contributes to this whole, so the price has absolutely no chance now to develop vertically.
Romania has an extremely large amount of wheat in stock, a clear testimony being the volumes exported up to this moment, which are half compared to last season in the same period. Farmers could not overcome the barrier of belief in that famous price increase that was generated during the winter and remained faithful to those old market principles.
But the market is extremely volatile and influenced by many factors, factors that have led to the same conclusion that we have shown repeatedly since May 2022, namely that the wheat price path is downward.
Farmers’ problems will intensify in the next period. They have accumulated financial costs due to the storage of wheat, and this is impactful, due to the level of interest charged at 15-16%.
In a maximum of 60 days, however, stocks must be sold, because financial liquidity is necessary for the establishment of spring crops, and we even foresee a sales panic, which will drive the price even lower, for easy-to-understand reasons (abundance of supply).
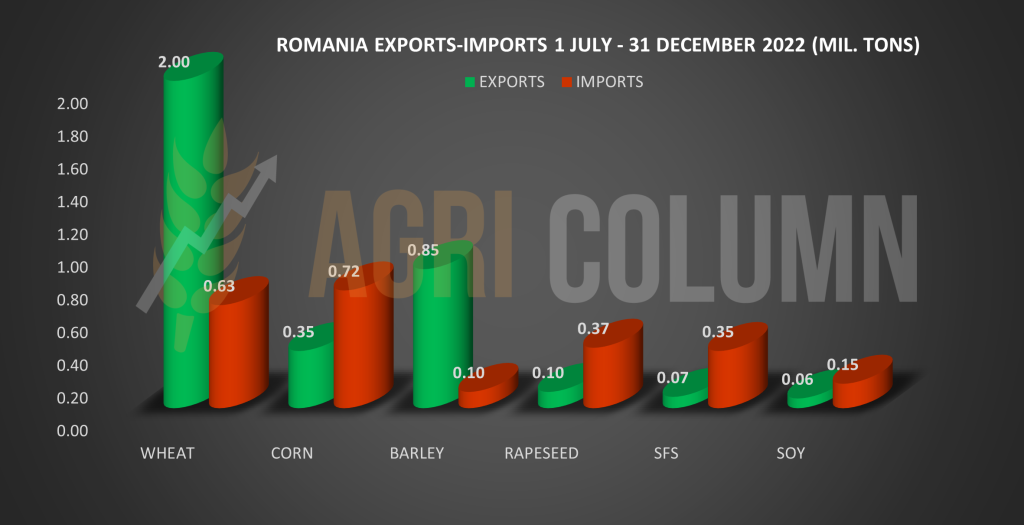
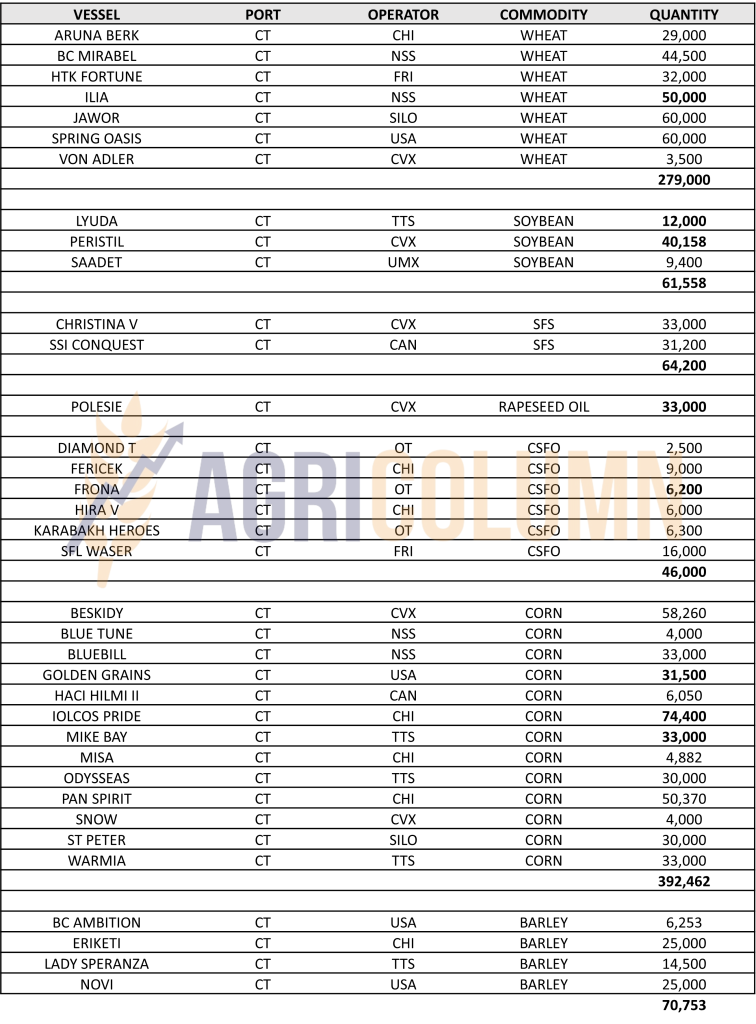
We insert here the export level for each commodity category, in green. One can see the figure of 2 million tons related to wheat. Let’s also keep in mind the 2022 production of 9 million tons and understand that we are in a situation where local wheat stocks are at a high level and the price cannot be sustained.
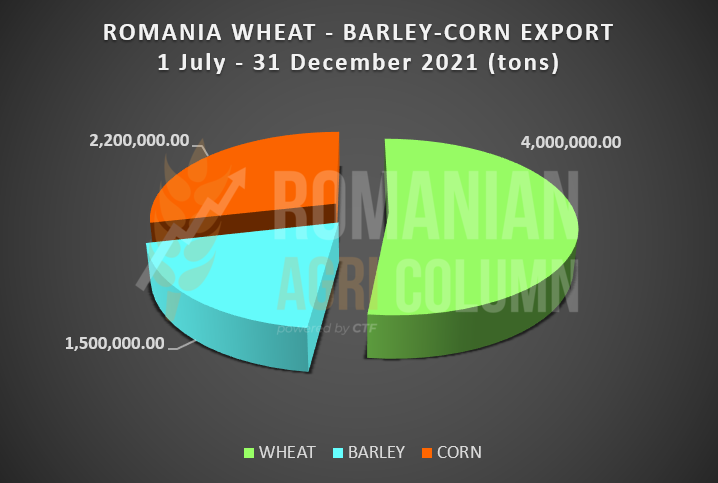
And here we have for comparison the level of Romanian exports on December 31, 2021. It is eloquent for all categories of goods. Wheat accounted for 4 million tons of exported volume.
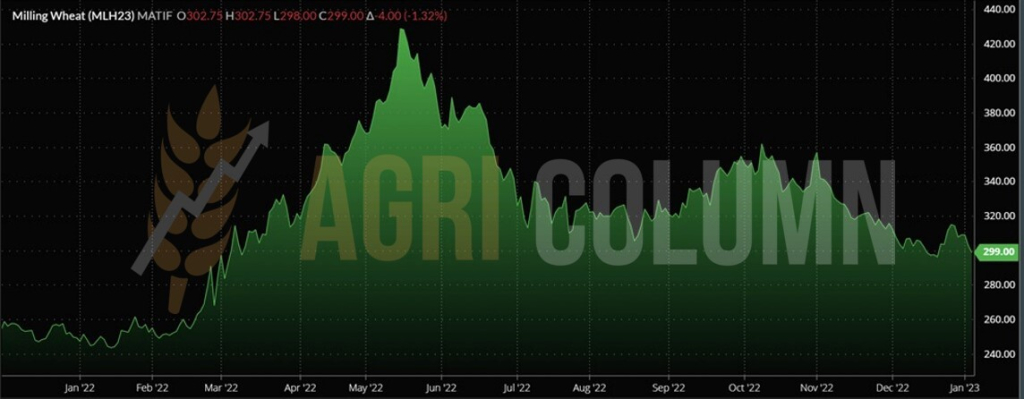
And as the last parameter of the causes and effects column, we insert the path of the price of wheat starting from JANUARY 2021 to JANUARY 2022. A picture is worth a thousand words.
We should not be surprised by values of 265-270 EUR/MT near mid-March, beginning of April 2023.
REGIONAL STATUS
RUSSIA is literally marching this season. They have only one goal in mind, namely, to sell the commodity, in this case wheat. But Russian wheat is extremely large in terms of volume. The latest estimates put it at 104-105 million tons. Very much. Russian farmers have stocks of about 25.5 million tons on farms, which is again a very large figure. This buffer will clearly influence the future crop as well.
UKRAINE is experiencing logistical problems created by Russia. By slowing down the screening of Grain Corridor ships in Istanbul, Russia ensures that Ukraine does not in any way disturb it in its attempt to export as much wheat as possible.
The EUROPEAN UNION is at the moment when it generated exports of 16.7 million tons of wheat, 1 million tons more than last season, in the same period, when it generated exports of 15.7 million tons. In contrast, for imports, the ratio has clearly changed. This season, from July 1 to December 31, 2022, the Union imported 4.2 million tons of wheat, compared to only 1.47 million tons last season, the same period. The difference was made by two factors:
- The lower crop level in 2022 compared to 2021 ensured the much higher import volume.
- Discounted Ukrainian goods found their way to the European Union. Many countries have benefited from this volume of cheap goods in their domestic processing industry.
At first glance, the import champion is Spain, with a volume of 1.5 million tons of wheat, followed by Romania, with 0.63 million tons, and Poland, with 0.5 million tons. It is an unprecedented situation for Romania, we could say. Not only did it export a little, but it also imported a considerable amount.
In terms of exports, France excelled (we know the story and we won’t repeat it) with a volume of 6.83 million tons, followed by Romania, with 2 million tons, and in third place we find Germany, with a volume of 1, 88 million tons.

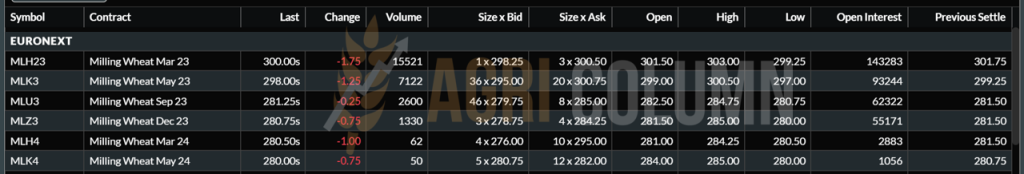
EURONEXT – MLH23 MAR23 – 300 EUR (-1.75 EUR)
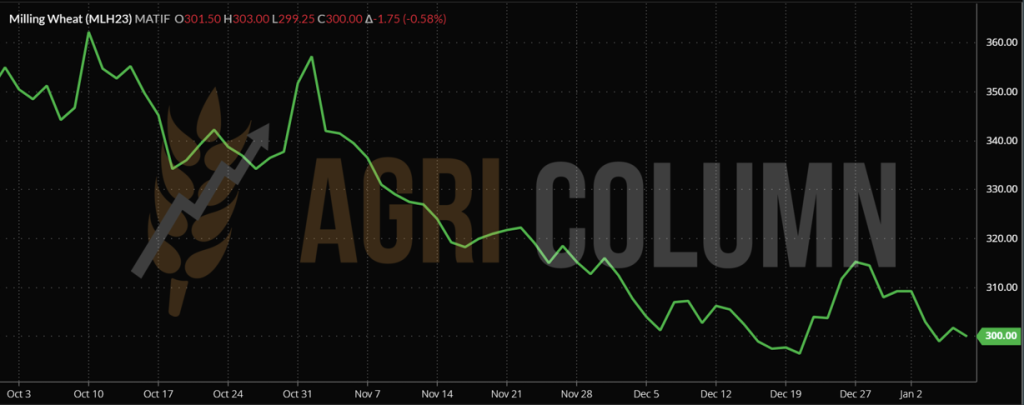
EURONEXT WHEAT TREND CHART – MLH23 MAR23
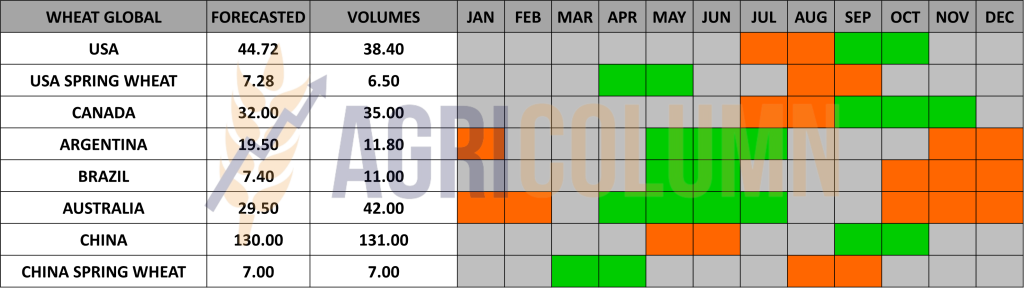
GLOBAL STATUS
USA. MIXED AMERICAN WINTER WHEAT CONDITIONS. ” Son, in winter, wheat has more lives than a cat.” (American farmer to his son)
The USDA issued its latest national winter wheat season assessments on Nov. 29, reporting 34 percent of the U.S. crop in good to excellent condition as of Nov. 27, the lowest for that time of year since the 2012 winter to date.
The USDA rated 19 percent of Kansas’ winter wheat crop in good to excellent condition as of Jan. 1, down from 21 percent in late November. Wheat ratings also declined in December in Montana, Nebraska, South Dakota, and North Dakota. About 69 percent of U.S. winter wheat is produced in an area currently experiencing drought, the USDA said last week.
Nearly 37 percent of Kansas is in “exceptional drought,” the worst of five categories in the weekly US Drought Monitor report by a consortium of climatologists. However, in Colorado, 50 percent of the state’s wheat was rated good to excellent, up from 30 percent by the end of November. “Snowstorms in the second half of December improved moisture across the state,” the Colorado USDA report said.
Updated crop estimates were not available online for Texas, another key state for wheat. Ratings improved in Illinois, where farmers grow SRW soft red winter wheat. The USDA rated 68 percent of the Illinois crop as good to excellent through Jan. 1, up from 30 percent in late November.
ARGENTINA is headed for a level of 11.8 million tons, so what was meant to be became real.
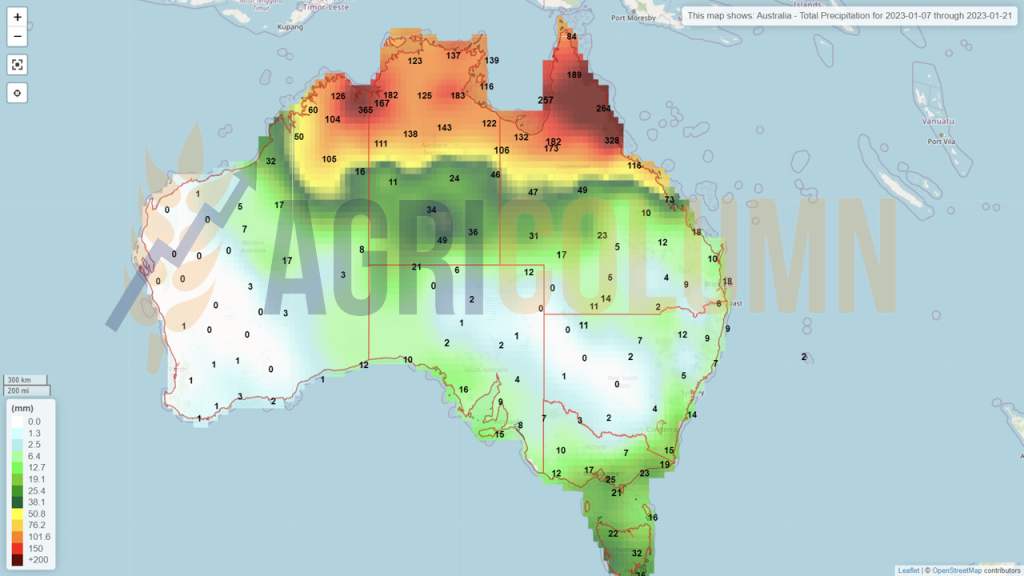
AUSTRALIA is effectively burying the price of wheat. Final crop estimates lead to a level of 41-42 million tons, compared to an initial 33 million tons and an interim upgrade of 36.6 million tons. Australia will become a logistical problem unto itself because such a large volume of wheat will require storage facilities and logistical effort to export, not to mention Selling these volumes.
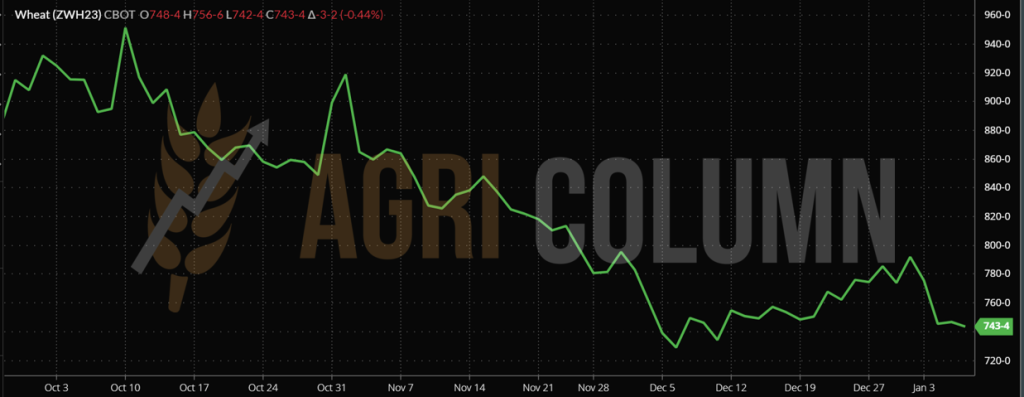
CBOT WHEAT – ZWH23 MAR23 – 743 c/ bu (-3 c/ bu = -$1.1)
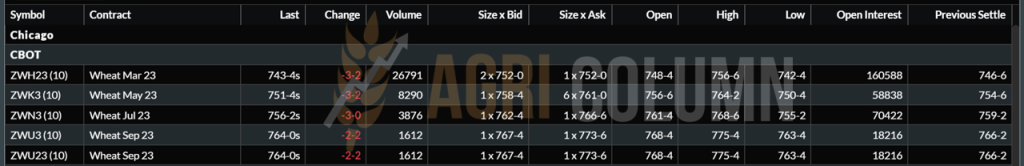
CBOT WHEAT TREND CHART – ZWH23 MAR23
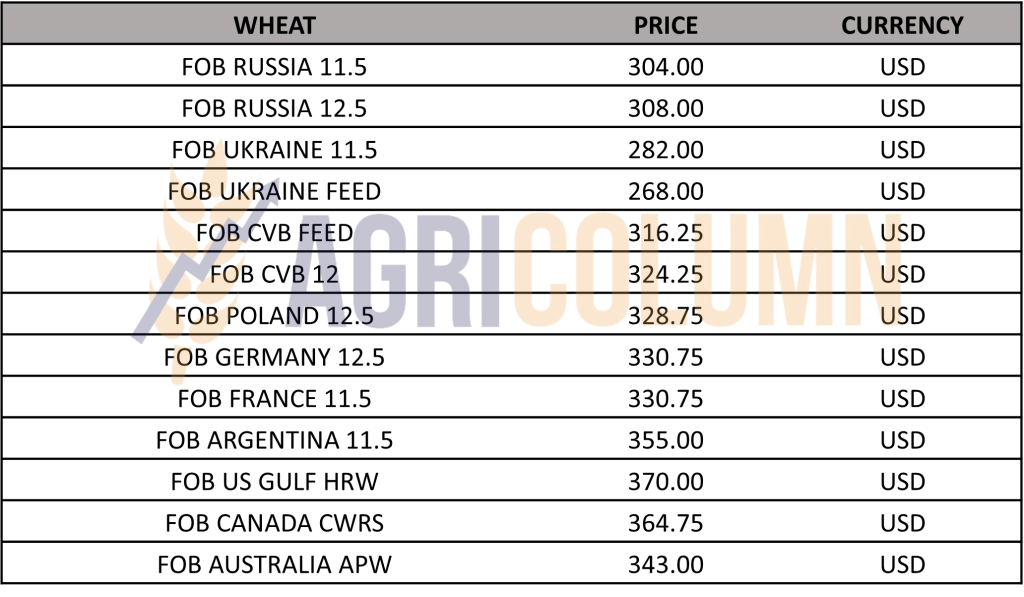
WHEAT PRICE INDICATIONS IN MAIN ORIGINS
TENDERS AND TRANSACTIONS
Office des Cereales (ODC) bought 100,000 tons of wheat for delivery February 10 – March 5, 2023:
- 2 x 25,000 tons of wheat from Viterra at 351.86 USD/MT CFR;
- 1 x 25,000 tons wheat from Soufflet at 353.82 USD/MT;
- 1 x 25,000 tons of wheat from Casillo at 353.89 USD/MT.
GASC Egypt is organizing a wheat purchase through direct negotiation on January 10, 2023. The payment will be made through the World Bank, so it is CAD (Cash Against documents).
TMO Turkey is organizing a tender for the purchase of 565,000 tons of wheat on January 12, 2023, with delivery in FEB-MAR 2023.
CAUSES AND EFFECTS
European wheat has clearly lost competitiveness with Russian wheat. At the moment, it is captive to a low-price level operated by Russia, a Russia that has failed to meet its December 2021 export target. But now, Russia has reached 24.9 million tons of wheat, 3.2 million tons more than a year ago at the same stage.
The main markets remained the same, although down on last year, as major buyers bought lower volume amid high prices, but the customer base diversified.
Turkey was the main importer with 4.7 million tons imported, down 15% from last year, followed by Iran with 3.5 million tons, down 30%.
However, in Egypt, it increased its deliveries by 13% to 3.5 million tons.
At the same time, Russia has actively expanded the geography of deliveries, and some countries in the Middle East and Latin America have already bought volumes of wheat that have equaled or exceeded the deliveries of any of the previous seasons, such as Saudi Arabia, Algeria, Pakistan, Brazil, and Mexico.
Russian farm stocks are at 25.5 million tons, which raises serious questions about the so-called bumper stocks, i.e., what they will remain unsold with and pass to the next season. The sowing intention of the Russian farmers is no longer so acute, and we are referring to the spring wheat, because the winter wheat had a deficit in the number of hectares. And the first unofficial indications lead to a 2023 harvest volume of 82-85 million tons. And if they remain with stocks of 8-10 million tons, we will once again experience price suffocation.
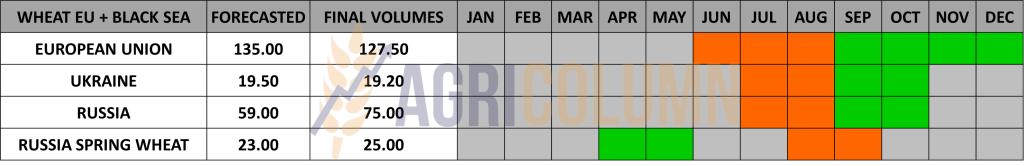
The European Union generates a healthy crop projection of a level of 128.7 million tons, accounting only for milling wheat. Given what Ukraine and Russia will produce, it indicates very little potential for price growth in this product. Of course, a lot can happen by then due to the weather factor, but the price trajectory of the current and subsequent future crop is not positive.
From the end of February, we will feel this even more. Then the upcoming crops in the Northern Hemisphere will be much more visible and the Destinations will slow down their purchases. It makes sense, they are 3 months away from a cheap, much cheaper new crop.
But a problem remains and perpetuates. The cost of establishing crops. Wheat was sown with high summer costs. Maintenance work also generated high costs. The fertilizers that will be applied in February are purchased at a high price level. Gas is only now starting to become cheaper compared to the beginning of the conflict. And if we consider the level of inflation and the financial cost from interest (15%), we have only one solution left to be able to generate profit from the wheat harvest. 3 conditions must be met:
- The sale must be made according to a mold that allows the collection of peaks;
- Correlation through Hedging on the stock market;
- Precipitation must generate very good production so that the difference in costs from the establishment, financial costs and inflation cover the negative impact by volume.

LOCAL STATUS
The price indications of feed barley in the CPT Constanța parity are at the level of 250-255 EUR/MT.
No news on the barley market at national or regional level.
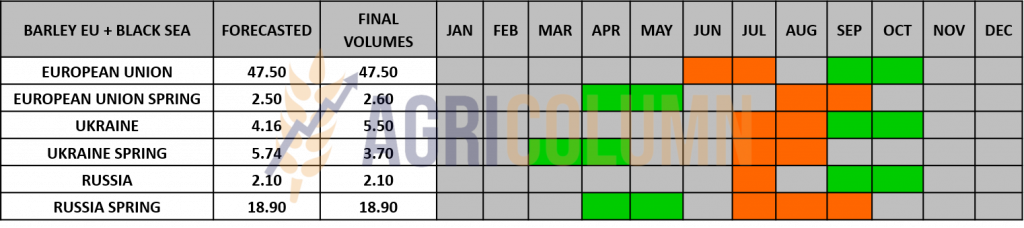
BARLEY PRICE INDICATIONS IN MAIN ORIGINS

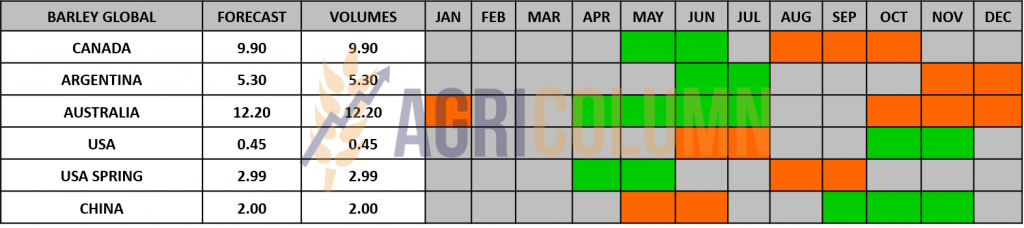
GLOBAL STATUS

LOCAL STATUS
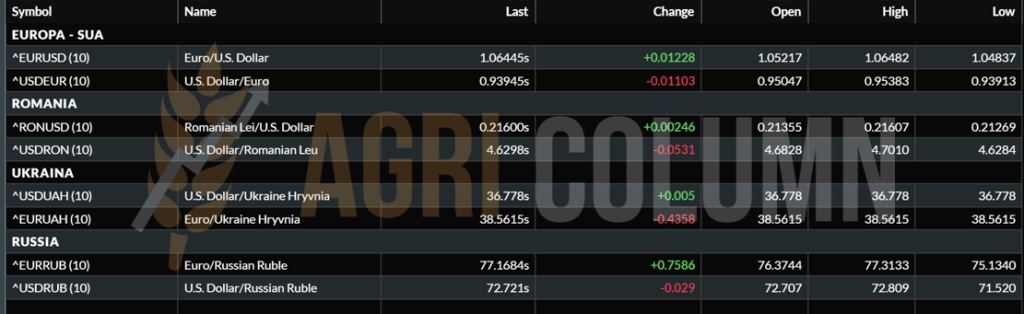
Corn indications in the port of Constanța are at the level of 265-268 EUR/MT. On some days, levels of 270 EUR/MT can also be achieved. But let’s not forget the main condition, namely the EUR|USD parity, which raises or lowers the price level in euros locally.
In short, a stronger dollar against the EUR will generate a higher price level in this currency, providing support. And a minor variation can lead to a difference of 5-7 EUR/MT.
If we refer to a FOB CVB (Constanta-Varna-Burgas) price of say 280 USD/MT, and we have a parity of 1.065 USD related to the EUR, the price becomes 262.91 EUR/MT. But if we have a parity of 1.05, the price becomes 266.66 EUR/MT.
CAUSES AND EFFECTS
The price of corn is stagnant, conditioned by the Weather factor in other areas of the world. The pull from the wheat will not arrive, for the wheat itself is in a declining situation. But little by little, things will sort themselves out and corn will have to close the gap between today’s wheat price and its price.
But the main problem remains Ukrainian corn, which crosses through all possible places in Romania and generates market distortions. It is not a singular fact, Poland has the same problems, but there is a dispersion factor there, namely the processing industry. Likewise in drought-stricken Hungary, Ukrainian goods are welcome.
REGIONAL STATUS
UKRAINE is at a harvesting level of 80%, according to analysis houses in this country, and the harvested volume seems to be 20-21 million tons. The problems persist.
This corn was harvested with high humidity, and drying costs penalize attempts at artificial drying. It is normal, Ukrainian farmers get around 100-110 USD/MT under FCA Farms condition. Drying costs are in the 45-55 USD/MT range.
RUSSIA brings no news to corn culture. 14 million tons.
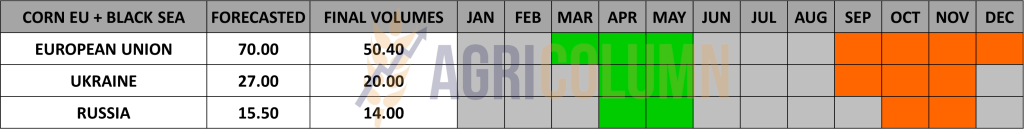
THE EUROPEAN UNION reached an import level of 14.7 million tons of corn. It is an extremely high figure compared to last season in the same period when imports were at the level of 7.33 million tons.
But let’s not forget the drought and the heat, which made the Union deprived of about 20 million tons of corn.
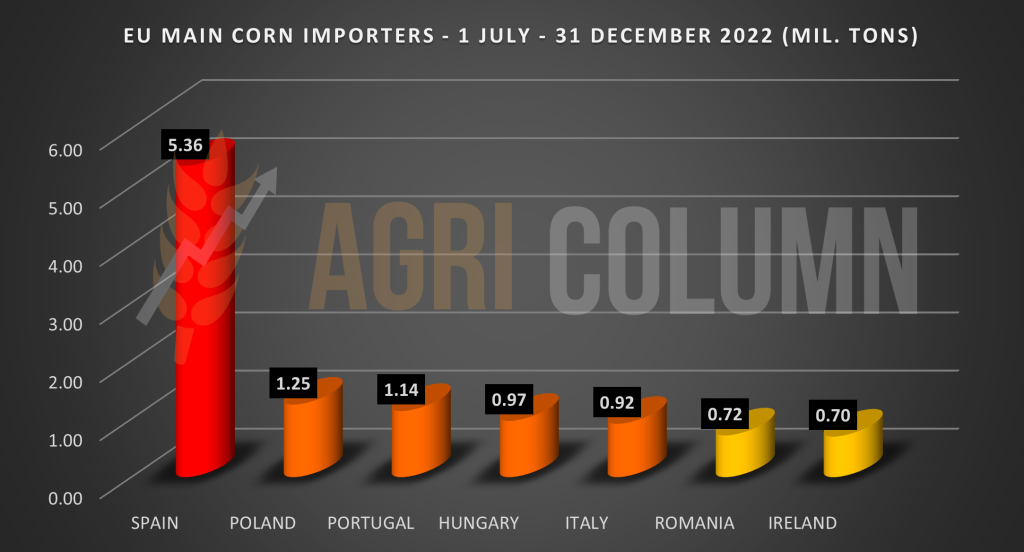
From the list of countries with the highest level of import, we extract Spain in first place, with 5.4 million tons, followed by the Netherlands, with 1.72 million tons. In the top we also find Poland with 1.25 million tons, Portugal with 1.14 million tons. The rest of the top is illustrated in the chart below:
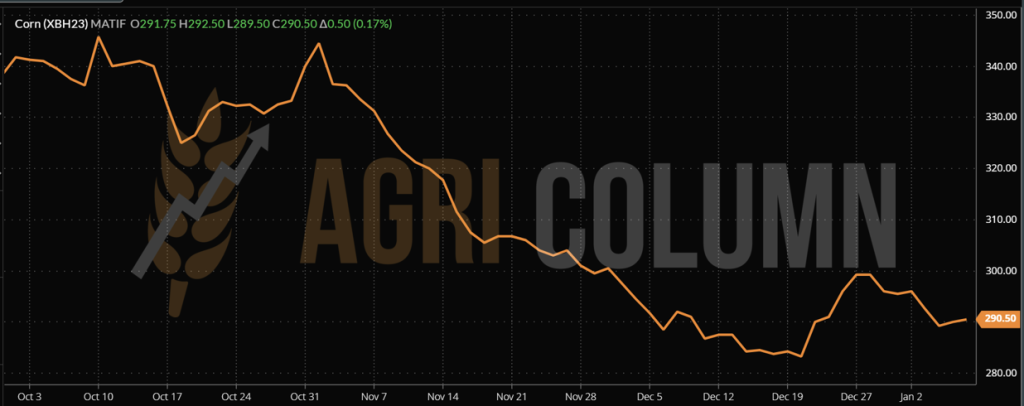
EURONEXT CORN – XBH23 MAR23 – EUR 290.5 (+0.5 EUR)
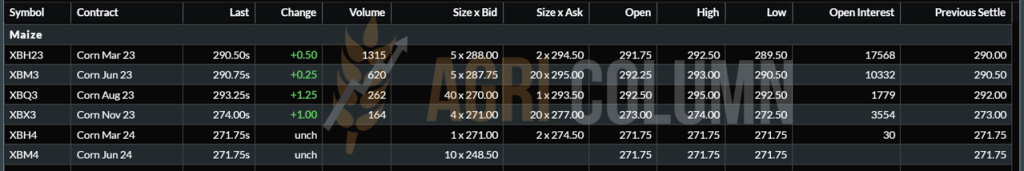
EURONEXT CORN TREND CHART – XBH23 MAR23
GLOBAL STATUS
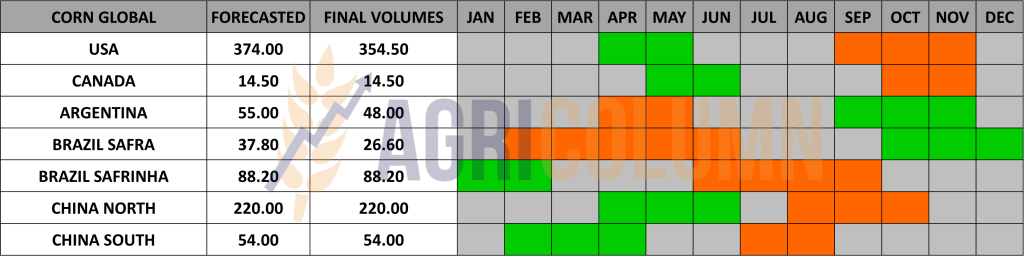
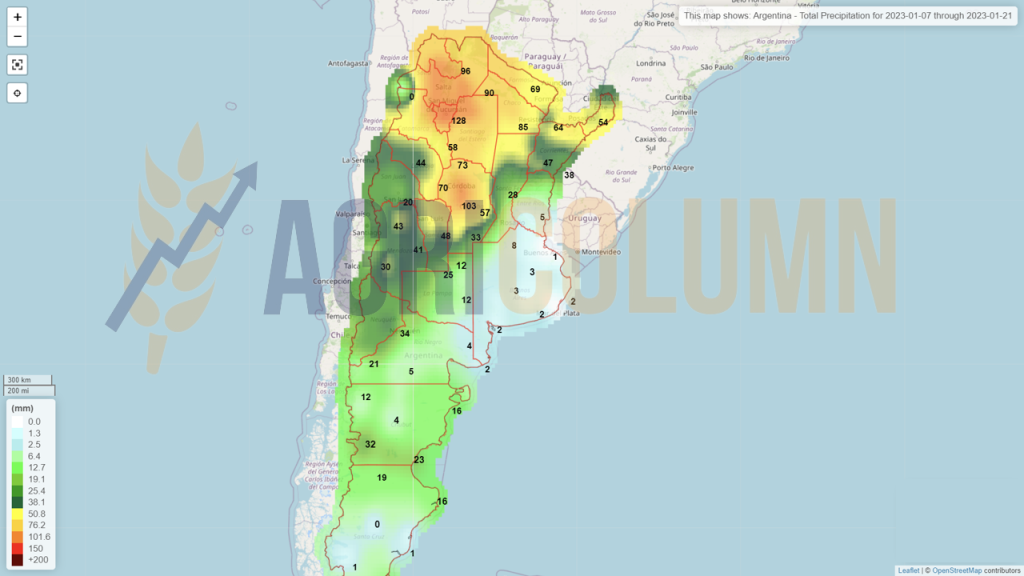
ARGENTINA is in maximum difficulty. They passed 80% corn sowing and the G/E percentage, that is good to excellent, decreases by 2%, from 15% to 13%. In the following days, no precipitation is expected, more precisely in the next 2 weeks.
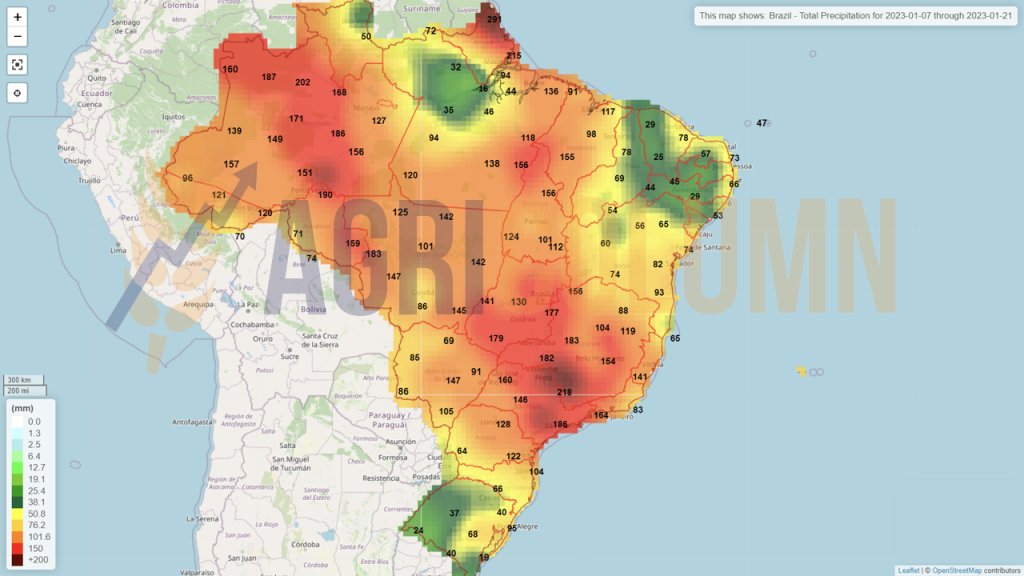
BRAZIL takes a step back and we see the Safra forecast drop by 1.4 million tons from 28 to 26.6 million tons. Drought also penalizes here. Certain areas of Brazil will not receive any precipitation for the next 2 weeks. We are talking about areas in the states of Bahias, Goias, Minas Gerais and Tocantins, for Brazil is very large.
Monthly data on exports from Brazil showed that 6.4 million tons of corn were shipped in December. This was an 88% increase from December 2021, as a second record crop there continues to impact world trade.
USA. Export sales are slow. Ukraine and Brazil offer corn at prices below US FOB values.
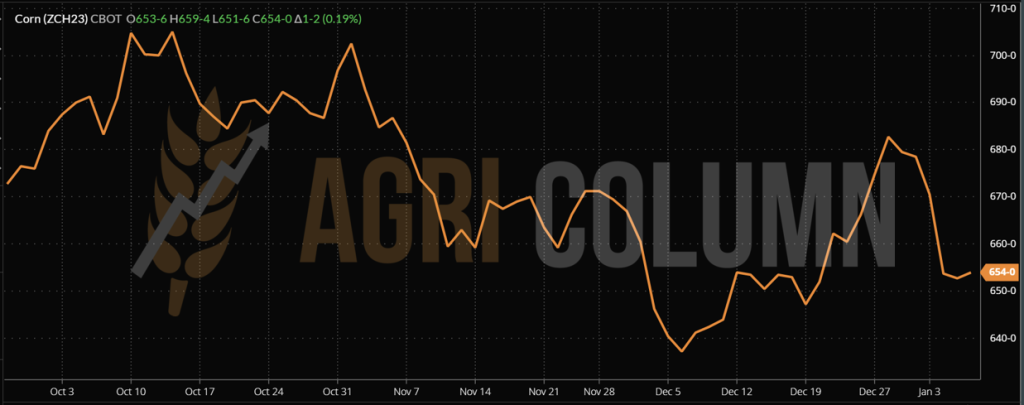
CBOT CORN ZCH23 MAR23 – 654 c/ bu (+1 c/ bu)
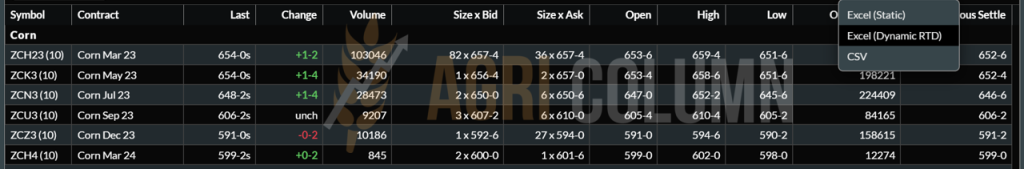
CBOT CORN TREND CHART – ZCH23 MAR23
CORN PRICE INDICATIONS IN MAIN ORIGINS

CAUSES AND EFFECTS
If the Northern Hemisphere has closed accounts in terms of harvesting and we have final figures compensating the EU deficit through low-cost Ukrainian imports, South America is starting to offer the surprises we are used to. Argentina is the leader of South American Tango. The drought keeps her under scrutiny at all times. The degradation of the corn crop continues, but all is not yet done. There is still time, there is still hope.
Brazil is also starting to show signs of degradation in the first Safra crop. On the contrary, it is very competitive in exports against the USA. China is the main customer.
What’s next? Everyone is keeping an eye on two fundamentals: demand from China and the development of the South American crop. In the first foundation, however, we have a problem related to the pandemic. China is experiencing pandemic peaks these days. Shanghai, a megalopolis with 25 million inhabitants, has an infection rate of 80% and it will be a while before the peaks are passed. Why do we say this? Because only after that the demand will return. And specialists estimate Q2 of 2023 when demand from China will return.
The second foundation is South American Weather, which can amplify the problems we see today in the Argentine and partly Brazilian corn crop.
We dare say that corn will have a positive note from a price point of view. Time will generate demand for this commodity, and if aggregated with South American issues, then the price differential between wheat and corn will narrow to the benefit of the latter.

LOCAL STATUS
Rapeseed quotations in the port of Constanța are at the level of FEB23 minus 25 EUR. This guidance calculates a level of 552-555 EUR/MT. At the processing level, the quotations are FEB23 minus 35 EUR, a fact due to the logistics cost (difference between Constanța and the Processing Units).
The new crop is also quoted. Primary indications are AUG23 minus 30 EUR. It is an initial indication that provides support in estimating farmers’ incomes.
CAUSES AND EFFECTS
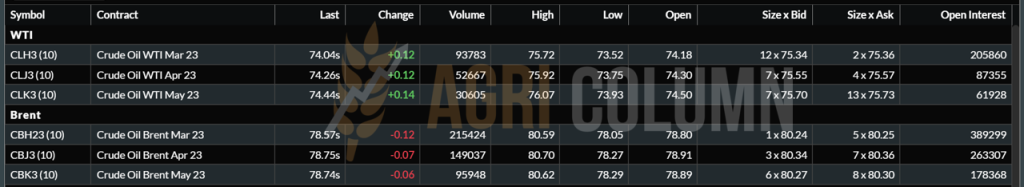
After the gain of the last period, which happened earlier than we expected, rapeseed is losing because of Brent oil quotes. However, the demand has appeared and is consistent from the processors. Everything now depends on the timing of the indication and, of course, its correlation with the oil indications.
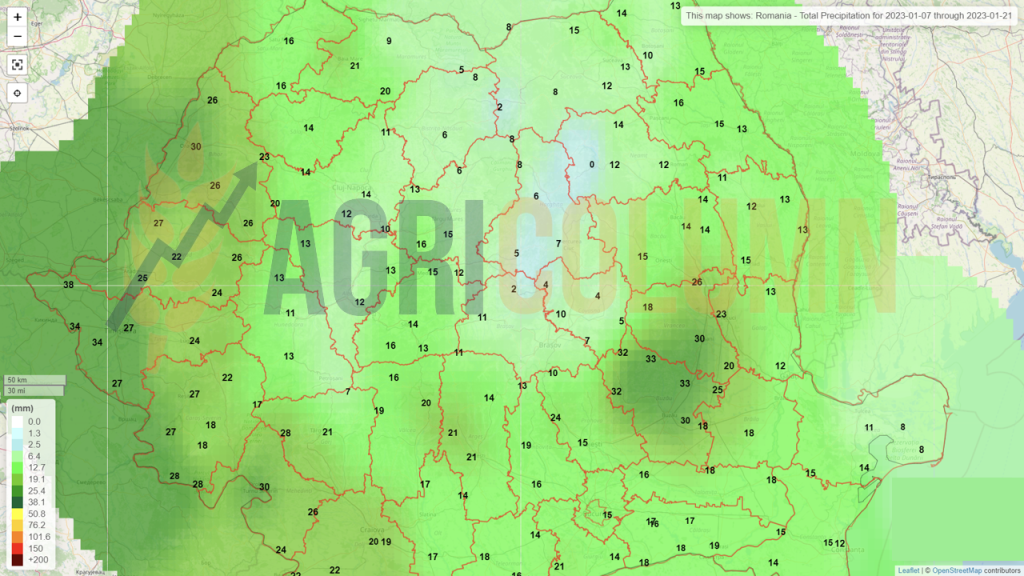
Nationally, the rapeseed crop is performing well and we expect rainfall between January 10-18, 2023. Pests have appeared, but this problem can be solved with the help of treatments.
Romania currently has a level of 0.56 million tons, with an estimate of 1.7 million tons.
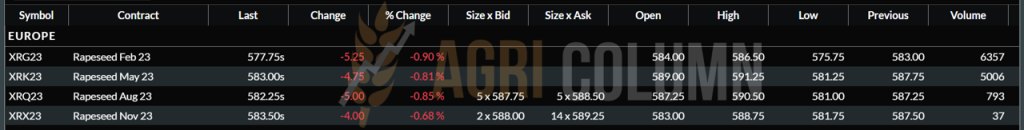
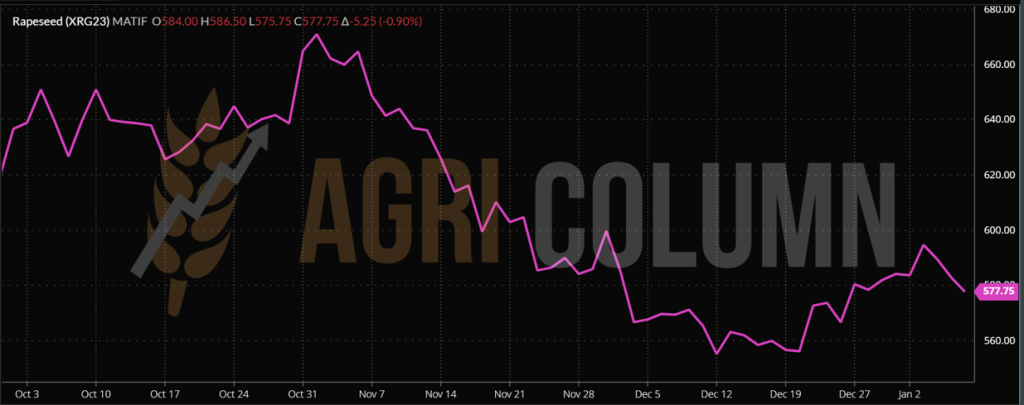
EURONEXT RAPESEED – XRG23 FEB23 – €577.75 (-€5.25)
EURONEXT RAPESEED TREND CHART – XRG23 FEB23
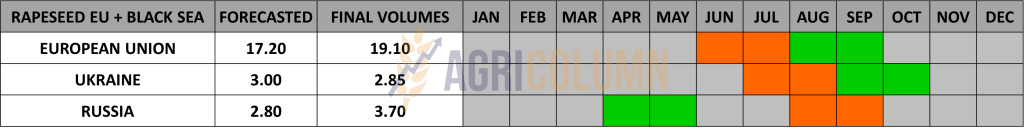
REGIONAL STATUS
The outlook for rapeseed production in the EU in 2023 is to increase by 0.5 million tons, up to 19.6 million tons. This is the production forecast for the coming season and is based on the increase in rapeseed area. Next season, we hypothesize that prices will remain under pressure from unsold stocks in the 2022-2023 season.
But there are many unknowns at this point, and it is too early to make definite predictions. But what we must watch is the fact that the crop inverse is positive, that is, the difference between the old and the new crop in terms of FEB23 vs. AUG23.
GLOBAL STATUS
CANADA is out of season, of course, but Demand for Canadian canola is forecast to increase due to increased renewable diesel production. “For processing canola, in terms of possible capacity growth in the coming years, we could see a capacity increase of close to 6 million tons, based on facilities that are currently under construction or that have been announced,” said Chris Vervaet, director executive of the Canadian Oilseed Processors Association.
AUSTRALIA, with the 7.2 million tons harvested, will become aggressive in exporting. The pandemic in China is at its peak and will not generate demand any time soon, so price pressure remains at least until Q2 2023.

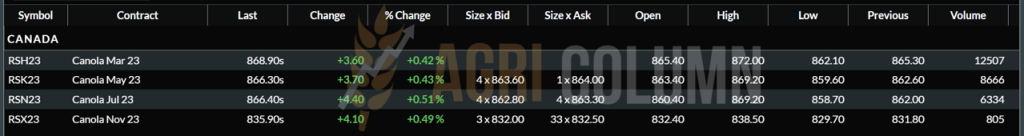
ICE CANOLA RSH23 JAN23 – 868.90 CAD (+3.6 CAD)
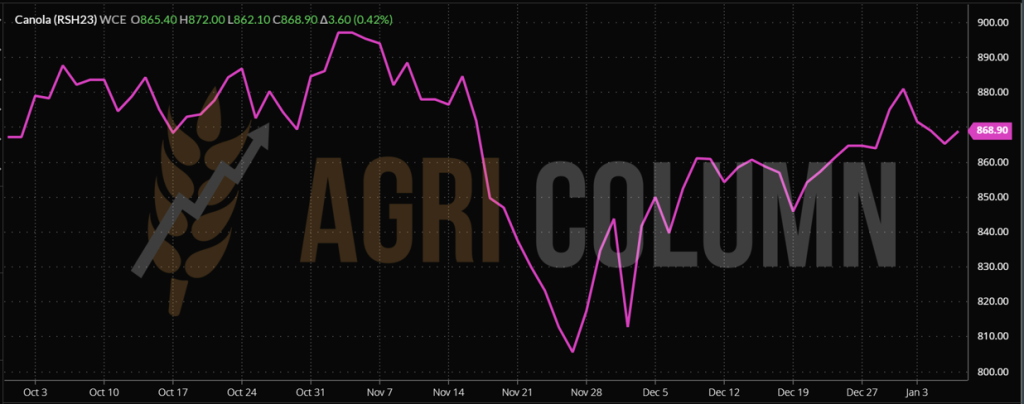
ICE CANOLA TREND GRAPH – RSH23 MAR23
COMPARATIVE GRAPH. PETROL-RAPESEED-CANOLA CORRELATION
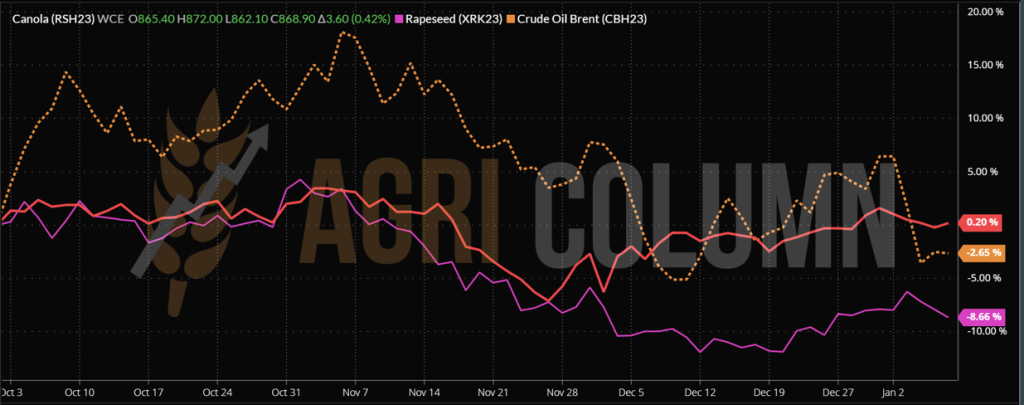
CAUSES AND EFFECTS
As the comparative chart above also indicates, Brent quotes (dotted orange line) keep the European rapeseed quote (pink) low. Their trajectory is visible. Conversely, Canadian canola is trending upwards driven by processing demand.
Starting from Monday, however, we have to change the quote, namely the reference. We will cross the XRG23 indication FEB23 and report to XRK23 MAY23. In the middle of next week, position liquidations and May roll-overs will begin.
Rapeseed is still dependent on oil, and we do not see traction from it. Support could come from soybean and palm oil. Soybeans are starting to grow again, and palm oil is rethinking stock levels (declining levels in Malaysia and Indonesia).
The demand we all need to know is there and we believe the decline in Premium will generate better indications in the physical market than today’s minus 35 EUR level. If we hit minus 15 EUR, it is a good time to sell, as the time window will narrow towards early March with European and Ukrainian estimates of new crop volumes. Then in April, we’ll see the Canadian and Australian seedings begin to perform in turn. And let’s not forget that canola production will see a major expansion in North America, up to 50%.
Once again, financial risk instruments can help farmers secure the price. Hedging is the simplest method available and within reach of farmers.

LOCAL STATUS
Primary indications for sunflower seeds are at 550-555 USD/MT. But there is no liquidity in the physical market in terms of transactions.
CAUSES AND EFFECTS
Romanian farmers are waiting for other levels. Stimulated by what is happening regionally, they are positioning themselves in anticipation, with higher levels in mind than today. Logic must be based on realistic expectations. Levels of 650-680 USD/MT are no longer achievable for sure. In practical terms, a high of 580 USD/MT is much closer to reality.
REGIONAL STATUS
UKRAINE it’s not in very good shape. Processing is very slow. Very large stocks exist and are not sold. The activity in the processing units is very heavy, the rationing of electricity makes the latter unable to operate. If we add to this the fact that the export is carried out only through Chornomorsk, we have a picture of a very narrow flow. Mikolayev was the port operator generating the largest transfer of crude oil.
Also, Ukrainian farmers do not want to sell the raw material cheap. With a very thin crop, the demand for processing and export is visible.
RUSSIA has not advanced. They remained at the same level of 13.7-13.8 million tons of production, but their production is penalized by the reduced demand for crude oil from destinations.
The EU is in the off-season and demand is not yet high. Raw material and crude oil flows that entered the Union coming from Ukraine or Romania and Bulgaria (Ukrainian seeds processed in these two countries, and then the oil transferred to the EU).
GLOBAL STATUS
ARGENTINA lowers sunflower seed crop forecast. But things are presented in a way that indicates that they have more production than last season. Last season, Argentina produced 3.4 million tons, and the current forecast is 3.5 million tons. But it fell from an initial estimate of 4.2 million tons as Argentina sowed 300,000 hectares more than last season, fueled, in turn, by the shortage generated by Ukraine.

PRICE INDICATIONS FOR OILSEEDS AND CSFO IN MAIN ORIGINS

CAUSES AND EFFECTS
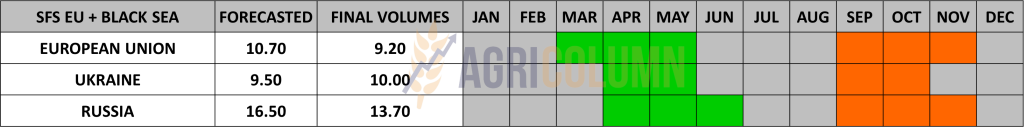
SFS REGIONAL PRODUCTIONS. We have several factors that we list:
- Ukraine, crop reduced by 0.5 million tons, from 10.5 to 10 million tons;
- Russia, crop reduced by 2 million tons, from 15.8 to 13.8 million tons;
- Argentina, crop reduced by 0.7 million tons, from 42 million tons to 3.5 million tons;
- Demand is still low at European Union level;
- Turkey is lifting all its tariff barriers for the import of sunflower oil.
The above build-up leads to a potential upside in the price level. It is a matter of time before the application will activate. The first signs are already visible. A lot of Ukrainian cargo was asked at 540 USD/MT and the seller said 575 USD/MT, BID and ASK.

LOCAL STATUS
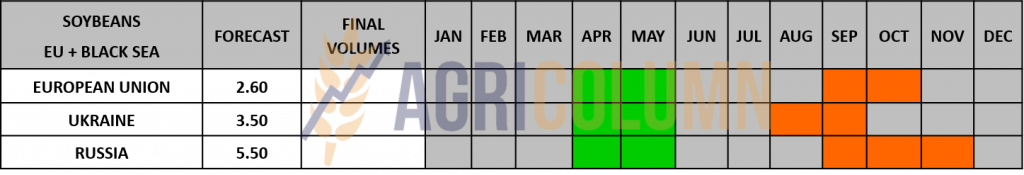
In Romania, the price indications for soybeans are at the level of 525-530 USD/MT DAP processing units for non-GMO soybeans. Between July 1 and December 10, 2022, approximately 145,000 tons of soybeans were imported.
REGIONAL STATUS
Soybean imports into the EU in the last week of 2022 were 137,607 tons, bringing total soybean imports since the start of the season to 5.52 million tons, down 15.6% from the same period last year.
Weekly soybean meal imports into EU countries were 259,484 tons, the total now standing at 8 million tons.
UKRAINE. Soybean exports in the September-December period of the 2022/23 season amounted to 1.18 million tons, which represents an increase of almost 97% compared to last year. In the first 4 days of January, soybean exports amounted to 42,439 tons, of which 16,418 tons were destined for Romania and 13,811 tons for Turkey.
GLOBAL STATUS
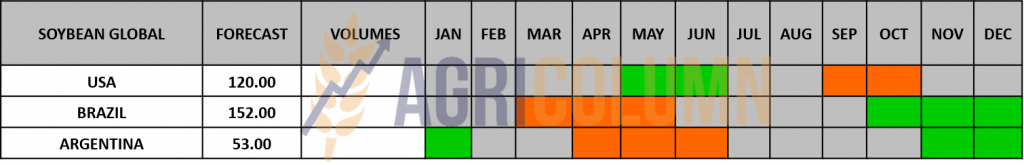
USA. In the last week of 2022, according to data from the US Department of Agriculture (USDA), US soybean export inspections came in below market expectations at 1.4 million tons.
Weekly inspections were lower than analysts’ range of expectations, which were between 1.5 million tons and 1.8 million tons. The largest volumes were destined for China (908,152 tons), Mexico (132,443 tons), Egypt (58,088 tons), Taiwan (55,914 tons), the Republic of Korea (60,588 tons) and the United Kingdom (65,279 tons).
Weekly volumes took total inspections from the start of the 2022/23 marketing year to 28.6 million tons, down 6.8% from last year.
futures traded lower on concerns about the global economy. The risk-averse move came after the Federal Reserve signaled it would not cut short-term interest rates, fueling recession worries. Even new concerns about drought in Argentina, uncertainties about demand from China (amid rising Covid-19 cases) put downward pressure on soybeans.
But hedge funds have taken long positions on the soybean meal product, estimating that somewhere, sometime, demand will return, especially with Argentina and the persistent drought as an argument.
BRAZIL. Soybean planting in the Brazilian state of Rio Grande do Sul reached 96%, up from 94% in the same period last year. Infrequent and limited rains have hampered the ability of farmers to complete the sowing process. Farmers in this state are expected to sow 6.5 million hectares in 2022/23, an increase of 2.8% from the previous year, and harvest 20.5 million tons, 124.4% more than last year.
Crop conditions in the Brazilian state of Paraná have declined due to rare rains, according to the state’s agricultural agency, Deral. Soybean crop conditions rated as good fell to 80%, while those rated as average increased to 16%, on the same trajectory as poor, which reached 4%. Soybean production in Parana is projected at 21.4 million tons, up 74 percent from last year’s 12.3 million tons on 5.7 million hectares.
Brazil’s soybean exports fell 10.1 percent from a record 86.6 million tons in 2021 and totaled 77 million tons, according to ANEC. The decrease is the result of crop losses caused by the drought of the previous crop year, which limited the availability of the product.
December soybean exports reached 1.5 million tons, below the 1.7 million tons previously forecast and well below the 2.3 million tons shipped in December 2021. China was the main destination for Brazil’s exports and was responsible for 70% of the volume.
Harvesting usually begins in late January and deliveries begin to pick up the following month.
ARGENTINA. Insufficient rainfall continues to be a major problem in Argentina, but it has allowed soybean planting to move forward, according to the Buenos Aires Grain Exchange (BAGE). Soybean planting in Argentina reached 81.8% of the expected area of 16.7 million hectares.
New-crop soybean sales rose 47.6% over the week to 106,600 tons, coming in at the opposite pole from the 2021/22 crop, which fell 24.5% from the previous week to 551,000 of tons. This brought total sales of the 2022/23 crop to 2.6 million tons, while at the same time last year sales totaled 4.6 million tons.
CHINA. At the end of 2022, soybean processing volumes in China rose for the second consecutive week to 2.11 million tons, according to data from the National Cereals and Oil Information Center (CNGOIC).
processing volume in China has fluctuated around 2 million tons recently, on the back of higher soybean imports since the second half of November.
The pace of processing continues to outpace the pace of soybean arrivals, leading to another decline in soybean stocks at major processors, this time down 5.19% on the week to 3.84 million tons on December 26.
Processing also led to an increase in soybean meal stocks, with stocks reaching 500 million tons, a 35.14% jump from the previous week, but still down 19.35% from last year.
Physical supply of soybean meal is expected to remain ample, and stocks are expected to rise further as processing volume remains above 2 million tons.
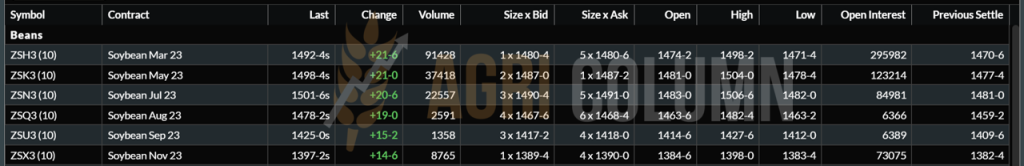
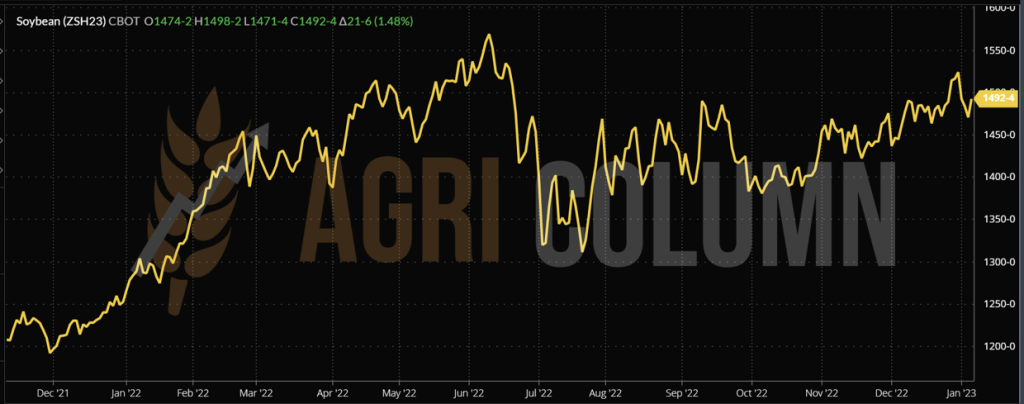
CBOT SOYA ZSH23 MAR23 – 1,492 c/ bu (+21 c/ bu = +7.7 USD)
SOY GRAPHIC TREND – ZSH23 MAR23
CAUSES AND EFFECTS
Soy is positioned in the element to watch in the next period. The problems of South America and Argentina, in particular, mean that this commodity can become a driving factor in the VegOil complex. With applicability in the biofuels industry as well as in animal husbandry. Soybean meal is the main feed item globally, and the trend shown by CBOT quotations indicates demand.


January 7-21, 2023
Romania
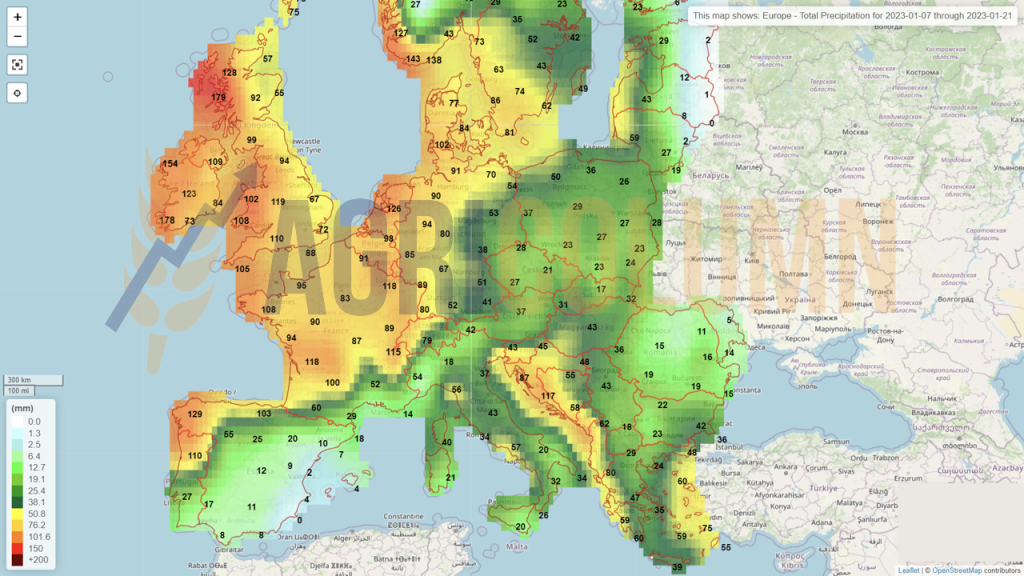
Europe
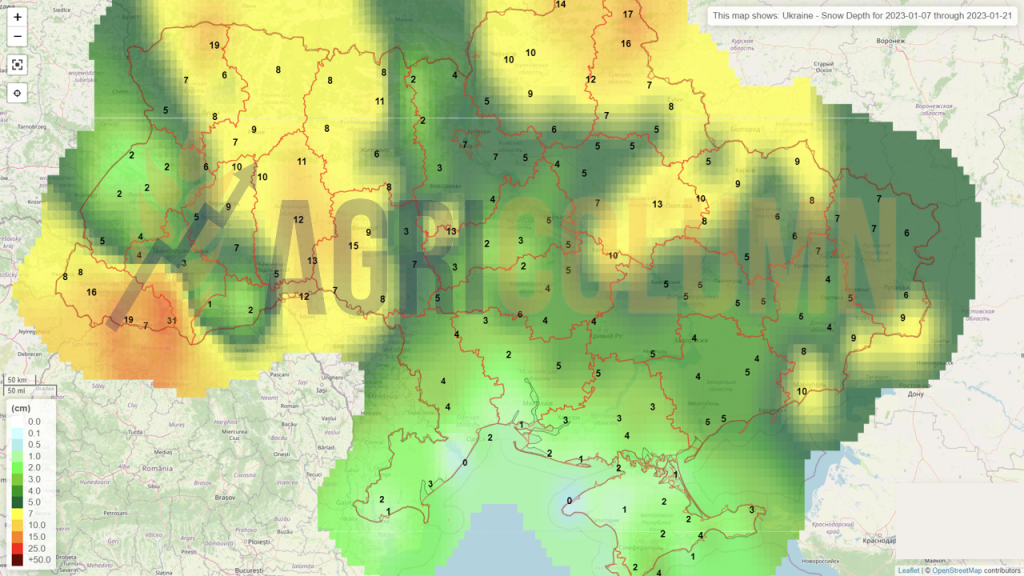
Ukraine (snow)
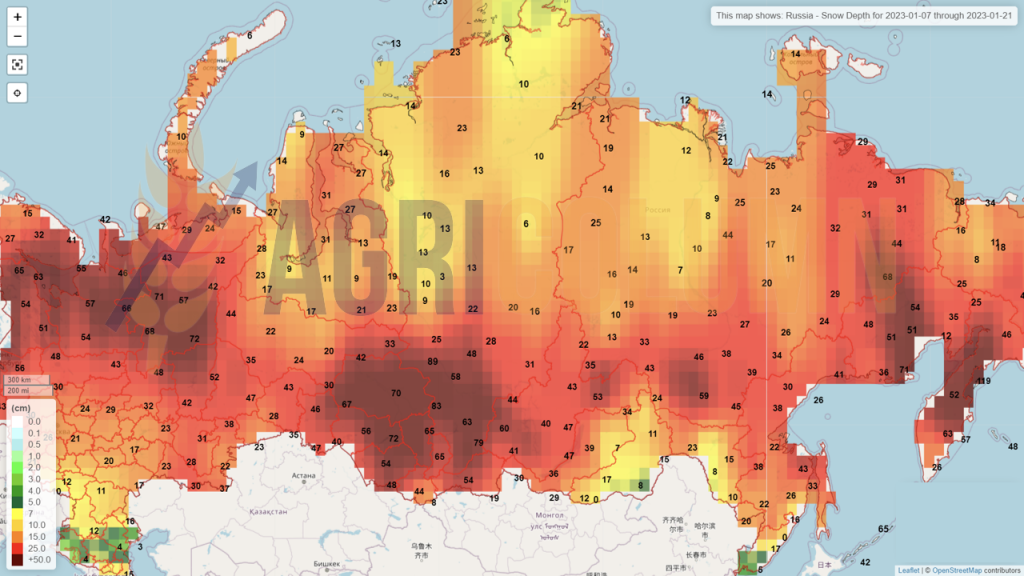
Russia (snow)
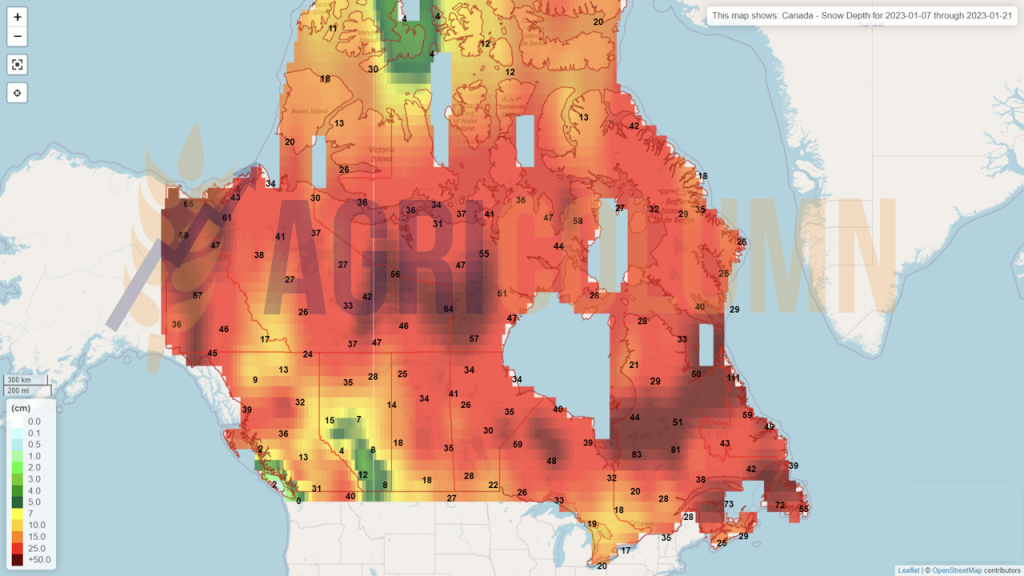
Canada (snow)
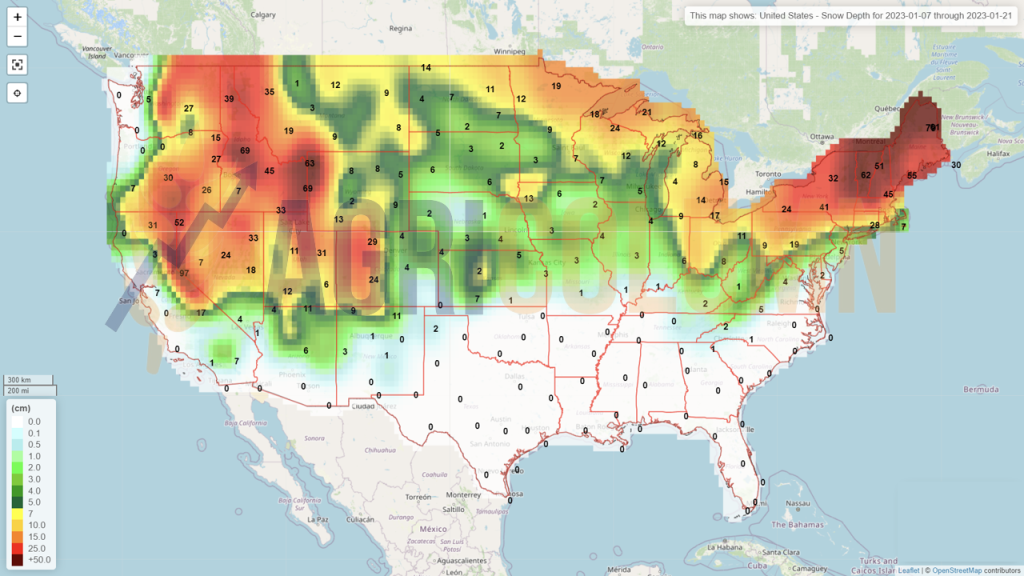
USA (snow)
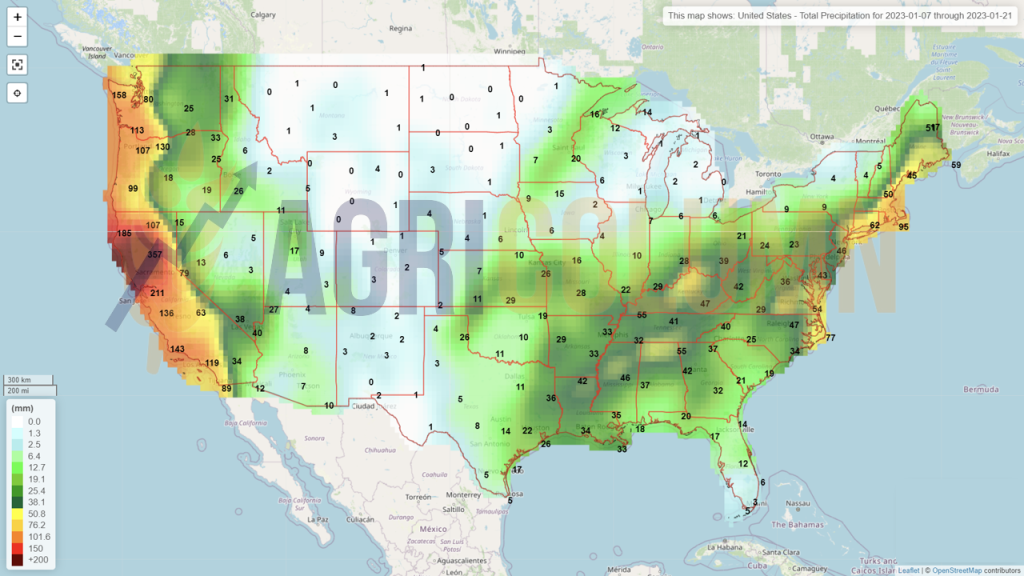
USA (rain)
Brazil
Argentina
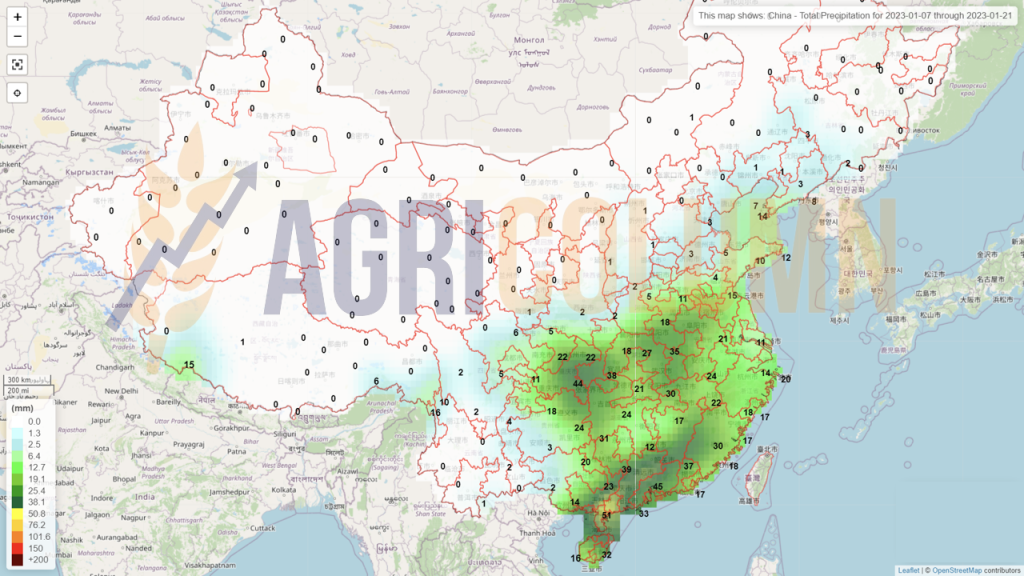
China (rain)
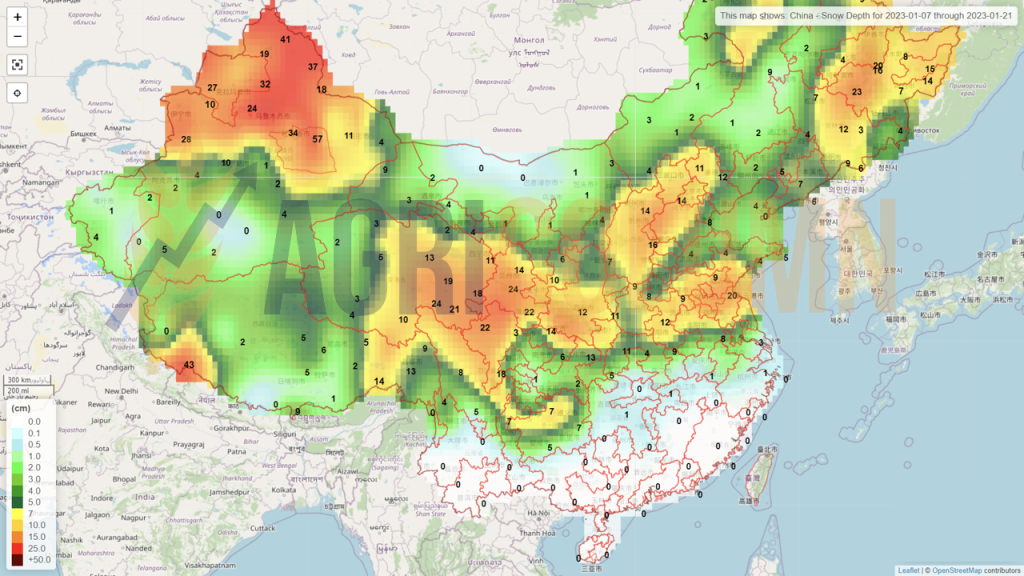
China (snow)
Australia